Exhibit 99.2
| TABLE OF CONTENTS | |||
Overview and Contact Information................................................................................................................................................... | |||
| 1 | Financial Highlights.......................................................................................................................................................................... | ||
| 2 | Quarterly Earnings Announcement and Financial Statements | ||
Consolidated Statements of Operations / Shares......................................................................................................................... | |||
Funds from Operations (FFO) Reconciliation................................................................................................................................ | |||
Balance Sheets............................................................................................................................................................................. | |||
| 3 | Multifamily | ||
Portfolio Statistics.......................................................................................................................................................................... | |||
Components of Net Operating Income (NOI)................................................................................................................................ | |||
Capitalized Expenditures............................................................................................................................................................... | |||
Same Property Comparisons........................................................................................................................................................ | |||
| 4 | Corporate Data | ||
Development Pipeline................................................................................................................................................................... | |||
Real Estate Activities..................................................................................................................................................................... | |||
Debt Summary / Market Capitalization / Coverage Ratios / Covenants........................................................................................ | |||
Supplemental Data / Investment Activities.................................................................................................................................... | |||
Joint Venture Operating Data / Balance Sheet.............................................................................................................................. | |||
| 5 | Corporate Reconciliations | ||
Revenues / Expenses / NOI.......................................................................................................................................................... | |||
NOI from Discontinued Operations / Adjusted EBITDA................................................................................................................ | |||
SEC Coverage Ratios................................................................................................................................................................... | |||
| 6 | Appendix | ||
Multifamily Property Table............................................................................................................................................................. | |||
Commercial Property Table........................................................................................................................................................... | |||
| 7 | Glossary of Terms............................................................................................................................................................................. | ||
Forward Looking Statements
"Safe Harbor" Statement under the Private Securities Litigation Reform Act of 1995: Estimates of future earnings are, by definition, and certain other statements in this press release may constitute, "forward-looking statements" within the meaning of the Private Securities Litigation Reform Act of 1995 and involve known and unknown risks, uncertainties and other factors that may cause the company's actual results, performance, achievements or transactions to be materially different from the results, performance, achievements or transactions expressed or implied by the forward looking statements. Factors that impact such forward looking statements include, among others, real estate conditions and markets, including recent deterioration in the multifamily market and the strength or duration of the current recession or recovery; increased exposure, as a multifamily focused REIT, to risks inherent in investments in a single industry; ability to obtain financing at reasonable rates, if at all; performance of affiliates or companies in which we have made investments; changes in operating costs; higher than expected construction costs; uncertainties associated with the timing and amount of real estate dispositions, including our existing inventory of condominium and for-sale residential assets; legislative or regulatory decisions; our ability to continue to maintain our status as a REIT for federal income tax purposes; price volatility, dislocations and liquidity disruptions in the financial markets and the resulting impact on availability of financing; the effect of any rating agency action on the cost and availability of new debt financings; level and volatility of interest rates or capital market conditions; effect of any terrorist activity or other heightened geopolitical crisis; or other factors affecting the real estate industry generally.
Except as otherwise required by the federal securities laws, the company assumes no liability to update the information in this supplemental package.
The Company refers you to the documents filed by the Company from time to time with the Securities and Exchange Commission, specifically the section titled "Risk Factors: in the Company's Annual Report on Form 10-K for the year ended December 31, 2012, as may be updated or supplemented in the Company's Form 10-Q filings, which discuss these and other factors that could adversely affect the Company's results.
2
Colonial Properties Trust (NYSE: CLP) is a multifamily real estate investment trust (REIT) that is engaged in the ownership, development, acquisition and management of quality real estate properties in the Sunbelt region of the United States. With a long history as both a private and a public company, the company has a proven track record in real estate operations and development.
Originally founded in 1970, and headquartered in Birmingham, Alabama, Colonial Properties Trust completed its initial public offering in September 1993. The Company, which is included in the S&P SmallCap 600 Index, is listed on the New York Stock Exchange under the symbol "CLP".
Our commitment to excellence allows us to successfully serve our residents. Our focus on quality, service, value and integrity enable us to meet our goal of managing a high quality portfolio that focuses on superior investor returns.
COLONIAL PROPERTIES STRATEGY
Achieve Consistent Long-term Performance through:
-Owning and managing a multifamily portfolio -Achieving operating excellence
-Investing in high growth Sunbelt cities -Maintaining an investment grade balance sheet
-Pursuing strategic acquisition, disposition and development opportunities
| CONTACT INFORMATION | ||||
| Headquarters | Investor Relations | Transfer Agent | ||
| Colonial Properties Trust | Jerry Brewer | Computershare | ||
| 2101 Sixth Avenue North, | Executive Vice President, Finance | P.O. Box 43010 | ||
| Suite 750 | 800-645-3917 | Providence, RI 02940-3010 | ||
| Birmingham, Alabama 35203 | 704-552-8538 - fax | Investor Relations: 800-730-6001 | ||
| 205-250-8700 | www.computershare.com | |||
| 205-250-8890 - fax | To receive an Investor Package, please contact: | |||
| 800-645-3917 | ||||
| www.colonialprop.com | 704-643-7970 | |||
| EQUITY RESEARCH COVERAGE | |||||
| Barclays | Ross Smotrich | 212-526-2306 | |||
| BMO Capital Markets | Rich Anderson | 212-885-4180 | |||
| BoA/Merrill Lynch | Jana Galan | 646-855-3081 | |||
| Citigroup | Michael Bilerman / Nicholas Joseph | 212-816-1383 / 212-816-1909 | |||
| DISCERN, Inc. | David Wigginton | 646-863-4177 | |||
| Green Street Advisors | Andy McCulloch | 949-640-8780 | |||
| Sandler O'neill & Partners | Alex Goldfarb | 212-466-7937 | |||
| UBS | Ross Nussbaum | 212-713-2484 | |||
| Wells Fargo Securities, LLC | Jeff Donnelly | 617-603-4262 | |||
| GUIDANCE | ||||||||
| FYE 2013 Range | ||||||||
| Diluted Income per Share | $ | 0.29 | $ | 0.45 | ||||
| Plus: Real Estate Depreciation & Amortization | 1.35 | 1.35 | ||||||
| Less: Gain on Sale of Operating Properties | (0.30 | ) | (0.40 | ) | ||||
Total Diluted Funds from Operation ("FFO") per Share | $ | 1.34 | $ | 1.40 | ||||
3
| COLONIAL PROPERTIES TRUST | |||||||||
| Financial Highlights | |||||||||
| First Quarter 2013 | |||||||||
| FINANCIAL HIGHLIGHTS | |||||||||
| ($ in 000s, except per share and unit data) | Three Months Ended | ||||||||
| 3/31/2013 | 3/31/2012 | ||||||||
Total property revenue (1) | $ | 103,708 | $ | 92,653 | |||||
Multifamily property revenue (2) | 95,764 | 87,831 | |||||||
Multifamily property NOI (2) | 58,338 | 52,899 | |||||||
| Management & leasing fee revenue | 178 | 1,344 | |||||||
Adjusted EBITDA (3) | 57,719 | 58,302 | |||||||
| Net (loss) income per share: | |||||||||
| Basic | 0.06 | (0.07 | ) | ||||||
| Diluted | 0.06 | (0.07 | ) | ||||||
| Funds from operations per share: | |||||||||
| Basic | 0.34 | 0.30 | |||||||
| Diluted | 0.34 | 0.30 | |||||||
| Dividends per share | 0.21 | 0.18 | |||||||
| Dividends/EPS (diluted) payout ratio | 350.0 | % | (257.1 | )% | |||||
| Dividends/FFO (diluted) payout ratio | 61.8 | % | 60.0 | % | |||||
Consolidated interest expense (1) | $ | 22,195 | $ | 23,053 | |||||
Consolidated interest income (1) | (764 | ) | (1,031 | ) | |||||
Net interest expense (1) | 21,431 | 22,022 | |||||||
| Pro-rata share of joint venture interest expense | 248 | 2,290 | |||||||
| Principal reductions | 811 | 572 | |||||||
Interest coverage ratio (4) | 2.6 | 2.3 | |||||||
Fixed charge coverage ratio (4) | 2.5 | 2.2 | |||||||
Fixed charge with capitalized interest ratio (4) | 2.5 | 2.2 | |||||||
Multifamily same property NOI increase (5) | 6.8 | % | 8.3 | % | |||||
| (# of apartment homes included) | 31,436 | 30,323 | |||||||
| As of | |||||||||
| 3/31/2013 | 12/31/2012 | ||||||||
| Total assets | $ | 3,193,092 | $ | 3,286,208 | |||||
| Total debt | 1,758,780 | 1,831,992 | |||||||
| Common shares and units, outstanding end of period | 95,672 | 95,365 | |||||||
| Share price, end of period | 22.61 | 21.37 | |||||||
| Book equity value, end of period | 1,302,984 | 1,312,059 | |||||||
Market equity value, end of period (6) | 2,163,134 | 2,037,959 | |||||||
Debt to total market capitalization ratio (7) | 44.8 | % | 47.3 | % | |||||
Unencumbered real estate assets (at cost) to unsecured debt ratio (7) | 262.8 | % | 247.5 | % | |||||
| (1) Represents consolidated properties excluding amounts classified in discontinued operations. For the GAAP reconciliation of revenues, expenses and NOI, see | |||||||||
| page 20 and 21. | |||||||||
| (2) For components of revenues and NOI, see page 10. | |||||||||
| (3) For a reconciliation of Adjusted EBITDA, see page 22. | |||||||||
| (4) For additional information on these calculations, see page 17. | |||||||||
| (5) Multifamily same property communities are communities which were owned by the Company and stabilized as of January 1, 2012, as adjusted for dispositions | |||||||||
| during the year. | |||||||||
| (6) Includes common shares and units. | |||||||||
| (7) Excludes the Company's pro-rata share of partially-owned unconsolidated debt. | |||||||||
4
| COLONIAL PROPERTIES TRUST | |||||||
| Financial Statements | |||||||
| First Quarter 2013 | |||||||
| CONSOLIDATED STATEMENTS OF OPERATIONS | |||||||
| ($ in 000s, except per share data) | Three Months Ended | ||||||
| 3/31/2013 | 3/31/2012 | ||||||
| Revenues | |||||||
| Minimum Rent | $ | 84,843 | $ | 77,240 | |||
| Tenant Recoveries | 2,495 | 2,566 | |||||
| Other Property Related Revenue | 16,370 | 12,847 | |||||
| Other Non-Property Related Revenue | 178 | 1,344 | |||||
| Total Revenues | 103,886 | 93,997 | |||||
| Operating Expenses | |||||||
| Operating Expenses: | |||||||
| Property Operating Expense | 27,340 | 25,271 | |||||
| Taxes, Licenses and Insurance | 13,031 | 10,875 | |||||
| Total Property Operating Expenses | 40,371 | 36,146 | |||||
| Property Management Expense | 4,416 | 2,846 | |||||
| General and Administrative Expense | 4,787 | 5,767 | |||||
| Management Fees and Other Expenses | 250 | 2,045 | |||||
Investment and Development Expenses (1) | 400 | 387 | |||||
| Depreciation | 31,626 | 29,551 | |||||
| Amortization | 1,775 | 1,872 | |||||
| Impairment and Other Losses | 90 | 500 | |||||
| Total Operating Expenses | 83,715 | 79,114 | |||||
| Income from Operations | 20,171 | 14,883 | |||||
| Other Income (Expense) | |||||||
| Interest Expense | (22,195 | ) | (23,053 | ) | |||
| Debt Cost Amortization | (1,377 | ) | (1,433 | ) | |||
| Interest Income | 761 | 1,028 | |||||
| Income from Partially-Owned Investments | 670 | 673 | |||||
| Gain (Loss) on Sale of Property | 10 | (227 | ) | ||||
| Taxes and Other | (188 | ) | (188 | ) | |||
| Total Other Income (Expense) | (22,319 | ) | (23,200 | ) | |||
| Loss from Continuing Operations | (2,148 | ) | (8,317 | ) | |||
| Discontinued Operations | |||||||
| Income from Discontinued Operations | 1,115 | 1,866 | |||||
| Gain (Loss) on Disposal of Discontinued Operations | 7,184 | (2 | ) | ||||
| Net Income from Discontinued Operations | 8,299 | 1,864 | |||||
| Net Income (Loss) | 6,151 | (6,453 | ) | ||||
| Noncontrolling Interest | |||||||
| Continuing Operations | |||||||
| Noncontrolling Interest of Limited Partners | (123 | ) | (9 | ) | |||
| Noncontrolling Interest in CRLP - Common | 169 | 630 | |||||
| Discontinued Operations | |||||||
| Noncontrolling Interest in CRLP - Common | (621 | ) | (142 | ) | |||
| (Income) Loss Attributable to Noncontrolling Interest | (575 | ) | 479 | ||||
| Net Income (Loss) Available to Common Shareholders | $ | 5,576 | $ | (5,974 | ) | ||
| _______________________ | |||||||
| Continued on following page | |||||||
5
| COLONIAL PROPERTIES TRUST | |||||||
| Financial Statements | |||||||
| First Quarter 2013 | |||||||
| CONSOLIDATED STATEMENTS OF OPERATIONS (continued) | |||||||
| Three Months Ended | |||||||
| 3/31/2013 | 3/31/2012 | ||||||
| Income (Loss) per Share - Basic | |||||||
| Continuing Operations | $ | (0.03 | ) | $ | (0.09 | ) | |
| Discontinued Operations | 0.09 | 0.02 | |||||
| EPS - Basic | $ | 0.06 | $ | (0.07 | ) | ||
| Income (Loss) per Share - Diluted | |||||||
| Continuing Operations | $ | (0.03 | ) | $ | (0.09 | ) | |
| Discontinued Operations | 0.09 | 0.02 | |||||
| EPS - Diluted | $ | 0.06 | $ | (0.07 | ) | ||
| (1) Reflects costs incurred related to acquisitions and abandoned pursuits. These costs are volatile and therefore may vary between periods. | |||||||
| SHARES AND UNITS OUTSTANDING, WEIGHTED | |||||||
| (shares and units in 000s) | Three Months Ended | ||||||
| 3/31/2013 | 3/31/2012 | ||||||
| Basic | |||||||
| Shares | 87,791 | 87,012 | |||||
| Operating Partnership Units (OP Units) | 7,153 | 7,169 | |||||
| Total Shares & OP Units | 94,944 | 94,181 | |||||
| Dilutive Common Share Equivalents | — | — | |||||
Diluted (1) | |||||||
| Shares | 87,791 | 87,012 | |||||
| Total Shares & OP Units | 94,944 | 94,181 | |||||
| (1) For periods where the Company reported a net loss from continuing operations (after preferred dividends), the effect of dilutive shares has been excluded from | |||||||
| per share computations as including such shares would be anti-dilutive. | |||||||
6
| COLONIAL PROPERTIES TRUST | |||||||
| Financial Statements | |||||||
| First Quarter 2013 | |||||||
| FUNDS FROM OPERATIONS (FFO) RECONCILIATION | |||||||
| ($ in 000s, except per share data) | Three Months Ended | ||||||
| 3/31/2013 | 3/31/2012 | ||||||
| Net Income (Loss) Available to Common Shareholders | $ | 5,576 | $ | (5,974 | ) | ||
| Noncontrolling Interest in CRLP (Operating Partnership Unitholders) | 452 | (488 | ) | ||||
| Total | 6,028 | (6,462 | ) | ||||
| Adjustments - Consolidated Properties | |||||||
| Depreciation - Real Estate | 31,597 | 31,961 | |||||
| Amortization - Real Estate | 1,817 | 2,118 | |||||
| Remove: (Gain) Loss on Sale of Property, net of Income Tax and Noncontrolling Interest | (7,194 | ) | 229 | ||||
| Include: Gain (Loss) on Sale of Undepreciated Property, net of Income Tax and Noncontrolling Interest | 7 | (261 | ) | ||||
| Total Adjustments - Consolidated | 26,227 | 34,047 | |||||
| Adjustments - Unconsolidated Properties | |||||||
| Depreciation - Real Estate | 95 | 1,117 | |||||
| Amortization - Real Estate | 2 | 367 | |||||
| Remove: Gain on Sale of Property | (344 | ) | (803 | ) | |||
| Total Adjustments - Unconsolidated | (247 | ) | 681 | ||||
| Funds from Operations | $ | 32,008 | $ | 28,266 | |||
| Income Allocated to Participating Securities | (197 | ) | (219 | ) | |||
| Funds from Operations Available to Common Shareholders and Unitholders | $ | 31,811 | $ | 28,047 | |||
| FFO per Share | |||||||
| Basic | $ | 0.34 | $ | 0.30 | |||
| Diluted | $ | 0.34 | $ | 0.30 | |||
| FFO, as defined by the National Association of Real Estate Investment Trusts (NAREIT), means income (loss) before noncontrolling interest (determined in | |||||||
| accordance with GAAP), excluding gains (losses) from sales of depreciated property and impairment write-downs of depreciable real estate, plus real estate | |||||||
| depreciation and amortization and after adjustments for unconsolidated partnerships and joint ventures. FFO is presented to assist investors in analyzing the | |||||||
| Company's performance. The Company believes that FFO is useful to investors because it provides an additional indicator of the Company's financial | |||||||
| and operating performance. This is because, by excluding the effect of real estate depreciation and amortization, gains (or losses) from sales of properties and | |||||||
| impairment write-downs of depreciable real estate (all of which are based on historical costs which may be of limited relevance in evaluating current performance), | |||||||
| FFO can facilitate comparison of operating performance among equity REITs. FFO is a widely recognized measure in the Company's industry. | |||||||
| The Company's method of calculating FFO may be different from methods used by other REITs and, accordingly, may not be comparable to such other REITs. | |||||||
| FFO should not be considered (1) as an alternative to net income (determined in accordance with GAAP), (2) as an indicator of financial performance, (3) as | |||||||
| cash flow from operating activities (determined in accordance with GAAP) or (4) as a measure of liquidity nor is it indicative of sufficient cash flow to fund all of | |||||||
| our needs, including our ability to make distributions. | |||||||
7
| COLONIAL PROPERTIES TRUST | |||||||
| Financial Statements | |||||||
| First Quarter 2013 | |||||||
| BALANCE SHEET | |||||||
| ($ in 000s) | As of | As of | |||||
| 3/31/2013 | 12/31/2012 | ||||||
| ASSETS | |||||||
| Real Estate Assets | |||||||
| Operating Properties | $ | 3,563,090 | $ | 3,489,324 | |||
| Undeveloped Land & Construction in Progress | 268,910 | 296,153 | |||||
| Total Real Estate, before Depreciation | 3,832,000 | 3,785,477 | |||||
| Less: Accumulated Depreciation | (832,881 | ) | (804,964 | ) | |||
| Real Estate Assets Held for Sale, net | 35,498 | 93,450 | |||||
| Net Real Estate Assets | 3,034,617 | 3,073,963 | |||||
| Cash and Equivalents | 8,661 | 11,674 | |||||
| Restricted Cash | 8,892 | 38,128 | |||||
| Accounts Receivable, net | 23,449 | 23,977 | |||||
| Notes Receivable | 42,107 | 42,399 | |||||
| Prepaid Expenses | 13,448 | 19,460 | |||||
| Deferred Debt and Lease Costs | 20,521 | 23,938 | |||||
| Investment in Unconsolidated Subsidiaries | 7,702 | 7,777 | |||||
| Other Assets | 33,695 | 44,892 | |||||
| Total Assets | $ | 3,193,092 | $ | 3,286,208 | |||
| LIABILITIES | |||||||
| Unsecured Credit Facility | $ | 116,173 | $ | 188,631 | |||
| Notes and Mortgages Payable | 1,642,607 | 1,643,361 | |||||
| Total Debt | 1,758,780 | 1,831,992 | |||||
| Accounts Payable | 34,959 | 53,545 | |||||
| Accrued Interest | 16,161 | 10,209 | |||||
| Accrued Expenses | 47,143 | 41,652 | |||||
| Other Liabilities | 33,065 | 36,751 | |||||
| Total Liabilities | 1,890,108 | 1,974,149 | |||||
| Redeemable Common Units | 169,894 | 162,056 | |||||
| EQUITY | |||||||
| Limited Partner's Noncontrolling Interest | 104 | 695 | |||||
| Cumulative Earnings | 1,281,694 | 1,276,118 | |||||
| Cumulative Distributions | (1,944,721 | ) | (1,926,167 | ) | |||
| Common Equity, including Additional Paid-in Capital | 1,969,338 | 1,974,532 | |||||
| Treasury Shares, at Cost | (150,163 | ) | (150,163 | ) | |||
| Accumulated Other Comprehensive Loss | (23,162 | ) | (25,012 | ) | |||
| Total Equity, including Noncontrolling Interest | 1,133,090 | 1,150,003 | |||||
| Total Liabilities and Equity | $ | 3,193,092 | $ | 3,286,208 | |||
| SHARES & UNITS OUTSTANDING, END OF PERIOD | |||||
| (shares and units in 000s) | As of | As of | |||
| 3/31/2013 | 12/31/2012 | ||||
| Basic | |||||
| Shares | 88,520 | 88,212 | |||
| Operating Partnership Units (OP Units) | 7,152 | 7,153 | |||
| Total Shares & OP Units | 95,672 | 95,365 | |||
8
| COLONIAL PROPERTIES TRUST | ||||||||||||||||||||
| Multifamily Portfolio Statistics | ||||||||||||||||||||
| First Quarter 2013 | ||||||||||||||||||||
| COMMUNITY PORTFOLIO AT MARCH 31, 2013 (In apartment homes) | ||||||||||||||||||||
| Same | Non Same | Wholly | Joint | Stabilized | In | Total | Current | |||||||||||||
| Property | Property | Owned | Venture (1) | Operating | Lease-Up | Operating | Developments | Total | ||||||||||||
| Atlanta | 2,598 | — | 2,598 | 72 | 2,670 | — | 2,670 | — | 2,670 | |||||||||||
| Austin | 3,015 | 272 | 3,287 | — | 3,287 | 296 | 3,583 | — | 3,583 | |||||||||||
| Birmingham | 1,608 | — | 1,608 | — | 1,608 | — | 1,608 | — | 1,608 | |||||||||||
| Charleston | 1,890 | — | 1,890 | — | 1,890 | — | 1,890 | — | 1,890 | |||||||||||
| Charlotte | 4,290 | 85 | 4,375 | — | 4,375 | — | 4,375 | 434 | 4,809 | |||||||||||
| Dallas | 1,954 | 874 | 2,828 | — | 2,828 | — | 2,828 | — | 2,828 | |||||||||||
| Fort Worth | 2,012 | — | 2,012 | 29 | 2,041 | — | 2,041 | — | 2,041 | |||||||||||
| Orlando | 1,756 | 512 | 2,268 | — | 2,268 | 108 | 2,376 | 594 | 2,970 | |||||||||||
| Phoenix | 952 | — | 952 | — | 952 | — | 952 | — | 952 | |||||||||||
| Raleigh | 2,744 | 370 | 3,114 | — | 3,114 | — | 3,114 | — | 3,114 | |||||||||||
| Richmond | 1,700 | — | 1,700 | — | 1,700 | — | 1,700 | — | 1,700 | |||||||||||
| Savannah | 1,437 | — | 1,437 | — | 1,437 | — | 1,437 | — | 1,437 | |||||||||||
| Tampa/Sarasota | 606 | 486 | 1,092 | 1,092 | — | 1,092 | — | 1,092 | ||||||||||||
| Other | 4,874 | 96 | 4,970 | — | 4,970 | — | 4,970 | — | 4,970 | |||||||||||
| Total Portfolio | 31,436 | 2,695 | 34,131 | 101 | 34,232 | 404 | 34,636 | 1,028 | 35,664 | |||||||||||
FIRST QUARTER NOI CONTRIBUTION PERCENTAGE BY REGION (2) | PHYSICAL OCCUPANCY (3) | |||||||||||||||||||
| Total NOI | ||||||||||||||||||||
| Same Property | Incl. JV's at | Mar 31 | Dec 31 | Sep 30 | Jun 30 | Mar 31 | ||||||||||||||
| Communities | Pro Rata % (4) | 2013 | 2012 | 2012 | 2012 | 2012 | ||||||||||||||
| Atlanta | 8.4 | % | 7.9 | % | 95.9% | 97.1% | 96.9% | 95.5% | 96.5% | |||||||||||
| Austin | 8.9 | % | 8.8 | % | 95.9% | 95.3% | 96.1% | 96.7% | 96.5% | |||||||||||
| Birmingham | 4.7 | % | 4.3 | % | 96.0% | 94.2% | 96.7% | 96.7% | 96.5% | |||||||||||
| Charleston | 6.0 | % | 5.5 | % | 96.3% | 95.8% | 96.1% | 95.3% | 96.9% | |||||||||||
| Charlotte | 13.8 | % | 13.1 | % | 96.4% | 97.1% | 97.9% | 96.5% | 95.8% | |||||||||||
| Dallas | 6.1 | % | 8.4 | % | 95.9% | 95.0% | 97.0% | 96.2% | 94.5% | |||||||||||
| Fort Worth | 5.5 | % | 5.1 | % | 96.6% | 96.7% | 97.0% | 96.0% | 95.8% | |||||||||||
| Orlando | 6.8 | % | 7.3 | % | 95.0% | 94.5% | 95.8% | 95.8% | 95.3% | |||||||||||
| Phoenix | 3.4 | % | 3.1 | % | 96.4% | 95.6% | 98.2% | 96.6% | 95.8% | |||||||||||
| Raleigh | 9.6 | % | 9.9 | % | 96.0% | 96.0% | 96.4% | 95.7% | 96.2% | |||||||||||
| Richmond | 5.3 | % | 4.9 | % | 94.9% | 95.1% | 96.6% | 94.0% | 96.0% | |||||||||||
| Savannah | 5.0 | % | 4.5 | % | 96.7% | 96.2% | 97.5% | 94.8% | 98.2% | |||||||||||
| Tampa/Sarasota | 2.6 | % | 4.0 | % | 97.5% | 96.9% | 96.0% | 98.0% | 97.9% | |||||||||||
| Other | 13.9 | % | 13.2 | % | 95.6% | 94.9% | 96.1% | 96.2% | 95.7% | |||||||||||
Total Portfolio (5) | 100.0 | % | 100.0 | % | 96.0% | 95.8% | 96.7% | 96.0% | 96.1% | |||||||||||
Same Property (6) | 96.1% | 95.8% | 96.8% | 95.9% | 96.1% | |||||||||||||||
| (1) Joint venture units shown represents the Company's pro-rata share of total units. There are 646 total units at the Company's partially-owned apartment | ||||||||||||||||||||
| communities. | ||||||||||||||||||||
| (2) For the GAAP reconciliation of revenues, expenses and NOI, see page 20 and 21. | ||||||||||||||||||||
| (3) Occupancy figures include apartment homes held through joint venture investments but exclude communities in lease-up or under development. For a | ||||||||||||||||||||
| detailed occupancy listing by property, see the Multifamily Property Table on page 24. | ||||||||||||||||||||
| (4) Based on total NOI from wholly-owned operating communities and the Company's pro-rata share of total NOI from joint venture communities. | ||||||||||||||||||||
| (5) Total portfolio occupancy includes wholly-owned operating communities and joint venture communities. | ||||||||||||||||||||
| (6) Same property communities are communities which were owned by the Company and stabilized as of January 1, 2012, as adjusted for dispositions during | ||||||||||||||||||||
| the year. | ||||||||||||||||||||
9
| COLONIAL PROPERTIES TRUST | |||||||||||||||
| Components of Property Net Operating Income and Capitalized Expenditures for Multifamily Portfolio | |||||||||||||||
| First Quarter 2013 | |||||||||||||||
| ($ in 000s, except property data and per unit amounts) | |||||||||||||||
COMPONENTS OF PROPERTY NET OPERATING INCOME (1) | |||||||||||||||
| Apartment | Three Months Ended | ||||||||||||||
| Homes | 3/31/2013 | 3/31/2012 | Change | ||||||||||||
| Property Revenue | |||||||||||||||
Same Property Communities (2) | 31,436 | $ | 86,613 | $ | 82,293 | $ | 4,320 | ||||||||
| Non-Same Property Communities | 2,695 | 8,160 | 1,957 | 6,203 | |||||||||||
Joint Venture Communities (3) | 101 | 290 | 276 | 14 | |||||||||||
| Lease up / Development Communities | 1,432 | 687 | — | 687 | |||||||||||
| Dispositions / Other | — | 14 | 3,305 | (3,291 | ) | ||||||||||
| Total Property Revenue | 35,664 | $ | 95,764 | $ | 87,831 | $ | 7,933 | ||||||||
| Property Expenses | |||||||||||||||
Same Property Communities (2) | 31,436 | $ | 33,220 | $ | 32,306 | $ | 914 | ||||||||
| Non-Same Property Communities | 2,695 | 3,380 | 983 | 2,397 | |||||||||||
Joint Venture Communities (3) | 101 | 125 | 125 | — | |||||||||||
| Lease up / Development Communities | 1,432 | 701 | 17 | 684 | |||||||||||
| Dispositions / Other | — | — | 1,501 | (1,501 | ) | ||||||||||
| Total Property Expenses | 35,664 | $ | 37,426 | $ | 34,932 | $ | 2,494 | ||||||||
| Property Net Operating Income | |||||||||||||||
Same Property Communities (2) | 31,436 | $ | 53,393 | $ | 49,987 | $ | 3,406 | ||||||||
| Non-Same Property Communities | 2,695 | 4,780 | 974 | 3,806 | |||||||||||
Joint Venture Communities (3) | 101 | 165 | 151 | 14 | |||||||||||
| Lease up / Development Communities | 1,432 | (14 | ) | (17 | ) | 3 | |||||||||
| Dispositions / Other | — | 14 | 1,804 | (1,790 | ) | ||||||||||
| Total Property Net Operating Income | 35,664 | $ | 58,338 | $ | 52,899 | $ | 5,439 | ||||||||
| CAPITALIZED EXPENDITURES | |||||||||||||||
| Apartment | Three Months Ended | ||||||||||||||
| Homes | 3/31/2013 | 3/31/2012 | Change | ||||||||||||
| Capitalized Expenses | |||||||||||||||
Same Property Communities (2) | 31,436 | $ | 4,792 | $ | 2,676 | $ | 2,116 | ||||||||
| Non-Same Property Communities | 2,695 | 281 | 106 | 175 | |||||||||||
Joint Venture Communities (3) | 101 | 10 | 5 | 5 | |||||||||||
| Dispositions / Other | — | 199 | 300 | (101 | ) | ||||||||||
| Total Property Capitalized Expenses | 34,232 | $ | 5,282 | $ | 3,087 | $ | 2,195 | ||||||||
| Capitalized Expenses per Unit | |||||||||||||||
Same Property Communities (2) | 31,436 | $ | 152 | $ | 85 | $ | 67 | ||||||||
| Non-Same Property Communities | 2,695 | 104 | 39 | 65 | |||||||||||
Joint Venture Communities (3) | 101 | 99 | 50 | 50 | |||||||||||
| Total Per Unit | 34,232 | $ | 154 | $ | 90 | $ | 64 | ||||||||
| (1) For the GAAP reconciliation of revenues, expenses and NOI, see page 20 and 21. | |||||||||||||||
| (2) The 2012 same property data reflects results of the 2013 same property portfolio. | |||||||||||||||
| (3) Includes the Company's pro-rata share of apartment homes, revenues, expenses and NOI from partially-owned unconsolidated communities. | |||||||||||||||
10
| COLONIAL PROPERTIES TRUST | ||||||||||||||||||||||||||||||||
| Multifamily Same Property Quarter Comparisons | ||||||||||||||||||||||||||||||||
| First Quarter 2013 | ||||||||||||||||||||||||||||||||
| ($ in 000s, except property data amounts) | ||||||||||||||||||||||||||||||||
SAME PROPERTY REVENUES, EXPENSES & NOI FOR THE THREE MONTHS ENDED MARCH 31, 2013 (1) | ||||||||||||||||||||||||||||||||
| Revenues | Expenses | NOI | ||||||||||||||||||||||||||||||
| 1Q13 | 1Q12 | % Chg | 1Q13 | 1Q12 | % Chg | 1Q13 | 1Q12 | % Chg | ||||||||||||||||||||||||
| Atlanta | $ | 7,564 | $ | 7,198 | 5.1 | % | $ | 3,098 | $ | 3,024 | 2.4 | % | $ | 4,466 | $ | 4,174 | 7.0 | % | ||||||||||||||
| Austin | 8,616 | 8,237 | 4.6 | % | 3,891 | 3,515 | 10.7 | % | 4,725 | 4,722 | 0.1 | % | ||||||||||||||||||||
| Birmingham | 4,098 | 3,953 | 3.7 | % | 1,584 | 1,568 | 1.0 | % | 2,514 | 2,385 | 5.4 | % | ||||||||||||||||||||
| Charleston | 5,128 | 4,915 | 4.3 | % | 1,934 | 1,885 | 2.6 | % | 3,194 | 3,031 | 5.4 | % | ||||||||||||||||||||
| Charlotte | 11,313 | 10,481 | 7.9 | % | 3,930 | 3,997 | (1.7 | )% | 7,383 | 6,484 | 13.9 | % | ||||||||||||||||||||
| Dallas | 5,607 | 5,182 | 8.2 | % | 2,376 | 2,335 | 1.8 | % | 3,231 | 2,846 | 13.5 | % | ||||||||||||||||||||
| Fort Worth | 5,388 | 5,025 | 7.2 | % | 2,471 | 2,349 | 5.2 | % | 2,917 | 2,676 | 9.0 | % | ||||||||||||||||||||
| Orlando | 5,677 | 5,428 | 4.6 | % | 2,055 | 2,037 | 0.9 | % | 3,623 | 3,392 | 6.8 | % | ||||||||||||||||||||
| Phoenix | 2,711 | 2,652 | 2.2 | % | 905 | 877 | 3.2 | % | 1,807 | 1,775 | 1.8 | % | ||||||||||||||||||||
| Raleigh | 7,700 | 7,117 | 8.2 | % | 2,569 | 2,466 | 4.2 | % | 5,130 | 4,651 | 10.3 | % | ||||||||||||||||||||
| Richmond | 4,508 | 4,373 | 3.1 | % | 1,664 | 1,620 | 2.7 | % | 2,844 | 2,752 | 3.3 | % | ||||||||||||||||||||
| Savannah | 4,131 | 4,054 | 1.9 | % | 1,483 | 1,446 | 2.6 | % | 2,647 | 2,608 | 1.5 | % | ||||||||||||||||||||
| Tampa/Sarasota | 2,093 | 2,010 | 4.1 | % | 712 | 707 | 0.7 | % | 1,381 | 1,303 | 6.0 | % | ||||||||||||||||||||
| Other | 12,079 | 11,668 | 3.5 | % | 4,548 | 4,480 | 1.5 | % | 7,531 | 7,188 | 4.8 | % | ||||||||||||||||||||
Total Same Property (2) | $ | 86,613 | $ | 82,293 | 5.2 | % | $ | 33,220 | $ | 32,306 | 2.8 | % | $ | 53,393 | $ | 49,987 | 6.8 | % | ||||||||||||||
Financial Occupancy (3) | Revenue per Unit (4) | Rent per Unit (5) | ||||||||||||||||||||||||||||||
| 1Q13 | 1Q12 | % Chg | 1Q13 | 1Q12 | % Chg | 1Q13 | 1Q12 | % Chg | ||||||||||||||||||||||||
| Atlanta | 96.4 | % | 95.0 | % | 1.4 | % | $ | 1,007 | $ | 972 | 3.6 | % | $ | 826 | $ | 792 | 4.3 | % | ||||||||||||||
| Austin | 94.8 | % | 95.7 | % | (0.9 | )% | 1,005 | 951 | 5.7 | % | 857 | 808 | 6.1 | % | ||||||||||||||||||
| Birmingham | 95.4 | % | 95.4 | % | — | % | 890 | 859 | 3.6 | % | 758 | 731 | 3.7 | % | ||||||||||||||||||
| Charleston | 95.4 | % | 96.5 | % | (1.1 | )% | 948 | 898 | 5.6 | % | 798 | 762 | 4.7 | % | ||||||||||||||||||
| Charlotte | 96.6 | % | 95.4 | % | 1.2 | % | 910 | 854 | 6.6 | % | 773 | 722 | 7.1 | % | ||||||||||||||||||
| Dallas | 94.4 | % | 94.0 | % | 0.4 | % | 1,014 | 941 | 7.8 | % | 852 | 804 | 6.0 | % | ||||||||||||||||||
| Fort Worth | 96.4 | % | 93.0 | % | 3.4 | % | 926 | 895 | 3.5 | % | 745 | 733 | 1.6 | % | ||||||||||||||||||
| Orlando | 95.2 | % | 94.5 | % | 0.7 | % | 1,132 | 1,090 | 3.9 | % | 961 | 934 | 2.9 | % | ||||||||||||||||||
| Phoenix | 95.2 | % | 96.2 | % | (1.0 | )% | 997 | 966 | 3.2 | % | 847 | 823 | 2.9 | % | ||||||||||||||||||
| Raleigh | 96.3 | % | 95.6 | % | 0.7 | % | 971 | 905 | 7.3 | % | 840 | 792 | 6.1 | % | ||||||||||||||||||
| Richmond | 94.9 | % | 95.0 | % | (0.1 | )% | 932 | 903 | 3.2 | % | 769 | 746 | 3.1 | % | ||||||||||||||||||
| Savannah | 97.1 | % | 97.2 | % | (0.1 | )% | 986 | 967 | 2.0 | % | 826 | 816 | 1.2 | % | ||||||||||||||||||
| Tampa/Sarasota | 98.0 | % | 96.7 | % | 1.3 | % | 1,174 | 1,143 | 2.7 | % | 983 | 966 | 1.8 | % | ||||||||||||||||||
| Other | 95.1 | % | 94.8 | % | 0.3 | % | 869 | 842 | 3.2 | % | 731 | 714 | 2.4 | % | ||||||||||||||||||
Total Same Property (2) | 95.7 | % | 95.2 | % | 0.5 | % | $ | 959 | $ | 917 | 4.6 | % | $ | 808 | $ | 775 | 4.3 | % | ||||||||||||||
| (1) For the GAAP reconciliation of revenues, expenses and NOI, see page 20 and 21. | ||||||||||||||||||||||||||||||||
| (2) Same property communities are communities which were owned by the Company and stabilized as of January 1, 2012, as adjusted for dispositions during | ||||||||||||||||||||||||||||||||
| the year. The 2012 same property data reflects results of the 2013 same property portfolio. | ||||||||||||||||||||||||||||||||
| (3) The Company defines Financial Occupancy as market rent less vacancy loss as a percentage of market rent. | ||||||||||||||||||||||||||||||||
| (4) Revenue per Unit is total revenue divided by total number of occupied units. | ||||||||||||||||||||||||||||||||
| (5) Rent per Unit is the average net effective rental rate per occupied unit. The Company defines net effective rental rate as the Company's rental rate after | ||||||||||||||||||||||||||||||||
| "loss to lease", concessions and vacancy. | ||||||||||||||||||||||||||||||||
11
| COLONIAL PROPERTIES TRUST | ||||||||||||||||||||||||||||||||
| Multifamily Same Property Sequential Quarter Comparisons | ||||||||||||||||||||||||||||||||
| First Quarter 2013 | ||||||||||||||||||||||||||||||||
| ($ in 000s, except property data amounts) | ||||||||||||||||||||||||||||||||
| SAME PROPERTY SEQUENTIAL COMPARISON OF REVENUES, EXPENSES & NOI | ||||||||||||||||||||||||||||||||
| Revenues | Expenses | NOI | ||||||||||||||||||||||||||||||
| 1Q13 | 4Q12 | % Chg | 1Q13 | 4Q12 | % Chg | 1Q13 | 4Q12 | % Chg | ||||||||||||||||||||||||
| Atlanta | $ | 7,564 | $ | 7,477 | 1.2 | % | $ | 3,098 | $ | 3,105 | (0.2 | )% | $ | 4,466 | $ | 4,372 | 2.2 | % | ||||||||||||||
| Austin | 8,616 | 8,609 | 0.1 | % | 3,891 | 3,934 | (1.1 | )% | 4,725 | 4,675 | 1.1 | % | ||||||||||||||||||||
| Birmingham | 4,098 | 4,050 | 1.2 | % | 1,584 | 1,619 | (2.2 | )% | 2,514 | 2,431 | 3.4 | % | ||||||||||||||||||||
| Charleston | 5,128 | 5,131 | (0.1 | )% | 1,934 | 2,059 | (6.1 | )% | 3,194 | 3,072 | 4.0 | % | ||||||||||||||||||||
| Charlotte | 11,313 | 11,278 | 0.3 | % | 3,930 | 3,830 | 2.6 | % | 7,383 | 7,448 | (0.9 | )% | ||||||||||||||||||||
| Dallas | 5,607 | 5,538 | 1.2 | % | 2,376 | 2,614 | (9.1 | )% | 3,231 | 2,924 | 10.5 | % | ||||||||||||||||||||
| Fort Worth | 5,388 | 5,351 | 0.7 | % | 2,471 | 2,385 | 3.6 | % | 2,917 | 2,966 | (1.7 | )% | ||||||||||||||||||||
| Orlando | 5,677 | 5,660 | 0.3 | % | 2,055 | 2,042 | 0.6 | % | 3,622 | 3,618 | 0.1 | % | ||||||||||||||||||||
| Phoenix | 2,711 | 2,697 | 0.5 | % | 905 | 845 | 7.1 | % | 1,806 | 1,852 | (2.5 | )% | ||||||||||||||||||||
| Raleigh | 7,700 | 7,676 | 0.3 | % | 2,569 | 2,533 | 1.4 | % | 5,131 | 5,143 | (0.2 | )% | ||||||||||||||||||||
| Richmond | 4,508 | 4,540 | (0.7 | )% | 1,664 | 1,686 | (1.3 | )% | 2,844 | 2,854 | (0.4 | )% | ||||||||||||||||||||
| Savannah | 4,131 | 4,126 | 0.1 | % | 1,483 | 1,466 | 1.2 | % | 2,648 | 2,660 | (0.5 | )% | ||||||||||||||||||||
| Tampa/Sarasota | 2,093 | 2,072 | 1.0 | % | 712 | 693 | 2.7 | % | 1,381 | 1,379 | 0.1 | % | ||||||||||||||||||||
| Other | 12,079 | 12,009 | 0.6 | % | 4,548 | 4,649 | (2.2 | )% | 7,531 | 7,360 | 2.3 | % | ||||||||||||||||||||
Total Same Property (1) | $ | 86,613 | $ | 86,214 | 0.5 | % | $ | 33,220 | $ | 33,460 | (0.7 | )% | $ | 53,393 | $ | 52,754 | 1.2 | % | ||||||||||||||
Financial Occupancy (2) | Revenue per Unit (3) | Rent per Unit (4) | ||||||||||||||||||||||||||||||
| 1Q13 | 4Q12 | % Chg | 1Q13 | 4Q12 | % Chg | 1Q13 | 4Q12 | % Chg | ||||||||||||||||||||||||
| Atlanta | 96.4 | % | 96.2 | % | 0.2 | % | $ | 1,007 | $ | 997 | 1.0 | % | $ | 826 | $ | 818 | 1.0 | % | ||||||||||||||
| Austin | 94.8 | % | 95.2 | % | (0.4 | )% | 1,005 | 999 | 0.6 | % | 857 | 855 | 0.2 | % | ||||||||||||||||||
| Birmingham | 95.4 | % | 94.7 | % | 0.7 | % | 890 | 886 | 0.5 | % | 758 | 757 | 0.1 | % | ||||||||||||||||||
| Charleston | 95.4 | % | 95.9 | % | (0.5 | )% | 948 | 944 | 0.4 | % | 798 | 791 | 0.9 | % | ||||||||||||||||||
| Charlotte | 96.6 | % | 97.4 | % | (0.8 | )% | 910 | 900 | 1.1 | % | 773 | 765 | 1.0 | % | ||||||||||||||||||
| Dallas | 94.4 | % | 94.7 | % | (0.3 | )% | 1,014 | 998 | 1.6 | % | 852 | 841 | 1.3 | % | ||||||||||||||||||
| Fort Worth | 96.4 | % | 96.3 | % | 0.1 | % | 926 | 921 | 0.5 | % | 745 | 743 | 0.3 | % | ||||||||||||||||||
| Orlando | 95.2 | % | 95.7 | % | (0.5 | )% | 1,132 | 1,123 | 0.8 | % | 961 | 961 | — | % | ||||||||||||||||||
| Phoenix | 95.2 | % | 95.0 | % | 0.2 | % | 997 | 994 | 0.3 | % | 847 | 841 | 0.7 | % | ||||||||||||||||||
| Raleigh | 96.3 | % | 95.8 | % | 0.5 | % | 971 | 973 | (0.2 | )% | 840 | 841 | (0.1 | )% | ||||||||||||||||||
| Richmond | 94.9 | % | 95.5 | % | (0.6 | )% | 932 | 933 | (0.1 | )% | 769 | 765 | 0.5 | % | ||||||||||||||||||
| Savannah | 97.1 | % | 97.6 | % | (0.5 | )% | 986 | 981 | 0.5 | % | 826 | 826 | — | % | ||||||||||||||||||
| Tampa/Sarasota | 98.0 | % | 98.7 | % | (0.7 | )% | 1,174 | 1,155 | 1.6 | % | 983 | 971 | 1.2 | % | ||||||||||||||||||
| Other | 95.1 | % | 95.2 | % | (0.1 | )% | 869 | 863 | 0.7 | % | 731 | 729 | 0.3 | % | ||||||||||||||||||
Total Same Property (1) | 95.7 | % | 95.9 | % | (0.2 | )% | $ | 959 | $ | 953 | 0.6 | % | $ | 808 | $ | 803 | 0.6 | % | ||||||||||||||
| (1) Same property communities are communities which were owned by the Company and stabilized as of January 1, 2012, as adjusted for dispositions | ||||||||||||||||||||||||||||||||
| during the year. The 2012 same property data reflects results of the 2013 same property portfolio. | ||||||||||||||||||||||||||||||||
| (2) The Company defines Financial Occupancy as market rent less vacancy loss as a percentage of market rent. | ||||||||||||||||||||||||||||||||
| (3) Revenue per Unit is total revenue divided by total number of occupied units. | ||||||||||||||||||||||||||||||||
| (4) Rent per Unit is the average net effective rental rate per occupied unit. The Company defines net effective rental rate as the Company's rental rate after | ||||||||||||||||||||||||||||||||
| "loss to lease", concessions and vacancy. | ||||||||||||||||||||||||||||||||
12
| COLONIAL PROPERTIES TRUST | |||||||||||||||||||||||
| Multifamily Same Property Operating Expenses Comparisons | |||||||||||||||||||||||
| First Quarter 2013 | |||||||||||||||||||||||
| ($ in 000s) | |||||||||||||||||||||||
| COMPARISON OF SAME PROPERTY OPERATING EXPENSES FOR THE THREE MONTHS ENDED MARCH 31, 2013 | |||||||||||||||||||||||
| % of Operating Expense | |||||||||||||||||||||||
| 1Q13 | 1Q12 | $ Change | % Change | 1Q13 | 1Q12 | Change | |||||||||||||||||
On-site Payroll (1) | $ | 8,694 | $ | 8,615 | $ | 79 | 0.9 | % | 26.2 | % | 26.7 | % | (0.5 | )% | |||||||||
| Real Estate Taxes | 8,999 | 8,247 | 752 | 9.1 | % | 27.1 | % | 25.5 | % | 1.6 | % | ||||||||||||
Utilities (2) | 7,339 | 7,200 | 139 | 1.9 | % | 22.1 | % | 22.3 | % | (0.2 | )% | ||||||||||||
Repairs and Maintenance (3) | 5,075 | 5,194 | (119 | ) | (2.3 | )% | 15.3 | % | 16.1 | % | (0.8 | )% | |||||||||||
| Insurance | 1,311 | 1,147 | 164 | 14.3 | % | 3.9 | % | 3.6 | % | 0.3 | % | ||||||||||||
| General and Administrative | 1,131 | 1,207 | (76 | ) | (6.3 | )% | 3.4 | % | 3.7 | % | (0.3 | )% | |||||||||||
| Advertising and Promotions | 671 | 696 | (25 | ) | (3.6 | )% | 2.0 | % | 2.2 | % | (0.2 | )% | |||||||||||
Total Same Property (4) | $ | 33,220 | $ | 32,306 | $ | 914 | 2.8 | % | 100.0 | % | 100.0 | % | |||||||||||
| (1) On-site payroll - Includes payroll and related expenses for on-site personnel including property managers, leasing consultants and maintenance staff. | |||||||||||||||||||||||
| (2) Utilities - Represents gross expenses prior to any recoveries from tenants and includes bulk cable program expenses. Recoveries are reflected in "Other | |||||||||||||||||||||||
| Property Related Revenue". | |||||||||||||||||||||||
| (3) Repairs and maintenance - Includes general maintenance costs, unit turnover costs including interior painting, routine landscaping, security, exterminating, fire | |||||||||||||||||||||||
| protection, roof and parking lot repairs and other miscellaneous repair costs. | |||||||||||||||||||||||
| (4) Same property communities are communities which were owned by the Company and stabilized as of January 1, 2012, as adjusted for dispositions during the | |||||||||||||||||||||||
| year. The 2012 same property data reflects results of the 2013 same property communities. | |||||||||||||||||||||||
13
| COLONIAL PROPERTIES TRUST | ||||||||||||||||||||||||||||||||
| Current Development Pipeline | ||||||||||||||||||||||||||||||||
| ($ in MMs) | ||||||||||||||||||||||||||||||||
| Development Costs | ||||||||||||||||||||||||||||||||
| Initial | ||||||||||||||||||||||||||||||||
Units / SF (1) | Start | Occp. | Compl. | Stab. | Total | Thru | ||||||||||||||||||||||||||
| Location | Total | Deliv'd | Leased | Date | Date | Date | Date | Cost | 1Q13 | After | ||||||||||||||||||||||
| Multifamily | ||||||||||||||||||||||||||||||||
| CR at South End | Charlotte, NC | 353 | n/a | n/a | 1Q12 | 2Q13 | 4Q13 | 4Q14 | 59.3 | 31.7 | 27.6 | |||||||||||||||||||||
| CG at Ayrsley (Phase II) | Charlotte, NC | 81 | n/a | n/a | 2Q12 | 2Q13 | 2Q13 | 4Q13 | 9.1 | 5.4 | 3.7 | |||||||||||||||||||||
| CG at Randal Lakes | Orlando, FL | 462 | n/a | n/a | 2Q12 | 3Q13 | 1Q14 | 1Q15 | 57.0 | 24.2 | 32.8 | |||||||||||||||||||||
| CG at Lake Mary (Phase III) | Orlando, FL | 132 | n/a | n/a | 1Q13 | 2Q14 | 3Q14 | 3Q14 | 16.1 | 2.4 | 13.7 | |||||||||||||||||||||
| 1,028 | $ | 141.5 | $ | 63.7 | $ | 77.8 | ||||||||||||||||||||||||||
| Commercial | ||||||||||||||||||||||||||||||||
| Brookwood West Retail | Birmingham, AL | 41,300 | 4Q12 | 3Q13 | 3Q13 | $ | 8.3 | $ | 1.9 | $ | 6.4 | |||||||||||||||||||||
| Total Active Development Projects | $ | 149.8 | $ | 65.6 | $ | 84.2 | ||||||||||||||||||||||||||
| Future Development Projects (see below) | 79.7 | |||||||||||||||||||||||||||||||
| Investment Land (see below) | 123.6 | |||||||||||||||||||||||||||||||
| Total Properties Under Development (per Balance Sheet) | $ | 268.9 | ||||||||||||||||||||||||||||||
| FUTURE DEVELOPMENT PIPELINE / LAND AND ASSETS HELD FOR SALE | ||||||||||||||||||||||||||||||||
| Future | Investment | Held | ||||||||||||||||||||||||||||||
| Location | Units / SF (1) | Development | Land | For Sale | ||||||||||||||||||||||||||||
| Multifamily | ||||||||||||||||||||||||||||||||
| CG at Thunderbird | Phoenix, AZ | 244 | $ | 8.0 | $ | — | $ | — | ||||||||||||||||||||||||
| CG at Sweetwater | Phoenix, AZ | 195 | 7.2 | — | — | |||||||||||||||||||||||||||
| CG at Azure | Las Vegas, NV | 438 | 11.5 | — | — | |||||||||||||||||||||||||||
| CG at Bellevue (Phase II) | Nashville, TN | 220 | 3.9 | — | — | |||||||||||||||||||||||||||
| CG at Randal Park | Orlando, FL | 314 | 6.6 | — | — | |||||||||||||||||||||||||||
| Total Multifamily Assets | $ | 37.2 | $ | — | $ | — | ||||||||||||||||||||||||||
| Commercial | ||||||||||||||||||||||||||||||||
| Colonial Promenade Huntsville | Huntsville, AL | $ | 5.5 | $ | — | $ | — | |||||||||||||||||||||||||
Colonial Promenade Nord du Lac (2) | Covington, LA | 236,000 | 26.0 | — | — | |||||||||||||||||||||||||||
| Randal Park | Orlando, FL | 11.0 | — | — | ||||||||||||||||||||||||||||
| Outparcels / Pads | — | 17.6 | 2.8 | |||||||||||||||||||||||||||||
| Total Commercial Assets | $ | 42.5 | $ | 17.6 | $ | 2.8 | ||||||||||||||||||||||||||
| Multifamily | $ | — | $ | 1.5 | $ | 27.0 | ||||||||||||||||||||||||||
| Commercial | — | 37.8 | — | |||||||||||||||||||||||||||||
Condo / Townhome (3) | — | — | 3.3 | |||||||||||||||||||||||||||||
For-sale Residential Land (4) | — | 66.7 | 2.4 | |||||||||||||||||||||||||||||
| Total Projects | $ | 79.7 | $ | 123.6 | $ | 35.5 | ||||||||||||||||||||||||||
| (1) Units refer to multifamily apartment units. Square feet refers to commercial space and excludes space owned by anchor tenants. | ||||||||||||||||||||||||||||||||
| (2) Total cost to date for this project is presented net of $18.1 million of impairment charges recorded in 4Q09 and 4Q08. | ||||||||||||||||||||||||||||||||
| (3) Held for Sale includes four condo units at Metropolitan Midtown. | ||||||||||||||||||||||||||||||||
| (4) Held for Sale includes 39 lots at Whitehouse Creek. | ||||||||||||||||||||||||||||||||
14
| COLONIAL PROPERTIES TRUST | ||||||||||||||
| Real Estate Activities | ||||||||||||||
| First Quarter 2013 | ||||||||||||||
| ACQUISITIONS | ||||||||||||||
| Stabilized | ||||||||||||||
| Acquisition | Cap | |||||||||||||
| Location | Date | Units | Basis | Rate | Remarks | |||||||||
| ($ MM) | ||||||||||||||
| Multifamily | ||||||||||||||
| Colonial Grand at Windermere | Orlando, FL | Mar-2013 | 280 | $ | 43.0 | 5.5 | % | |||||||
| $ | 43.0 | |||||||||||||
| DISPOSITIONS | ||||||||||||||
| Sales | Cap | |||||||||||||
| Location | Date | Units/SF (1) | Price | Rate | Remarks | |||||||||
| (SF-000s) | ($ MM) | |||||||||||||
| Multifamily | ||||||||||||||
| Colonial Reserve at West Franklin | Richmond, VA | Apr-2013 | 332 | $ | 23.8 | 6.5 | % | |||||||
| $ | 23.8 | |||||||||||||
| Commercial | ||||||||||||||
| Colonial Promenade Hoover | Birmingham, AL | Jan-2013 | 388 | $ | 2.0 | 8.4 | % | 10% Ownership Interest | ||||||
| Metropolitan Midtown | Charlotte, NC | Feb-2013 | 342 | 94.4 | 7.2 | % | ||||||||
| $ | 96.4 | |||||||||||||
| Total Dispositions | $ | 120.2 | ||||||||||||
| (1) Square-footage includes anchor-owned square-footage. | ||||||||||||||
15
| COLONIAL PROPERTIES TRUST | |||||||||||||||||||||||||
| Debt Summary | |||||||||||||||||||||||||
| As of March 31, 2013 | |||||||||||||||||||||||||
| QUARTERLY DEBT SUMMARY | |||||||||||||||||||||||||
| ($ In 000s) | |||||||||||||||||||||||||
| CONSOLIDATED DEBT | WITH UNCONSOLIDATED SUBSID. DEBT | ||||||||||||||||||||||||
| Debt | % | Avg Int | Wtd Mat'y | Debt | % | Avg Int | Wtd Mat'y | ||||||||||||||||||
| Unsecured/Secured | |||||||||||||||||||||||||
Unsecured Line of Credit (1) | $ | 116,173 | 7 | % | 1.6 | % | 3.0 | $ | 116,173 | 7 | % | 1.6 | % | 3.0 | |||||||||||
| Unsecured Other | 951,475 | 54 | % | 5.1 | % | 3.1 | 951,475 | 54 | % | 5.1 | % | 3.1 | |||||||||||||
| Secured | 691,132 | 39 | % | 5.6 | % | 6.0 | 710,185 | 40 | % | 5.6 | % | 5.8 | |||||||||||||
| Total Debt | $ | 1,758,780 | 100 | % | 5.1 | % | 4.2 | $ | 1,777,833 | 101 | % | 5.1 | % | 4.2 | |||||||||||
| Fixed/Floating | |||||||||||||||||||||||||
| Fixed Rate Debt | $ | 1,630,223 | 93 | % | 5.3 | % | 4.3 | $ | 1,649,276 | 93 | % | 5.3 | % | 4.2 | |||||||||||
| Floating Rate Debt | 128,557 | 7 | % | 1.8 | % | 2.9 | 128,557 | 7 | % | 1.8 | % | 2.9 | |||||||||||||
| Total Debt | $ | 1,758,780 | 100 | % | 5.1 | % | 4.2 | $ | 1,777,833 | 100 | % | 5.1 | % | 4.2 | |||||||||||
| (1) In addition to the $500MM Unsecured Line of Credit, Wells Fargo has provided the Company a $35MM Cash Management Line. The interest rate on the Line | |||||||||||||||||||||||||
| of Credit is LIBOR + 140.0 bps, and the facility fee is 30.0 bps. At March 31, 2013 the interest rate was 1.60%. The Line of Credit matures March 29, 2016 with a | |||||||||||||||||||||||||
| one-year extension option. | |||||||||||||||||||||||||
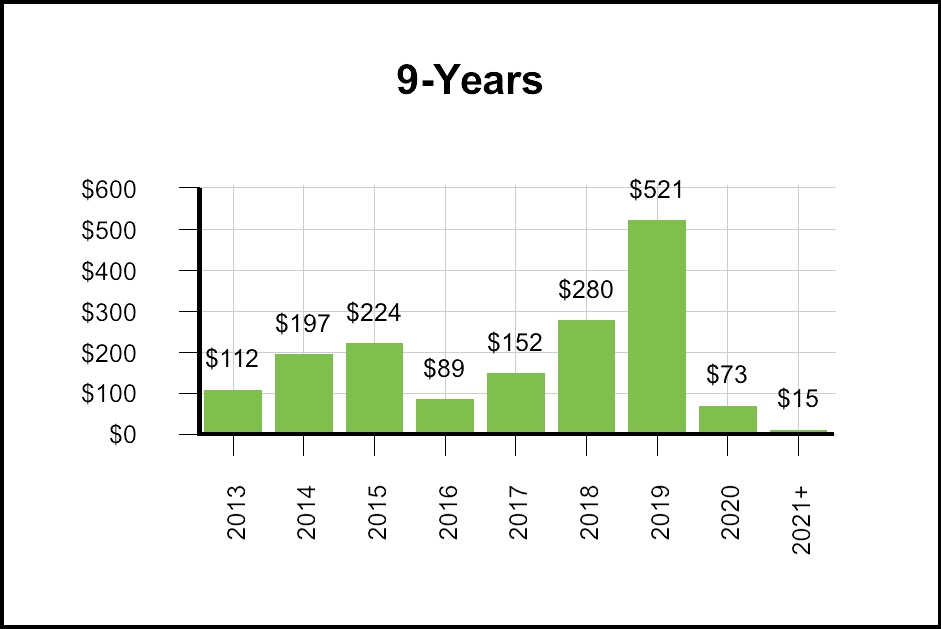
| PRINCIPAL DEBT MATURITY SCHEDULE | |||||||||||||||||||||||||
| ($ In MMs) | |||||||||||||||||||||||||

| Weighted Average Interest Rate on Maturing Debt (excluding line of credit) | |||
| 2013 | 6.07% | ||
| 2014 | 6.23% | ||
| 2015 | 5.36% | ||
| 2016 | 6.03% | ||
| 2017 | 2.75% | ||
| 2018 | 4.64% | ||
| 2019 | 5.81% | ||
| 2020 | 5.02% | ||
| Thereafter | 5.55% | ||
| Total | 5.31% | ||
Amortization Schedule includes unconsolidated debt and excludes the Revolving Line of Credit - due March 2016
| TOTAL MARKET CAPITALIZATION | |||||||||||||||||||||||||
| ($ In 000s) | |||||||||||||||||||||||||
| 1Q12 | 2Q12 | 3Q12 | 4Q12 | 1Q13 | 2Q13 | 3Q13 | 4Q13 | ||||||||||||||||||
| Consolidated Debt | $ | 1,801,759 | $ | 1,842,032 | $ | 1,827,764 | $ | 1,831,992 | $ | 1,758,780 | |||||||||||||||
| Unconsolidated Debt | 147,668 | 35,932 | 35,743 | 20,697 | 19,053 | ||||||||||||||||||||
| Total Debt | 1,949,427 | 1,877,964 | 1,863,507 | 1,852,689 | 1,777,833 | ||||||||||||||||||||
| Market Equity (Shares & Units) | 2,065,932 | 2,107,285 | 2,005,364 | 2,037,959 | 2,163,134 | ||||||||||||||||||||
| Total Market Capitalization | $ | 4,015,359 | $ | 3,985,249 | $ | 3,868,871 | $ | 3,890,648 | $ | 3,940,967 | |||||||||||||||
| Debt / Total Market Capitalization | 48.5 | % | 47.1 | % | 48.2 | % | 47.6 | % | 45.1 | % | |||||||||||||||
16
| COLONIAL PROPERTIES TRUST | |||||||||||||||||||||
| Debt Summary | |||||||||||||||||||||
| As of March 31, 2013 | |||||||||||||||||||||
| PUBLIC RATINGS | |||||||||||||||||||||
| Senior Unsecured | |||||||||||||||||||||
| Rating | Outlook | ||||||||||||||||||||
| Moody's Investor Services | Karen Nickerson | 212-553-4924 | Baa3 | Stable | |||||||||||||||||
| Standard & Poor's | Eugene Nusinzon | 212-438-2449 | BBB- | Stable | |||||||||||||||||
| COVERAGE RATIOS | |||||||||||||||||||||
| 1Q12 | 1Q13 | ||||||||||||||||||||
| SEC Coverage Ratios (SEC Reg. S-K, Item 503) | |||||||||||||||||||||
Earnings to Fixed Charges (1) | 0.7 | 0.9 | |||||||||||||||||||
| Supplemental Coverage Ratios (KPIs) | |||||||||||||||||||||
Interest Coverage (2) | 2.3 | 2.6 | |||||||||||||||||||
Fixed Charge Coverage (3) | 2.2 | 2.5 | |||||||||||||||||||
Fixed Charge w/ Capitalized Interest (4) | 2.2 | 2.4 | |||||||||||||||||||
| See Page 23 for a Reconciliation of SEC Coverage Ratios and a Reconciliation of Supplemental Coverage Ratios. | |||||||||||||||||||||
| Coverage ratios as calculated by the Company may not be comparable to similarly titled measures used by other companies. Investors are cautioned that these | |||||||||||||||||||||
| measures should not be taken alone to determine a Company's financial status. | |||||||||||||||||||||
| (1) The deficiency of the ratio of earnings to fixed charges for the three months ended March 31, 2013 and 2012 is primarily a result of non-cash depreciation | |||||||||||||||||||||
| and amortization expense. | |||||||||||||||||||||
| (2) Adjusted EBITDA/Interest Expense, including unconsolidated partnerships and joint ventures. The Company believes this ratio is useful as an additional | |||||||||||||||||||||
| measure of the Company's ability to service debt. Additionally, management used this ratio to make balance sheet management decisions. | |||||||||||||||||||||
| (3) Adjusted EBITDA/Interest Exp + Debt Prin Repayments, including unconsolidated partnerships and joint ventures. The Company believes this ratio is useful | |||||||||||||||||||||
| as an additional measure of the Company's ability to service debt. Additionally, management uses this ratio to make balance sheet management decisions. | |||||||||||||||||||||
| (4) Adjusted EBITDA/Interest Exp + Capitalized Interest + Debt Prin Repayments, including unconsolidated partnerships and joint ventures. The Company | |||||||||||||||||||||
| believes this ratio is useful as an additional measure of the Company's ability to service debt. Additionally, management uses this ratio to make balance sheet | |||||||||||||||||||||
| management decisions. | |||||||||||||||||||||
| FINANCIAL COVENANTS AND PUBLIC DEBT | |||||||||||||||||||||
| 1Q12 | 2Q12 | 3Q12 | 4Q12 | 1Q13 | 2Q13 | 3Q13 | 4Q13 | ||||||||||||||
| Total Debt to Total Assets cannot exceed 60% | 46.9 | % | 46.3 | % | 46.0 | % | 46.0 | % | 44.3 | % | |||||||||||
| Secured Debt to Total Assets cannot | |||||||||||||||||||||
| exceed 40% | 20.2 | % | 17.9 | % | 17.9 | % | 17.6 | % | 17.6 | % | |||||||||||
| Total Unencumbered Assets to Unsecured Debt | |||||||||||||||||||||
| must be at least 150% | 254.1 | % | 248.1 | % | 248.9 | % | 247.5 | % | 262.8 | % | |||||||||||
| Consolidated Income Available for Debt Service | |||||||||||||||||||||
| Charges must be at least 1.50/1 | 2.2x | 2.2x | 2.2x | 2.3x | 2.4x | ||||||||||||||||
17
| COLONIAL PROPERTIES TRUST | |||||||
| Corporate - Trends | |||||||
| ($ in 000s) | |||||||
| SUPPLEMENTAL DATA | |||||||
| 1Q13 | 1Q12 | ||||||
| Consolidated | |||||||
| Straight Line Rents | $ | 228 | $ | 118 | |||
| Percentage Rents | 37 | 27 | |||||
| Capitalized Interest | 206 | 185 | |||||
| Debt - Principal Amortization | 811 | 572 | |||||
| Amortization of Stock Compensation | 1,799 | 1,959 | |||||
Unconsolidated (1) | |||||||
| Straight Line Rents | 7 | 39 | |||||
| Interest Expense | 248 | 2,290 | |||||
| Debt - Principal Amortization | 137 | 174 | |||||
| Amortization of Deferred Financing Costs | 2 | 17 | |||||
| (1) The unconsolidated revenue and expense data are comprised of the Company's percentage of the applicable line item, which is calculated in accordance with | |||||||
| GAAP, for its unconsolidated partnerships and joint ventures. The Company believes this unconsolidated data is useful to investors in measuring the Company's | |||||||
| rights to cash flows and debt obligations related to the Company's unconsolidated partnerships and joint ventures. The Company manages or leases each of its | |||||||
| unconsolidated assets. Incorporating unconsolidated data also provides investors with management's view of evaluating current operating performance and | |||||||
| trends. | |||||||
| INVESTMENT ACTIVITY | |||||||
| 1Q13 | 1Q12 | ||||||
| Acquisitions | |||||||
| Multifamily | $ | 43,000 | $ | 45,000 | |||
| Acquisitions, Consolidated Assets | $ | 43,000 | $ | 45,000 | |||
| Development Expenditures | |||||||
| Multifamily | $ | 16,825 | $ | 13,632 | |||
| Commercial | 3,219 | 1,265 | |||||
| For-Sale / Other | 111 | 710 | |||||
| Development, Consolidated Assets | 20,155 | 15,607 | |||||
| Less: Infrastructure Reimbursement from City/County | (833 | ) | — | ||||
| Development, Consolidated Assets | $ | 19,322 | $ | 15,607 | |||
| Capital Expenditures | |||||||
| Multifamily | $ | 5,292 | $ | 2,948 | |||
Commercial (1) | 875 | 304 | |||||
| Capital Expenditures, Consolidated Assets | $ | 6,167 | $ | 3,252 | |||
| Proceeds from Sales of Properties, Net of Selling Costs | |||||||
| Commercial | $ | 94,832 | $ | 3,000 | |||
| For-Sale / Other | 711 | 1,130 | |||||
| Outparcels / Land | 4,881 | — | |||||
| Total, including subs | 100,424 | 4,130 | |||||
| Selling Costs | (2,968 | ) | (107 | ) | |||
| Less: Unconsolidated - net | (450 | ) | (3,000 | ) | |||
| Sales, Net - Consolidated Assets | $ | 97,006 | $ | 1,023 | |||
| (1) Includes capital expenditures, tenant improvements and leasing commissions. | |||||||
| The unconsolidated data regarding investment activity, capital expenditures, tenant improvements and leasing commissions set forth herein are calculated in | |||||||
| accordance with GAAP, for all of its unconsolidated partnerships and joint ventures. The Company believes this unconsolidated data is useful to investors in | |||||||
| evaluating the total cash investing activities of the Company. Typically, the percent of investment activities for its unconsolidated assets must be funded out of | |||||||
| current Company cash flows, and therefore, management uses the combined data in making financing and capital decisions. | |||||||
18
| COLONIAL PROPERTIES TURST | ||||||||
| Unconsolidated Joint Ventures | ||||||||
| ($ in 000s) | ||||||||
| JOINT VENTURE OPERATIONS | ||||||||
| Three Months Ended | ||||||||
OPERATING DATA (1) | 3/31/2013 | 3/31/2012 | ||||||
| Property Revenues | ||||||||
| Rental Revenue | $ | 696 | $ | 4,997 | ||||
| Other Property Revenue | 53 | 282 | ||||||
| Total Property Revenues | 749 | 5,279 | ||||||
| Property Expenses | ||||||||
| Property Operating and Maintenance | 131 | 1,163 | ||||||
| Taxes, License and Insurance | 96 | 579 | ||||||
| Total Property Expenses | 227 | 1,742 | ||||||
| Net Operating Income (NOI) | 522 | 3,537 | ||||||
| Other Income (Expense) | ||||||||
| Interest, net | (250 | ) | (2,305 | ) | ||||
Depreciation and Amortization (2) | 67 | (1,352 | ) | |||||
| Other | (13 | ) | (10 | ) | ||||
| Total Other Expenses | (196 | ) | (3,667 | ) | ||||
| Gain on Sale of Properties, net | 344 | 803 | ||||||
| Income from Partially-Owned Investments | $ | 670 | $ | 673 | ||||
| As of | ||||||||
BALANCE SHEET DATA (3) | 3/31/2013 | 12/31/2012 | ||||||
| Real Estate Assets, net | $ | 92,889 | $ | 105,067 | ||||
| Other Assets, net | 3,273 | 10,347 | ||||||
| Total Assets | $ | 96,162 | $ | 115,414 | ||||
| Notes Payable | $ | 68,251 | $ | 83,738 | ||||
| Other Liabilities | 1,883 | 2,238 | ||||||
| Total Liabilities | 70,134 | 85,976 | ||||||
| Member's Equity | 26,028 | 29,438 | ||||||
| Total Liabilities and Member's Equity | $ | 96,162 | $ | 115,414 | ||||
| Colonial's Equity Investment | $ | 7,702 | $ | 7,777 | ||||
| Colonial's Pro-rata Share of Debt | $ | 19,053 | $ | 20,697 | ||||
| (1) Operating data represents the Company's pro-rata share of revenues, expenses and NOI. | ||||||||
| (2) Includes amortization of excess basis differences for certain joint ventures. | ||||||||
| (3) Balance sheet data reported at 100%. | ||||||||
19
| COLONIAL PROPERTIES TRUST | |||||||
| Corporate Reconciliations | |||||||
| ($ in 000s) | |||||||
| RECONCILIATION OF REVENUES | |||||||
| 1Q13 | 1Q12 | ||||||
| Segment Total Revenues | |||||||
| Multifamily - Same Property | $ | 86,613 | $ | 82,293 | |||
Multifamily - Non-Same Property (1) | 9,158 | 5,548 | |||||
| Commercial | 10,746 | 17,717 | |||||
| Total Segment Revenues | 106,517 | 105,558 | |||||
| Less: Unconsolidated Revenue - Multifamily | (292 | ) | (471 | ) | |||
| Less: Unconsolidated Revenue - Commercial | (457 | ) | (4,794 | ) | |||
| Discontinued Operations | (2,060 | ) | (7,640 | ) | |||
| Unallocated Corporate Revenue | 178 | 1,344 | |||||
Consolidated Revenue Adjusted - '12 Discontinued Operations (2) | 103,886 | 93,997 | |||||
Add: Additional Discontinued Operations Revenue, post filing (3) | — | 7,609 | |||||
Total Consolidated Revenue, per 10-Q (4) | $ | 103,886 | $ | 101,606 | |||
| RECONCILIATION OF EXPENSES | |||||||
| 1Q13 | 1Q12 | ||||||
| Segment Total Expenses | |||||||
| Multifamily - Same Property | $ | 33,220 | $ | 32,306 | |||
Multifamily - Non-Same Property (1) | 4,599 | 2,976 | |||||
| Commercial | 3,658 | 5,731 | |||||
| Total Segment Expenses | 41,477 | 41,013 | |||||
| Less: Unconsolidated Expenses - Multifamily | (136 | ) | (217 | ) | |||
| Less: Unconsolidated Expenses - Commercial | (114 | ) | (1,707 | ) | |||
| Discontinued Operations | (856 | ) | (2,943 | ) | |||
| Total Property Operating Expenses | 40,371 | 36,146 | |||||
| Property Management Expense | 4,416 | 2,846 | |||||
| General and Administrative Expense | 4,787 | 5,767 | |||||
| Management Fee and Other Expenses | 250 | 2,045 | |||||
Investment and Development Expenses (5) | 400 | 387 | |||||
| Impairment and Other Losses | 90 | 500 | |||||
| Depreciation | 31,626 | 29,551 | |||||
| Amortization | 1,775 | 1,872 | |||||
Consolidated Expense Adjusted - '12 Discontinued Operations (2) | 83,715 | 79,114 | |||||
Add: Additional Discontinued Operations Expense, post filing (3) | — | 5,615 | |||||
Total Consolidated Expense, per 10-Q (4) | $ | 83,715 | $ | 84,729 | |||
| ________________________ | |||||||
| Notes on following page. | |||||||
20
| COLONIAL PROPERTIES TRUST | |||||||
| Corporate Reconciliations | |||||||
| ($ in 000s) | |||||||
| RECONCILIATION OF NOI | |||||||
| 1Q13 | 1Q12 | ||||||
| Segment Total NOI | |||||||
| Multifamily - Same Property | $ | 53,393 | $ | 49,987 | |||
Multifamily - Non-Same Property (1) | 4,559 | 2,572 | |||||
| Commercial | 7,088 | 11,986 | |||||
| Total Segment NOI | 65,040 | 64,545 | |||||
| Less: Unconsolidated NOI - Multifamily | (156 | ) | (254 | ) | |||
| Less: Unconsolidated NOI - Commercial | (343 | ) | (3,087 | ) | |||
| Discontinued Operations | (1,204 | ) | (4,697 | ) | |||
| Unallocated Corporate Revenue | 178 | 1,344 | |||||
| Property Management Expense | (4,416 | ) | (2,846 | ) | |||
| General and Administrative Expense | (4,787 | ) | (5,767 | ) | |||
| Management Fee and Other Expenses | (250 | ) | (2,045 | ) | |||
Investment and Development Expenses (5) | (400 | ) | (387 | ) | |||
| Impairment and Other Losses | (90 | ) | (500 | ) | |||
| Depreciation | (31,626 | ) | (29,551 | ) | |||
| Amortization | (1,775 | ) | (1,872 | ) | |||
| Income from Operations | 20,171 | 14,883 | |||||
| Total Other Income (Expense) | (22,319 | ) | (23,200 | ) | |||
Loss from Continuing Operations (6) | (2,148 | ) | (8,317 | ) | |||
| Discontinued Operations | — | 1,997 | |||||
Loss from Continuing Operations, per 10-Q (4) | $ | (2,148 | ) | $ | (6,320 | ) | |
| (1) Includes operations from for-sale portfolio. | |||||||
| (2) Reflects total consolidated revenue and total consolidated expense (as applicable), adjusted to reflect discontinued operations classifications made after | |||||||
| filing of prior period financials. | |||||||
| (3) Adjustment to prior period financials to reflect discontinued operations classifications made after filing of prior period financials. | |||||||
| (4) For prior period, reflects total consolidated revenue, expense or income (loss) from continuing operations (as applicable) as presented in prior period | |||||||
| financials (i.e., excluding adjustment for discontinued operations classifications made after filing of prior period financials). | |||||||
| (5) Reflects costs incurred related to acquisitions and abandoned pursuits. These costs are volatile and therefore may vary between periods. | |||||||
| (6) Loss from Continuing Operations before extraordinary items, noncontrolling interest and discontinued operations. Adjustments for additional | |||||||
| discontinued operations have restated periods in accordance with ASC 205-20. | |||||||
| DATA FOR THE THREE MONTHS ENDED MARCH 31, 2013 AND 2012 | |||||||
| 1Q13 | 1Q12 | ||||||
| Assets Sold | |||||||
| Revenue from Assets Sold | $ | 777 | $ | 6,389 | |||
| Expenses from Assets Sold | 298 | 2,432 | |||||
| NOI from Assets Sold | $ | 479 | $ | 3,957 | |||
| Assets Held for Sale | |||||||
| Revenue from Assets Held for Sale | $ | 1,283 | $ | 1,251 | |||
| Expenses from Assets Held for Sale | 558 | 511 | |||||
| NOI from Assets Held for Sale | $ | 725 | $ | 740 | |||
21
| COLONIAL PROPERTIES TRUST | |||||||
| Corporate Reconciliations | |||||||
| ($ in 000s) | |||||||
| NOI FROM DISCONTINUED OPERATIONS | |||||||
| NOI as reported by the Company does not include results from discontinued operations (i.e., assets sold or held for sale as of March 31, 2013). A | |||||||
| reconciliation of income from operations from properties sold or held for sale to NOI for these properties is as follows: | |||||||
| 1Q13 | 1Q12 | ||||||
| Income from discontinued operations | $ | 1,115 | $ | 1,866 | |||
| Adjustment for: | |||||||
| Interest (income) expense, net | (3 | ) | (3 | ) | |||
| Depreciation and amortization expense | 92 | 2,834 | |||||
| NOI from discontinued operations | $ | 1,204 | $ | 4,697 | |||
| NOI from assets sold | 479 | 3,957 | |||||
| NOI from assets held for sale | 725 | 740 | |||||
| NOI from discontinued operations | $ | 1,204 | $ | 4,697 | |||
| ADJUSTED EBITDA RECONCILIATION | |||||||
| 1Q13 | 1Q12 | ||||||
| Net Income (Loss) Available to Common Shareholders | $ | 5,576 | $ | (5,974 | ) | ||
| Consolidated | |||||||
| Noncontrolling Interest | 452 | (488 | ) | ||||
| Income - Unconsolidated Assets | (670 | ) | (673 | ) | |||
| Interest Expense | 22,195 | 23,053 | |||||
| Amortization of Deferred Financing Costs | 1,377 | 1,433 | |||||
| Income Tax Expense | — | 188 | |||||
| Depreciation & Amortization | 33,493 | 34,257 | |||||
| (Gain)/Loss on Sale of Property (Continuing & Discontinued Operations) | (7,194 | ) | 229 | ||||
Gain/(Loss) on Sale of Undepreciated Property (1) | 7 | (261 | ) | ||||
| Impairment | — | 500 | |||||
| Amortization of Stock-Based Compensation Expense | 1,799 | 1,959 | |||||
| Adjusted EBITDA from Consolidated Properties | 57,035 | 54,223 | |||||
| Unconsolidated | |||||||
| Reverse: Income - Unconsolidated Assets | 670 | 673 | |||||
| Interest Expense | 248 | 2,290 | |||||
| Amortization of Deferred Financing Costs | 2 | 17 | |||||
| Depreciation & Amortization | 108 | 1,902 | |||||
| Gain on Sale of Property | (344 | ) | (803 | ) | |||
| Adjusted EBITDA | $ | 57,719 | $ | 58,302 | |||
| (1) The Company includes the effects of undepreciated real estate (e.g. land, outparcels and condominium units) in Adjusted EBITDA, as this is a recurring source | |||||||
| of cash. | |||||||
| Adjusted EBITDA is defined as earnings before interest, taxes, depreciation and amortization ("EBITDA"), including the effects of the Company's percentage | |||||||
| ownership of its unconsolidated partnerships and joint ventures; the calculation also excludes the effects of gains (losses) from depreciated property, impairments | |||||||
| and certain other one-time charges. The Company believes Adjusted EBITDA is useful to investors as an indicative measure of operating performance due to the | |||||||
| significant long-lived real estate exposure and because it can be used to measure the Company's ability to service debt, fund capital expenditures and expand its | |||||||
| business. However, Adjusted EBITDA should not be considered an alternative to net income, operating profit, cash flow from operations or any other operating | |||||||
| or liquidity performance measure prescribed by GAAP. In addition, Adjusted EBITDA as calculated by the Company, may not be comparable to similarly titled | |||||||
| measures used by other companies. Investors are cautioned that the items adjusted to Net Income to Common Shareholders are significant components | |||||||
| in understanding and assessing the Company's financial performance. | |||||||
22
| COLONIAL PROPERTIES TRUST | |||||||
| Corporate Reconciliations | |||||||
| ($ in 000s) | |||||||
| RECONCILIATION OF SEC COVERAGE RATIOS | |||||||
| 1Q13 | 1Q12 | ||||||
| Earnings | |||||||
| Net Income (Loss) | $ | 5,576 | $ | (5,974 | ) | ||
| Discontinued Operations: | |||||||
| Income from Discontinued Operations | (1,115 | ) | (1,866 | ) | |||
| Noncontrolling Interest in CRLP | 621 | 142 | |||||
| (Gain)/Loss on Disposal of Discontinued Operations | (7,184 | ) | 2 | ||||
| CRLP Noncontrolling Interest - Common U/H | (169 | ) | (630 | ) | |||
| (Gain)/Loss from Sales of Property | (10 | ) | 227 | ||||
| Noncontrolling Interest of Limited Partners | 123 | 9 | |||||
| Income from Partially-Owned Investments | (670 | ) | (673 | ) | |||
| (2,828 | ) | (8,763 | ) | ||||
| Amortization of Interest Capitalized | 490 | 497 | |||||
| Capitalized Interest | (206 | ) | (185 | ) | |||
| Distributions from Partially-Owned Investments | 167 | 286 | |||||
| Fixed Charges, from below | 23,778 | 24,671 | |||||
| Earnings | $ | 21,401 | $ | 16,506 | |||
| Fixed Charges | |||||||
| Interest Expense | $ | 22,195 | $ | 23,053 | |||
| Capitalized Interest | 206 | 185 | |||||
| Amortization of Deferred Financing Costs | 1,377 | 1,433 | |||||
| Total | $ | 23,778 | $ | 24,671 | |||
| RECONCILIATION OF SUPPLEMENTAL COVERAGE RATIOS | |||||||
| 1Q13 | 1Q12 | ||||||
| Interest Coverage Denominator | |||||||
| Interest Expense | $ | 22,195 | $ | 23,053 | |||
| Interest Expense - Unconsolidated | 248 | 2,290 | |||||
| Total Interest Expense | $ | 22,443 | $ | 25,343 | |||
| Fixed Charge Denominator | |||||||
| Debt Principal Amortization | 811 | 572 | |||||
| Debt Principal Amortization - Unconsolidated | 137 | 174 | |||||
| Total Fixed Charges | $ | 23,391 | $ | 26,089 | |||
| Fixed Charge with Capitalized Interest Denominator | |||||||
| Add: Capitalized Interest | 206 | 185 | |||||
| Total Fixed Charges w/ Capitalized Interest | $ | 23,597 | $ | 26,274 | |||
23
| COLONIAL PROPERTIES TRUST | |||||||||||||||||||
| Multifamily Property Table | |||||||||||||||||||
| As of March 31, 2013 | |||||||||||||||||||
| Appendix | |||||||||||||||||||
| Year Built / | Apartment | Physical | Rent | Revenue | Rent | ||||||||||||||
| Property | MSA | State | Avg Age | % Own | Homes | Occupancy Rate | Per Home | Per Home | Per SF | S-P | |||||||||
| PROPERTIES IN MAJOR MARKETS | |||||||||||||||||||
| CG at Barrett Creek | Atlanta | GA | 1999 | 100.0 | % | 332 | 96.7 | % | $ | 768 | $ | 1,000 | $ | 0.82 | S | ||||
| CG at Berkeley Lake | Atlanta | GA | 1998 | 100.0 | % | 180 | 96.7 | % | 922 | 1,087 | 0.68 | S | |||||||
| CG at Huntcliff | Atlanta | GA | 1997 | 20.0 | % | 358 | 99.2 | % | 835 | 994 | 0.82 | ||||||||
| CG at McDaniel Farm | Atlanta | GA | 1997 | 100.0 | % | 425 | 96.9 | % | 769 | 1,022 | 0.72 | S | |||||||
| CG at Mount Vernon | Atlanta | GA | 1997 | 100.0 | % | 213 | 97.2 | % | 1,076 | 1,129 | 0.89 | S | |||||||
| CG at Pleasant Hill | Atlanta | GA | 1996 | 100.0 | % | 502 | 97.0 | % | 744 | 903 | 0.74 | S | |||||||
| CG at River Oaks | Atlanta | GA | 1992 | 100.0 | % | 216 | 92.6 | % | 868 | 1,027 | 0.68 | S | |||||||
| CG at River Plantation | Atlanta | GA | 1994 | 100.0 | % | 232 | 94.4 | % | 869 | 1,056 | 0.65 | S | |||||||
| CG at Shiloh | Atlanta | GA | 2002 | 100.0 | % | 498 | 94.0 | % | 815 | 989 | 0.76 | S | |||||||
| Total | 9 | 16.4 Years | 2,956 | 95.8 | % | $ | 830 | $ | 1,009 | $ | 0.76 | ||||||||
| Same Store | 8 | 16.4 Years | 2,598 | 95.8 | % | $ | 826 | $ | 1,007 | $ | 0.74 | ||||||||
| CG at Ashton Oaks | Austin | TX | 2008 | 100.0 | % | 362 | 96.7 | % | $ | 811 | $ | 959 | $ | 0.95 | S | ||||
| CG at Canyon Creek | Austin | TX | 2007 | 100.0 | % | 336 | 95.5 | % | 880 | 1,046 | 0.85 | S | |||||||
| CG at Canyon Ranch | Austin | TX | 2003 | 100.0 | % | 272 | 98.5 | % | 870 | 1,015 | 0.90 | ||||||||
| CG at Onion Creek | Austin | TX | 2008 | 100.0 | % | 300 | 95.7 | % | 966 | 1,112 | 0.93 | S | |||||||
| CG at Round Rock | Austin | TX | 2007 | 100.0 | % | 422 | 93.4 | % | 910 | 1,025 | 0.89 | S | |||||||
| CG at Silverado | Austin | TX | 2004 | 100.0 | % | 238 | 97.1 | % | 850 | 990 | 0.84 | S | |||||||
| CG at Silverado Reserve | Austin | TX | 2006 | 100.0 | % | 256 | 96.1 | % | 965 | 1,098 | 0.93 | S | |||||||
| CG at Wells Branch | Austin | TX | 2007 | 100.0 | % | 336 | 96.7 | % | 864 | 1,019 | 0.90 | S | |||||||
| CV at Quarry Oaks | Austin | TX | 1996 | 100.0 | % | 533 | 94.6 | % | 776 | 943 | 0.90 | S | |||||||
| CV at Sierra Vista | Austin | TX | 1999 | 100.0 | % | 232 | 97.8 | % | 728 | 878 | 0.82 | S | |||||||
| Total | 10 | 8.8 Years | 3,287 | 95.9 | % | $ | 856 | $ | 1,003 | $ | 0.89 | ||||||||
| Same Store | 9 | 8.6 Years | 3,015 | 95.7 | % | $ | 857 | $ | 1,005 | $ | 0.89 | ||||||||
| CG at Liberty Park | Birmingham | AL | 2000 | 100.0 | % | 300 | 94.7 | % | $ | 1,054 | $ | 1,166 | $ | 0.93 | S | ||||
| CG at Riverchase Trails | Birmingham | AL | 1996 | 100.0 | % | 346 | 94.5 | % | 767 | 921 | 0.81 | S | |||||||
| CV at Inverness | Birmingham | AL | 1986/87/90/97 | 100.0 | % | 586 | 96.8 | % | 603 | 711 | 0.69 | S | |||||||
| CV at Trussville | Birmingham | AL | 1996 | 100.0 | % | 376 | 97.1 | % | 756 | 919 | 0.69 | S | |||||||
| Total | 4 | 17.8 Years | 1,608 | 96.0 | % | $ | 758 | $ | 890 | $ | 0.77 | ||||||||
| Same Store | 4 | 17.8 Years | 1,608 | 96.0 | % | $ | 758 | $ | 890 | $ | 0.77 | ||||||||
| CG at Commerce Park | Charleston | SC | 2008 | 100.0 | % | 312 | 94.2 | % | $ | 840 | $ | 994 | $ | 0.86 | S | ||||
| CG at Cypress Cove | Charleston | SC | 2001 | 100.0 | % | 264 | 97.3 | % | 948 | 1,041 | 0.82 | S | |||||||
| CG at Quarterdeck | Charleston | SC | 1986 | 100.0 | % | 230 | 99.6 | % | 972 | 1,145 | 1.02 | S | |||||||
| CV at Hampton Pointe | Charleston | SC | 1986 | 100.0 | % | 304 | 94.7 | % | 790 | 960 | 0.76 | S | |||||||
| CV at Waters Edge | Charleston | SC | 1985 | 100.0 | % | 204 | 96.6 | % | 701 | 844 | 0.38 | S | |||||||
| CV at Westchase | Charleston | SC | 1986 | 100.0 | % | 352 | 96.0 | % | 652 | 806 | 0.89 | S | |||||||
| CV at Windsor Place | Charleston | SC | 1984 | 100.0 | % | 224 | 96.9 | % | 710 | 871 | 0.74 | S | |||||||
| Total | 7 | 22.4 Years | 1,890 | 96.3 | % | $ | 798 | $ | 948 | $ | 0.76 | ||||||||
| Same Store | 7 | 22.4 Years | 1,890 | 96.3 | % | $ | 798 | $ | 948 | $ | 0.76 | ||||||||
| CG at Ayrsley | Charlotte | NC | 2008 | 100.0 | % | 368 | 95.9 | % | $ | 872 | $ | 1,029 | $ | 0.86 | S | ||||
| CG at Beverly Crest | Charlotte | NC | 1996 | 100.0 | % | 300 | 92.7 | % | 790 | 933 | 0.85 | S | |||||||
| CG at Cornelius | Charlotte | NC | 2007 | 100.0 | % | 236 | 97.0 | % | 892 | 1,021 | 0.84 | S | |||||||
| CG at Huntersville | Charlotte | NC | 2008 | 100.0 | % | 250 | 96.0 | % | 866 | 1,003 | 0.87 | S | |||||||
| CG at Legacy Park | Charlotte | NC | 2001 | 100.0 | % | 288 | 99.7 | % | 788 | 914 | 0.75 | S | |||||||
| CG at Mallard Creek | Charlotte | NC | 2004 | 100.0 | % | 252 | 98.4 | % | 803 | 948 | 0.87 | S | |||||||
| CG at Mallard Lake | Charlotte | NC | 1998 | 100.0 | % | 302 | 96.0 | % | 829 | 983 | 0.83 | S | |||||||
| CG at Matthews Commons | Charlotte | NC | 2008 | 100.0 | % | 216 | 95.4 | % | 906 | 1,056 | 0.96 | S | |||||||
| CG at University Center | Charlotte | NC | 2005 | 100.0 | % | 156 | 96.2 | % | 790 | 928 | 0.74 | S | |||||||
| CV at Chancellor Park | Charlotte | NC | 1999 | 100.0 | % | 340 | 94.1 | % | 746 | 872 | 0.78 | S | |||||||
| CV at Charleston Place | Charlotte | NC | 1986 | 100.0 | % | 214 | 97.2 | % | 576 | 709 | 0.72 | S | |||||||
| CV at Greystone | Charlotte | NC | 1998/2000 | 100.0 | % | 408 | 97.1 | % | 651 | 780 | 0.69 | S | |||||||
| CV at Matthews | Charlotte | NC | 1990 | 100.0 | % | 270 | 97.0 | % | 787 | 922 | 0.83 | S | |||||||
| CV at South Tryon | Charlotte | NC | 2002 | 100.0 | % | 216 | 98.6 | % | 739 | 866 | 0.68 | S | |||||||
| CV at Stone Point | Charlotte | NC | 1986 | 100.0 | % | 192 | 94.3 | % | 690 | 818 | 0.77 | S | |||||||
| CV at Timber Crest | Charlotte | NC | 1999 | 100.0 | % | 282 | 99.3 | % | 667 | 791 | 0.69 | S | |||||||
| CR at Enclave | Charlotte | NC | 2008 | 100.0 | % | 85 | 91.8 | % | 1,638 | 1,774 | 1.29 | ||||||||
| Total | 17 | 13.0 Years | 4,375 | 96.4 | % | $ | 789 | $ | 926 | $ | 0.81 | ||||||||
| Same Store | 16 | 13.5 Years | 4,290 | 96.5 | % | $ | 773 | $ | 910 | $ | 0.79 | ||||||||
24
| COLONIAL PROPERTIES TRUST | |||||||||||||||||||
| Multifamily Property Table | |||||||||||||||||||
| As of March 31, 2013 | |||||||||||||||||||
| Appendix | |||||||||||||||||||
| Year Built / Avg | Apartment | Physical | Rent | Revenue | Rent | ||||||||||||||
| Property | MSA | State | Age | % Own | Homes | Occupancy Rate | Per Home | Per Home | Per SF | S-P | |||||||||
| CG at Hebron | Dallas | TX | 2011 | 100.0 | % | 312 | 97.8 | % | $ | 1,109 | $ | 1,201 | $ | 0.98 | |||||
| CG at Fairview | Dallas | TX | 2012 | 100.0 | % | 256 | 95.7 | % | 1,047 | 1,143 | 1.04 | ||||||||
| CG at Valley Ranch | Dallas | TX | 1995 | 100.0 | % | 396 | 93.7 | % | 1,100 | 1,259 | 0.94 | S | |||||||
| CR at Medical District | Dallas | TX | 2007 | 100.0 | % | 278 | 96.8 | % | 1,085 | 1,190 | 1.25 | S | |||||||
| CR at Las Colinas | Dallas | TX | 2006 | 100.0 | % | 306 | 90.5 | % | 1,179 | 1,281 | 1.31 | ||||||||
| CV at Main Park | Dallas | TX | 1984 | 100.0 | % | 192 | 97.4 | % | 721 | 890 | 0.77 | S | |||||||
| CV at Oakbend | Dallas | TX | 1997 | 100.0 | % | 426 | 95.5 | % | 770 | 947 | 0.86 | S | |||||||
| CV at Vista Ridge | Dallas | TX | 1985 | 100.0 | % | 300 | 97.7 | % | 627 | 780 | 0.79 | S | |||||||
| Remington Hills | Dallas | TX | 1985 | 100.0 | % | 362 | 98.6 | % | 757 | 943 | 0.79 | S | |||||||
| Total | 9 | 15.3 Years | 2,828 | 95.9 | % | $ | 930 | $ | 1,071 | $ | 0.96 | ||||||||
| Same Store | 6 | 21.1 Years | 1,954 | 96.4 | % | $ | 852 | $ | 1,014 | $ | 0.90 | ||||||||
| Belterra | Fort Worth | TX | 2006 | 10.0 | % | 288 | 95.8 | % | $ | 906 | $ | 996 | $ | 0.94 | |||||
| CG at Bear Creek | Fort Worth | TX | 1998 | 100.0 | % | 436 | 97.2 | % | 826 | 984 | 0.91 | S | |||||||
| CV at Grapevine | Fort Worth | TX | 1985 | 100.0 | % | 450 | 97.3 | % | 717 | 877 | 0.83 | S | |||||||
| CV at North Arlington | Fort Worth | TX | 1985 | 100.0 | % | 240 | 97.1 | % | 571 | 749 | 0.72 | S | |||||||
| CV at Shoal Creek | Fort Worth | TX | 1996 | 100.0 | % | 408 | 95.8 | % | 803 | 1,004 | 0.86 | S | |||||||
| CV at Willow Creek | Fort Worth | TX | 1996 | 100.0 | % | 478 | 95.8 | % | 737 | 944 | 0.83 | S | |||||||
| Total | 6 | 18.9 Years | 2,300 | 96.6 | % | $ | 765 | $ | 934 | $ | 0.85 | ||||||||
| Same Store | 5 | 21.3 Years | 2,012 | 96.6 | % | $ | 745 | $ | 926 | $ | 0.84 | ||||||||
| CG at Heather Glen | Orlando | FL | 2000 | 100.0 | % | 448 | 96.0 | % | $ | 1,041 | $ | 1,195 | $ | 0.89 | S | ||||
| CG at Heathrow | Orlando | FL | 1997 | 100.0 | % | 312 | 92.6 | % | 931 | 1,127 | 0.82 | S | |||||||
| CG at Lake Mary | Orlando | FL | 2012 | 100.0 | % | 232 | 94.8 | % | 1,145 | 1,285 | 1.13 | ||||||||
| CR at Town Park | Orlando | FL | 2004 | 100.0 | % | 80 | 95.0 | % | 1,101 | 1,248 | 1.14 | S | |||||||
| CG at Town Park (Lake Mary) | Orlando | FL | 2002 | 100.0 | % | 456 | 95.2 | % | 1,025 | 1,196 | 0.87 | S | |||||||
| CG at Windermere | Orlando | FL | 2009 | 100.0 | % | 280 | 95.0 | % | 1,112 | 1,235 | 1.10 | ||||||||
| CV at Twin Lakes | Orlando | FL | 2004 | 100.0 | % | 460 | 96.7 | % | 816 | 990 | 0.90 | S | |||||||
| Total | 7 | 9.3 Years | 2,268 | 95.3 | % | $ | 861 | $ | 999 | $ | 0.80 | ||||||||
| Same Store | 5 | 11.8 Years | 1,756 | 95.3 | % | $ | 961 | $ | 1,132 | $ | 0.88 | ||||||||
| CG at Inverness Commons | Phoenix | AZ | 2002 | 100.0 | % | 300 | 97.3 | % | $ | 733 | $ | 900 | $ | 0.72 | S | ||||
| CG at OldTown Scottsdale North | Phoenix | AZ | 1995 | 100.0 | % | 208 | 96.2 | % | 852 | 1,000 | 0.86 | S | |||||||
| CG at OldTown Scottsdale South | Phoenix | AZ | 1994 | 100.0 | % | 264 | 96.2 | % | 891 | 1,033 | 0.89 | S | |||||||
| CG at Scottsdale | Phoenix | AZ | 1999 | 100.0 | % | 180 | 95.6 | % | 965 | 1,104 | 0.86 | S | |||||||
| Total | 4 | 15.8 Years | 952 | 96.4 | % | $ | 847 | $ | 997 | $ | 0.82 | ||||||||
| Same Store | 4 | 15.8 Years | 952 | 96.4 | % | $ | 847 | $ | 997 | $ | 0.82 | ||||||||
| CG at Arringdon | Raleigh | NC | 2003 | 100.0 | % | 320 | 98.4 | % | $ | 838 | $ | 990 | $ | 0.86 | S | ||||
| CG at Brier Creek | Raleigh | NC | 2009 | 100.0 | % | 364 | 98.1 | % | 933 | 1,054 | 0.85 | S | |||||||
| CG at Brier Falls | Raleigh | NC | 2008 | 100.0 | % | 350 | 94.9 | % | 975 | 1,094 | 0.89 | S | |||||||
| CG at Crabtree Valley | Raleigh | NC | 1997 | 100.0 | % | 210 | 97.1 | % | 762 | 903 | 0.76 | S | |||||||
| CG at Patterson Place | Raleigh | NC | 1997 | 100.0 | % | 252 | 96.8 | % | 840 | 997 | 0.89 | S | |||||||
| CG at Research Park | Raleigh | NC | 2002 | 100.0 | % | 370 | 93.2 | % | 825 | 964 | 0.79 | ||||||||
| CG at Trinity Commons | Raleigh | NC | 2000/2002 | 100.0 | % | 462 | 93.9 | % | 811 | 943 | 0.77 | S | |||||||
| CV at Beaver Creek | Raleigh | NC | 2000/2003 | 100.0 | % | 316 | 98.1 | % | 798 | 936 | 0.82 | S | |||||||
| CV at Deerfield | Raleigh | NC | 1985 | 100.0 | % | 204 | 96.1 | % | 806 | 936 | 0.83 | S | |||||||
| CV at Woodlake | Raleigh | NC | 1996 | 100.0 | % | 266 | 94.4 | % | 726 | 819 | 0.76 | S | |||||||
| Total | 10 | 13.3 Years | 3,114 | 96.0 | % | $ | 838 | $ | 970 | $ | 0.82 | ||||||||
| Same Store | 9 | 13.5 Years | 2,744 | 96.3 | % | $ | 840 | $ | 971 | $ | 0.83 | ||||||||
| Ashley Park | Richmond | VA | 1988 | 100.0 | % | 272 | 94.9 | % | $ | 670 | $ | 812 | $ | 0.94 | S | ||||
| CR at West Franklin | Richmond | VA | 1964/65 | 100.0 | % | 332 | 93.7 | % | 704 | 947 | 1.38 | S | |||||||
| CV at Chase Gayton | Richmond | VA | 1984 | 100.0 | % | 328 | 92.7 | % | 828 | 954 | 0.87 | S | |||||||
| CV at Hampton Glen | Richmond | VA | 1986 | 100.0 | % | 232 | 97.8 | % | 832 | 979 | 1.09 | S | |||||||
| CV at Waterford | Richmond | VA | 1990 | 100.0 | % | 312 | 95.5 | % | 830 | 992 | 0.90 | S | |||||||
| CV at West End | Richmond | VA | 1987 | 100.0 | % | 224 | 96.4 | % | 748 | 894 | 1.07 | S | |||||||
| Total | 6 | 30.0 Years | 1,700 | 94.9 | % | $ | 769 | $ | 932 | $ | 1.01 | ||||||||
| Same Store | 6 | 30.0 Years | 1,700 | 94.9 | % | $ | 769 | $ | 932 | $ | 1.01 | ||||||||
25
| COLONIAL PROPERTIES TRUST | |||||||||||||||||||
| Multifamily Property Table | |||||||||||||||||||
| As of March 31, 2013 | |||||||||||||||||||
| Appendix | |||||||||||||||||||
| Year Built / Avg | Apartment | Physical | Rent | Revenue | Rent | ||||||||||||||
| Property | MSA | State | Age | % Own | Homes | Occupancy Rate | Per Home | Per Home | Per SF | S-P | |||||||||
| CG at Godley Station | Savannah | GA | 2005 | 100.0 | % | 312 | 96.2 | % | $ | 857 | $ | 1,015 | $ | 0.79 | S | ||||
| CG at Hammocks | Savannah | GA | 1997 | 100.0 | % | 308 | 96.1 | % | 972 | 1,170 | 0.92 | S | |||||||
| CV at Godley Lake | Savannah | GA | 2008 | 100.0 | % | 288 | 97.6 | % | 821 | 967 | 0.88 | S | |||||||
| CV at Greentree | Savannah | GA | 1983 | 100.0 | % | 194 | 96.9 | % | 656 | 816 | 0.77 | S | |||||||
| CV at Huntington | Savannah | GA | 1986 | 100.0 | % | 147 | 99.3 | % | 749 | 916 | 0.91 | S | |||||||
| CV at Marsh Cove | Savannah | GA | 1983 | 100.0 | % | 188 | 95.2 | % | 782 | 898 | 0.75 | S | |||||||
| Total | 6 | 19.6 Years | 1,437 | 96.7 | % | $ | 826 | $ | 986 | $ | 0.84 | ||||||||
| Same Store | 6 | 19.6 Years | 1,437 | 96.7 | % | $ | 826 | $ | 986 | $ | 0.84 | ||||||||
| CG at Hampton Preserve | Tampa/Sarasota | FL | 2012 | 100.0 | % | 486 | 96.1 | % | $ | 995 | $ | 1,136 | $ | 0.94 | |||||
| CG at Lakewood Ranch | Tampa/Sarasota | FL | 1999 | 100.0 | % | 288 | 98.6 | % | 1,078 | 1,258 | 1.03 | S | |||||||
| CG at Seven Oaks | Tampa/Sarasota | FL | 2004 | 100.0 | % | 318 | 98.7 | % | 897 | 1,098 | 0.95 | S | |||||||
| Total | 3 | 8.3 Years | 1,092 | 97.5 | % | $ | 989 | $ | 1,158 | $ | 0.97 | ||||||||
| Same Store | 2 | 11.8 Years | 606 | 98.7 | % | $ | 983 | $ | 1,174 | $ | 0.99 | ||||||||
| TOTAL PROPERTIES IN MAJOR MARKETS | 98 | 15.5 Years | 29,807 | 96.1 | % | $ | 831 | $ | 981 | $ | 0.84 | ||||||||
| Same Store | 87 | 16.7 Years | 26,562 | 96.2 | % | $ | 822 | $ | 976 | $ | 0.83 | ||||||||
| PROPERTIES IN OTHER MARKETS | |||||||||||||||||||
| CG at Autumn Park | Greensboro | NC | 2001/04 | 100.0 | % | 402 | 91.3 | % | $ | 783 | $ | 855 | $ | 0.77 | S | ||||
| CG at Bellevue | Nashville | TN | 1996 | 100.0 | % | 349 | 97.4 | % | 952 | 1,050 | 0.96 | S | |||||||
| CG at Desert Vista | Las Vegas | NV | 2008 | 100.0 | % | 380 | 96.6 | % | 709 | 847 | 0.80 | S | |||||||
| CG at Edgewater | Huntsville | AL | 1990/99 | 100.0 | % | 500 | 97.2 | % | 713 | 855 | 0.66 | S | |||||||
| CG at Madison | Huntsville | AL | 1999 | 100.0 | % | 336 | 95.2 | % | 761 | 945 | 0.72 | S | |||||||
| CG at Palm Vista | Las Vegas | NV | 2007 | 100.0 | % | 341 | 96.2 | % | 743 | 886 | 0.73 | S | |||||||
| CG at Traditions | Gulf Shores | AL | 2008 | 100.0 | % | 324 | 91.5 | % | 640 | 792 | 0.64 | S | |||||||
| CG at Wilmington | Wilmington | NC | 1998/2002 | 100.0 | % | 390 | 92.3 | % | 746 | 833 | 0.82 | S | |||||||
| CV at Ashford Place | Mobile | AL | 1983 | 100.0 | % | 168 | 97.6 | % | 565 | 680 | 0.65 | S | |||||||
| CV at Greenbrier | Fredericksburg | VA | 1988 | 100.0 | % | 258 | 96.1 | % | 870 | 1,059 | 1.03 | S | |||||||
| CV at Harbour Club | Norfolk | VA | 1988 | 100.0 | % | 213 | 96.2 | % | 804 | 994 | 0.89 | S | |||||||
| CV at Huntleigh Woods | Mobile | AL | 1978 | 100.0 | % | 233 | 97.0 | % | 530 | 677 | 0.62 | S | |||||||
| CV at Mill Creek | Winston-Salem | NC | 1984 | 100.0 | % | 220 | 92.7 | % | 541 | 676 | 0.57 | S | |||||||
| CV at Pinnacle Ridge | Asheville | NC | 1948/85 | 100.0 | % | 166 | 98.8 | % | 741 | 862 | 0.85 | S | |||||||
| CV at Tradewinds | Norfolk | VA | 1988 | 100.0 | % | 284 | 95.1 | % | 806 | 987 | 0.82 | S | |||||||
| Cypress Village Rental | Gulf Shores | AL | 2008 | 100.0 | % | 96 | 100.0 | % | 1,229 | 1,448 | 0.57 | ||||||||
| Glen Eagles | Winston-Salem | NC | 1990/2000 | 100.0 | % | 310 | 93.9 | % | 622 | 774 | 0.62 | S | |||||||
| TOTAL PROPERTIES IN OTHER MARKETS | 17 | 19.5 Years | 4,970 | 95.6 | % | $ | 740 | $ | 879 | $ | 0.75 | ||||||||
| Same Store | 16 | 20.4 Years | 4,874 | 95.5 | % | $ | 731 | $ | 869 | $ | 0.76 | ||||||||
| LEASE UP PROPERTIES | |||||||||||||||||||
| CG at Double Creek | Austin | TX | 2013 | 100.0 | % | 296 | LU | $ | 1,016 | $ | 1,198 | $ | 1.08 | ||||||
| CG at Lake Mary II | Orlando | FL | 2013 | 100.0 | % | 108 | LU | 1,107 | 1,308 | 1.07 | |||||||||
| TOTAL LEASE UP | 2 | 404 | LU | $ | 1,039 | $ | 1,228 | $ | 1.08 | ||||||||||
| TOTAL ALL PROPERTIES | 117 | 16.1 Years | 35,181 | 96.0 | % | $ | 818 | $ | 966 | $ | 0.83 | ||||||||
| Same Store | 103 | 17.2 Years | 31,436 | 96.1 | % | $ | 808 | $ | 959 | $ | 0.82 | ||||||||
| CG = Colonial Grand Apartments and CR = Colonial Reserve, Class A; CV = Colonial Village Apartments, Class B | |||||||||||||||||||
| LU = Properties in lease up. These properties are not included in Occupancy and Market Rent calculations. | |||||||||||||||||||
| S = Current year same-property portfolio: Property has been stabilized as of the beginning of the prior calendar year. Partially-owned properties are not included. | |||||||||||||||||||
26
| COLONIAL PROPERTIES TRUST | ||||||||||||||||
| Commercial Property Table | ||||||||||||||||
| As of March 31, 2013 | ||||||||||||||||
| Appendix | ||||||||||||||||
| Square Feet (000s) | ||||||||||||||||
| Anchor | Physical | Base Rent per | ||||||||||||||
| Property | MSA | State | Year Built | % Own | Total | Owned | CLP Owned | Occupancy Rate | Sq. Foot (1) | |||||||
| CONSOLIDATED PROPERTIES | ||||||||||||||||
| CC Brookwood Village (Office) | Birmingham | AL | 2007 | 100 | % | 170 | — | 170 | 97.7 | % | $ | 30.81 | ||||
| Three Ravinia (Office) | Atlanta | GA | 1991 | 100 | % | 814 | — | 814 | 92.1 | % | 24.59 | |||||
| Brookwood Village (Retail) | Birmingham | AL | 1973/91/00 | 100 | % | 604 | 232 | 372 | 86.5 | % | 23.36 | |||||
| CP Tannehill (Retail) | Birmingham | AL | 2008 | 100 | % | 421 | 211 | 210 | 89.9 | % | 19.22 | |||||
| CP Craft Farms (Retail) | Gulf Shores | AL | 2010 | 100 | % | 68 | — | 68 | 86.1 | % | 18.60 | |||||
| CP Nord du Lac (Retail) | New Orleans | LA | 2010 | 100 | % | 283 | 87 | 196 | 93.6 | % | 18.24 | |||||
| Total Consolidated | 6 | 2,360 | 530 | 1,830 | 91.2 | % | $ | 24.55 | ||||||||
| UNCONSOLIDATED PROPERTIES | ||||||||||||||||
| Land Title Building (Office) | Birmingham | AL | 1975 | 33 | % | 30 | — | 30 | 100.0 | % | $ | 14.79 | ||||
| CP Smyrna (Retail) | Smyrna | TN | 2008 | 50 | % | 416 | 268 | 148 | 98.8 | % | 20.65 | |||||
| Total | 2 | 446 | 268 | 178 | 99.0 | % | $ | 18.96 | ||||||||
| Total (Weighted) | 2 | 84 | 99.0 | % | $ | 19.41 | ||||||||||
| THIRD-PARTY MANAGED BUSINESS | ||||||||||||||||
| Calico Corner (Retail) | Birmingham | AL | 0% | 6 | ||||||||||||
| TOTAL MANAGED | 1 | 6 | ||||||||||||||
| Total Commercial Properties | 9 | 2,812 | 798 | 2,008 | 91.9 | % | $ | 24.14 | ||||||||
| Total Commercial Properties (Weighted) | 9 | 1,914 | 91.5 | % | $ | 24.37 | ||||||||||
| (1) Base rent per square foot amounts are calculated on a straight-line basis in accordance with GAAP. In reference to the Retail properties, this calculation | ||||||||||||||||
| includes tenants occupying less than 10,000 square feet (i.e., excludes anchor tenants). Rental terms for anchor tenants generally are not representative of the | ||||||||||||||||
| larger portfolio. | ||||||||||||||||
27
| COLONIAL PROPERTIES TRUST | ||
| Glossary of Terms | ||
| RENT PER SQUARE UNIT (FOOT): | Effective rent per unit - average net effective rental rate per occupied unit. Base rent per unit - rental revenue | |
| charged to tenants divided by occupied square feet for commercial properties. Rental revenue used in on a | ||
| monthly basis for multifamily properties and an annual basis for commercial properties. | ||
| CONCESSIONS: | Relief or reduction of rent charges for a specified period, negotiated as a part of entering into a lease | |
| agreement. | ||
| DIVIDEND PER SHARE: | The dividends/distributions paid to each shareholder of Colonial Properties Trust and to each partner of | |
| Colonial Realty Limited Partnership as of a specific date. | ||
EBITDA: | Earnings before interest, taxes, depreciation and amortization excluding the effects of gains (losses) | |
| from sales of property. | ||
| FINANCIAL OCCUPANCY: | Market rent less vacancy loss as a percentage of market rent. | |
| FUNDS FROM OPERATIONS | Net income (loss) before noncontrolling interest (determined in accordance with generally accepted accounting | |
| (FFO): | principles), excluding gains (losses) from sales of depreciated property and impairment write-downs of | |
| depreciable real estate, plus real estate depreciation and amortization and after adjustments for unconsolidated | ||
| partnerships and joint ventures. | ||
| FFO PER SHARE: | FFO divided by the weighted average shares outstanding during the period, assuming the conversation | |
| of minority interest limited partnership units in Colonial Realty Limited Partnership into the Company's | ||
| Common Shares. | ||
| NET EFFECTIVE RENTAL RATE: | The Company's rental rate after "loss to lease", concessions and vacancy. | |
| PHYSICAL OCCUPANCY RATE: | Total square feet (units) rented divided by net rentable square feet (units) on the date indicated. | |
| OPERATING EXPENSES: | Total operating expenses (as reported by the Company to the SEC in its periodic filings) less | |
| depreciation and amortization. This amount does not include other income and expenses such as | ||
| interest and gains or losses on sales of assets. | ||
| PERCENT GROWTH: | Percentage increase of an item when compared to the same item from the same quarter in the prior- | |
| year. | ||
PROPERTY OR SEGMENT | Property revenues less property operating expenses. | |
| NET OPERATING INCOME: | ||
| SAME PROPERTY: | Properties owned in the current year which were also owned for the 12 calendar months of the prior | |
| year; same-property may be restated during the year to account for any disposition activity. | ||
| STOCK PRICE PER SHARE: | The closing price reported by the New York Stock Exchange on the date indicated. | |
TOTAL MARKET | The sum of total notes and mortgages payable plus the total market value of all shares and units | |
| CAPITALIZATION: | outstanding at the market price per share on the date indicated. | |
28