Filed by Mid-America Apartment Communities, Inc.
Pursuant to Rule 425 under the Securities Act of 1933
and deemed filed pursuant to Rule 14a-12
under the Securities Exchange Act of 1934
Subject Company: Colonial Properties Trust
Commission File No.: 1-12358
The following presentation was presented to investors on August 6, 2013:
 Capital Markets Update August 2013 Exhibit 99.1 |
 2 MAA overview $4.7 billion total market capitalization, 165 Properties, 49,113 Units – $8.7 billion total market capitalization, post merger – Second largest multifamily REIT based on unit count: 85,000 units, post merger 19+ year established public company platform Diversified across 13 states and 45 markets – 14 states and 50 markets, post merger Long-tenured management team; sophisticated public company board of directors A+ to B quality portfolio; appealing to broadest segment of rental market Average age of 15 years 96% same store occupancy at June 30 Average same store revenue per unit of $971 for 2Q13 Focus on the High-Growth Sunbelt Region High Quality Portfolio Compelling Growth Model Investment Grade Balance Sheet Significant deal flow; $1.1 billion in acquisitions (avg age 4.4 years) over last 5 years $232 million development and lease-up pipeline (6 properties with 1,774 units) – $439 million active multifamily development and lease-up pipeline (12 properties with 3,274 units), post merger Active in both large and secondary markets across Sunbelt region Investment grade rated balance sheet Debt/Market Capitalization of 36% Debt/Gross Assets of 43% Unencumbered asset gross book value $2.2 billion |
 2Q13 results ahead of expectations FFO per diluted share and unit of $1.27, 12% growth over 2Q12 and $0.05 above the midpoint of guidance previously provided. 1 Same store results over 2Q12: – NOI increased 5.5% – Revenue increased 4.4%, supported by a 4.1% increase in average effective rent – Occupancy increased 0.1%, ending the quarter at 96.0% (1) Excludes $5.7 million of merger related expenses. Acquired 2 properties totaling 576 units for $71.1 million and sold 4 properties totaling 1,044 units for $74.0 million. 3 |
 $2.87 $3.00 $3.20 $3.33 $3.55 $3.73 $3.79 $3.77 $3.98 $4.57 $4.93 2003³ 2004 2005 2006 2007 2008 2009 2010 2011 2012 2013E FFO / share $2.34 $2.34 $2.35 $2.38 $2.42 $2.46 $2.46 $2.46 $2.51 $2.64 $2.78 2003 2004 2005 2006 2007 2008 2009 2010 2011 2012 2013E Dividend / share -50 0 50 100 150 200 250 300 350 06/30/03 06/29/04 06/29/05 06/29/06 06/29/07 06/28/08 06/28/09 06/28/10 06/28/11 06/27/12 06/28/13 MAA MSCIUS REIT Index Multifamily peers % Proven strategy and long term outperformance (2) 1Q & 2Q 2013 dividends / share annualized Note: Multifamily peers include AIV, AVB, BRE, CLP, CPT, EQR, ESS, HME, PPS, UDR 2 4 321% 219% 179% (3) Excludes the write-off of original issuance costs for preferred shares redeemed (4) Mid point of 2013E FFO / share guidance 4 3 MAA dividend growth – 10 years MAA FFO growth – 10 years Total return performance – 10 years |
 5 Strategy 5 Build Consistent Growing Cash Flow Reduce Volatility Establish Competitive Strengths Disciplined Capital Deployment Maintain Strong Balance Sheet Strategy Retain ready access to unsecured debt market; retain “balanced” debt strategy Focus on high-growth region and markets Appeal to wide range of rental market Maintain young portfolio Diversify across both large and secondary markets Maintain strong balance sheet; access to capital Maintain organizational stability Maintain disciplined approach to new development Capture significant deal flow; leverage cost of capital and execution capabilities Use scale to drive higher operating margins Attract and retain top-tier talent IRR focused capital deployment model Regional expertise provides in-depth market knowledge Robust due diligence program Maintain investment grade metrics Maintain minimal and very manageable new development exposure |
 Full cycle outperformance MAA has generated higher average growth combined with lower volatility than peers Same store NOI growth 6 MAA average: 3.2% Peer average: 3.1% MAA 2009 trough: (1.8%) (8.0)% (6.0)% (4.0)% (2.0)% 0.0% 2.0% 4.0% 6.0% 8.0% 10.0% 2005 2006 2007 2008 2009 2010 2011 2012 2013 MAA Multifamily peers Peer 2009 trough: (4.7%) Source: Green Street Residential Sector Update – May 30, 2013 Note: Multifamily peers include BRE, CLP, CPT, ESS, HME, PPS, UDR |
 Enhanced diversification across high-growth Sunbelt Region post merger Continued commitment to a portfolio strategy focused on high-growth markets across the Sunbelt Region allocated across both large and secondary markets, to capture superior risk-adjusted performance over the full market cycles Portfolio distribution by total units ¹ less than 2,000 Units 2,000–5,000 Units greater than 5,000 Units Note: Includes all multifamily properties, including stabilized, lease up and joint venture communities (1) Breakdown based on number of total multifamily 2Q13 NOI, including stabilized, lease-up and joint venture communities (at share) Distribution by large markets Large Markets % of Same Store 2Q13 NOI 1 Dallas / Fort Worth 11.5% 2 Raleigh 6.8% 3 Atlanta 6.7% 4 Austin 6.4% 5 Charlotte 6.1% 6 Nashville 4.7% 7 Jacksonville 4.5% 8 Tampa 3.4% 9 Orlando 3.3% 10 Houston 3.1% 61 % of total Distribution by secondary markets Secondary Markets % of Same Store 2Q13 NOI 1 Memphis 3.9% 2 Charleston 3.5% 3 Savannah 3.4% 4 Birmingham 2.7% 5 Richmond 2.6% 6 Greenville 1.9% 7 Jackson 1.7% 8 Little Rock 1.4% 9 Columbus 1.3% 10 Lexington 1.1% 39 % of total Note: Other large markets includes 3 additional MSAs; Other secondary markets includes 27 additional MSAs (2) Distribution based on number of same store multifamily 2Q13 NOI 7 Nevada Arizona Texas Missouri Arkansas Alabama Kentucky Virginia North Carolina South Carolina Georgia Florida Mississippi Tennessee 2 2 |
 Synergy and enhanced value creation potential through merger Significant overlap in asset footprint creates potential for overhead synergies and operating margin improvement Significant overlap in technology to drive and track performance, leading to minimal business disruption Opportunity to improve cost structure by leveraging a combined business platform across a significantly larger asset portfolio; efficiencies from scale Estimated total run-rate annual synergies of $25mm Potential for additional synergies include improved debt costs and opportunities for scale efficiencies Strengthened platform through integration of best practices of both companies Dominant Sunbelt region platform drives superior deal flow and execution capabilities Market Station - Kansas City, MO Colonial Grand at Double Creek - Austin, TX 8 |
 Merger timeline Announcement June 3, 2013 Expected Close September 2013 Full Integration December 2014 April 2014 Identified $25M of synergies: 75% personnel 25% non-personnel Numerous due-diligence site visits Exchange of non-public financial information; extensive due diligence and valuation analysis Pre-announcement review with Rating Agencies; day of announcement up-grade by S&P and reaffirmation of ratings by Moody’s and Fitch Lender consents on $2.6 billion in debt Numerous joint management site visits Final management structure in place Formally launch new corporate identity Estimate 40-50% of synergies realized Consolidated financial reporting and forecasting capabilities fully in place Early integration efforts complete Estimate capturing 70-80% of synergy opportunity Realize 100% of synergy opportunity Full systems integration complete All legacy CLP commercial assets sold 9 |
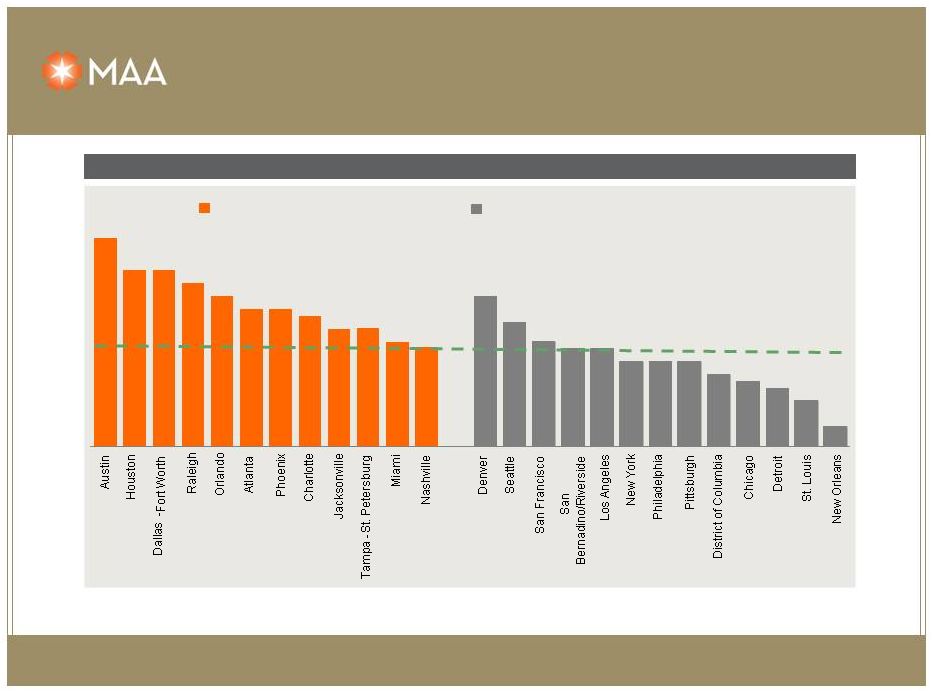 Significant presence in both large and secondary, high growth markets Source: Moody’s Note: Highlighted markets represent 59% of New MAA’s multifamily portfolio (weighted by units) U.S. average: 2.0% Large markets with meaningful presence Major non-MAA markets 10 3.7% 3.2% 3.2% 3.0% 2.8% 2.6%2.6% 2.5% 2.3% 2.3% 2.1% 2.0% 2.8% 2.4% 2.1% 2.0% 2.0% 1.8%1.8%1.8% 1.6% 1.5% 1.4% 1.2% 0.8% 5-year projected employment growth CAGR (%) MAA’s combined new, large markets are on a weighted average basis projected to show 2.8% job growth over the next 5 years vs. U.S. average of 2.0% |
 New MAA will have an enhanced full cycle market focus across the Sunbelt region Top 10 markets by NOI 2Q13 unit count by market % of 2Q13 same store NOI by market 1 2 3 4 5 6 7 8 9 10 MAA DFW Jacksonville Nashville Memphis Houston Atlanta Raleigh Austin Tampa Greenville CLP Charlotte DFW Raleigh Austin Atlanta Orlando Charleston Savannah Birmingham Richmond New MAA DFW Raleigh Atlanta Austin Charlotte Nashville Jacksonville Memphis Charleston Tampa Markets with 5-year projected employment growth above national average 11 54.8% 69.1% 61.0% 45.2% 30.9% 39.0% MAA CLP New MAA Large markets Secondary markets 24,866 24,252 49,118 23,091 10,037 33,128 MAA CLP New MAA Large markets Secondary markets 47,957 34,289 82,246 |
 External growth – acquisition activity Price Cap (000s) Units Rate Age MAA Acquisitions by Year (wholly-owned): 2009 78,300 $ 1,064 6.9% 4 2010 230,050 $ 2,138 6.0% 1 2011 362,515 $ 3,055 5.9% 3 2012 345,075 $ 2,451 5.6% 6 2013 YTD 103,642 $ 886 5.9% 4 1,119,582 $ 9,594 5.9% 4 MAA Dispositions by Year (wholly-owned): 2009 29,800 $ 840 7.0% 27 2010 - $ - 2011 23,950 $ 534 6.5% 27 2012 113,200 $ 2,254 6.8% 23 2013 YTD 74,000 $ 1,044 6.6% 23 240,950 $ 4,672 6.7% 24 12 Active capital redeployment |
 New MAA will have enhanced deal flow opportunities • MAA purchase: Sept. 2011 • MSA: Dallas, TX • Acquisition price: $47mm • Total units: 456 • Year built: 2008 • Occupancy: 96% • MAA purchased: July 2012 • MSA: Atlanta, GA • Acquisition price: $64mm • Total units: 349 • Year built: 2008 • Occupancy: 92% • CLP purchase: March 2013 • MSA: Orlando, FL • Acquisition price: $43mm • Total units: 280 • Year built: 2009 • Occupancy: 95% • CLP purchase: Nov. 2012 • MSA: Dallas, TX • Acquisition price: $43mm • Total units: 306 • Year built: 2006 • Occupancy: 95% 13 Legends at Lowe’s Farm Colonial Reserve at Las Colinas Colonial Grand at Windemere Allure at Brookwood |
 New MAA will maintain a disciplined approach to new development Expected stabilized NOI yield between 7% and 8% Active multifamily development pipeline ($mm, except per unit costs) Total 1,802 $120.0 $122.8 $242.8 $135 Total Expected MSA Units to Date to Complete Total Per Unit Stabilization MAA River's Walk Charleston 270 27.1 $ 6.3 $ 33.4 $ 124 $ 4Q14 220 Riverside Jacksonville 294 10.7 $ 29.7 $ 40.4 $ 137 $ 4Q15 Subtotal: MAA 564 37.8 $ 36.0 $ 73.8 $ 131 $ CLP CR at South End Charlotte 353 38.6 $ 20.7 $ 59.3 $ 168 $ 4Q14 CG at Ayrsley Phase II Charlotte 81 8.3 $ 0.8 $ 9.1 $ 112 $ 4Q13 CG at Randal Lakes Orlando 462 35.7 $ 21.3 $ 57.0 $ 123 $ 1Q15 CG at Lake Mary III Orlando 132 3.8 $ 12.3 $ 16.1 $ 122 $ 2Q14 CG at Bellevue Phase II Nashville 220 4.0 $ 25.3 $ 29.3 $ 133 $ Subtotal: CLP 1,248 90.4 $ 80.4 $ 170.8 $ 131 $ Total 1,812 128.2 $ 116.4 $ 244.6 $ 135 $ Cost Expected Cost 14 |
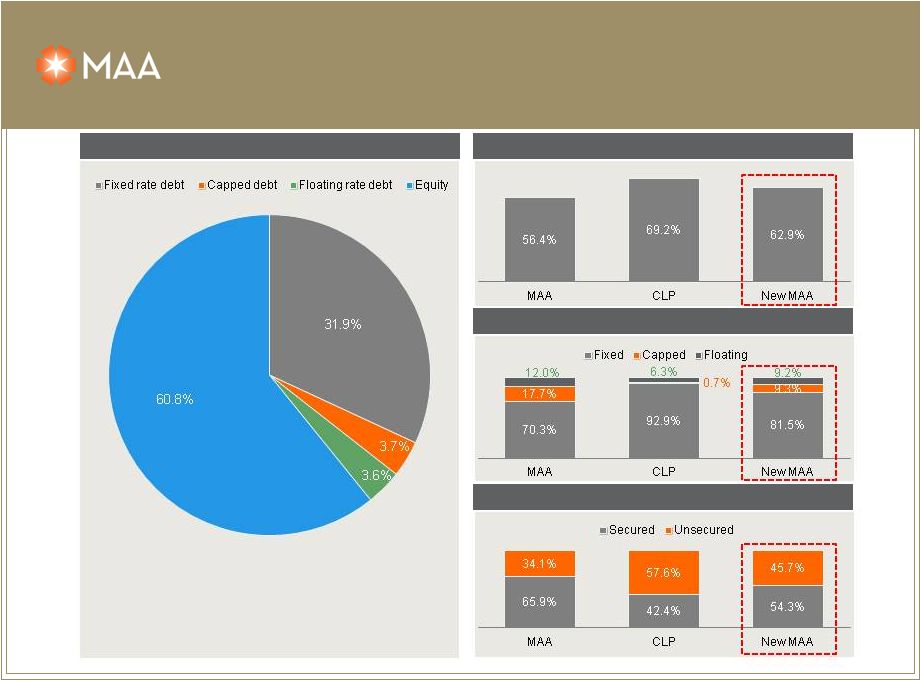 % of unencumbered assets New MAA capital structure 39.2% debt / market capitalization Note: As of 8/1/13. Includes pro rata share of unconsolidated joint venture debt Floating vs. fixed rate debt Unsecured vs. secured debt Strong investment grade balance sheet – capital structure profile 15 |
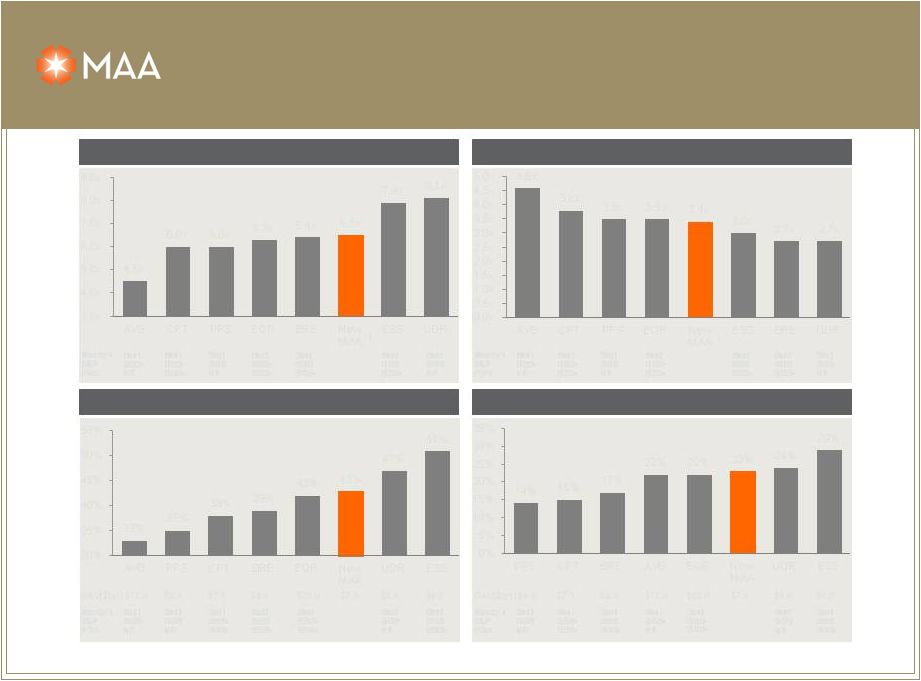 Debt / LTM EBITDA LTM fixed charge coverage ratio Source: Company filings, SNL Financial (1) EBITDA includes $25mm of synergies pro forma for the transaction Debt / gross assets Secured debt / gross assets Moody’s Baa1 BBB BBB+ BBB BBB BBB S&P BBB+ BBB+ Baa1 Baa3 Baa2 Baa2 Baa2 Baa2 Moody’s Baa1 BBB BBB+ BBB BBB BBB S&P BBB+ BBB+ Baa1 Baa3 Baa2 Baa2 Baa2 Baa2 Moody’s Baa1 BBB+ BBB BBB+ BBB BBB S&P BBB BBB+ Baa3 Baa1 Baa2 Baa2 Baa2 Baa2 Moody’s Baa3 BBB BBB+ BBB+ BBB BBB S&P BBB+ BBB Baa1 Baa2 Baa1 Baa2 Baa2 Baa2 1 BBB+ BBB+ BBB+ NR BBB+ Fitch NR NR BBB+ NR BBB+ NR BBB+ Fitch BBB+ NR GAV($bn)$17.3 $3.3 $7.1 $4.3 $28.0 $8.8 $6.2 GAV($bn) $3.3 $7.1 $4.3 $17.3 $28.0 $8.8 $6.2 $7.8 $7.8 NR BBB+ BBB+ BBB+ NR Fitch BBB+ NR NR BBB+ BBB+ BBB+ NR Fitch BBB+ NR Investment grade balance sheet metrics 16 1 4.5x 6.0x 6.0x 6.3x 6.4x 6.5x 7.9x 8.1x 3.0x 4.0x 5.0x 6.0x 7.0x 8.0x 9.0x AVB CPT PPS EQR BRE New MAA ESS UDR 4.6x 3.8x 3.5x 3.5x 3.4x 3.0x 2.7x 2.7x 0.0x 0.5x 1.0x 1.5x 2.0x 2.5x 3.0x 3.5x 4.0x 4.5x 5.0x AVB CPT PPS EQR New MAA ESS BRE UDR 14% 15% 17% 22% 22% 23% 24% 29% 0% 5% 10% 15% 20% 25% 30% 35% PPS CPT BRE AVB EQR New MAA UDR ESS 33% 35% 38% 39% 42% 43% 47% 51% 30% 35% 40% 45% 50% 55% AVB PPS CPT BRE EQR New MAA UDR ESS |
 Opportunity • MAA is currently priced at a multiple and implied cap rate discount to the sector average. • Implies long term same store earnings growth rate is 100bps lower than sector; actual is fully in line with sector • Actual historical results and current position suggest otherwise • MAA’s historical long-term internal same store growth (and overall FFO growth) performance exceeds the sector average; established record of exceeding regional ‘market’ performance levels and sector ‘averages’. Implied 10 Year IRR • MAA outperforms by 100 bps on unleveraged basis with continued cap rate discount. • MAA outperforms by 175 bps on a leveraged basis. 1 • MAA outperforms by 370 bps on a leveraged basis by capturing the sector’s current average cap rate. 17 5.4% 6.4% 3.0% 3.0% 0% 2% 4% 6% 8% 10% Sector Average MAA Market Implied Cap Rate Same Store Growth Total Implied Unleveraged Return Source: Current cap rates from BMO REIT Equity Weekly – July 29, 2013; 2004-2013YTD (1) Represents amplification of outperformance on a margin basis: 50%/50% cash/debt and 5% interest rate. same store growth from Green Street Residential Sector Update – May 30, 2013 |
 Strategy and long-term outlook Optimize cash flow growth through “full-cycle” Support growing and secure dividend Deliver superior long-term risk-adjusted returns Focus on high-growth Sunbelt markets Prudent capital deployment practices Disciplined approach to new development Proactive capital recycling program Build competitive advantages in local markets Develop New MAA brand value 18 |
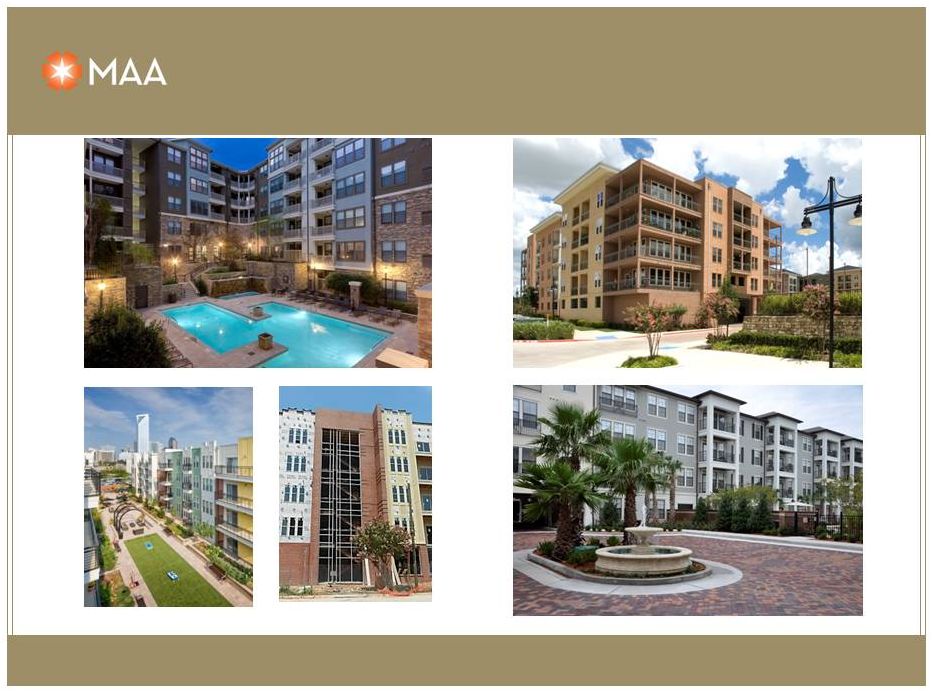 High quality, well located properties in large markets 19 Bella Casita at Las Colinas Tattersall at Tapestry Park Allure at Brookwood 1225 South Church Charlotte, NC Phase I 2010 Acquisition Phase II Development Atlanta, GA 2012 Acquisition Jacksonville, FL 2011 Acquisition Dallas, TX 2010 Acquisition |
 High quality, well located properties in secondary markets 20 Haven at Blanco Rivers Walk Charleston, SC Development Market Station Kansas City, MO 2012 Acquisition San Antonio, TX 2012 Acquisition Ridge at Chenal Valley Little Rock, AR Development |
 Eric Bolton, MAA CEO 901-248-4127 eric.bolton@maac.com Al Campbell, MAA CFO 901-248-4169 al.campbell@maac.com Leslie Wolfgang, MAA Investor Relations 901-248-4126 leslie.wolfgang@maac.com Jennifer Patrick, MAA Investor Relations 901-435-5371 jennifer.patrick@maac.com 21 Certain matters in this presentation may constitute forward-looking statements within the meaning of Section 27-A of the Securities Act of 1933 and Section 21E of the Securities and Exchange Act of 1934. Such statements include, but are not limited to, statements made about anticipated economic and market conditions, expectations for future demographics, the impact of competition, general changes in the apartment industry, expectations for acquisition and joint venture performance, ability to pay dividends and the ability to obtain financing at reasonable rates. Actual results and the timing of certain events could differ materially from those projected in or contemplated by the forward-looking statements due to a number of factors, including a downturn in general economic conditions or the capital markets, competitive factors including overbuilding or other supply/demand imbalances in some or all of our markets, changes in interest rates and other items that are difficult to control such as the impact of legislation, as well as the other general risks inherent in the apartment and real estate businesses. Reference is hereby made to the filings of Mid-America Apartment Communities, Inc., with the Securities and Exchange Commission, including quarterly reports on Form 10-Q, reports on Form 8-K, and its annual report on Form 10-K, particularly including the risk factors contained in the latter filing. |
 Additional Information about the Proposed Merger Transaction and Where to Find It In connection with the proposed transaction, MAA expects to file with the SEC a registration statement on Form S-4 that will include a definitive joint proxy statement of MAA and Colonial Properties Trust that also constitutes a prospectus of MAA. MAA and Colonial Properties Trust also plan to file other relevant documents with the SEC regarding the proposed transaction. INVESTORS ARE URGED TO READ THE JOINT PROXY STATEMENT/PROSPECTUS AND OTHER RELEVANT DOCUMENTS FILED WITH THE SEC IF AND WHEN THEY BECOME AVAILABLE, BECAUSE THEY WILL CONTAIN IMPORTANT INFORMATION. You may obtain a free copy of the definitive joint proxy statement/prospectus and other relevant documents filed by MAA and Colonial Properties Trust with the SEC at the SEC’s website at www.sec.gov. Copies of the documents filed by MAA with the SEC will be available free of charge on MAA’s website at www.maac.com or by contacting MAA Investor Relations at 901-682-6600. Copies of the documents filed by Colonial Properties Trust with the SEC will be available free of charge on Colonial Properties Trust’s website at www.colonialprop.com or by contacting Colonial Properties Trust Investor Relations at 205-250-8700. MAA and Colonial Properties Trust and their respective directors and executive officers and other members of management and employees may be deemed to be participants in the solicitation of proxies in respect of the proposed transaction. You can find information about MAA’s executive officers and directors in MAA’s definitive proxy statement filed with the SEC on March 22, 2013. You can find information about Colonial Properties Trust’s executive officers and directors in Colonial Properties Trust’s definitive proxy statement filed with the SEC on March 13, 2013. Additional information regarding the interests of such potential participants will be included in the joint proxy statement/prospectus and other relevant documents filed with the SEC if and when they become available. You may obtain free copies of these documents from MAA or Colonial Properties Trust using the sources indicated above. This document shall not constitute an offer to sell or the solicitation of an offer to buy any securities, nor shall there be any sale of securities in any jurisdiction in which such offer, solicitation or sale would be unlawful prior to registration or qualification under the securities laws of any such jurisdiction. No offering of securities shall be made except by means of a prospectus meeting the requirements of Section 10 of the U.S. Securities Act of 1933, as amended. 22 |