JPMorgan Funds are distributed by JPMorgan Distribution Services, Inc., which is an affiliate of JPMorgan Chase & Co. Affiliates of JPMorgan Chase & Co. receive fees for providing various services to the funds.
This report is submitted for the general information of the shareholders of the Portfolio. It is not authorized for distribution to prospective investors in the Portfolio unless preceded or accompanied by a prospectus.
The Portfolio files a complete schedule of its portfolio holdings for the first and third quarters of its fiscal year with the SEC on Form N-Q. The Portfolio’s Forms N-Q are available on the SEC’s website at http://www.sec.gov and may be reviewed and copied at the SEC’s Public Reference Room in Washington, DC. Information on the operation of the SEC’s Public Reference Room may be obtained by calling 1-800-SEC-0330. Shareholders may request the Form N-Q without charge by calling 1-800-480-4111 or by visiting the variable insurance portfolio section of the JPMorgan Funds’ website at www.jpmorganfunds.com.
A description of the Portfolio’s policies and procedures with respect to the disclosure of the Portfolio’s holdings is available in the Statement of Additional Information.
A copy of proxy policies and procedures are available without charge upon request by calling 1-800-480-4111 and on the SEC’s website at www.sec.gov. The Trustees have delegated the authority to vote proxies for securities owned by the Portfolio to the Advisor. A copy of the Portfolio’s voting record for the most recent 12-month period ended June 30 is available on the SEC’s website at www.sec.gov or at the Portfolio’s website at www.jpmorganfunds.com no later than August 31 of each year. The Portfolio’s proxy voting record will include, among other things, a brief description of the matter voted on for each portfolio security, and will state how each vote was cast, for example, for or against the proposal.

CONTENTS | President’s Letter | | | | | 1 | | Portfolio Commentary:
| | | | | | | | JPMorgan Insurance Trust Diversified Mid Cap Growth Portfolio | | | | | 2 | | | Schedule of Portfolio Investments | | | | | 4 | | | Statement of Assets and Liabilities | | | | | 7 | | | Statement of Operations | | | | | 8 | | | Statement of Changes in Net Assets | | | | | 9 | | | Financial Highlights | | | | | 10 | | | Notes to Financial Statements | | | | | 12 | | | Trustees | | | | | 16 | | | Officers | | | | | 18 | | | Schedule of Shareholder Expenses | | | | | 20 | |
HIGHLIGHTS | • | | U.S. stocks generally positive in first half of 2006 |
| • | | Investors tried to predict interest rate hikes |
| • | | Gross domestic product (GDP) moved sharply higher |
| • | | Market volatility expected until interest rate picture is clearer |
Effective May 1, 2006, the existing shares of the Portfolio were designated as Class 1 shares. The performance, expenses and other information shown in this report for the Portfolio is information applicable to the Class 1 shares. Investments in the Portfolio are not bank deposits or obligations of, or guaranteed or endorsed by, any bank and are not insured or guaranteed by the FDIC, the Federal Reserve Board or any other government agency. You could lose money if you sell when the Portfolio’s share price is lower than when you invested. Past performance is no guarantee for future performance. The general market views expressed in this report are opinions based on current market conditions and are subject to change without notice. These views are not intended to predict the future performance of the Portfolio or the securities markets. References to specific securities and their issuers are for illustrative purposes only and are not intended to be, and should not be interpreted as, recommendations to purchase or sell such securities. Such views are not meant as investment advice and may not be relied on as an indication of trading intent on behalf of any Portfolio. This Portfolio is intended to be a funding vehicle for variable annuity contracts and variable life insurance policies (collectively “Policies”) offered by separate accounts of participating insurance companies. Portfolio shares are also offered to qualified pension and retirement plans (“Eligible Plans”). Individuals may not purchase shares directly from the Portfolio. Prospective investors should refer to the Portfolio’s prospectus for a discussion of the Portfolio’s investment objective, strategies and risks. Call JPMorgan Funds Service Center at 1-800-480-4111 for a prospectus containing more complete information about a Portfolio including management fees and other expenses. Please read it carefully before investing.
PRESIDENT’S LETTER
JULY 14, 2006 (Unaudited)
Dear Shareholder: We are pleased to present this semi-annual report for the JPMorgan Insurance Trust Diversified Mid Cap Growth Portfolio for the six months ended June 30, 2006. Inside, you’ll find information detailing the performance of the Portfolio, along with a report from the portfolio manager. | | | |
“Despite repeated interest rate hikes and surging energy prices, the U.S. economy was surprisingly resilient.”
|
All Eyes on the Federal Reserve Board While the U.S. stock market weakened late in the reporting period, overall it produced positive returns for the first half of the calendar year. The equity market kicked off 2006 with investors encouraged by overall strong economic growth and positive corporate earnings. However, the last two months were marked by increased volatility. A great deal of the driving forces behind the market’s ups and downs resulted from the actions of the Federal Open Market Committee (FOMC). In February 2006, Ben Bernanke assumed the role of Federal Reserve (Fed) Board Chairman, replacing long-time fixture Alan Greenspan. The transition was less than smooth for investors, as they attempted to predict the FOMC’s future actions regarding interest rates. The FOMC’s statements first hinted that there may be a break from rate increases and then telegraphed additional rate hikes due to fears of rising inflation. In late June, the FOMC raised short-term rates for the 17th consecutive time, bringing the fed funds target rate to 5.25% — its highest level in more than five years. Despite repeated interest rate hikes and surging energy prices, the U.S. economy was surprisingly resilient. After gross domestic product (GDP) fell in the fourth quarter, the economy moved sharply higher in the first quarter of 2006. During this time, GDP rose 5.6%, its highest reading since the third quarter of 2003. Stocks Produce Positive Results The broad stock market, as measured by the S&P 500 Index, returned 2.71% for the six months ended June 30, 2006. After a fast start to the year, the market took a step backwards in mid-May on fears that additional rate hikes may adversely affect the economic expansion and temper corporate profits. Looking more closely at the market over the six months, small- and mid-cap stocks outperformed their large-cap counterparts, with the Russell Midcap, Russell 2000 and Russell 1000 Indexes returning 4.84%, 8.21% and 2.76%, respectively. However, as many market pundits have anticipated, large-cap stocks generated relatively better results late in the period. After a prolonged period of lagging smaller-cap stocks, many large caps appeared attractively valued and may be better equipped to handle more moderate economic growth. Outlook Looking ahead, the markets could continue to experience periods of volatility until the FOMC’s interest rate stance is better understood. Coinciding with its latest rate hike in June, the Fed said: “The extent and timing of any additional firming...will depend on the evolution of the outlook for both inflation and economic growth, as implied by incoming information.” Investors will likely be closely monitoring the economic “tea leaves” in an attempt to ascertain the FOMC’s next move. On behalf of us all at JPMorgan Asset Management, thank you for your confidence and the continued trust you have placed in us. We look forward to serving your investment needs for many years to come. Should you have any questions, please feel free to contact the JPMorgan Funds Service Center at 1-800-480-4111. George C.W. Gatch
President
JPMorgan Funds JUNE 30, 2006 JPMORGAN INSURANCE TRUST 1
JPMorgan Insurance Trust Diversified Mid Cap Growth Portfolio
(formerly JPMorgan Investment Trust Mid Cap Growth Portfolio)
PORTFOLIO COMMENTARY
AS OF JUNE 30, 2006 (Unaudited)
PORTFOLIO FACTS
| Portfolio Inception | | | | August 1, 1994 | | Fiscal Year End | | | | December 31 | | Net Assets as of 6/30/2006 | | | | $176,336,738 | | Primary Benchmark | | | | Russell Midcap
Growth Index |
Q. HOW DID THE PORTFOLIO PERFORM? A. | | The JPMorgan Insurance Trust Diversified Mid Cap Growth Portfolio, which seeks to provide growth of capital and, secondarily, current income by investing primarily in equity securities, returned 4.53% over the six months ended June 30, 2006, compared to the 2.56% return for the Russell Midcap Growth Index over the same period.* |
Q. WHY DID THE PORTFOLIO PERFORM THIS WAY? A. | | The Portfolio outperformed its benchmark for the period due primarily to stock selection in the information technology, consumer discretionary and financial sectors. Stock selection in the healthcare and industrial sectors as well as an underweight in materials detracted from performance. |
| | Alliance Data Systems Corp., a credit and marketing services provider, was among the top contributors for the period. The company notched several wins, including agreements to provide co-branded credit cards with specialty retailers New York & Company and Goody’s. In addition, the company reported first-quarter profits significantly ahead of expectations due to strong performance from its transaction services business. All elements of the company were strong, including organic growth of over 20% in its Canadian Air Miles Reward Program. Also contributing to performance was Amphenol Corp., a maker of electrical connectors used in aerospace applications, computers and networking equipment, to name a few. The company experienced strong results in all of its business segments, especially wireless handsets and broadband communication networks. In addition, recently acquired Amphenol TCS, a supplier of high-speed, high-density, printed circuit board interconnect products, showed strong progress and a much higher level of earnings accretion than originally anticipated. |
| | On the negative side, Jabil Circuit Inc., a global leader in the electronic manufacturing services (EMS) industry, was among the top detractors for the period. The company announced that its fiscal third-quarter earnings would fall shy of expectations. Investors feared that the earnings shortfall, driven by operational issues, would continue into the next quarter and likely beyond. PDL BioPharma Inc., a biotechnology company, was another significant detractor. The company reported first-quarter earnings for 2006 that were significantly lower than anticipated. The company lowered 2006 revenue expectations and raised research and development (R&D) expense guidance. |
Q. | | HOW WAS THE PORTFOLIO MANAGED? |
A. | | We employ a bottom-up approach to stock selection, constructing portfolios based on company fundamentals, quantitative screening and proprietary fundamental analysis. We look for dominant franchises with predictable business models deemed capable of achieving sustained growth. Potential investments are subjected to rigorous financial analysis and a disciplined approach to valuation. We seek to maintain sector diversification in the Portfolio by avoiding large allocations that are contingent on macroeconomic or sector trends. |
PORTFOLIO COMPOSITION**
| Information Technology | | | | | 24.4 | % | | Industrials | | | | | 19.5 | | | Health Care | | | | | 15.8 | | | Consumer Discretionary | | | | | 15.7 | | | Financials | | | | | 10.8 | | | Energy | | | | | 8.8 | | | Telecommunication Services | | | | | 2.5 | | | Materials | | | | | 1.3 | | | Short-Term Investments | | | | | 1.5 | | | Investments of Cash Collateral for Securities on Loan | | | | | 11.4 | |
TOP TEN EQUITY HOLDINGS OF THE PORTFOLIO**
| 1. | | | | West Corp. | | | 3.0 | % | | 2. | | | | Amphenol Corp., Class A | | | 2.8 | | | 3. | | | | Alliance Data Systems Corp. | | | 2.6 | | | 4. | | | | DaVita, Inc. | | | 2.0 | | | 5. | | | | NII Holdings, Inc. | | | 1.7 | | | 6. | | | | Lazard Ltd., Class A (Bermuda) | | | 1.6 | | | 7. | | | | Omnicare, Inc. | | | 1.5 | | | 8. | | | | Scientific Games Corp., Class A | | | 1.4 | | | 9. | | | | BEA Systems, Inc. | | | 1.4 | | | 10. | | | | Celgene Corp. | | | 1.4 | |
| * | | The advisor seeks to achieve the Portfolio’s objective. There can be no guarantee it will be achieved. |
| ** | | Percentages indicated are based upon net assets as of June 30, 2006. The portfolio’s composition is subject to change. |
2 JPMORGAN INSURANCE TRUST JUNE 30, 2006
AVERAGE ANNUAL TOTAL RETURNS AS OF JUNE 30, 2006
| | | | INCEPTION DATE
| | 1 YEAR
| | 5 YEAR
| | 10 YEAR
|
|---|
DIVERSIFIED MID CAP GROWTH PORTFOLIO | | | | | 8/1/94 | | | | 12.55 | % | | | 4.92 | % | | | 11.68 | % |
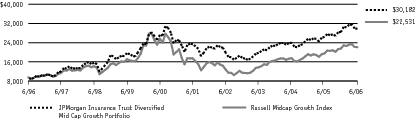
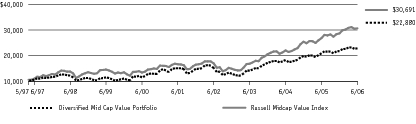
Source: Lipper, Inc. The performance quoted is past performance and is not a guarantee of future results. Mutual funds are subject to certain market risk. Investment returns and principal value of an investment will fluctuate so that an investor’s shares, when redeemed, may be worth more or less than their original cost. Current performance may be higher or lower than the performance data shown. For up-to-date month-end performance information please call 1-800-480-4111. The graph illustrates comparative performance for $10,000 invested in the JPMorgan Insurance Trust Mid Cap Growth Portfolio and the Russell Midcap Growth Index. The performance of the Portfolio assumes reinvestment of all dividends. The performance of the index does not include fees and expenses attributable to the Portfolio and has been adjusted to reflect reinvestment of all dividends and capital gains of the securities included in the benchmark. The Russell Midcap Growth Index measures the performance of mid cap companies with higher price-to-book ratios and higher forecasted growth values. Investors cannot invest directly in an index. The performance does not reflect any charges imposed by the Policies or Eligible Plans. If these charges were included, the returns would be lower than shown. Performance may also reflect the waiver and reimbursement of the Portfolio’s fees/expenses for certain periods since the inception date. Without these waivers and reimbursements, performance would have been lower. JUNE 30, 2006 JPMORGAN INSURANCE TRUST 3
JPMorgan Insurance Trust Diversified Mid Cap Growth Portfolio
(formerly JPMorgan Investment Trust Mid Cap Growth Portfolio)
SCHEDULE OF PORTFOLIO INVESTMENTS
AS OF JUNE 30, 2006 (Unaudited)
SHARES
|
|
|
| SECURITY DESCRIPTION
|
| VALUE ($)
|
|---|
Long-Term Investments — 98.8% | | | | | | Common Stocks — 98.8% | | | | | | Aerospace & Defense — 1.9% | | 21,350 | | | | Precision Castparts Corp. | | | 1,275,876 | | | 37,650 | | | | Rockwell Collins, Inc. | | | 2,103,506 | | | | | | | | | | 3,379,382 | | | | | | | Air Freight & Logistics — 1.0% | | 34,600 | | | | C.H. Robinson Worldwide, Inc. | | | 1,844,180 | | | | | | | Airlines — 0.9% | | 60,550 | | | | Skywest, Inc. | | | 1,501,640 | | | | | | | Biotechnology — 1.9% | | 51,250 | | | | Celgene Corp. (a) | | | 2,430,788 | | | 27,400 | | | | Vertex Pharmaceuticals, Inc. (a) | | | 1,005,854 | | | | | | | | | | 3,436,642 | | | | | | | Capital Markets — 6.0% | | 15,450 | | | | Affiliated Managers Group, Inc. (a) (c) | | | 1,342,450 | | | 98,300 | | | | E*Trade Financial Corp. (a) | | | 2,243,206 | | | 27,550 | | | | Investment Technology Group, Inc. (a) | | | 1,401,193 | | | 70,337 | | | | Lazard Ltd., Class A (Bermuda) | | | 2,841,615 | | | 15,250 | | | | Legg Mason, Inc. | | | 1,517,680 | | | 34,600 | | | | T. Rowe Price Group, Inc. | | | 1,308,226 | | | | | | | | | | 10,654,370 | | | | | | | Chemicals — 1.3% | | 96,750 | | | | Rockwood Holdings, Inc. (a) | | | 2,226,218 | | | | | | | Commercial Banks — 0.8% | | 18,000 | | | | Zions Bancorp | | | 1,402,920 | | | | | | | Commercial Services & Supplies — 7.0% | | 35,100 | | | | Brady Corp., Class A | | | 1,293,084 | | | 12,800 | | | | Corporate Executive Board Co. | | | 1,282,560 | | | 17,500 | | | | Corrections Corp. of America (a) | | | 926,450 | | | 107,800 | | | | Steelcase, Inc. | | | 1,773,310 | | | 27,400 | | | | Stericycle, Inc. (a) (c) | | | 1,783,740 | | | 110,726 | | | | West Corp. (a) | | | 5,304,883 | | | | | | | | | | 12,364,027 | | | | | | | Communications Equipment — 1.2% | | 35,700 | | | | Adtran, Inc. (c) | | | 800,751 | | | 32,000 | | | | Harris Corp. | | | 1,328,320 | | | | | | | | | | 2,129,071 | | | | | | | Computers & Peripherals — 4.0% | | 55,600 | | | | NCR Corp. (a) | | | 2,037,184 | | | 52,000 | | | | Network Appliance, Inc. (a) | | | 1,835,600 | | | 80,200 | | | | Seagate Technology (Cayman Islands) (a) | | | 1,815,728 | | | 318,500 | | | | Sun Microsystems, Inc. (a) | | | 1,321,775 | | | | | | | | | | 7,010,287 | | | | | | | Consumer Finance — 1.2% | | 73,850 | | | | AmeriCredit Corp. (a) (c) | | | 2,061,892 | | | | | | | Diversified Consumer Services — 1.5% | | 20,300 | | | | ITT Educational Services, Inc. (a) | | | 1,335,943 | | | 30,200 | | | | Weight Watchers International, Inc. | | | 1,234,878 | | | | | | | | | | 2,570,821 | | | | | | | Diversified Financial Services — 0.7% | | 18,900 | | | | NYSE Group, Inc.(a) (c) | | | 1,294,272 | | | | | | | Electrical Equipment — 2.1% | | 54,700 | | | | General Cable Corp. (a) | | | 1,914,500 | | | 38,350 | | | | Roper Industries, Inc. | | | 1,792,862 | | | | | | | | | | 3,707,362 | | | | | | | Electronic Equipment & Instruments — 3.7% | | 89,350 | | | | Amphenol Corp., Class A | | | 5,000,026 | | | 63,050 | | | | Jabil Circuit, Inc. | | | 1,614,080 | | | | | | | | | | 6,614,106 | | | | | | | Energy Equipment & Services — 5.5% | | 33,950 | | | | BJ Services Co. | | | 1,264,977 | | | 40,500 | | | | ENSCO International, Inc. | | | 1,863,810 | | | 25,100 | | | | FMC Technologies, Inc. (a) | | | 1,693,246 | | | 27,200 | | | | Grant Prideco, Inc. (a) | | | 1,217,200 | | | 25,100 | | | | National Oilwell Varco, Inc. (a) | | | 1,589,332 | | | 13,300 | | | | Noble Corp. | | | 989,786 | | | 22,000 | | | | Tidewater, Inc. | | | 1,082,400 | | | | | | | | | | 9,700,751 | | | | | | | Health Care Equipment & Supplies — 1.9% | | 29,400 | | | | Advanced Medical Optics, Inc. (a) (c) | | | 1,490,580 | | | 6,500 | | | | Hologic, Inc. (a) (c) | | | 320,840 | | | 35,300 | | | | Mentor Corp. (c) | | | 1,535,550 | | | | | | | | | | 3,346,970 | | | | | | | Health Care Providers & Services — 6.8% | | 35,050 | | | | Aetna, Inc. | | | 1,399,547 | | | 29,961 | | | | Caremark Rx, Inc. | | | 1,494,155 | | | 31,782 | | | | Coventry Health Care, Inc. (a) | | | 1,746,103 | | | 70,400 | | | | DaVita, Inc. (a) | | | 3,498,880 | | | 22,000 | | | | Medco Health Solutions, Inc. (a) | | | 1,260,160 | | | 54,500 | | | | Omnicare, Inc. | | | 2,584,390 | | | | | | | | | | 11,983,235 | | | | | | | Health Care Technology — 1.2% | | 22,700 | | | | Cerner Corp. (a) | | | 842,397 | | | 49,300 | | | | Per-Se Technologies, Inc. (a) (c) | | | 1,241,374 | | | | | | | | | | 2,083,771 | |
SEE NOTES TO FINANCIAL STATEMENTS.
4 JPMORGAN INSURANCE TRUST JUNE 30, 2006
SHARES
|
|
|
| SECURITY DESCRIPTION
|
| VALUE ($)
|
|---|
Long-Term Investments — Continued | | | | | | Hotels, Restaurants & Leisure — 5.3% | | 34,000 | | | | Four Seasons Hotels, Inc. (Canada) (c) | | | 2,088,960 | | | 26,450 | | | | Panera Bread Co., Class A (a) | | | 1,778,498 | | | 36,050 | | | | Royal Caribbean Cruises Ltd. (c) | | | 1,378,912 | | | 71,600 | | | | Scientific Games Corp., Class A (a) | | | 2,550,392 | | | 20,750 | | | | Wynn Resorts Ltd. (a) (c) | | | 1,520,975 | | | | | | | | | | 9,317,737 | | | | | | | Insurance — 2.1% | | 18,800 | | | | Everest Re Group Ltd. (Bermuda) | | | 1,627,516 | | | 45,100 | | | | Hanover Insurance Group, Inc. (The) | | | 2,140,446 | | | | | | | | | | 3,767,962 | | | | | | | IT Services — 4.2% | | 77,550 | | | | Alliance Data Systems Corp. (a) | | | 4,561,491 | | | 28,300 | | | | CheckFree Corp. (a) | | | 1,402,548 | | | 29,300 | | | | MasterCard, Inc., Class A (a) (c) | | | 1,406,400 | | | | | | | | | | 7,370,439 | | | | | | | Leisure Equipment & Products — 0.8% | | 32,500 | | | | Pool Corp. (c) | | | 1,417,975 | | | | | | | Life Sciences Tools & Services — 1.1% | | 31,600 | | | | Covance, Inc. (a) | | | 1,934,552 | | | | | | | Machinery — 2.8% | | 34,400 | | | | ITT Industries, Inc. | | | 1,702,800 | | | 30,850 | | | | Oshkosh Truck Corp. | | | 1,465,992 | | | 21,700 | | | | Parker-Hannifin Corp. | | | 1,683,920 | | | | | | | | | | 4,852,712 | | | | | | | Marine — 0.8% | | 22,800 | | | | American Commercial Lines, Inc. (a) | | | 1,373,700 | | | | | | | Oil, Gas & Consumable Fuels — 3.3% | | 46,300 | | | | Consol Energy, Inc. | | | 2,163,136 | | | 28,850 | | | | Newfield Exploration Co. (a) | | | 1,411,919 | | | 33,950 | | | | Southwestern Energy Co. (a) | | | 1,057,882 | | | 68,300 | | | | Talisman Energy, Inc. (Canada) | | | 1,193,884 | | | | | | | | | | 5,826,821 | | | | | | | Pharmaceuticals — 2.9% | | 45,850 | | | | Adams Respiratory Therapeutics, Inc. (a) (c) | | | 2,045,827 | | | 12,200 | | | | Allergan, Inc. | | | 1,308,572 | | | 40,150 | | | | Shire Pharmaceuticals Group plc ADR (United Kingdom) | | | 1,775,834 | | | | | | | | | | 5,130,233 | | | | | | | Road & Rail — 2.5% | | 23,700 | | | | Con-way, Inc. | | | 1,372,941 | | | 62,750 | | | | J.B.Hunt Transport Services, Inc. | | | 1,563,102 | | | 29,100 | | | | Norfolk Southern Corp. | | | 1,548,702 | | | | | | | | | | 4,484,745 | | | | | | | Semiconductors & Semiconductor Equipment — 5.7% | | 25,300 | | | | Advanced Micro Devices, Inc. (a) | | | 617,826 | | | 35,200 | | | | Broadcom Corp., Class A (a) | | | 1,057,760 | | | 114,150 | | | | Integrated Device Technology, Inc. (a) | | | 1,618,647 | | | 34,050 | | | | KLA-Tencor Corp. | | | 1,415,459 | | | 37,000 | | | | Linear Technology Corp. | | | 1,239,130 | | | 21,900 | | | | Marvell Technology Group Ltd. (Bermuda) (a) | | | 970,827 | | | 54,015 | | | | Microchip Technology, Inc. | | | 1,812,203 | | | 58,100 | | | | Nvidia Corp. (a) | | | 1,236,949 | | | | | | | | | | 9,968,801 | | | | | | | Software — 5.6% | | 42,750 | | | | Adobe Systems, Inc. (a) | | | 1,297,890 | | | 48,250 | | | | Amdocs Ltd. (United Kingdom) (a) | | | 1,765,950 | | | 193,600 | | | | BEA Systems, Inc. (a) | | | 2,534,224 | | | 44,800 | | | | Citrix Systems, Inc. (a) | | | 1,798,272 | | | 73,000 | | | | McAfee, Inc. (a) (c) | | | 1,771,710 | | | 33,200 | | | | Red Hat, Inc. (a) | | | 776,880 | | | | | | | | | | 9,944,926 | | | | | | | Specialty Retail — 6.6% | | 40,450 | | | | AnnTaylor Stores Corp. (a) | | | 1,754,721 | | | 68,000 | | | | Circuit City Stores, Inc. | | | 1,850,960 | | | 37,200 | | | | Dick’s Sporting Goods, Inc. (a) | | | 1,473,120 | | | 46,400 | | | | GameStop Corp., Class A (a) (c) | | | 1,948,800 | | | 65,100 | | | | Petsmart, Inc. | | | 1,666,560 | | | 71,400 | | | | TJX Cos., Inc. | | | 1,632,204 | | | 23,900 | | | | Tractor Supply Co. (a) | | | 1,320,953 | | | | | | | | | | 11,647,318 | | | | | | | Textiles, Apparel & Luxury Goods — 1.5% | | 43,100 | | | | Coach, Inc. (a) | | | 1,288,690 | | | 23,750 | | | | Polo Ralph Lauren Corp. | | | 1,303,875 | | | | | | | | | | 2,592,565 | | | | | | | Trading Companies & Distributors — 0.5% | | 22,700 | | | | GATX Corp. | | | 964,750 | | | | | | | Wireless Telecommunication Services — 2.5% | | 52,350 | | | | NII Holdings, Inc. (a) | | | 2,951,493 | | | 35,300 | | | | Rogers Communications, Inc. (Canada), Class B | | | 1,426,120 | | | | | | | | | | 4,377,613 | | | | | | | Total Common Stocks
(Cost $155,093,910) | | | 174,284,766 | |
SEE NOTES TO FINANCIAL STATEMENTS.
JUNE 30, 2006 JPMORGAN INSURANCE TRUST 5
JPMorgan Insurance Trust Diversified Mid Cap Growth Portfolio
(formerly JPMorgan Investment Trust Mid Cap Growth Portfolio)
SCHEDULE OF PORTFOLIO INVESTMENTS
AS OF JUNE 30, 2006 (Unaudited) (continued)
SHARES
|
|
|
| SECURITY DESCRIPTION
|
| VALUE ($)
|
|---|
Short-Term Investment — 1.5% | | | | | | Investment Company — 1.5% | | 2,651,843 | | | | JPMorgan Liquid Assets Money Market
Fund (b) (m)
(Cost $2,651,843) | | | 2,651,843 | |
PRINCIPAL
AMOUNT($)
|
|
|
|
|
|
|
|---|
Investments of Cash Collateral for Securities on Loan — 11.4% | | | | | | Certificates of Deposit — 1.5% | | 1,400,000 | | | | Deutsche Bank New York, | | | | | | | | | | FRN, 5.41%, 01/22/08 | | | 1,400,000 | | | 1,299,317 | | | | Societe Generale, New York, | | | | | | | | | | FRN, 5.26%, 06/20/07 | | | 1,299,317 | | | | | | | | | | 2,699,317 | | | | | | | Corporate Notes — 5.6% | | 1,500,000 | | | | American Express Credit Corp., | | | | | | | | | | FRN, 5.21%, 01/15/08 | | | 1,500,000 | | | 750,000 | | | | Banque Federative Du Credit, | | | | | | | | | | FRN, 5.30%, 07/13/07 | | | 750,000 | | | 1,500,339 | | | | Beta Finance, Inc., | | | | | | | | | | FRN, 5.38%, 03/15/07 | | | 1,500,339 | | | 1,600,000 | | | | CDC Financial Products Inc., | | | | | | | | | | FRN, 5.41%, 07/31/06 | | | 1,600,000 | | | 1,200,000 | | | | Citigroup Global Markets, Inc. | | | | | | | | | | FRN, 5.38%, 07/07/06 | | | 1,200,000 | | | 262,487 | | | | Citigroup Global Markets Holding Inc., | | | | | | | | | | FRN, 5.41%, 12/12/06 | | | 262,487 | | | 1,000,090 | | | | Links Finance LLC, | | | | | | | | | | FRN, 5.36%, 10/06/06 | | | 1,000,090 | | | 486,577 | | | | MBIA Global Funding LLC, | | | | | | | | | | FRN, 5.42%, 01/26/07 | | | 486,577 | | | 1,500,000 | | | | Unicredito Italiano Bank plc, | | | | | | | | | | FRN, 5.16%, 07/31/07 | | | 1,500,000 | | | | | | | | | | 9,799,493 | | | | | | | Repurchase Agreements — 4.3% | | 3,747,238 | | | | Bank of America Securities LLC, 5.32%, dated 6/30/06, due 07/03/06, repurchase price $3,748,899,
collateralized by U.S. Government Agency Mortgages. | | | 3,747,238 | | | 1,250,000 | | | | Lehman Brothers, Inc., 5.32%, dated 6/30/06, due 07/03/06, repurchase price $1,250,554,
collateralized by U.S. Government Agency Mortgages. | | | 1,250,000 | | | 1,250,000 | | | | Morgan Stanley, 5.33%, dated 6/30/06, due 07/03/06, repurchase price $1,250,555, collateralized by
U.S. Government Agency Mortgages. | | | 1,250,000 | | | 1,250,000 | | | | UBS Securities LLC, 5.32%, dated 6/30/06, due 07/03/06, repurchase price $1,250,554, collateralized
by U.S. Government Agency Mortgages. | | | 1,250,000 | | | | | | | | | | 7,497,238 | | | | | | | Total Investments of Cash Collateral for Securities on Loan
(Cost $19,996,048) | | | 19,996,048 | | | | | | | Total Investments — 111.7%
(Cost $177,741,801) | | | 196,932,657 | | | | | | | Liabilities in Excess of Other Assets — (11.7)% | | | (20,595,919 | ) | | | | | | NET ASSETS — 100.0% | | $ | 176,336,738 | |
____________
Percentages indicated are based on net assets. | (a) | — | Non-income producing security. |
| (b) | — | Investment in affiliate. Money market fund registered under the Investment Company Act of 1940, as amended, and advised by JPMorgan Investment Advisors Inc. |
| (c) | — | Security, or a portion of the security, has been delivered to a counterparty as part of a security lending transaction. |
| (m) | — | All or a portion of this security is segregated for current or potential holdings of futures, swaps, options, TBA, when-issued securities, delayed delivery securities, and reverse repurchase agreements. |
| ADR | — | American Depositary Receipt |
| FRN | — | Floating Rate Note. The rate shown is the rate in effect as of June 30, 2006. |
SEE NOTES TO FINANCIAL STATEMENTS.
6 JPMORGAN INSURANCE TRUST JUNE 30, 2006
STATEMENT OF ASSETS AND LIABILITIES
AS OF JUNE 30, 2006 (Unaudited)
|
|
|
| Diversified Mid Cap
Growth Portfolio
|
|---|
ASSETS: | | | | | | | | Investments in non-affiliates, at value | | | | $ | 194,280,814 | | | Investments in affiliates, at value | | | | | 2,651,843 | | | Total investment securities, at value | | | | | 196,932,657 | | | Cash | | | | | 9,559 | | | Receivables: | | | | | | | | Investment securities sold | | | | | 1,079,783 | | | Portfolio shares sold | | | | | 15,193 | | | Interest and dividends | | | | | 49,571 | | | Prepaid expenses and other assets | | | | | 53,195 | | | Total Assets | | | | | 198,139,958 | | | | LIABILITIES: | | | | | | | | Payables: | | | | | | | | Investment securities purchased | | | | | 1,570,569 | | | Collateral for securities lending program | | | | | 19,996,048 | | | Portfolio shares redeemed | | | | | 97,511 | | | Accrued liabilities: | | | | | | | | Investment advisory fees | | | | | 92,895 | | | Administration fees | | | | | 14,590 | | | Custodian and accounting fees | | | | | 6,121 | | | Trustees’ and Officers’ fees | | | | | 78 | | | Other | | | | | 25,408 | | | Total Liabilities | | | | | 21,803,220 | | | Net Assets | | | | $ | 176,336,738 | | | | NET ASSETS: | | | | | | | | Paid in capital | | | | $ | 143,509,301 | | | Accumulated undistributed (distributions in excess of) net investment income | | | | | 169,404 | | | Accumulated net realized gains (losses) | | | | | 13,467,177 | | | Net unrealized appreciation (depreciation) | | | | | 19,190,856 | | | Total Net Assets | | | | $ | 176,336,738 | | | | | Outstanding units of beneficial interest (shares) (unlimited amount authorized, no par value) | | | | | 8,837,160 | | | Net asset value, offering and redemption price per share | | | | $ | 19.95 | | | | | Cost of investments | | | | $ | 177,741,801 | | | Market value of securities on loan | | | | $ | 19,764,002 | |
SEE NOTES TO FINANCIAL STATEMENTS.
JUNE 30, 2006 JPMORGAN INSURANCE TRUST 7
STATEMENT OF OPERATIONS
FOR THE SIX MONTHS ENDED JUNE 30, 2006 (Unaudited)
|
|
|
|
Diversified Mid Cap
Growth Portfolio
|
|---|
INVESTMENT INCOME: | | | | | | | | Dividend income | | | | $ | 875,740 | | | Dividend income from affiliates (a) | | | | | 70,248 | | | Income from securities lending (net) | | | | | 82,427 | | | Foreign taxes withheld | | | | | (1,000 | ) | | Total investment income | | | | | 1,027,415 | | | | EXPENSES: | | | | | | | | Investment advisory fees | | | | | 607,153 | | | Administration fees | | | | | 122,871 | | | Custodian and accounting fees | | | | | 12,475 | | | Professional fees | | | | | 27,070 | | | Trustees’ and Officers’ fees | | | | | 1,479 | | | Transfer agent fees | | | | | 31,291 | | | Printing and mailing costs | | | | | 38,781 | | | Other | | | | | 10,110 | | | Total expenses | | | | | 851,230 | | | Less earnings credits | | | | | (316 | ) | | Net expenses | | | | | 850,914 | | | Net investment income (loss) | | | | | 176,501 | | | | REALIZED/UNREALIZED GAINS (LOSSES): | | | | | | | | Net realized gain (loss) on transactions from investments | | | | | 13,845,734 | | | Change in net unrealized appreciation (depreciation) of investments | | | | | (5,269,323 | ) | | Net realized/unrealized gains (losses) | | | | | 8,576,411 | | | Change in net assets resulting from operations | | | | $ | 8,752,912 | |
| (a) | | Includes reimbursements of investment advisory and administration fees. See Fees and Other Transactions with Affiliates in the Notes to Financial Statements. |
SEE NOTES TO FINANCIAL STATEMENTS.
8 JPMORGAN INSURANCE TRUST JUNE 30, 2006
STATEMENT OF CHANGES IN NET ASSETS
FOR THE PERIODS INDICATED
| | | | Diversified
Mid Cap Growth Portfolio
| |
|---|
|
|
|
| Six Months
Ended
6/30/2006
(Unaudited)
|
| Year Ended
12/31/2005
|
|---|
CHANGE IN NET ASSETS RESULTING FROM OPERATIONS: | | | | | | | | | | | | Net investment income (loss) | | | | $ | 176,501 | | | $ | (677,416 | ) | | Net realized gain (loss) | | | | | 13,845,734 | | | | 34,053,459 | | | Change in net unrealized appreciation (depreciation) | | | | | (5,269,323 | ) | | | (13,975,622 | ) | | Change in net assets resulting from operations | | | | | 8,752,912 | | | | 19,400,421 | | | | DISTRIBUTIONS TO SHAREHOLDERS: | | | | | | | | | | | | From net realized gains | | | | | (5,397,317 | ) | | | — | | | | CHANGE IN NET ASSETS FROM CAPITAL TRANSACTIONS: | | | | | | | | | | | | Proceeds from shares issued | | | | | 7,411,865 | | | | 13,158,822 | | | Dividends reinvested | | | | | 5,397,317 | | | | — | | | Cost of shares redeemed | | | | | (24,301,968 | ) | | | (44,927,766 | ) | | Change in net assets from capital transactions | | | | | (11,492,786 | ) | | | (31,768,944 | ) | | | NET ASSETS: | | | | | | | | | | | | Change in net assets | | | | | (8,137,191 | ) | | | (12,368,523 | ) | | Beginning of period | | | | | 184,473,929 | | | | 196,842,452 | | | End of period | | | | $ | 176,336,738 | | | $ | 184,473,929 | | | Accumulated undistributed (distributions in excess of) net investment income | | | | $ | 169,404 | | | $ | (7,097 | ) | SHARE TRANSACTIONS: | | | | | | | | | | | | Issued | | | | | 360,600 | | | | 727,008 | | | Reinvested | | | | | 256,161 | | | | — | | | Redeemed | | | | | (1,179,043 | ) | | | (2,464,580 | ) | | Change in shares | | | | | (562,282 | ) | | | (1,737,572 | ) |
SEE NOTES TO FINANCIAL STATEMENTS.
JUNE 30, 2006 JPMORGAN INSURANCE TRUST 9
FINANCIAL HIGHLIGHTS
FOR THE PERIODS INDICATED
| | | | Per share operating performance
|
|
|---|
| | | |
| | Investment operations
| | Distributions
| |
|---|
|
|
|
| Net asset
value,
beginning
of period
|
| Net
investment
income
(loss)
|
| Net realized
and unrealized
gains
(losses) on
investments
|
| Total from
investment
operations
|
| Net
realized
gains
|
| Total
distributions
|
|---|
Diversified Mid Cap Growth Portfolio | | | | | | | | | | | | | | | | | | | | | | | | | | | | Six Months Ended June 30, 2006 (Unaudited) | | | | $ | 19.63 | | | $ | 0.02 | | | $ | 0.90 | | | $ | 0.92 | | | $ | (0.60 | ) | | $ | (0.60 | ) | | Year Ended December 31, 2005 | | | | | 17.67 | | | | (0.07 | ) | | | 2.03 | | | | 1.96 | | | | — | | | | — | | | Year Ended December 31, 2004 | | | | | 15.69 | | | | (0.06 | ) | | | 2.04 | | | | 1.98 | | | | — | | | | — | | | Year Ended December 31, 2003 | | | | | 12.34 | | | | (0.04 | ) | | | 3.39 | | | | 3.35 | | | | — | | | | — | | | Year Ended December 31, 2002 | | | | | 15.45 | | | | (0.05 | ) | | | (3.06 | ) | | | (3.11 | ) | | | — | | | | — | | | Year Ended December 31, 2001 | | | | | 21.23 | | | | (0.06 | ) | | | (2.53 | ) | | | (2.59 | ) | | | (3.19 | ) | | | (3.19 | ) |
(a) Annualized for periods less than one year. (b) Not annualized for periods less than one year. | (c) | | Includes adjustments in accordance with accounting principles generally accepted in the United States of America and as such, the net asset value for financial reporting purposes and the returns based upon those net asset values may differ from the net asset value and returns for shareholder transactions. |
SEE NOTES TO FINANCIAL STATEMENTS.
10 JPMORGAN INSURANCE TRUST JUNE 30, 2006
| | Ratios/Supplemental data
|
|
|---|
| | | |
| |
| | Ratios to average net assets (a)
| |
|---|
Net asset
value, end
of period
|
|
|
| Total
return (b)(c)
|
| Net assets
end of
period
(000’s)
|
| Net
expenses
|
| Net
investment
income
(loss)
|
| Expenses
without waivers,
reimbursements
and earnings credits
|
| Portfolio
turnover
rate (b)
|
|---|
| $19.95 | | | | | 4.53 | % | | $ | 176,337 | | | | 0.91 | % | | | 0.19 | % | | | 0.91 | % | | | 56 | % | | 19.63 | | | | | 11.09 | | | | 184,474 | | | | 0.88 | | | | (0.36 | ) | | | 0.88 | | | | 113 | | | 17.67 | | | | | 12.62 | | | | 196,842 | | | | 0.85 | | | | (0.35 | ) | | | 0.86 | | | | 74 | | | 15.69 | | | | | 27.15 | | | | 195,606 | | | | 0.84 | | | | (0.27 | ) | | | 0.86 | | | | 69 | | | 12.34 | | | | | (20.13 | ) | | | 144,108 | | | | 0.83 | | | | (0.37 | ) | | | 0.85 | | | | 76 | | | 15.45 | | | | | (10.65 | ) | | | 192,708 | | | | 0.82 | | | | (0.37 | ) | | | 0.83 | | | | 92 | |
SEE NOTES TO FINANCIAL STATEMENTS.
JUNE 30, 2006 JPMORGAN INSURANCE TRUST 11
NOTES TO FINANCIAL STATEMENTS
AS OF JUNE 30, 2006 (Unaudited)
1. Organization JPMorgan Insurance Trust (formerly JPMorgan Investment Trust) (the “Trust”) is registered under the Investment Company Act of 1940, as amended (the “1940 Act”), as an open-end investment company established as a Massachusetts business trust. The JPMorgan Insurance Trust Diversified Mid Cap Growth Portfolio is a separate Portfolio of the Trust (the “Portfolio”). Effective May 1, 2006, the Board of Trustees approved the name change from JPMorgan Investment Trust Mid Cap Growth Portfolio to JPMorgan Insurance Trust Diversified Mid Cap Growth Portfolio and designated the existing shares as Class 1 Shares. Portfolio shares are offered only to separate accounts of participating insurance companies and eligible plans. Individuals may not purchase shares directly from the Portfolio. 2. Significant Accounting Policies The following is a summary of significant accounting policies followed by the Trust in preparation of its financial statements. The policies are in accordance with accounting principles generally accepted in the United States of America. The preparation of financial statements requires management to make estimates and assumptions that affect the reported amounts of assets and liabilities at the date of the financial statements and the reported amounts of income and expenses for the period. Actual results could differ from those estimates. A. Valuation of Investments — Listed securities are valued at the last sale price on the exchange on which they are primarily traded. The value of National Market Systems equity securities quoted by the NASDAQ Stock Market shall generally be the NASDAQ Official Closing Price. Unlisted securities are valued at the last sale price provided by an independent pricing agent or principal market maker. Listed securities for which the latest sales prices are not available are valued at the mean of the latest bid and ask price as of the closing of the primary exchange where such securities are normally traded. Corporate debt securities, debt securities issued by the U.S. Treasury or a U.S. government agency (other than short-term investments maturing in 61 days or less), and municipal securities are valued each day based on readily available market quotations received from third party broker-dealers of comparable securities or independent or affiliated pricing services approved by the Board of Trustees. Such pricing services and broker-dealers will generally provide bid-side quotations. Generally, short-term investments (other than certain high yield securities) maturing in 61 days or less are valued at amortized cost, which approximates market value. Futures, options and other derivatives are valued on the basis of available market quotations. Investments in other open-end investment companies are valued at such investment company’s current day closing net asset value per share. Securities or other assets for which market quotations are not readily available or for which market quotations do not represent the value at the time of pricing (including certain illiquid securities) are fair valued in accordance with procedures established by and under the supervision and responsibility of the Trustees. Trading in securities on most foreign exchanges and over-the-counter markets is normally completed before the close of the domestic market and may also take place on days when the domestic market is closed. In accordance with procedures adopted by the Trustees, the Portfolio applies fair value pricing on a daily basis except for North American, Central American, South American and Caribbean equity securities held in their portfolios by utilizing the quotations of an independent pricing service, unless the Portfolio’s adviser determines that use of another valuation methodology is appropriate. The pricing service uses statistical analyses and quantitative models to adjust local market prices using factors such as subsequent movement and changes in the prices of indices, securities and exchange rates in other markets, in determining fair value as of the time the Portfolio calculates its net asset value. B. Repurchase Agreements — The Portfolio may enter into repurchase agreement transactions with institutions that meet the advisor’s credit guidelines. Each repurchase agreement is valued at amortized cost. The Portfolio requires that the collateral received in a repurchase agreement transaction be transferred to a custodian in a manner sufficient to enable the Portfolio to obtain collateral in the event of a counterparty default. If the counterparty defaults and the fair value of the collateral declines, realization of the collateral by the Portfolio may be delayed or limited. C. Securities Lending — To generate additional income, the Portfolio may lend up to 33-1/3% of its assets pursuant to agreements (“borrower agreements”) requiring that the loan be continuously secured by cash or securities issued by the U.S. government or its agencies or its instrumentalities (“U.S. government securities”). JPMorgan Chase Bank, N.A. (“JPMCB”), an affiliate of the Portfolio, serves as lending agent pursuant to a Securities Lending Agreement approved by the Board of Trustees (the “Securities Lending Agreement”). Under the Securities Lending Agreement, JPMCB acting as agent for the Portfolio loans securities to approved borrowers pursuant to approved borrower agreements in exchange for collateral equal to at least 100% of the market value of the loaned securities plus accrued interest. During the term of the loan, the Portfolio receives payments from borrowers equivalent to the dividends and interest that would have been earned on securities lent while simultaneously seeking to earn income on the investment of cash collateral in accordance with investment guidelines contained in the Securities Lending Agreement. For loans secured by cash, the Portfolio retains the interest on cash collateral investments but is required to pay the borrower a portion of such interest for the use of the cash collateral. For loans secured by U.S. government securities, the borrower pays a borrower fee to the lending agent on behalf of the Portfolio. The net income earned on the securities lending (after payment of rebates and the lending agent’s fee) is included in the Statement of Operations as income from securities lending (net). Information on the investment of cash collateral is shown in the Schedule of Portfolio Investments. Under the Securities Lending Agreement, JPMCB is entitled to a fee equal to (i) 0.06% calculated on an annualized basis and accrued daily, based upon the value of collateral received from borrowers for each loan of U.S. Securities outstanding during a given month; and (ii) 12 JPMORGAN INSURANCE TRUST JUNE 30, 2006
0.1142% calculated on an annualized basis and accrued daily, based upon the value of collateral received from borrowers for each loan of non-U.S. Securities outstanding during a given month. For the period ended June 30, 2006, JPMCB voluntarily reduced its fees to: (i) 0.05% for each loan of U.S. Securities and (ii) 0.10% for each loan of non-U.S. Securities, respectively.
Risks of delay in recovery of securities or even loss of rights in the securities may occur should the borrower of the securities fail financially. Risks may also arise to the extent that the value of the securities loaned increases above the value of the collateral received. JPMCB will indemnify the Portfolio for losses resulting from a borrower’s failure to return a loaned security when due. Such indemnification does not extend to losses associated with declines in the value of cash collateral investments. Loans are subject to termination by the Portfolio or the borrower at any time, and are, therefore, not considered to be illiquid investments. As of June 30, 2006, the Portfolio had securities with the following market values on loan, received the following collateral and for the period then ended, paid the following amounts to related party affiliates:
|
|
|
| Lending
Agent
Fees Paid
|
| Market
Value of
Collateral
|
| Market Value
of Loaned
Securities
|
|---|
| | | | | $ | 6,654 | | | $ | 19,996,048 | | | $ | 19,764,002 | |
D. Security Transactions and Investment Income — Investment transactions are accounted for on the trade date (the date the order to buy or sell is executed). Securities gains and losses are calculated on a specifically identified cost basis. Interest income is determined on the basis of coupon interest accrued using the effective interest method adjusted for amortization of premiums and accretion of discounts. Dividend income less foreign taxes withheld (if any) is recorded on the ex-dividend date or when the Portfolio first learns of the dividend. E. Allocation of Expenses — Expenses directly attributable to the Portfolio are charged directly to the Portfolio while the expenses attributable to more than one portfolio of the Trust are allocated among the respective portfolios. F. Federal Income Taxes — The Portfolio is treated as a separate taxable entity for Federal income tax purposes. The Portfolio’s policy is to comply with the provisions of the Internal Revenue Code of 1986, as amended (the “Code”), applicable to regulated investment companies and to distribute to shareholders all of its distributable net investment income and net realized gain on investments. Accordingly, no provision for Federal income tax is necessary. The Portfolio is also a segregated portfolio of assets for insurance purposes and intends to comply with the diversification requirements at Subchapter L of the Code. G. Foreign Taxes — The Portfolio may be subject to foreign taxes on income, gains on investments or currency repatriation, a portion of which may be recoverable. The Portfolio will accrue such taxes and recoveries as applicable, based upon its current interpretation of tax rules and regulations that exist in the markets in which it invests. H. Distributions to Shareholders — Dividends from net investment income and net realized capital gains, if any, are generally declared and paid at least annually. The amount of dividends and distributions from net investment income and from net capital gains are determined in accordance with Federal income tax regulations, which may differ from accounting principles generally accepted in the United States of America. To the extent these “book/tax” differences are permanent in nature (i.e. that they result from other than timing of recognition — “temporary differences”), such amounts are reclassified within the capital accounts based on their Federal tax-basis treatment. I. New Accounting Pronouncement — In July 2006, the Financial Accounting Standards Board issued Interpretation No. 48, “Accounting for Uncertainty in Income Taxes — an Interpretation of FASB Statement No. 109” (the “Interpretation”). The Interpretation establishes for all entities, including pass-through entities such as the Portfolio, a minimum threshold for financial statement recognition of the benefit of positions taken in filing tax returns (including whether an entity is taxable in a particular jurisdiction), and requires certain expanded tax disclosures. The Interpretation is effective for fiscal years beginning after December 15, 2006, and is to be applied to all open tax years as of the date of effectiveness. Management has recently begun to evaluate the application of the Interpretation to the Portfolio, and is not in a position at this time to estimate the significance of its impact, if any, on the Portfolio’s financial statements. 3. Fees and Other Transactions with Affiliates A. Investment Advisory Fee — Pursuant to the Investment Advisory Agreement, JPMorgan Investment Advisors Inc. (the “Advisor”) acts as the investment advisor to the Portfolio. The Advisor is an indirect wholly-owned subsidiary of JPMorgan Chase & Co. (“JPMorgan”). The Advisor supervises the investments of the Portfolio and for such services is paid a fee. The fee is accrued daily and paid monthly based on the Portfolio’s average daily net assets at an annual fee rate of 0.65%. The Advisor waived and/or reimbursed Investment Advisory fees as outlined in Note 3.E. The Portfolio may invest in one or more money market funds advised by the Advisor or its affiliates. Advisory and administrative fees are waived and/or reimbursed from the Portfolio in an amount sufficient to offset any doubling up of these fees related to the Portfolio’s investment in an affiliated money market fund to the extent required by law. B. Administration Fee — Pursuant to an Administration Agreement, JPMorgan Funds Management, Inc. (the “Administrator”), an indirect, wholly-owned subsidiary of JPMorgan, provides certain administration services to the Portfolio. In consideration of these services, the JUNE 30, 2006 JPMORGAN INSURANCE TRUST 13
NOTES TO FINANCIAL STATEMENTS
AS OF JUNE 30, 2006 (Unaudited) (continued)
Administrator receives a fee computed daily and paid monthly at the annual rate of 0.15% of the first $25 billion of the average daily net assets of all funds in the JPMorgan Fund Complex (excluding funds of funds and money market funds) and 0.075% of the average daily net assets in excess of $25 billion of all such funds.
The Administrator waived and/or reimbursed Administration fees as outlined in Note 3.E. Prior to May 1, 2006, the Administrator provided services for a fee computed daily and paid monthly at the annual rate of 0.18% of the first $250 million of the average daily net assets of the Trust (excluding the Equity Index Portfolio) and 0.14% of the average daily net assets of the Trust in excess of $250 million (excluding the Equity Index Portfolio). J.P. Morgan Investor Services, Co. (“JPMIS”), an indirect, wholly owned subsidiary of JPMorgan, serves as the Portfolio’s Sub-administrator (the “Sub-administrator”). For its services as Sub-administrator, JPMIS receives a portion of the fees payable to the Administrator. Prior to May 1, 2006, JPMIS also received a portion of the fees payable to the Administrator as compensation for fund accounting services. C. Distribution Fees — Pursuant to a Distribution Agreement, JPMorgan Distribution Services, Inc. (“the Distributor”), a wholly-owned subsidiary of JPMorgan, serves as the Trust’s exclusive underwriter and promotes and arranges for the sale of the Portfolio’s shares. The Distributor receives no compensation in its capacity as the Portfolio’s underwriter. D. Custodian and Accounting Fees — JPMCB provides portfolio custody and accounting services for the Portfolio. The amounts paid directly to JPMCB by the Portfolio for custody and accounting services are included in custodian and accounting fees in the Statement of Operations. (Effective May 1, 2006, the Portfolio began paying the fees for accounting services directly to JPMCB.) The custodian fees may be reduced by credits earned by the Portfolio, based on uninvested cash balances held by the custodian. Such earnings credits are presented separately in the Statement of Operations. Interest expense, if any, paid to the custodian related to cash overdrafts is presented as interest expense in the Statement of Operations. E. Waivers and Reimbursements — The Advisor and Administrator have contractually agreed to waive fees or reimburse the Portfolio to the extent that total annual operating expenses (excluding interest, taxes, extraordinary expenses and expenses related to the Board of Trustees’ deferred compensation plan) exceed 0.90% (0.98% prior to May 1, 2006) of the Portfolio’s average daily net assets. The contractual expense limitation agreements were in effect for the six months ended June 30, 2006. The new expense limitation percentage above is in place until at least April 30, 2007. No fees or expenses were waived or reimbursed by the Advisor or Administrator for the six months ended June 30, 2006. F. Other — Certain officers of the Trust are affiliated with the Advisor, the Administrator, the Sub-administrator and the Distributor. Such officers, with the exception of the Chief Compliance Officer, receive no compensation from the Portfolio for serving in their respective roles. The Board of Trustees appointed a Chief Compliance Officer to the Portfolio in accordance with federal securities regulations. The Portfolio, along with other affiliated portfolios, make reimbursement payments, on a pro-rata basis, to the Administrator for a portion of the fees associated with the Office of the Chief Compliance Officer. Such fees are included in Trustees’ and Officers’ Fees in the Statement of Operations. The Trust adopted a Trustee Deferred Compensation Plan (the “Plan”) which allows the independent Trustees to defer the receipt of all or a portion of compensation related to performance of their duties as a Trustee. The deferred fees are invested in various JPMorgan funds until distribution in accordance with the Plan. During the period, the Portfolio may have purchased securities from an underwriting syndicate in which the principal underwriter or members of the syndicate are affiliated with the Advisor. The Portfolio may use related party brokers/dealers. For the period ended June 30, 2006, the Portfolio did not incur brokerage commissions with brokers/dealers affiliated with the Advisor. The SEC has granted an exemptive order permitting the Portfolio to engage in principal transactions with J.P. Morgan Securities, Inc., an affiliated broker, involving taxable money market instruments subject to certain conditions. 14 JPMORGAN INSURANCE TRUST JUNE 30, 2006
4. Investment Transactions During the six months ended June 30, 2006, purchases and sales of investments (excluding short-term investments) were as follows:
|
|
|
| Purchases
(excluding U.S.
Government)
|
| Sales
(excluding U.S.
Government)
|
|---|
| | | | | $ | 103,884,453 | | | $ | 121,895,968 | |
During the six months ended June 30, 2006, there were no purchases or sales of U.S. Government securities. 5. Federal Income Tax Matters For Federal income tax purposes, the cost and unrealized appreciation (depreciation) in value of the investment securities at June 30, 2006, were as follows:
|
|
|
| Aggregate
Cost
|
| Gross
Unrealized
Appreciation
|
| Gross
Unrealized
Depreciation
|
| Net Unrealized
Appreciation
(Depreciation)
|
|---|
| | | | | $ | 177,741,801 | | | $ | 23,867,924 | | | $ | (4,677,068 | ) | | $ | 19,190,856 | |
6. Borrowings The Trust and JPMCB have entered into a financing arrangement. Under this arrangement, JPMCB provides an unsecured, uncommitted credit facility in the aggregate amount of $100 million to certain of the JPMorgan Funds including the Portfolio. Advances under the arrangement are taken primarily for temporary or emergency purposes, including the meeting of redemption requests that otherwise might require the untimely disposition of securities, and are subject to the Portfolio’s borrowing restrictions. Interest on borrowings is payable at a rate determined by JPMCB at the time of borrowing. This agreement has been extended until November 21, 2006. The Portfolio had no borrowings outstanding at June 30, 2006, or at any time during the six months then ended. 7. Concentrations and Indemnifications In the normal course of business the Portfolio enters into contracts that contain a variety of representations which provide general indemnifications. The Portfolio’s maximum exposure under these arrangements is unknown, as this would involve future claims that may be made against the Portfolio that have not yet occurred. However, based on experience, the Portfolio expects the risk of loss to be remote. From time to time, the Portfolio may have a concentration of several shareholders holding a significant percentage of shares outstanding. Investment activities of these shareholders could have a material impact on the Portfolio. JUNE 30, 2006 JPMORGAN INSURANCE TRUST 15
TRUSTEES
(Unaudited)
The Portfolio’s Statement of Additional Information includes additional information about the Portfolio’s Trustees and is available, without charge, upon request by calling 1-800-480-4111 or on the Portfolio’s website at www.jpmorganfunds.com. Name (Year of Birth);
Positions With
the Portfolio
|
|
|
| Principal Occupations
During Past 5 Years
|
| Number of
Portfolios/Funds
in JPMorgan
Funds Complex (1)
Overseen by Trustee
|
| Other Directorships Held
Outside Fund Complex
|
|---|
Independent Trustees | | William J. Armstrong (1941); Trustee of Trust since 2005; Trustee of heritage JPMorgan Funds since 1987. | | | | Retired; CFO and Consultant, EduNeering, Inc. (internet business education supplier) (2000–2001); Vice President and Treasurer, Ingersoll–Rand Company (manufacturer of industrial equipment) (1972–2000). | | 120 | | None. | | Roland R. Eppley, Jr. (1932); Trustee of Trust since 2005; Trustee of heritage JPMorgan Funds since 1989. | | | | Retired; President and Chief Executive Officer, Eastern States Bankcard (1971–1988). | | 120 | | None. | | John F. Finn (1947); Trustee of Trust since 2005; Trustee of heritage One Group Mutual Funds since 1998. | | | | President and Chief Executive Officer, Gardner, Inc. (wholesale distributor to outdoor power equipment industry) (1979–present). | | 120 | | Director, Cardinal Health, Inc (CAH) (1994–present); Chairman, The Columbus Association for the Performing Arts (CAPA) (2003–present). | | Dr. Matthew Goldstein (1941); Trustee of Trust since 2005; Trustee of heritage JPMorgan Funds since 2003. | | | | Chancellor of the City University of New York (1999–present); President, Adelphi University (New York) (1998–1999). | | 120 | | Director, Albert Einstein School of Medicine (1998–present); Director, New Plan Excel Realty Trust, Inc. (real estate investment trust)
(2000–present); Director, Lincoln Center Institute for the Arts in Education (1999–present). | | Robert J. Higgins (1945); Trustee of Trust since 2005; Trustee of heritage JPMorgan Funds since 2002. | | | | Retired; Director of Administration of the State of Rhode Island (2003–2004); President — Consumer Banking and Investment Services, Fleet Boston Financial (1971–2001). | | 120 | | None. | | Peter C. Marshall (1942); Trustee of Trust since 2005; Trustee of heritage One Group Mutual Funds since 1994. | | | | Self-employed business consultant (2002–present); Senior Vice President, W.D. Hoard, Inc. (corporate parent of DCI Marketing, Inc.) (2000–2002); President, DCI Marketing, Inc. (1992–2000). | | 120 | | None. | | Marilyn McCoy (1948); Trustee of Trust since 2005; Trustee of heritage One Group Mutual Funds since 1999. | | | | Vice President of Administration and Planning, Northwestern University (1985–present). | | 120 | | Trustee, Mather LifeWays (1994–present); Trustee, Carleton College (2003–present). | | William G. Morton, Jr. (1937); Trustee of Trust since 2005; Trustee of heritage JPMorgan Funds since 2003. | | | | Retired; Chairman Emeritus (2001–2002), and Chairman and Chief Executive Officer, Boston Stock Exchange (1985–2001). | | 120 | | Director, Radio Shack Corporation (electronics) (1987–present); Director, The National Football Foundation and College Hall of Fame (1994–present); Trustee, Stratton Mountain School (2001–present). |
16 JPMORGAN INSURANCE TRUST JUNE 30, 2006
Name (Year of Birth);
Positions With
the Portfolio
|
|
|
| Principal Occupations
During Past 5 Years
|
| Number of
Portfolios/Funds
in JPMorgan
Funds Complex (1)
Overseen by Trustee
|
| Other Directorships Held
Outside Fund Complex
|
|---|
Independent Trustees (continued) | | Robert A. Oden, Jr. (1946); Trustee of Trust since 2005; Trustee of heritage One Group Mutual Funds since 1997. | | | | President, Carleton College (2002–present); President, Kenyon College (1995–2002). | | 120 | | Director, American University in Cairo. | | Fergus Reid, III (1932); Trustee of Trust (Chairman) since 2005; Trustee (Chairman) of heritage JPMorgan Funds since 1987. | | | | Chairman, Lumelite Corporation (plastics manufacturing) (2003–present); Chairman and Chief Executive Officer, Lumelite Corporation (1985–2002). | | 120 | | Trustee, Morgan Stanley Funds (198 portfolios) (1995–present). | | Frederick W. Ruebeck (1939); Trustee of Trust since 2005; Trustee of heritage One Group Mutual Funds since 1994. | | | | Advisor, Jerome P. Green & Associates, LLC (broker-dealer) (2000–present); Chief Investment Officer, Wabash College (2004–present); self-employed consultant (2000–present); Director of Investments, Eli Lilly and Company (1988–1999). | | 120 | | Trustee, Wabash College (1988–present); Chairman, Indianapolis Symphony Orchestra Foundation (1994–present). | | James J. Schonbachler (1943); Trustee of Trust since 2005; Trustee of heritage JPMorgan Funds since 2001. | | | | Retired; Managing Director of Bankers Trust Company (financial services) (1968–1998). | | 120 | | None. | Interested Trustee | | Leonard M. Spalding, Jr.* (1935); Trustee of Trust since 2005; Trustee of heritage JPMorgan Funds since 1998. | | | | Retired; Chief Executive Officer of Chase Mutual Funds (investment company) (1989–1998); President & Chief Executive Officer, Vista Capital Management (investment management) (1990–1998); Chief Investment Executive, Chase Manhattan Private Bank (investment management) (1990–1998). | | 120 | | Director, Glenview Trust Company, LLC (2001–present); Trustee, St. Catherine College (1998–present); Trustee, Bellarmine University (2000–present); Director, Springfield-Washington County Economic Development Authority (1997–present); Trustee, Marion and Washington County, Kentucky Airport Board (1998–present); Trustee, Catholic Education Foundation (2005–present). |
| (1) | | A Fund Complex means two or more registered investment companies that hold themselves out to investors as related companies for purposes of investment and investor services or have a common investment adviser or have an investment adviser that is an affiliated person of the investment adviser of any of the other registered investment companies. The JPMorgan Funds Complex which the Board of Trustees currently oversees includes eight registered investment companies (120 portfolios/funds). |
| * | | Mr. Spalding is deemed to be an “interested person” due to his ownership of JPMorgan Chase stock. |
The contact address for each of the Trustees is 245 Park Avenue, New York, NY 10167. JUNE 30, 2006 JPMORGAN INSURANCE TRUST 17
OFFICERS
(Unaudited)
Name (Year of Birth),
Positions Held with
the Trust
|
|
|
| Principal Occupations During Past 5 Years
|
|---|
George C.W. Gatch (1962),
President since 2005 | | | | Managing Director, JPMorgan Investment Management Inc.; Director and President, JPMorgan Distribution Services, Inc. and JPMorgan Funds Management, Inc. since 2005. Mr. Gatch is CEO and President of JPMorgan Funds. Mr. Gatch has been an employee since 1986 and has held positions such as President and CEO of DKB Morgan, a Japanese mutual fund company which was a joint venture between J.P. Morgan and Dai-Ichi Kangyo Bank, as well as positions in business management, marketing and sales. | Robert L. Young (1963),
Senior Vice President since 2005* | | | | Director and Vice President, JPMorgan Distribution Services, Inc. and JPMorgan Funds Management, Inc.; Chief Operating Officer, JPMorgan Funds since 2005, and One Group Mutual Funds from 2001 until 2005. Mr. Young was Vice President and Treasurer, JPMorgan Funds Management, Inc. (formerly One Group Administrative Services) and Vice President and Treasurer, JPMorgan Distribution Services, Inc. (formerly One Group Dealer Services, Inc.) from 1999 to 2005. | Patricia A. Maleski (1960),
Vice President and Chief
Administrative Officer since 2005 | | | | Managing Director, JPMorgan Funds Management, Inc.; previously, Treasurer, JPMorgan Funds and Head of Funds Administration and Board Liaison. Ms. Maleski was Vice President of Finance for the Pierpont Group, Inc. from 1996–2001, an independent company owned by the Board of Directors/Trustees of the JPMorgan Funds, prior to joining J.P. Morgan Chase & Co. in 2001. | Stephanie J. Dorsey (1969),
Treasurer since 2005* | | | | Vice President, JPMorgan Funds Management, Inc.; Director of Mutual Fund Administration, JPMorgan Funds Management, Inc. (formerly One Group Administrative Services), from 2004 to 2005; Ms. Dorsey worked for JPMorgan Chase & Co., (formerly Bank One Corporation) from 2003 to 2004; prior to joining Bank One Corporation, she was a Senior Manager specializing in Financial Services audits at PricewaterhouseCoopers LLP from 1992 through 2002. | Stephen M. Ungerman (1953),
Senior Vice President and Chief
Compliance Officer since 2005
| | | | Senior Vice President, JPMorgan Chase & Co.; Mr. Ungerman was head of Fund Administration — Pooled Vehicles from 2000 to 2004. Mr. Ungerman held a number of positions in Prudential Financial’s asset management business prior to 2000. | Paul L. Gulinello (1950), AML
Compliance Officer since 2005 | | | | Vice President and Anti Money Laundering Compliance Officer for JPMorgan Asset Management Americas, additionally responsible for personal trading and compliance testing since 2004; Treasury Services Operating Risk Management and Compliance Executive supporting all JPMorgan Treasury Services business units from July 2000 to 2004. | Stephen M. Benham (1959),
Secretary since 2005 | | | | Vice President and Assistant General Counsel, JPMorgan Chase & Co. since 2004; Vice President (Legal Advisory) of Merrill Lynch Investment Managers, L.P. from 2000 to 2004; attorney associated with Kirkpatrick & Lockhart LLP from 1997 to 2000. | Elizabeth A. Davin (1964),
Assistant Secretary since 2005* | | | | Vice President and Assistant General Counsel, JPMorgan Chase & Co. since 2005; Senior Counsel, JPMorgan Chase & Co. (formerly Bank One Corporation) from 2004 to 2005; Assistant General Counsel and Associate General Counsel and Vice President, Gartmore Global Investments, Inc. from 1999 to 2004. | Jessica K. Ditullio (1962),
Assistant Secretary since 2005* | | | | Vice President and Assistant General Counsel, JPMorgan Chase & Co. since 2005; Ms. Ditullio has served as an attorney with various titles for JPMorgan Chase & Co. (formerly Bank One Corporation) since 1990. | Nancy E. Fields (1949),
Assistant Secretary since 2005* | | | | Vice President, JPMorgan Funds Management, Inc. and JPMorgan Distribution Services, Inc.; From 1999 to 2005, Director, Mutual Fund Administration, JPMorgan Funds Management, Inc. (formerly One Group Administrative Services, Inc.) and Senior Project Manager, Mutual Funds, JPMorgan Distribution Services, Inc. (formerly One Group Dealer Services, Inc.). | Michael C. Raczynski (1975),
Assistant Secretary (2006) | | | | Vice President and Assistant General Counsel, JPMorgan Chase & Co. since 2006; Associate, Stroock & Stroock & Lavan LLP from 2001 to 2006. | Ellen W. O’Brien (1957),
Assistant Secretary since 2005** | | | | Assistant Vice President, JPMorgan Investor Services, Co., responsible for Blue Sky registration. Ms. O’Brien has served in this capacity since joining the firm in 1991. |
18 JPMORGAN INSURANCE TRUST JUNE 30, 2006
Name (Year of Birth),
Positions Held with
the Trust
|
|
|
| Principal Occupations During Past 5 Years
|
|---|
Suzanne E. Cioffi (1967),
Assistant Treasurer since 2005 | | | | Vice President, JPMorgan Funds Management, Inc., responsible for mutual fund financial reporting. Ms. Cioffi has overseen various fund accounting, custody and administration conversion projects during the past five years. | Arthur A. Jensen (1966),
Assistant Treasurer since 2005* | | | | Vice President, JPMorgan Funds Management, Inc. since April 2005; formerly, Vice President of Financial Services of BISYS Fund Services, Inc. from 2001 until 2005; Mr. Jensen was Section Manager at Northern Trust Company and Accounting Supervisor at Allstate Insurance Company prior to 2001. |
The contact address for each of the officers, unless otherwise noted, is 245 Park Avenue, New York, NY 10167. | * | | The contact address for the officer is 1111 Polaris Parkway, Columbus, OH 43271. |
| ** | | The contact address for the officer is 73 Tremont Street, Floor 1, Boston MA 02108. |
JUNE 30, 2006 JPMORGAN INSURANCE TRUST 19
SCHEDULE OF SHAREHOLDER EXPENSES
(Unaudited)
Hypothetical $1,000 Investment at Beginning of Period
June 30, 2006
As a shareholder of the Portfolio, you incur ongoing costs, including investment advisory fees, administration fees and other Portfolio expenses. Because the Portfolio is a funding vehicle for Policies and Eligible Plans, you may also incur sales charges and other fees relating to the Policies or Eligible Plans. The examples below are intended to help you understand your ongoing costs (in dollars) of investing in the Portfolio, but not the costs of the Policies or Eligible Plans, and to compare these ongoing costs with the ongoing costs of investing in other mutual funds. The examples assume that you had a $1,000 investment in the Portfolio at the beginning of the reporting period, January 1, 2006, and continued to hold your shares at the end of the reporting period, June 30, 2006. Actual Expenses The first line provides information about actual account values and actual expenses. You may use the information in this line, together with the amount you invested, to estimate the expenses that you paid over the period. Simply divide your account value by $1,000 (for example, an $8,600 account value divided by $1,000 = 8.6), then multiply the result by the number in the first line under the heading entitled “Expenses Paid During Period” to estimate the expenses you paid on your account during this period. Hypothetical Example for Comparison Purposes The second line in the table below provides information about hypothetical account values and hypothetical expenses based on the actual expense ratio and an assumed rate of return of 5% per year before expenses, which is not the Portfolio’s actual return. The hypothetical account values and expenses may not be used to estimate the actual ending account balance or expenses you paid for the period. You may use this information to compare the ongoing costs of investing in the Portfolio and other portfolios. To do so, compare this 5% hypothetical example with the 5% hypothetical examples that appear in the shareholder reports of the other funds. Please note that the expenses shown in the table are meant to highlight your ongoing costs only and do not reflect any transaction costs, such as sales charges (loads) or redemption fees or the costs associated with the Policies and Eligible Plans through which the Portfolio is held. Therefore, the second line in the table is useful in comparing ongoing costs only, and will not help you determine the relative total costs of owning different portfolios. In addition, if these transaction costs were included, your costs would have been higher. The examples also assume all dividends and distributions have been reinvested.
|
|
|
| Beginning
Account Value,
January 1, 2006
|
| Ending
Account Value,
June 30, 2006
|
| Expenses
Paid During
January 1 to
June 30, 2006*
|
| Annualized
Expense Ratio
|
|---|
Diversified Mid Cap Growth Portfolio | | Actual | | | | $ | 1,000.00 | | | $ | 1,045.30 | | | $ | 4.61 | | | | 0.91 | % | | Hypothetical | | | | | 1,000.00 | | | | 1,020.28 | | | | 4.56 | | | | 0.91 | |
| * | | Expenses are equal to the Fund’s annualized expense ratio, multiplied by the average account value over the period, multiplied by 181/365 (to reflect one-half year period). |
20 JPMORGAN INSURANCE TRUST JUNE 30, 2006
JPMorgan Funds are distributed by JPMorgan Distribution Services, Inc., which is an affiliate of JPMorgan Chase & Co. Affiliates of JPMorgan Chase & Co. receive fees for providing various services to the funds. This report is submitted for the general information of the shareholders of the Portfolio. It is not authorized for distribution to prospective investors in the Portfolio unless preceded or accompanied by a prospectus. Contact JPMorgan Funds Distribution Services at 1-800-480-4111 for a portfolio prospectus. You can also visit us at www.jpmorganfunds.com. Investors should carefully consider the investment objectives and risk as well as charges and expenses of the mutual fund before investing. The prospectus contains this and other information about the mutual fund. Read the prospectus carefully before investing. The Portfolio files a complete schedule of its portfolio holdings for the first and third quarters of its fiscal year with the SEC on Form N-Q. The Portfolio’s Forms N-Q are available on the SEC’s website at http://www.sec.gov and may be reviewed and copied at the SEC’s Public Reference Room in Washington, DC. Information on the operation of the SEC’s Public Reference Room may be obtained by calling 1-800-SEC-0330. Shareholders may request the Form N-Q without charge by calling 1-800-480-4111 or by visiting the variable insurance portfolio section of the JPMorgan Funds’ website at www.jpmorganfunds.com. A description of the Portfolio’s policies and procedures with respect to the disclosure of the Portfolio’s holdings is available in the Statement of Additional Information. A copy of proxy policies and procedures are available without charge upon request by calling 1-800-480-4111 and on the SEC’s website at www.sec.gov. The Trustees have delegated the authority to vote proxies for securities owned by the Portfolio to the Advisor. A copy of the Portfolio’s voting record for the most recent 12-month period ended June 30 is available on the SEC’s website at www.sec.gov or at the Portfolio’s website at www.jpmorganfunds.com no later than August 31 of each year. The Portfolio’s proxy voting record will include, among other things, a brief description of the matter voted on for each portfolio security, and will state how each vote was cast, for example, for or against the proposal.
© JPMorgan Chase & Co., 2006 All rights reserved. June 2006. | | SAN-JPMITDMCGP-606 |
SEMI-ANNUAL REPORT
SIX MONTHS ENDED JUNE 30, 2006 (UNAUDITED)
JPMorgan Insurance JPMorgan Insurance Trust Diversified Mid Cap Value Portfolio
(formerly JPMorgan Investment Trust Mid Cap Value Portfolio)
| NOT FDIC INSURED • NO BANK GUARANTEE • MAY LOSE VALUE | | | | This material must be preceded or accompanied by a current prospectus. | | |
CONTENTS | President’s Letter | | | | | 1 | | Portfolio Commentary:
| | | | | | | | JPMorgan Insurance Trust Diversified Mid Cap Value Portfolio | | | | | 2 | | | Schedule of Portfolio Investments | | | | | 4 | | | Statement of Assets and Liabilities | | | | | 8 | | | Statement of Operations | | | | | 9 | | | Statement of Changes in Net Assets | | | | | 10 | | | Financial Highlights | | | | | 12 | | | Notes to Financial Statements | | | | | 14 | | | Trustees | | | | | 18 | | | Officers | | | | | 20 | | | Schedule of Shareholder Expenses | | | | | 22 | |
HIGHLIGHTS | • | | U.S. stocks generally positive in first half of 2006 |
| • | | Investors tried to predict interest rate hikes |
| • | | Gross domestic product (GDP) moved sharply higher |
| • | | Market volatility expected until interest rate picture is clearer |
Effective May 1, 2006, the exciting shares of the Portfolio were designated as Class 1 Shares. The performance, expenses and other information shown in this report for the Portfolio is information applicable to the Class 1 Shares. Investments in the Portfolio are not bank deposits or obligations of, or guaranteed or endorsed by, any bank and are not insured or guaranteed by the FDIC, the Federal Reserve Board or any other government agency. You could lose money if you sell when the Portfolio’s share price is lower than when you invested. Past performance is no guarantee for future performance. The general market views expressed in this report are opinions based on current market conditions and are subject to change without notice. These views are not intended to predict the future performance of the Portfolio or the securities markets. References to specific securities and their issuers are for illustrative purposes only and are not intended to be, and should not be interpreted as, recommendations to purchase or sell such securities. Such views are not meant as investment advice and may not be relied on as an indication of trading intent on behalf of any Portfolio. This Portfolio is intended to be a funding vehicle for variable annuity contracts and variable life insurance policies (collectively “Policies”) offered by separate accounts of participating insurance companies. Portfolio shares are also offered to qualified pension and retirement plans (“Eligible Plans”). Individuals may not purchase shares directly from the Portfolio. Prospective investors should refer to the Portfolio’s prospectus for a discussion of the Portfolio’s investment objective, strategies and risks. Call JPMorgan Funds Service Center at 1-800-480-4111 for a prospectus containing more complete information about the Portfolio including management fees and other expenses. Please read it carefully before investing.
PRESIDENT’S LETTER
JULY 14, 2006 (Unaudited) Dear Shareholder: We are pleased to present this semi-annual report for the JPMorgan Insurance Trust Diversified Mid Cap Value Portfolio for the six months ended June 30, 2006. Inside, you’ll find information detailing the performance of the Portfolio, along with a report from the portfolio manager. | |
“Despite repeated interest rate hikes and surging energy prices, the U.S. economy was surprisingly resilient.”
|
All Eyes on the Federal Reserve Board While the U.S. stock market weakened late in the reporting period, overall it produced positive returns for the first half of the calendar year. The equity market kicked off 2006 with investors encouraged by overall strong economic growth and positive corporate earnings. However, the last two months were marked by increased volatility. A great deal of the driving forces behind the market’s ups and downs resulted from the actions of the Federal Open Market Committee (FOMC). In February 2006, Ben Bernanke assumed the role of Federal Reserve (Fed) Board Chairman, replacing long-time fixture Alan Greenspan. The transition was less than smooth for investors, as they attempted to predict the FOMC’s future actions regarding interest rates. The FOMC’s statements first hinted that there may be a break from rate increases and then telegraphed additional rate hikes due to fears of rising inflation. In late June, the FOMC raised short-term rates for the 17th consecutive time, bringing the fed funds target rate to 5.25% — its highest level in more than five years. Despite repeated interest rate hikes and surging energy prices, the U.S. economy was surprisingly resilient. After gross domestic product (GDP) fell in the fourth quarter, the economy moved sharply higher in the first quarter of 2006. During this time, GDP rose 5.6%, its highest reading since the third quarter of 2003. Stocks Produce Positive Results The broad stock market, as measured by the S&P 500 Index, returned 2.71% for the six months ended June 30, 2006. After a fast start to the year, the market took a step backwards in mid-May on fears that additional rate hikes may adversely affect the economic expansion and temper corporate profits. Looking more closely at the market over the six months, small- and mid-cap stocks outperformed their large-cap counterparts, with the Russell Midcap, Russell 2000 and Russell 1000 Indexes returning 4.84%, 8.21% and 2.76%, respectively. However, as many market pundits have anticipated, large-cap stocks generated relatively better results late in the period. After a prolonged period of lagging smaller-cap stocks, many large caps appeared attractively valued and may be better equipped to handle more moderate economic growth. Outlook Looking ahead, the markets could continue to experience periods of volatility until the FOMC’s interest rate stance is better understood. Coinciding with its latest rate hike in June, the Fed said: “The extent and timing of any additional firming...will depend on the evolution of the outlook for both inflation and economic growth, as implied by incoming information.” Investors will likely be closely monitoring the economic “tea leaves” in an attempt to ascertain the FOMC’s next move. On behalf of us all at JPMorgan Asset Management, thank you for your confidence and the continued trust you have placed in us. We look forward to serving your investment needs for many years to come. Should you have any questions, please feel free to contact the JPMorgan Funds Service Center at 1-800-480-4111. George C.W. Gatch
President
JPMorgan Funds JUNE 30, 2006 JPMORGAN INSURANCE TRUST 1
JPMorgan Insurance Trust Diversified Mid Cap Value Portfolio
(formerly JPMorgan Investment Trust Mid Cap Value Portfolio) PORTFOLIO COMMENTARY
AS OF JUNE 30, 2006 (Unaudited) PORTFOLIO FACTS
| Portfolio Inception | | | | May 1, 1997 | | Fiscal Year End | | | | December 31 | | Net Assets as of 6/30/2006 | | | | $104,470,338 | | Primary Benchmark | | | | Russell Midcap
Value Index |
Q. | | HOW DID THE PORTFOLIO PERFORM? |
A. | | The JPMorgan Insurance Trust Diversified Mid Cap Value Portfolio, which seeks capital appreciation with the secondary goal of achieving current income by investing primarily in equity securities, returned 4.93% over the six months ended June 30, 2006, compared to the 7.02% return for the Russell Midcap Value Index over the same period.* |
Q. | | WHY DID THE PORTFOLIO PERFORM THIS WAY? |
A. | | The Portfolio underperformed its benchmark for the period due primarily to an overweight in consumer discretionary and stock selection in consumer staples. The Portfolio’s underweight in information technology and stock selection in utilities aided performance.
At the individual stock level, CA Inc., a corporate software firm, was a major detractor from performance. The company reported financial results that fell short of forecasts. More importantly, the company failed to file its annual report with regulators by the deadline and announced that it may need to restate previously reported results back to fiscal year 1997 due to stock-option grants. Furthermore, the company may have understated its subscription revenues in years prior to fiscal year 2006. Another detractor was OSI Restaurant Partners Inc., an operator of franchise casual dining restaurants. The company reported lower first-quarter profit, as operating costs outpaced sales growth. While some weakness in the stock could be attributed to rising energy prices, casual dining stocks performed poorly as excess seating capacity and higher costs threatened to pressure margins.
While the Portfolio underperformed the benchmark, select holdings contributed to performance. V.F. Corp., an apparel manufacturer, positively impacted the Portfolio. The company reported strong first-quarter profits, driven by higher sales of outdoor wear, sportswear and jeans. The company has focused on extending past its core denim brand business and acquiring higher-growth and high-margin lifestyle brands. Consol Energy Inc., one of the largest coal producers in the United States, was another positive contributor. Solid business dynamics led to better-than-expected earnings in the first quarter. In addition, investors gained confidence in the company’s ability to increase capacity and improve product mix. |
Q. | | HOW WAS THE FUND MANAGED? |
A. | | We employ a bottom-up approach to stock selection, constructing portfolios based on company fundamentals, quantitative screening and proprietary fundamental analysis. We look for undervalued companies that have the potential to grow intrinsic value per share. The research process is designed to find companies with predictable and durable business models deemed capable of achieving sustainable growth. Potential investments are subjected to rigorous financial analysis and a disciplined approach to valuation. |
PORTFOLIO COMPOSITION**
| Financials | | | | | 29.2 | % | | Consumer Discretionary | | | | | 19.3 | | | Utilities | | | | | 11.5 | | | Industrials | | | | | 7.9 | | | Materials | | | | | 6.7 | | | Consumer Staples | | | | | 6.5 | | | Energy | | | | | 6.0 | | | Health Care | | | | | 4.9 | | | Information Technology | | | | | 4.3 | | | Telecommunication Services | | | | | 2.3 | | | Investments of Cash Collateral for Securities Loaned | | | | | 12.8 | | | Short-Term Investments | | | | | 1.5 | |
TOP TEN EQUITY HOLDINGS OF THE PORTFOLIO**
| 1. | | | | V.F. Corp. | | | 1.7 | % | | 2. | | | | Old Republic International Corp. | | | 1.4 | | | 3. | | | | Coventry Health Care, Inc. | | | 1.4 | | | 4. | | | | Compass Bancshares, Inc. | | | 1.4 | | | 5. | | | | Assurant, Inc. | | | 1.3 | | | 6. | | | | Kinder Morgan, Inc. | | | 1.3 | | | 7. | | | | Golden West Financial Corp. | | | 1.2 | | | 8. | | | | AGL Resources, Inc. | | | 1.2 | | | 9. | | | | Hilton Hotels Corp. | | | 1.1 | | | 10. | | | | Zions Bancorporation | | | 1.1 | |
| * | | The advisor seeks to achieve the Portfolio’s objective. There can be no guarantee it will be achieved. |
| ** | | Percentages indicated are based upon net assets as of June 30, 2006. The portfolio’s composition is subject to change. |
2 JPMORGAN INSURANCE TRUST JUNE 30, 2006
AVERAGE ANNUAL TOTAL RETURNS AS OF JUNE 30, 2006
| | | | INCEPTION DATE
| | 1 YEAR
| | 5 YEAR
| | SINCE INCEPTION
|
|---|
DIVERSIFIED MID CAP VALUE PORTFOLIO | | | | | 5/1/97 | | | | 9.26 | % | | | 8.65 | % | | | 9.45 | % |
LIFE OF PORTFOLIO PERFORMANCE (5/01/97 TO 6/30/06)
Source: Lipper, Inc. The performance quoted is past performance and is not a guarantee of future results. Mutual funds are subject to certain market risk. Investment returns and principal value of an investment will fluctuate so that an investor’s shares, when redeemed, may be worth more or less than their original cost. Current performance may be higher or lower than the performance data shown. For up-to-date month-end performance information please call 1-800-480-4111. The graph illustrates comparative performance for $10,000 invested in the JPMorgan Insurance Trust Mid Cap Value Portfolio and the Russell Midcap Value Index. The performance of the Portfolio assumes reinvestment of all dividends. The performance of the index does not include fees and expenses attributable to the Portfolio and has been adjusted to reflect reinvestment of all dividends and capital gains of the securities included in the benchmark. The Russell Midcap Value Index measures the performance of mid cap companies with lower price-to-book ratios and lower forecasted growth values. Investors cannot invest directly in an index. The performance does not reflect any charges imposed by the Policies or Eligible Plans. If these charges were included, the returns would be lower than shown. Performance may also reflect the waiver and reimbursement of the Portfolio’s fees/expenses for certain periods since the inception date. Without these waivers and reimbursements, performance would have been lower. JUNE 30, 2006 JPMORGAN INSURANCE TRUST 3
JPMorgan Insurance Trust Diversified Mid Cap Value Portfolio
(formerly JPMorgan Investment Trust Mid Cap Value Portfolio) SCHEDULE OF PORTFOLIO INVESTMENTS
AS OF JUNE 30, 2006 (Unaudited) SHARES
|
|
|
| SECURITY DESCRIPTION
|
| VALUE($)
|
|---|
Long-Term Investments — 98.6% | | | | | | Common Stocks — 98.6% | | | | | | Aerospace & Defense — 0.7% | | 9,700 | | | | Alliant Techsystems, Inc. (a) (c) | | | 740,595 | | | | | | | Beverages — 1.5% | | 6,400 | | | | Brown-Forman Corp., Class B | | | 457,280 | | | 44,000 | | | | Constellation Brands, Inc., Class A (a) | | | 1,100,000 | | | | | | | | | | 1,557,280 | | | | | | | Building Products — 0.6% | | 14,300 | | | | American Standard Cos., Inc. | | | 618,761 | | | | | | | Capital Markets — 3.0% | | 6,400 | | | | Bear Stearns Cos., Inc. (The) | | | 896,512 | | | 27,500 | | | | E*Trade Financial Corp. (a) | | | 627,550 | | | 3,100 | | | | Legg Mason, Inc. | | | 308,512 | | | 19,800 | | | | Mellon Financial Corp. | | | 681,714 | | | 11,800 | | | | Northern Trust Corp. | | | 652,540 | | | | | | | | | | 3,166,828 | | | | | | | Chemicals — 3.5% | | 16,347 | | | | Albemarle Corp. (c) | | | 782,694 | | | 11,200 | | | | Ashland, Inc. | | | 747,040 | | | 15,400 | | | | Lubrizol Corp. | | | 613,690 | | | 9,900 | | | | PPG Industries, Inc. | | | 653,400 | | | 12,600 | | | | Sigma-Aldrich Corp. | | | 915,264 | | | | | | | | | | 3,712,088 | | | | | | | Commercial Banks — 6.5% | | 26,500 | | | | Compass Bancshares, Inc. | | | 1,473,400 | | | 14,200 | | | | Cullen/Frost Bankers, Inc. | | | 813,660 | | | 6,700 | | | | M&T Bank Corp. | | | 790,064 | | | 29,900 | | | | Mercantile Bankshares Corp. | | | 1,066,533 | | | 30,150 | | | | North Fork Bancorp, Inc. | | | 909,625 | | | 23,100 | | | | TCF Financial Corp. | | | 610,995 | | | 14,400 | | | | Zions Bancorporation | | | 1,122,336 | | | | | | | | | | 6,786,613 | | | | | | | Commercial Services & Supplies — 1.0% | | 12,300 | | | | Pitney Bowes, Inc. | | | 507,990 | | | 13,400 | | | | Republic Services, Inc. | | | 540,556 | | | | | | | | | | 1,048,546 | | | | | | | Computers & Peripherals — 1.0% | | 28,400 | | | | NCR Corp. (a) | | | 1,040,576 | | | | | | | Construction Materials — 1.6% | | 10,950 | | | | Florida Rock Industries, Inc. (c) | | | 543,887 | | | 14,000 | | | | Vulcan Materials Co. | | | 1,092,000 | | | | | | | | | | 1,635,887 | | | | | | | Containers & Packaging — 1.3% | | 22,000 | | | | Ball Corp. | | | 814,880 | | | 12,400 | | | | Temple-Inland, Inc. | | | 531,588 | | | | | | | | | | 1,346,468 | | | | | | | Distributors — 0.5% | | 12,000 | | | | Genuine Parts Co. | | | 499,920 | | | | | | | Diversified Telecommunication Services — 0.9% | | 24,400 | | | | CenturyTel, Inc. | | | 906,460 | | | | | | | Electric Utilities — 4.4% | | 26,200 | | | | American Electric Power Co., Inc. | | | 897,350 | | | 26,600 | | | | DPL, Inc. | | | 712,880 | | | 15,500 | | | | Edison International | | | 604,500 | | | 11,200 | | | | FirstEnergy Corp. | | | 607,152 | | | 28,700 | | | | PPL Corp. | | | 927,010 | | | 42,000 | | | | Westar Energy, Inc. (c) | | | 884,100 | | | | | | | | | | 4,632,992 | | | | | | | Electrical Equipment — 1.4% | | 17,500 | | | | Ametek, Inc. | | | 829,150 | | | 7,000 | | | | Cooper Industries Ltd., Class A | | | 650,440 | | | | | | | | | | 1,479,590 | | | | | | | Electronic Equipment & Instruments — 1.6% | | 5,800 | | | | Amphenol Corp., Class A (c) | | | 324,568 | | | 28,900 | | | | Arrow Electronics, Inc. (a) | | | 930,580 | | | 16,600 | | | | Jabil Circuit, Inc. | | | 424,960 | | | | | | | | | | 1,680,108 | | | | | | | Energy Equipment & Services — 0.8% | | 9,100 | | | | Complete Production Services, Inc. | | | 215,124 | | | 10,800 | | | | Unit Corp. (a) | | | 614,412 | | | | | | | | | | 829,536 | | | | | | | Food & Staples Retailing — 0.9% | | 10,100 | | | | BJ’s Wholesale Club, Inc. (a) (c) | | | 286,335 | | | 24,700 | | | | Safeway, Inc. | | | 642,200 | | | | | | | | | | 928,535 | | | | | | | Food Products — 2.6% | | 28,200 | | | | Dean Foods Co. (a) | | | 1,048,758 | | | 49,300 | | | | Del Monte Foods Co. | | | 553,639 | | | 19,600 | | | | Hershey Co. (The) | | | 1,079,372 | | | | | | | | | | 2,681,769 | | | | | | | Gas Utilities — 3.5% | | 31,700 | | | | AGL Resources, Inc. | | | 1,208,404 | | | 14,700 | | | | Energen Corp. | | | 564,627 | | | 17,300 | | | | Oneok, Inc. | | | 588,892 | | | 7,700 | | | | Questar Corp. | | | 619,773 | | | 27,500 | | | | UGI Corp. | | | 677,050 | | | | | | | | | | 3,658,746 | |
SEE NOTES TO FINANCIAL STATEMENTS.
4 JPMORGAN INSURANCE TRUST JUNE 30, 2006
SHARES
|
|
|
| SECURITY DESCRIPTION
|
| VALUE($)
|
|---|
Long-Term Investments — Continued | | | | | | Health Care Providers & Services — 4.9% | | 14,300 | | | | Community Health Systems, Inc. (a) | | | 525,525 | | | 27,000 | | | | Coventry Health Care, Inc. (a) | | | 1,483,380 | | | 10,700 | | | | DaVita, Inc. (a) | | | 531,790 | | | 18,400 | | | | Healthspring, Inc. (a) (c) | | | 345,000 | | | 11,953 | | | | Henry Schein, Inc. (a) | | | 558,564 | | | 9,700 | | | | Manor Care, Inc. (c) | | | 455,124 | | | 13,800 | | | | Omnicare, Inc. | | | 654,396 | | | 9,800 | | | | Quest Diagnostics, Inc. | | | 587,216 | | | | | | | | | | 5,140,995 | | | | | | | Hotels, Restaurants & Leisure — 4.8% | | 34,700 | | | | Applebee’s International, Inc. (c) | | | 666,934 | | | 40,500 | | | | Hilton Hotels Corp. | | | 1,145,340 | | | 14,800 | | | | International Game Technology | | | 561,512 | | | 8,600 | | | | Marriott International, Inc., Class A | | | 327,832 | | | 27,100 | | | | OSI Restaurant Partners, Inc.(c) | | | 937,660 | | | 8,400 | | | | Station Casinos, Inc. (c) | | | 571,872 | | | 15,800 | | | | Yum! Brands, Inc. | | | 794,266 | | | | | | | | | | 5,005,416 | | | | | | | Household Durables — 1.3% | | 5,500 | | | | Centex Corp. | | | 276,650 | | | 10,900 | | | | Fortune Brands, Inc. | | | 774,009 | | | 6,400 | | | | Lennar Corp., Class A | | | 283,968 | | | | | | | | | | 1,334,627 | | | | | | | Household Products — 0.8% | | 14,000 | | | | Clorox Co. | | | 853,580 | | | | | | | Industrial Conglomerates — 1.7% | | 10,200 | | | | Carlisle Cos., Inc. | | | 808,860 | | | 17,100 | | | | Walter Industries, Inc. (c) | | | 985,815 | | | | | | | | | | 1,794,675 | | | | | | | Insurance — 8.0% | | 28,100 | | | | Assurant, Inc. | | | 1,360,040 | | | 16,380 | | | | Cincinnati Financial Corp. | | | 770,024 | | | 8,200 | | | | Everest Re Group Ltd. (Barbados) | | | 709,874 | | | 19,902 | | | | Fidelity National Financial, Inc. | | | 775,183 | | | 18,800 | | | | Genworth Financial, Inc. | | | 654,992 | | | 15,500 | | | | IPC Holdings Ltd. (Bermuda) (c) | | | 382,230 | | | 70,312 | | | | Old Republic International Corp. | | | 1,502,567 | | | 12,300 | | | | Principal Financial Group | | | 684,495 | | | 15,700 | | | | Protective Life Corp. | | | 731,934 | | | 9,200 | | | | Safeco Corp. | | | 518,420 | | | 8,800 | | | | Willis Group Holdings Ltd.
(United Kingdom) (c) | | | 282,480 | | | | | | | | | | 8,372,239 | | | | | | | IT Services — 0.3% | | 6,800 | | | | Affiliated Computer Services, Inc.,
Class A (a) (c) | | | 350,948 | | | | | | | Machinery — 2.1% | | 15,500 | | | | Crane Co. | | | 644,800 | | | 13,500 | | | | Dover Corp. | | | 667,305 | | | 5,100 | | | | Harsco Corp. | | | 397,596 | | | 8,500 | | | | Kennametal, Inc. (c) | | | 529,125 | | | | | | | | | | 2,238,826 | | | | | | | Media — 3.4% | | 12,300 | | | | Cablevision Systems Corp. New York Group, Class A | | | 263,835 | | | 22,200 | | | | Clear Channel Communications, Inc. | | | 687,090 | | | 17,100 | | | | Clear Channel Outdoor Holdings, Inc.,
Class A (a) | | | 358,416 | | | 26,700 | | | | Interactive Data Corp. (a) | | | 536,403 | | | 14,994 | | | | McClatchy Co., Class A (c) | | | 601,576 | | | 5,274 | | | | R.H. Donnelley Corp. | | | 285,165 | | | 40,100 | | | | Regal Entertainment Group, Class A (c) | | | 814,832 | | | | | | | | | | 3,547,317 | | | | | | | Multi-Utilities — 3.6% | | 30,100 | | | | Energy East Corp. (c) | | | 720,293 | | | 19,320 | | | | MDU Resources Group, Inc. (c) | | | 707,305 | | | 21,900 | | | | NSTAR (c) | | | 626,340 | | | 22,500 | | | | PG&E Corp. | | | 883,800 | | | 20,900 | | | | SCANA Corp. | | | 806,322 | | | | | | | | | | 3,744,060 | | | | | | | Multiline Retail — 1.3% | | 26,600 | | | | Family Dollar Stores, Inc. | | | 649,838 | | | 18,338 | | | | Federated Department Stores, Inc. | | | 671,171 | | | | | | | | | | 1,321,009 | | | | | | | Office Electronics — 0.9% | | 65,700 | | | | Xerox Corp. (a) | | | 913,887 | | | | | | | Oil, Gas & Consumable Fuels — 5.2% | | 17,900 | | | | Consol Energy, Inc. | | | 836,288 | | | 12,724 | | | | Devon Energy Corp. | | | 768,657 | | | 10,700 | | | | Energy Transfer Equity LP | | | 283,443 | | | 14,800 | | | | Helix Energy Solutions Group, Inc. (a) (c) | | | 597,328 | | | 13,600 | | | | Kinder Morgan, Inc. | | | 1,358,504 | | | 15,900 | | | | Newfield Exploration Co. (a) | | | 778,146 | | | 34,500 | | | | Williams Cos., Inc. | | | 805,920 | | | | | | | | | | 5,428,286 | | | | | | | Paper & Forest Products — 0.3% | | 10,539 | | | | MeadWestvaco Corp. | | | 294,354 | | | | | | | Personal Products — 0.7% | | 19,900 | | | | Estee Lauder Cos., Inc. (The) Class A | | | 769,533 | |
SEE NOTES TO FINANCIAL STATEMENTS.
JUNE 30, 2006 JPMORGAN INSURANCE TRUST 5
JPMorgan Insurance Trust Diversified Mid Cap Value Portfolio
(formerly JPMorgan Investment Trust Mid Cap Value Portfolio) SCHEDULE OF PORTFOLIO INVESTMENTS
AS OF JUNE 30, 2006 (Unaudited) (continued) SHARES
|
|
|
| SECURITY DESCRIPTION
|
| VALUE($)
|
|---|
Long-Term Investments — Continued | | | | | | Real Estate Investment Trusts (REITs) — 7.9% | | 17,600 | | | | AMB Property Corp. REIT | | | 889,680 | | | 6,800 | | | | AvalonBay Communities, Inc. REIT | | | 752,216 | | | 6,000 | | | | Boston Properties, Inc. REIT | | | 542,400 | | | 33,100 | | | | Cousins Properties, Inc. REIT (c) | | | 1,023,783 | | | 15,900 | | | | Host Hotels & Resorts, Inc. REIT | | | 347,733 | | | 19,100 | | | | iStar Financial, Inc. REIT | | | 721,025 | | | 12,700 | | | | Kimco Realty Corp. REIT | | | 463,423 | | | 21,320 | | | | Liberty Property Trust REIT (c) | | | 942,344 | | | 12,200 | | | | PS Business Parks, Inc., Class A, REIT (c) | | | 719,800 | | | 19,200 | | | | Rayonier, Inc., REIT | | | 727,872 | | | 23,800 | | | | United Dominion Realty Trust, Inc. REIT | | | 666,638 | | | 4,400 | | | | Vornado Realty Trust REIT | | | 429,220 | | | | | | | | | | 8,226,134 | | | | | | | Real Estate Management & Development — 0.8% | | 25,200 | | | | Brookfield Properties Corp. (Canada) | | | 810,684 | | | | | | | Road & Rail — 0.4% | | 8,100 | | | | Norfolk Southern Corp. | | | 431,082 | | | | | | | Software — 0.5% | | 14,200 | | | | CA, Inc. | | | 291,810 | | | 20,200 | | | | Take-Two Interactive Software, Inc. (a) (c) | | | 215,332 | | | | | | | | | | 507,142 | | | | | | | Specialty Retail — 5.6% | | 14,400 | | | | American Eagle Outfitters, Inc. | | | 490,176 | | | 28,779 | | | | Autonation, Inc. (a) | | | 617,022 | | | 11,900 | | | | AutoZone, Inc. (a) | | | 1,049,580 | | | 22,300 | | | | Bed Bath & Beyond, Inc. (a) | | | 739,691 | | | 38,900 | | | | Limited Brands, Inc. | | | 995,451 | | | 32,600 | | | | Tiffany & Co. | | | 1,076,452 | | | 37,100 | | | | TJX Cos., Inc. | | | 848,106 | | | | | | | | | | 5,816,478 | | | | | | | Textiles, Apparel & Luxury Goods — 2.4% | | 16,300 | | | | Columbia Sportswear Co. (a) (c) | | | 737,738 | | | 26,300 | | | | V.F. Corp. | | | 1,786,296 | | | | | | | | | | 2,524,034 | | | | | | | Thrifts & Mortgage Finance — 3.0% | | 16,600 | | | | Golden West Financial Corp. | | | 1,231,720 | | | 53,200 | | | | Hudson City Bancorp, Inc. | | | 709,156 | | | 12,800 | | | | MGIC Investment Corp. | | | 832,000 | | | 15,330 | | | | Sovereign Bancorp, Inc. | | | 311,352 | | | | | | | | | | 3,084,228 | | | | | | | Wireless Telecommunication Services — 1.4% | | 17,300 | | | | Alltel Corp. | | | 1,104,259 | | | 9,700 | | | | Telephone & Data Systems, Inc. | | | 377,330 | | | | | | | | | | 1,481,589 | | | | | | | Total Common Stocks
(Cost $97,163,787) | | | 102,942,421 | | Short-Term Investment — 1.5% | | | | | | Investment Company — 1.5% | | 1,600,121 | | | | JPMorgan Liquid Assets Money Market
Fund (b) (m)
(Cost $1,600,121) | | | 1,600,121 | | PRINCIPAL
AMOUNT($) | | | | | | | Investment of Cash Collateral for Securities on Loan — 12.8% | | | | | | Certificates of Deposit — 2.8% | | 900,000 | | | | Credit Suisse First Boston, NY, FRN,
5.33%, 10/17/06 | | | 900,000 | | | 1,000,000 | | | | Deutsche Bank New York, FRN,
5.41%, 01/22/08 | | | 1,000,000 | | | 999,474 | | | | Societe Generale, New York, FRN,
5.26%, 06/20/07 | | | 999,474 | | | | | | | | | | 2,899,474 | | | | | | | Corporate Notes — 7.5% | | 1,000,000 | | | | American Express Credit Corp., FRN
5.21%, 01/15/08 | | | 1,000,000 | | | 1,000,000 | | | | Bank of America, FRN, 5.31%, 11/07/06 | | | 1,000,000 | | | 1,400,316 | | | | Beta Finance, Inc., FRN, 5.38%, 03/15/07 | | | 1,400,316 | | | 1,400,000 | | | | CDC Financial Products Inc., FRN,
5.41%, 07/31/06 | | | 1,400,000 | | | 800,000 | | | | Citigroup Global Markets, Inc., FRN,
5.38%, 07/07/06 | | | 800,000 | | | 99,045 | | | | Citigroup Global Markets Holding, Inc., FRN, 5.41%, 12/12/06 | | | 99,045 | | | 1,000,090 | | | | Links Finance LLC, FRN, 5.36%, 10/06/06 | | | 1,000,090 | | | 148,568 | | | | MBIA Global Funding LLC, FRN,
5.42%, 01/26/07 | | | 148,568 | | | 1,000,000 | | | | Unicredito Italiano Bank plc, FRN,
5.16%, 07/31/07 | | | 1,000,000 | | | | | | | | | | 7,848,019 | | | | | | | Repurchase Agreements — 2.5% | | 836,545 | | | | Banc of America Securities LLC, 5.32%, dated 06/30/06, due 07/03/06, repurchase price $836,916, collateralized by U.S. Government Agency Mortgages. | | | 836,545 | | | 900,000 | | | | Morgan Stanley, 5.33%, dated 06/30/06,
due 07/03/06, repurchase price $900,400, collateralized by U.S. Government
Agency Mortgages. | | | 900,000 | |
SEE NOTES TO FINANCIAL STATEMENTS.
6 JPMORGAN INSURANCE TRUST JUNE 30, 2006
PRINCIPAL
AMOUNT($)
|
|
|
| SECURITY DESCRIPTION
|
| VALUE($)
|
|---|
Investment of Cash Collateral for Securities on Loan — Continued | | | | | | Repurchase Agreements — Continued | | 900,000 | | | | UBS Securities LLC, 5.32%, dated 06/30/06, due 07/03/06, repurchase price $900,399, collateralized by U.S. Government Agency Mortgages. | | | 900,000 | | | | | | | | | | 2,636,545 | | | | | | | Total Investments of Cash Collateral for Securities on Loan
(cost $13,384,038) | | | 13,384,038 | | | | | | | Total Investments — 112.9%
(Cost $112,147,946) | | | 117,926,580 | | | | | | | Liabilities in Excess of
Other Assets — (12.9)% | | | (13,456,242 | ) | | | | | | NET ASSETS — (100.0%) | | $ | 104,470,338 | |
Percentages indicated are based on net assets. | (a) | – | | Non-income producing security. |
| (b) | – | | Investment in affiliate. Money market fund registered under the Investment Company Act of 1940, as amended, and advised by JPMorgan Investment Advisors Inc. |
| (c) | – | | Security, or a portion of the security, has been delivered to a counterparty as part of a security lending transaction. |
| (m) | – | | All or a portion of this security is segregated for current or potential holdings of futures, swaps, options, TBAs, when-issued securities, delayed delivery securities, and reverse repurchase agreements. |
| FRN | – | | Floating Rate Note. The rate shown is the rate in effect as of June 30, 2006. |
SEE NOTES TO FINANCIAL STATEMENTS.
JUNE 30, 2006 JPMORGAN INSURANCE TRUST 7
STATEMENT OF ASSETS AND LIABILITIES
AS OF JUNE 30, 2006 (Unaudited)
|
|
|
| Diversified Mid Cap
Value Portfolio
|
|---|
ASSETS: | | | | | | | | Investments in non-affiliates, at value | | | | $ | 116,326,459 | | | Investments in affiliates, at value | | | | | 1,600,121 | | | Total investment securities, at value | | | | | 117,926,580 | | | Cash | | | | | 3,230 | | | Receivables: | | | | | | | | Investment securities sold | | | | | 228,703 | | | Portfolio shares sold | | | | | 13,924 | | | Interest and dividends | | | | | 149,654 | | | Prepaid expenses and other assets | | | | | 5,183 | | | Total Assets | | | | | 118,327,274 | | | | LIABILITIES: | | | | | | | | Payables: | | | | | | | | Investment securities purchased | | | | | 246,882 | | | Collateral for securities lending program | | | | | 13,384,038 | | | Portfolio shares redeemed | | | | | 98,391 | | | Accrued liabilities: | | | | | | | | Investment advisory fees | | | | | 56,324 | | | Administration fees | | | | | 8,863 | | | Custodian and accounting fees | | | | | 8,609 | | | Other | | | | | 53,829 | | | Total Liabilities | | | | | 13,856,936 | | | Net Assets | | | | $ | 104,470,338 | | | | NET ASSETS: | | | | | | | | Paid in capital | | | | $ | 72,693,382 | | | Accumulated undistributed (distributions in excess of) net investment income | | | | | 994,061 | | | Accumulated net realized gains (losses) | | | | | 25,004,261 | | | Net unrealized appreciation (depreciation) | | | | | 5,778,634 | | | Total Net Assets | | | | $ | 104,470,338 | | | | | Outstanding units of beneficial interest (shares) (unlimited amount authorized, no par value) | | | | | 6,986,456 | | | Net asset value, offering and redemption price per share | | | | $ | 14.95 | | | | | Cost of investments | | | | $ | 112,147,946 | | | Market value of securities on loan | | | | | 13,138,007 | |
SEE NOTES TO FINANCIAL STATEMENTS.
8 JPMORGAN INSURANCE TRUST JUNE 30, 2006
STATEMENT OF OPERATIONS
FOR THE SIX MONTHS ENDED JUNE 30, 2006 (Unaudited)
|
|
|
| Diversified Mid Cap
Value Portfolio
|
|---|
INVESTMENT INCOME: | | | | | | | | Dividend income | | | | $ | 1,686,583 | | | Dividend income from affiliates (a) | | | | | 162,385 | | | Income from securities lending (net) | | | | | 63,348 | | | Foreign taxes withheld | | | | | (1,688 | ) | | Total investment income | | | | | 1,910,628 | | | | EXPENSES: | | | | | | | | Investment advisory fees | | | | | 702,204 | | | Administration fees | | | | | 133,023 | | | Custodian and accounting fees | | | | | 17,429 | | | Professional fees | | | | | 42,454 | | | Trustees’ and Officers’ fees | | | | | 1,516 | | | Transfer agent fees | | | | | 6,543 | | | Printing and mailing costs | | | | | 65,991 | | | Other | | | | | 16,521 | | | Total expenses | | | | | 985,681 | | | Less amounts waived | | | | | (71,251 | ) | | Less earnings credits | | | | | (523 | ) | | Net expenses | | | | | 913,907 | | | Net investment income (loss) | | | | | 996,721 | | | | REALIZED/UNREALIZED GAINS (LOSSES): | | | | | | | | Net realized gain (loss) on transactions from investments | | | | | 25,145,701 | | | Change in net unrealized appreciation (depreciation) of investments | | | | | (11,988,968 | ) | | Net realized/unrealized gains (losses) | | | | | 13,156,733 | | | Change in net assets resulting from operations | | | | $ | 14,153,454 | |
| (a) | | Includes reimbursements of investment advisory and administration fees. See Fees and Other Transactions with Affiliates in the Notes to Financial Statements. |
SEE NOTES TO FINANCIAL STATEMENTS.
JUNE 30, 2006 JPMORGAN INSURANCE TRUST 9
STATEMENT OF CHANGES IN NET ASSETS
FOR THE PERIODS INDICATED
| | | | Diversified Mid Cap
Value Portfolio
| |
|---|
|
|
|
| Six Months
Ended
6/30/2006
(Unaudited)
|
| Year
Ended
12/31/2005
|
|---|
CHANGE IN NET ASSETS RESULTING FROM OPERATIONS: | | | | | | | | | | | | Net investment income (loss) | | | | $ | 996,721 | | | $ | 1,834,618 | | | Net realized gain (loss) | | | | | 25,145,701 | | | | 23,526,137 | | | Change in net unrealized appreciation (depreciation) | | | | | (11,988,968 | ) | | | (7,944,269 | ) | | Change in net assets resulting from operations | | | | | 14,153,454 | | | | 17,416,486 | | | | DISTRIBUTIONS TO SHAREHOLDERS: | | | | | | | | | | | | From net investment income | | | | | (1,830,573 | ) | | | (960,163 | ) | | From net realized gains | | | | | (23,354,076 | ) | | | (11,103,619 | ) | | Total distributions to shareholders | | | | | (25,184,649 | ) | | | (12,063,782 | ) | | | CHANGE IN NET ASSETS FROM CAPITAL TRANSACTIONS: | | | | | | | | | | | | Proceeds from shares issued | | | | | 28,373,790 | | | | 90,608,851 | | | Dividends reinvested | | | | | 25,184,649 | | | | 12,063,782 | | | Cost of shares redeemed | | | | | (152,574,145 | ) | | | (31,679,459 | ) | | Change in net assets from capital transactions | | | | | (99,015,706 | ) | | | 70,993,174 | | | | NET ASSETS: | | | | | | | | | | | | Change in net assets | | | | | (110,046,901 | ) | | | 76,345,878 | | | Beginning of period | | | | | 214,517,239 | | | | 138,171,361 | | | End of period | | | | $ | 104,470,338 | | | $ | 214,517,239 | | | Accumulated undistributed (distributions in excess of) net investment income | | | | $ | 994,061 | | | $ | 1,827,913 | | | | SHARE TRANSACTIONS: | | | | | | | | | | | | Issued | | | | | 1,769,345 | | | | 5,987,243 | | | Reinvested | | | | | 1,663,451 | | | | 825,720 | | | Redeemed | | | | | (9,934,488 | ) | | | (2,057,526 | ) | | Change in shares | | | | | (6,501,692 | ) | | | 4,755,437 | |
SEE NOTES TO FINANCIAL STATEMENTS.
10 JPMORGAN INSURANCE TRUST JUNE 30, 2006
THIS PAGE IS INTENTIONALLY LEFT BLANK JUNE 30, 2006 JPMORGAN INSURANCE TRUST 11
FINANCIAL HIGHLIGHTS
FOR THE PERIODS INDICATED
| | | |
|
|
|
|
|
|
|
| Per share operating performance
|
|
|---|
| | | |
| | Investment operations
| | Distributions
| |
|---|
|
|
|
| Net asset
value,
beginning
of period
|
| Net
investment
income
(loss)
|
| Net realized
and unrealized
gains
(losses) on
investments
|
| Total from
investment
operations
|
| Net
investment
income
|
| Net
realized
gains
|
| Total
distributions
|
|---|
Diversified Mid Cap Value Portfolio | | | | | | | | | | | | | | | | | | | | | | | | | | | | | | | | Six Months Ended June 30, 2006 (Unaudited) | | | | $ | 15.90 | | | $ | 0.14 | | | $ | 0.67 | | | $ | 0.81 | | | $ | (0.13 | ) | | $ | (1.63 | ) | | $ | (1.76 | ) | | Year Ended December 31, 2005 | | | | | 15.82 | | | | 0.14 | | | | 1.29 | | | | 1.43 | | | | (0.11 | ) | | | (1.24 | ) | | | (1.35 | ) | | Year Ended December 31, 2004 | | | | | 13.78 | | | | 0.11 | | | | 2.00 | | | | 2.11 | | | | (0.07 | ) | | | — | | | | (0.07 | ) | | Year Ended December 31, 2003 | | | | | 10.45 | | | | 0.07 | | | | 3.33 | | | | 3.40 | | | | (0.07 | ) | | | — | | | | (0.07 | ) | | Year Ended December 31, 2002 | | | | | 12.68 | | | | 0.07 | | | | (1.55 | ) | | | (1.48 | ) | | | — | | | | (0.75 | ) | | | (0.75 | ) | | Year Ended December 31, 2001 | | | | | 13.16 | | | | 0.08 | | | | 0.45 | | | | 0.53 | | | | (0.08 | ) | | | (0.93 | ) | | | (1.01 | ) |
| (a) | | Annualized for periods less than one year. |
| (b) | | Not annualized for periods less than one year. |
| (c) | | Includes adjustments in accordance with accounting principles generally accepted in the United States of America and as such, the net asset value for financial reporting purposes and the returns based upon those net asset values may differ from the net asset value and returns for shareholder transactions. |
SEE NOTES TO FINANCIAL STATEMENTS.
12 JPMORGAN INSURANCE TRUST JUNE 30, 2006
|
| Ratios/Supplemental data
|
|---|
| | |
| |
| | Ratios to average net assets (a)
| |
|---|
Net asset
value, end
of period
|
|
| Total
return (b)(c)
|
| Net assets
end of
period
(000’s)
|
| Net
expenses
|
| Net
investment
income
(loss)
|
| Expenses
without waivers,
reimbursements
and earnings credits
|
| Portfolio
turnover
rate (b)
|
|---|
| $14.95 | | | | 4.93 | % | | $ | 104,470 | | | | 0.94 | % | | | 1.02 | % | | | 1.01 | % | | | 32 | % | | 15.90 | | | | 9.75 | | | | 214,517 | | | | 0.94 | | | | 1.05 | | | | 0.94 | | | | 55 | | | 15.82 | | | | 15.40 | | | | 138,171 | | | | 0.92 | | | | 0.81 | | | | 0.93 | | | | 75 | | | 13.78 | | | | 32.75 | | | | 112,372 | | | | 0.93 | | | | 0.65 | | | | 0.97 | | | | 54 | | | 10.45 | | | | (12.85 | ) | | | 76,913 | | | | 0.95 | | | | 0.61 | | | | 0.98 | | | | 106 | | | 12.68 | | | | 4.80 | | | | 82,331 | | | | 0.95 | | | | 0.67 | | | | 0.97 | | | | 103 | |
SEE NOTES TO FINANCIAL STATEMENTS.
JUNE 30, 2006 JPMORGAN INSURANCE TRUST 13
NOTES TO FINANCIAL STATEMENTS
AS OF JUNE 30, 2006 (Unaudited) 1. Organization JPMorgan Insurance Trust (formerly JPMorgan Investment Trust) (the “Trust”) is registered under the Investment Company Act of 1940, as amended (the “1940 Act”), as an open-end investment company established as a Massachusetts business trust. The JPMorgan Insurance Trust Diversified Mid Cap Value Portfolio is a separate Portfolio of the Trust (the “Portfolio”). Effective May 1, 2006, the Board of Trustees approved the name change from JPMorgan Investment Trust Mid Cap Value Portfolio to JPMorgan Insurance Trust Diversified Mid Cap Value Portfolio and designated the existing shares as Class 1 Shares. Portfolio shares are offered only to separate accounts of participating insurance companies and eligible plans. Individuals may not purchase shares directly from the Portfolio. Effective May 1, 2006, the Diversified Mid Cap Value Portfolio has been publicly offered only on a limited basis. Investors are not eligible to purchase shares of the Portfolio unless they meet certain requirements as described in the prospectus. 2. Significant Accounting Policies The following is a summary of significant accounting policies followed by the Trust in preparation of its financial statements. The policies are in accordance with accounting principles generally accepted in the United States of America. The preparation of financial statements requires management to make estimates and assumptions that affect the reported amounts of assets and liabilities at the date of the financial statements and the reported amounts of income and expenses for the period. Actual results could differ from those estimates. A. Valuation of Investments — Listed securities are valued at the last sale price on the exchange on which they are primarily traded. The value of National Market Systems equity securities quoted by the NASDAQ Stock Market shall generally be the NASDAQ Official Closing Price. Unlisted securities are valued at the last sale price provided by an independent pricing agent or principal market maker. Listed securities for which the latest sales prices are not available are valued at the mean of the latest bid and ask price as of the closing of the primary exchange where such securities are normally traded. Corporate debt securities, debt securities issued by the U.S. Treasury or a U.S. government agency (other than short-term investments maturing in 61 days or less), and municipal securities are valued each day based on readily available market quotations received from third party broker-dealers of comparable securities or independent or affiliated pricing services approved by the Board of Trustees. Such pricing services and broker-dealers will generally provide bid-side quotations. Generally, short-term investments (other than certain high yield securities) maturing in 61 days or less are valued at amortized cost, which approximates market value. Futures, options and other derivatives are valued on the basis of available market quotations. Investments in other open-end investment companies are valued at such investment company’s current day closing net asset value per share. Securities or other assets for which market quotations are not readily available or for which market quotations do not represent the value at the time of pricing (including certain illiquid securities) are fair valued in accordance with procedures established by and under the supervision and responsibility of the Trustees. Trading in securities on most foreign exchanges and over-the-counter markets is normally completed before the close of the domestic market and may also take place on days when the domestic market is closed. In accordance with procedures adopted by the Trustees, the Portfolio applies fair value pricing on a daily basis except for North American, South American, Central American and Caribbean equity securities held in its portfolio by utilizing the quotations of an independent pricing service, unless the Portfolio’s adviser determines that use of another valuation methodology is appropriate. The pricing services uses statistical analyses and quantitative models to adjust local market prices using factors such as subsequent movement and changes in the prices of indices, securities and exchange rates in other markets, in determining fair value as of the time the Portfolio calculates its net asset value. B. Repurchase Agreements — The Portfolio may enter into repurchase agreement transactions with institutions that meet the advisor’s credit guidelines. Each repurchase agreement is valued at amortized cost. The Portfolio requires that the collateral received in a repurchase agreement transaction be transferred to a custodian in a manner sufficient to enable the Portfolio to obtain collateral in the event of a counterparty default. If the counterparty defaults and the fair value of the collateral declines, realization of the collateral by the Portfolio may be delayed or limited. C. Securities Lending — To generate additional income, the Portfolio lend up to 33-1/3% of its assets pursuant to agreements (“borrower agreements”) requiring that the loan be continuously secured by cash or securities issued by the U.S. government or its agencies or its instrumentalities (“U.S. government securities”). JPMorgan Chase Bank, N.A. (“JPMCB”), an affiliate of the Portfolio, serves as lending agent pursuant to a Securities Lending Agreement approved by the Board of Trustees (the “Securities Lending Agreement”). Under the Securities Lending Agreement, JPMCB acting as agent for the Portfolio, loans securities to approved borrowers pursuant to approved borrower agreements in exchange for collateral equal to at least 100% of the market value of the loaned securities plus accrued interest. During the term of the loan, the Portfolio receives payments from borrowers equivalent to the dividends and interest that would have been earned on securities lent while simultaneously seeking to earn income on the investment of cash collateral in accordance with investment guidelines contained in the Securities Lending Agreement. For loans secured by cash, the Portfolio retains the interest on cash collateral investments but is required to pay the borrower a portion of such interest for the use of the cash collateral. For loans secured by U.S. government securities, 14 JPMORGAN INSURANCE TRUST JUNE 30, 2006
the borrower pays a borrower fee to the lending agent on behalf of the Portfolio. The net income earned on the securities lending (after payment of rebates and the lending agent’s fee) is included in the Statement of Operations as Income from securities lending (net). Information on the investment of cash collateral is shown in the Schedule of Portfolio Investments.
Under the Securities Lending Agreement, JPMCB is entitled to a fee equal to (i) 0.06% calculated on an annualized basis and accrued daily, based upon the value of collateral received from borrowers for each loan of U.S. Securities outstanding during a given month and (ii) 0.1142% calculated on an annualized basis and accrued daily, based upon the value of collateral received from borrowers for each loan of non-U.S. Securities outstanding during a given month. For the period ended June 30, 2006, JPMCB voluntarily reduced its fees to: (i) 0.05% for each loan of U.S. Securities and (ii) 0.10% for each loan of non-U.S. Securities, respectively. Risks of delay in recovery of securities or even loss of rights in the securities may occur should the borrower of the securities fail financially. Risks may also arise to the extent that the value of the securities loaned increases above the value of the collateral received. JPMCB will indemnify the Portfolio from any losses resulting from a borrower’s failure to return a loaned security when due. Such indemnification does not extend to losses associated with declines in the value of cash collateral investments. Loans are subject to termination by the Portfolio or the borrower at any time, and are, therefore, not considered to be illiquid investments. As of June 30, 2006, the Portfolio had securities with the following market values on loan, received the following collateral for the period then ended and paid the following amounts to related party affiliates:
|
|
|
| Lending
Agent
Fees Paid
|
| Market
Value of
Collateral
|
| Market Value
of Loaned
Securities
|
|---|
| | | | | $ | 5,337 | | | $ | 13,384,038 | | | $ | 13,138,007 | |
D. Security Transactions and Investment Income — Investment transactions are accounted for on the trade date (the date the order to buy or sell is executed). Securities gains and losses are calculated on a specifically identified cost basis. Interest income is determined on the basis of coupon interest accrued using the effective interest method adjusted for amortization of premiums and accretion of discounts. Dividend income less foreign taxes withheld (if any) is recorded on the ex-dividend date or when the Portfolio first learns of the dividend. The Portfolio records distributions received in excess of income from underlying investments as a reduction of cost of investments and/or realized gain. Such amounts are based on estimates if actual amounts are not available and actual amounts of income, realized gain and return of capital may differ from the estimated amounts. The Portfolio adjusts the estimated amounts of components of distributions (and consequently its net investment income) as necessary once the issuers provide information about the actual composition of the distributions. E. Allocation of Expenses — Expenses directly attributable to the Portfolio are charged directly to the Portfolio while the expenses attributable to more than one portfolio of the Trust are allocated among the respective portfolios. F. Federal Income Taxes — The Portfolio is treated as a separate taxable entity for Federal income tax purposes. The Portfolio’s policy is to comply with the provisions of the Internal Revenue Code of 1986, as amended (the “Code”), applicable to regulated investment companies and to distribute to shareholders all of its distributable net investment income and net realized gain on investments. Accordingly, no provision for Federal income tax is necessary. The Portfolio is also a segregated portfolio of assets for insurance purposes and intends to comply with the diversification requirements at Subchapter L of the Code. G. Foreign Taxes — The Portfolio may be subject to foreign taxes on income, gains on investments or currency repatriation, a portion of which may be recoverable. The Portfolio will accrue such taxes and recoveries as applicable, based upon their current interpretation of tax rules and regulations that exist in the markets in which they invest. H. Distributions to Shareholders — Dividends from net investment income and net realized capital gains, if any, are generally declared and paid annually. The amount of dividends and distributions from net investment income and from net capital gains are determined in accordance with Federal income tax regulations, which may differ from accounting principles generally accepted in the United States of America. To the extent these “book/tax” differences are permanent in nature (i.e. that they result from other than timing of recognition—“temporary differences”), such amounts are reclassified within the capital accounts based on their Federal tax-basis treatment. I. New Accounting Pronouncement — In July 2006, the Financial Accounting Standards Board issued Interpretation No. 48, “Accounting for Uncertainty in Income Taxes — an Interpretation of FASB Statement No. 109” (the “Interpretation”). The Interpretation establishes for all entities, including pass-through entities such as the Portfolio, a minimum threshold for financial statement recognition of the benefit of positions taken in filing tax returns (including whether an entity is taxable in a particular jurisdiction), and requires certain expanded tax disclosures. The Interpretation is effective for fiscal years beginning after December 15, 2006, and is to be applied to all open tax years as of the date of effectiveness. Management has recently begun to evaluate the application of the Interpretation to the Portfolio, and is not in a position at this time to estimate the significance of its impact, if any, on the Portfolio’s financial statements. 3. Fees and Other Transactions with Affiliates A. Investment Advisory Fee — Pursuant to the Investment Advisory Agreement, JPMorgan Investment Advisors Inc. (the “Advisor”) acts as the investment advisor to the Portfolio. The Advisor is an indirect wholly-owned subsidiary of JPMorgan Chase & Co. (“JPMorgan”). The Advisor supervises the investments of the Portfolio and for such services is paid a fee. The fee is accrued daily and paid monthly based on the Portfolio’s average daily net assets at an annual fee of 0.65%. Prior to May 1, 2006, the investment advisory fee for the Portfolio was 0.74%. JUNE 30, 2006 JPMORGAN INSURANCE TRUST 15
NOTES TO FINANCIAL STATEMENTS
AS OF JUNE 30, 2006 (Unaudited) (continued) The Advisor waived and/or reimbursed Investment Advisory fees as outlined in Note 3.E. The Portfolio may invest in one or more money market funds advised by the Advisor or its affiliates. Advisory and administrative fees are waived and/or reimbursed to the Portfolio in an amount sufficient to offset any doubling up of these fees related to the Portfolio’s investment in an affiliated money market fund to the extent required by law. The amount of these waivers/reimbursements from the money market funds for the six months ended June 30, 2006 was $9,746. B. Administration Fee — Pursuant to an Administration Agreement, JPMorgan Funds Management, Inc. (the “Administrator”), an indirect, wholly-owned subsidiary of JPMorgan, provides certain administration services to the Portfolio. In consideration of these services, the Administrator receives a fee computed daily and paid monthly at the annual rate of 0.15% of the first $25 billion of the average daily net assets of all funds in the JPMorgan Fund Complex (excluding funds of funds and money market funds) and 0.075% of the average daily net assets in excess of $25 billion of all such funds. The Administrator waived Administration fees and/or reimbursed expenses as outlined in Note 3.E. Prior to May 1, 2006, the Administrator provided services for a fee computed daily and paid monthly at the annual rate of 0.18% of the first $250 million of the average daily net assets of the Trust (excluding the Equity Index Portfolio) and 0.14% of the average daily net assets of the Trust in excess of $250 million (excluding the Equity Index Portfolio). J.P. Morgan Investor Services, Co. (“JPMIS”), an indirect, wholly-owned subsidiary of JPMorgan, serves as the Portfolio’s Sub-administrator (the “Sub-administrator”). For its services as Sub-administrator, JPMIS receives a portion of the fees payable to the Administrator. Prior to May 1, 2006, JPMIS also received a portion of the fees payable to the Administrator as compensation for fund accounting services. C. Distribution Fees — Pursuant to a Distribution Agreement, JPMorgan Distribution Services, Inc. (the “Distributor”), a wholly-owned subsidiary of JPMorgan, serves as the Trust’s exclusive underwriter and promotes and arranges for the sale of the Portfolio’s shares. The Distributor receives no compensation in its capacity as the Portfolio’s underwriter. D. Custodian and Accounting Fees — JPMCB provides portfolio custody and accounting services for the Portfolio. The amounts paid directly to JPMCB by the Portfolio for custody and accounting services are included in custodian and accounting fees in the Statement of Operations. (Effective May 1, 2006, the Portfolio began paying the fees for accounting services directly to JPMCB.) The custodian fees may be reduced by credits earned by the Portfolio, based on uninvested cash balances held by the custodian. Such earnings credits are presented separately in the Statement of Operations. Interest expense, if any, paid to the custodian related to cash overdrafts is presented as interest expense in the Statement of Operations E. Waivers and Reimbursements — The Advisor and Administrator have contractually agreed to waive fees or reimburse the Portfolio to the extent that total annual operating expenses (excluding interest, taxes, extraordinary expenses and expenses related to the Board of Trustees’ deferred compensation plan) exceed 0.90% (0.95% prior to May 1, 2006) of the Portfolio’s average daily net assets. The contractual expense limitation agreement was in effect for the six months ended June 30, 2006. The new expense limitation percentage above is in place until at least April 30, 2007. For the six months ended June 30, 2006, the Portfolio’s Advisor contractually waived investment advisory fees for the Portfolio in the amount of $71,251. The Advisor does not expect the Portfolio to repay any such waived fees in future years. F. Other — Certain officers of the Trust are affiliated with the Advisor, the Administrator, the Sub-Administrator and the Distributor. Such officers, with the exception of the Chief Compliance Officer, receive no compensation from the Portfolio for serving in their respective roles. The Board of Trustees appointed a Chief Compliance Officer to the Portfolio in accordance with federal securities regulations. The Portfolio, along with other affiliated portfolios, make reimbursement payments, on a pro-rata basis, to the Administrator for a portion of the fees associated with the Office of the Chief Compliance Officer. Such fees are included in Trustees’ and Officers’ Fees in the Statement of Operations. The Trust adopted a Trustee Deferred Compensation Plan (the “Plan”) which allows the independent Trustees to defer the receipt of all or a portion of compensation related to performance of their duties as a Trustee. The deferred fees are invested in various funds until distribution in accordance with the Plan. During the period, the Portfolio may have purchased securities from an underwriting syndicate in which the principal underwriter or members of the syndicate are affiliated with the Advisor. The Portfolio may use related party brokers/dealers. For the period ended June 30, 2006, the Portfolio did not incur any brokerage commissions with brokers/dealers affiliated with the Advisor. The SEC has granted an exemptive order permitting the Portfolio to engage in principal transactions with J.P. Morgan Securities, Inc., an affiliated broker, involving taxable money market instruments subject to certain conditions. 16 JPMORGAN INSURANCE TRUST JUNE 30, 2006
4. Investment Transactions During the six months ended June 30, 2006, purchases and sales of investments (excluding short-term investments) were as follows:
|
|
|
| Purchases
(excluding U.S.
Government)
|
| Sales
(excluding U.S.
Government)
|
|---|
| | | | | $ | 60,456,521 | | | $ | 176,011,716 | |
During the six months ended June 30, 2006, there were no purchases or sales of U.S. Government securities. 5. Federal Income Tax Matters For Federal income tax purposes, the cost and unrealized appreciation (depreciation) in value of the investment securities at June 30, 2006, were as follows:
|
|
|
| Aggregate
Cost
|
| Gross
Unrealized
Appreciation
|
| Gross
Unrealized
Depreciation
|
| Net Unrealized
Appreciation
(Depreciation)
|
|---|
| | | | | $ | 112,147,946 | | | $ | 8,033,212 | | | $ | (2,254,578 | ) | | $ | 5,778,634 | |
6. Borrowings The Trust and JPMCB have entered into a financing arrangement. Under this arrangement, JPMCB provides an unsecured, uncommitted credit facility in the aggregate amount of $100 million to certain of the JPMorgan Funds including the Portfolio. Advances under the arrangement are taken primarily for temporary or emergency purposes, including the meeting of redemption requests that otherwise might require the untimely disposition of securities, and are subject to the Portfolio’s borrowing restrictions. Interest on borrowings is payable at a rate determined by JPMCB at the time of borrowing. This agreement has been extended until November 21, 2006. The Portfolio had no borrowings outstanding at June 30, 2006, or at any time during the six months then ended. 7. Concentrations and Indemnifications In the normal course of business, the Portfolio enters into contracts that contain a variety of representations which provide general indemnifications. The Portfolio’s maximum exposure under these arrangements is unknown, as this would involve future claims that may be made against the Portfolio that have not yet occurred. However, based on experience, the Portfolio expects the risk of loss to be remote. The time to time, the Portfolio may have a concentration of several shareholders holding a significant percentage of shares outstanding. Investment activities of these shareholders could have a material impact on the Portfolio. JUNE 30, 2006 JPMORGAN INSURANCE TRUST 17
TRUSTEES
(Unaudited) The Portfolio’s Statement of Additional Information includes additional information about the Portfolio’s Trustees and is available, without charge, upon request by calling 1-800-480-4111 or on the Portfolio’s website at www.jpmorganfunds.com. Name (Year of Birth);
Positions With
the Portfolio
|
|
|
| Principal Occupations
During Past 5 Years
|
| Number of
Portfolios/Funds
in JPMorgan
Funds Complex (1)
Overseen by Trustee
|
| Other Directorships Held
Outside Fund Complex
|
|---|
Independent Trustees | | William J. Armstrong (1941); Trustee of Trust since 2005; Trustee of heritage JPMorgan Funds since 1987. | | | | Retired; CFO and Consultant, EduNeering, Inc. (internet business education supplier) (2000–2001); Vice President and Treasurer, Ingersoll–Rand Company (manufacturer of industrial equipment) (1972–2000). | | 120 | | None. | | Roland R. Eppley, Jr. (1932); Trustee of Trust since 2005; Trustee of heritage JPMorgan Funds since 1989. | | | | Retired; President and Chief Executive Officer, Eastern States Bankcard (1971–1988). | | 120 | | None. | | John F. Finn (1947); Trustee of Trust since 2005; Trustee of heritage One Group Mutual Funds since 1998. | | | | President and Chief Executive Officer, Gardner, Inc. (wholesale distributor to outdoor power equipment industry) (1979–present). | | 120 | | Director, Cardinal Health, Inc (CAH) (1994–present); Chairman, The Columbus Association for the Performing Arts (CAPA) (2003–present). | | Dr. Matthew Goldstein (1941); Trustee of Trust since 2005; Trustee of heritage JPMorgan Funds since 2003. | | | | Chancellor of the City University of New York (1999–present); President, Adelphi University (New York) (1998–1999). | | 120 | | Director, Albert Einstein School of Medicine (1998–present); Director, New Plan Excel Realty Trust, Inc. (real estate investment trust)
(2000–present); Director, Lincoln Center Institute for the Arts in Education (1999–present). | | Robert J. Higgins (1945); Trustee of Trust since 2005; Trustee of heritage JPMorgan Funds since 2002. | | | | Retired; Director of Administration of the State of Rhode Island (2003–2004); President — Consumer Banking and Investment Services, Fleet Boston Financial (1971–2001). | | 120 | | None. | | Peter C. Marshall (1942); Trustee of Trust since 2005; Trustee of heritage One Group Mutual Funds since 1994. | | | | Self-employed business consultant (2002–present); Senior Vice President, W.D. Hoard, Inc. (corporate parent of DCI Marketing, Inc.) (2000–2002); President, DCI Marketing, Inc. (1992–2000). | | 120 | | None. | | Marilyn McCoy (1948); Trustee of Trust since 2005; Trustee of heritage One Group Mutual Funds since 1999. | | | | Vice President of Administration and Planning, Northwestern University (1985–present). | | 120 | | Trustee, Mather LifeWays (1994–present); Trustee, Carleton College (2003–present). | | William G. Morton, Jr. (1937); Trustee of Trust since 2005; Trustee of heritage JPMorgan Funds since 2003. | | | | Retired; Chairman Emeritus (2001–2002), and Chairman and Chief Executive Officer, Boston Stock Exchange (1985–2001). | | 120 | | Director, Radio Shack Corporation (electronics) (1987–present); Director, The National Football Foundation and College Hall of Fame (1994–present); Trustee, Stratton Mountain School (2001–present). |
18 JPMORGAN INSURANCE TRUST JUNE 30, 2006
Name (Year of Birth);
Positions With
the Portfolio
|
|
|
| Principal Occupations
During Past 5 Years
|
| Number of
Portfolios/Funds
in JPMorgan
Funds Complex (1)
Overseen by Trustee
|
| Other Directorships Held
Outside Fund Complex
|
|---|
Independent Trustees | | Robert A. Oden, Jr. (1946); Trustee of Trust since 2005; Trustee of heritage One Group Mutual Funds since 1997. | | | | President, Carleton College (2002–present); President, Kenyon College (1995–2002). | | 120 | | Director, American University in Cairo. | | Fergus Reid, III (1932); Trustee of Trust (Chairman) since 2005; Trustee (Chairman) of heritage JPMorgan Funds since 1987. | | | | Chairman, Lumelite Corporation (plastics manufacturing) (2003–present); Chairman and Chief Executive Officer, Lumelite Corporation (1985–2002). | | 120 | | Trustee, Morgan Stanley Funds (198 portfolios) (1995–present). | | Frederick W. Ruebeck (1939); Trustee of Trust since 2005; Trustee of heritage One Group Mutual Funds since 1994. | | | | Advisor, Jerome P. Green & Associates, LLC (broker-dealer) (2000–present); Chief Investment Officer, Wabash College (2004–present); self-employed consultant (2000–present); Director of Investments, Eli Lilly and Company (1988–1999). | | 120 | | Trustee, Wabash College (1988–present); Chairman, Indianapolis Symphony Orchestra Foundation (1994–present). | | James J. Schonbachler (1943); Trustee of Trust since 2005; Trustee of heritage JPMorgan Funds since 2001. | | | | Retired; Managing Director of Bankers Trust Company (financial services) (1968–1998). | | 120 | | None. | Interested Trustee | | Leonard M. Spalding, Jr.* (1935); Trustee of Trust since 2005; Trustee of heritage JPMorgan Funds since 1998. | | | | Retired; Chief Executive Officer of Chase Mutual Funds (investment company) (1989–1998); President & Chief Executive Officer, Vista Capital Management (investment management) (1990–1998); Chief Investment Executive, Chase Manhattan Private Bank (investment management) (1990–1998). | | 120 | | Director, Glenview Trust Company, LLC (2001–present); Trustee, St. Catherine College (1998–present); Trustee, Bellarmine University (2000–present); Director, Springfield-Washington County Economic Development Authority (1997–present); Trustee, Marion and Washington County, Kentucky Airport Board (1998–present); Trustee, Catholic Education Foundation (2005–present). |
| (1) | | A Fund Complex means two or more registered investment companies that hold themselves out to investors as related companies for purposes of investment and investor services or have a common investment adviser or have an investment adviser that is an affiliated person of the investment adviser of any of the other registered investment companies. The JPMorgan Funds Complex which the Board of Trustees currently oversees includes eight registered investment companies (120 portfolios/funds). |
| * | | Mr. Spalding is deemed to be an “interested person” due to his ownership of JPMorgan Chase stock. |
The contact address for each of the Trustees is 245 Park Avenue, New York, NY 10167. JUNE 30, 2006 JPMORGAN INSURANCE TRUST 19
OFFICERS
(Unaudited) Name (Year of Birth),
Positions Held with
the Trust
|
| Principal Occupations During Past 5 Years
|
|---|
George C.W. Gatch (1962),
President since 2005 | | Managing Director, JPMorgan Investment Management Inc.; Director and President, JPMorgan Distribution Services, Inc. and JPMorgan Funds Management, Inc. since 2005. Mr. Gatch is CEO and President of JPMorgan Funds. Mr. Gatch has been an employee since 1986 and has held positions such as President and CEO of DKB Morgan, a Japanese mutual fund company which was a joint venture between J.P. Morgan and Dai-Ichi Kangyo Bank, as well as positions in business management, marketing and sales. | Robert L. Young (1963),
Senior Vice President since 2005* | | Director and Vice President, JPMorgan Distribution Services, Inc. and JPMorgan Funds Management, Inc.; Chief Operating Officer, JPMorgan Funds since 2005, and One Group Mutual Funds from 2001 until 2005. Mr. Young was Vice President and Treasurer, JPMorgan Funds Management, Inc. (formerly One Group Administrative Services) and Vice President and Treasurer, JPMorgan Distribution Services, Inc. (formerly One Group Dealer Services, Inc.) from 1999 to 2005. | Patricia A. Maleski (1960),
Vice President and Chief
Administrative Officer since 2005 | | Managing Director, JPMorgan Funds Management, Inc.; previously, Treasurer, JPMorgan Funds and Head of Funds Administration and Board Liaison. Ms. Maleski was Vice President of Finance for the Pierpont Group, Inc. from 1996–2001, an independent company owned by the Board of Directors/Trustees of the JPMorgan Funds, prior to joining J.P. Morgan Chase & Co. in 2001. | Stephanie J. Dorsey (1969),
Treasurer since 2005* | | Vice President, JPMorgan Funds Management, Inc.; Director of Mutual Fund Administration, JPMorgan Funds Management, Inc. (formerly One Group Administrative Services), from 2004 to 2005; Ms. Dorsey worked for JPMorgan Chase & Co., (formerly Bank One Corporation) from 2003 to 2004; prior to joining Bank One Corporation, she was a Senior Manager specializing in Financial Services audits at PricewaterhouseCoopers LLP from 1992 through 2002. | Stephen M. Ungerman (1953),
Senior Vice President and Chief
Compliance Officer since 2005
| | Senior Vice President, JPMorgan Chase & Co.; Mr. Ungerman was head of Fund Administration — Pooled Vehicles from 2000 to 2004. Mr. Ungerman held a number of positions in Prudential Financial’s asset management business prior to 2000. | Paul L. Gulinello (1950), AML
Compliance Officer since 2005 | | Vice President and Anti Money Laundering Compliance Officer for JPMorgan Asset Management Americas, additionally responsible for personal trading and compliance testing since 2004; Treasury Services Operating Risk Management and Compliance Executive supporting all JPMorgan Treasury Services business units from July 2000 to 2004. | Stephen M. Benham (1959),
Secretary since 2005 | | Vice President and Assistant General Counsel, JPMorgan Chase & Co. since 2004; Vice President (Legal Advisory) of Merrill Lynch Investment Managers, L.P. from 2000 to 2004; attorney associated with Kirkpatrick & Lockhart LLP from 1997 to 2000. | Elizabeth A. Davin (1964),
Assistant Secretary since 2005* | | Vice President and Assistant General Counsel, JPMorgan Chase & Co. since 2005; Senior Counsel, JPMorgan Chase & Co. (formerly Bank One Corporation) from 2004 to 2005; Assistant General Counsel and Associate General Counsel and Vice President, Gartmore Global Investments, Inc. from 1999 to 2004. | Jessica K. Ditullio (1962),
Assistant Secretary since 2005* | | Vice President and Assistant General Counsel, JPMorgan Chase & Co. since 2005; Ms. Ditullio has served as an attorney with various titles for JPMorgan Chase & Co. (formerly Bank One Corporation) since 1990. | Nancy E. Fields (1949),
Assistant Secretary since 2005* | | Vice President, JPMorgan Funds Management, Inc. and JPMorgan Distribution Services, Inc.; From 1999 to 2005, Director, Mutual Fund Administration, JPMorgan Funds Management, Inc. (formerly One Group Administrative Services, Inc.) and Senior Project Manager, Mutual Funds, JPMorgan Distribution Services, Inc. (formerly One Group Dealer Services, Inc.). | Michael C. Raczynski (1975),
Assistant Secretary (2006) | | Vice President and Assistant General Counsel, JPMorgan Chase & Co. since 2006; Associate, Stroock & Stroock & Lavan LLP from 2001 to 2006. | Ellen W. O’Brien (1957),
Assistant Secretary since 2005** | | Assistant Vice President, JPMorgan Investor Services, Co., responsible for Blue Sky registration. Ms. O’Brien has served in this capacity since joining the firm in 1991. |
20 JPMORGAN INSURANCE TRUST JUNE 30, 2006
Name (Year of Birth),
Positions Held with
the Trust
|
| Principal Occupations During Past 5 Years
|
|---|
Suzanne E. Cioffi (1967),
Assistant Treasurer since 2005 | | Vice President, JPMorgan Funds Management, Inc., responsible for mutual fund financial reporting. Ms. Cioffi has overseen various fund accounting, custody and administration conversion projects during the past five years. | Arthur A. Jensen (1966),
Assistant Treasurer since 2005* | | Vice President, JPMorgan Funds Management, Inc. since April 2005; formerly, Vice President of Financial Services of BISYS Fund Services, Inc. from 2001 until 2005; Mr. Jensen was Section Manager at Northern Trust Company and Accounting Supervisor at Allstate Insurance Company prior to 2001. |
The contact address for each of the officers, unless otherwise noted, is 245 Park Avenue, New York, NY 10167. | * | | The contact address for the officer is 1111 Polaris Parkway, Columbus, OH 43271. |
| ** | | The contact address for the officer is 73 Tremont Street, Floor 1, Boston MA 02108. |
JUNE 30, 2006 JPMORGAN INSURANCE TRUST 21
SCHEDULE OF SHAREHOLDER EXPENSES
(Unaudited) Hypothetical $1,000 Investment at Beginning of Period
June 30, 2006 As a shareholder of the Portfolio, you incur ongoing costs, including investment advisory fees, administration fees and other Portfolio expenses. Because the Portfolio is a funding vehicle for Policies and Eligible Plans, you may also incur sales charges and other fees relating to the Policies or Eligible Plans. The examples below are intended to help you understand your ongoing costs (in dollars) of investing in the Portfolio, but not the costs of the Policies or Eligible Plans, and to compare these ongoing costs with the ongoing costs of investing in other mutual funds. The examples assume that you had a $1,000 investment in the Portfolio at the beginning of the reporting period, January 1, 2006, and continued to hold your shares at the end of the reporting period, June 30, 2006. Actual Expenses The first line provides information about actual account values and actual expenses. You may use the information in this line, together with the amount you invested, to estimate the expenses that you paid over the period. Simply divide your account value by $1,000 (for example, an $8,600 account value divided by $1,000 = 8.6), then multiply the result by the number in the first line under the heading entitled “Expenses Paid During Period” to estimate the expenses you paid on your account during this period. Hypothetical Example for Comparison Purposes The second line in the table below provides information about hypothetical account values and hypothetical expenses based on the actual expense ratio and an assumed rate of return of 5% per year before expenses, which is not the Portfolio’s actual return. The hypothetical account values and expenses may not be used to estimate the actual ending account balance or expenses you paid for the period. You may use this information to compare the ongoing costs of investing in the Portfolio and other portfolios. To do so, compare this 5% hypothetical example with the 5% hypothetical examples that appear in the shareholder reports of the other funds. Please note that the expenses shown in the table are meant to highlight your ongoing costs only and do not reflect any transaction costs, such as sales charges (loads) or redemption fees or the costs associated with the Policies and Eligible Plans through which the Portfolio is held. Therefore, the second line in the table is useful in comparing ongoing costs only, and will not help you determine the relative total costs of owning different portfolios. In addition, if these transaction costs were included, your costs would have been higher. The examples also assume all dividends and distributions have been reinvested.
|
|
|
| Beginning
Account Value,
January 1, 2006
|
| Ending
Account Value,
June 30, 2006
|
| Expenses
Paid During
January 1 to
June 30, 2006*
|
| Annualized
Expense Ratio
|
|---|
JPMorgan Insurance Trust Diversified Mid Cap Value Portfolio | | Actual | | | | $ | 1,000.00 | | | $ | 1,049.30 | | | $ | 4.78 | | | | 0.94 | % | | Hypothetical | | | | | 1,000.00 | | | | 1,020.13 | | | | 4.71 | | | | 0.94 | |
| * | | Expenses are equal to the Portfolio’s annualized expense ratio, multiplied by the average account value over the period, multiplied by 181/365 (to reflect the one-half year period). |
22 JPMORGAN INSURANCE TRUST JUNE 30, 2006
THIS PAGE IS INTENTIONALLY LEFT BLANK
THIS PAGE IS INTENTIONALLY LEFT BLANK
JPMorgan Funds are distributed by JPMorgan Distribution Services, Inc., which is an affiliate of JPMorgan Chase & Co. Affiliates of JPMorgan Chase & Co. receive fees for providing various services to the funds. This report is submitted for the general information of the shareholders of the Portfolio. It is not authorized for distribution to prospective investors in the Portfolio unless preceded or accompanied by a prospectus. Contact JPMorgan Funds Distribution Services at 1-800-480-4111 for a portfolio prospectus. You can also visit us at www.jpmorganfunds.com. Investors should carefully consider the investment objectives and risk as well as charges and expenses of the mutual fund before investing. The prospectus contains this and other information about the mutual fund. Read the prospectus carefully before investing. The Portfolio files a complete schedule of its portfolio holdings for the first and third quarters of its fiscal year with the SEC on Form N-Q. The Portfolio’s Forms N-Q are available on the SEC’s website at http://www.sec.gov and may be reviewed and copied at the SEC’s Public Reference Room in Washington, DC. Information on the operation of the SEC’s Public Reference Room may be obtained by calling 1-800-SEC-0330. Shareholders may request the Form N-Q without charge by calling 1-800-480-4111 or by visiting the variable insurance portfolio section of the JPMorgan Funds’ website at www.jpmorganfunds.com. A description of the Portfolio’s policies and procedures with respect to the disclosure of the Portfolio’s holdings is available in the Statement of Additional Information. A copy of proxy policies and procedures are available without charge upon request by calling 1-800-480-4111 and on the SEC’s website at www.sec.gov. The Trustees have delegated the authority to vote proxies for securities owned by the Portfolio to the Advisor. A copy of the Portfolio’s voting record for the most recent 12-month period ended June 30 is available on the SEC’s website at www.sec.gov or at the Portfolio’s website at www.jpmorganfunds.com no later than August 31 of each year. The Portfolio’s proxy voting record will include, among other things, a brief description of the matter voted on for each portfolio security, and will state how each vote was cast, for example, for or against the proposal.
© JPMorgan Chase & Co., 2006 All rights reserved. June 2006. | | SAN-JPMITDMCVP-606 |
SEMI-ANNUAL REPORT
SIX MONTHS ENDED JUNE 30, 2006 (UNAUDITED) JPMorgan Insurance Trust JPMorgan Insurance Trust Equity Index Portfolio
(formerly JPMorgan Investment Trust Equity Index Portfolio) NOT FDIC INSURED • NO BANK GUARANTEE • MAY LOSE VALUE
| | | | This material must be preceded or accompanied by a current prospectus. |
CONTENTS | President’s Letter | | | | | 1 | | Portfolio Commentary:
| | | | | | | | JPMorgan Insurance Trust Equity Index Portfolio | | | | | 2 | | | Schedule of Portfolio Investments | | | | | 4 | | | Statement of Assets and Liabilities | | | | | 13 | | | Statement of Operations | | | | | 14 | | | Statement of Changes in Net Assets | | | | | 15 | | | Financial Highlights | | | | | 16 | | | Notes to Financial Statements | | | | | 18 | | | Trustees | | | | | 22 | | | Officers | | | | | 24 | | | Schedule of Shareholder Expenses | | | | | 26 | |
HIGHLIGHTS | • | | U.S. stocks generally positive in first half of 2006 |
| • | | Investors tried to predict interest rate hikes |
| • | | Gross domestic product (GDP) moved sharply higher |
| • | | Market volatility expected until interest rate picture is clearer |
Effective May 1, 2006, the existing shares of the Portfolio were designated as Class 1 shares. The performance, expenses and other information shown in this report for the Portfolio is information applicable to the Class 1 shares. Investments in the Portfolio are not bank deposits or obligations of, or guaranteed or endorsed by, any bank and are not insured or guaranteed by the FDIC, the Federal Reserve Board or any other government agency. You could lose money if you sell when the Portfolio’s share price is lower than when you invested. Past performance is no guarantee for future performance. The general market views expressed in this report are opinions based on current market conditions and are subject to change without notice. These views are not intended to predict the future performance of the Portfolio or the securities markets. References to specific securities and their issuers are for illustrative purposes only and are not intended to be, and should not be interpreted as, recommendations to purchase or sell such securities. Such views are not meant as investment advice and may not be relied on as an indication of trading intent on behalf of any Portfolio. This Portfolio is intended to be a funding vehicle for variable annuity contracts and variable life insurance policies (collectively “Policies”) offered by separate accounts of participating insurance companies. Portfolio shares are also offered to qualified pension and retirement plans (“Eligible Plans”). Individuals may not purchase shares directly from the Portfolio. Prospective investors should refer to the Portfolio’s prospectus for a discussion of the Portfolio’s investment objective, strategies and risks. Call JPMorgan Funds Service Center at 1-800-480-4111 for a prospectus containing more complete information about the Portfolio including management fees and other expenses. Please read it carefully before investing.
PRESIDENT’S LETTER
JULY 14, 2006 (Unaudited)
Dear Shareholder: We are pleased to present this semi-annual report for the JPMorgan Insurance Trust Equity Index Portfolio for the six months ended June 30, 2006. Inside, you’ll find information detailing the performance of the Portfolio, along with a report from the portfolio managers. | | | |
“Despite repeated interest rate hikes and surging energy prices, the U.S. economy was surprisingly resilient.”
|
All Eyes on the Federal Reserve Board
While the U.S. stock market weakened late in the reporting period, overall it produced positive returns for the first half of the calendar year. The equity market kicked off 2006 with investors encouraged by overall strong economic growth and positive corporate earnings. However, the last two months were marked by increased volatility. A great deal of the driving forces behind the market’s ups and downs resulted from the actions of the Federal Open Market Committee (FOMC). In February 2006, Ben Bernanke assumed the role of Federal Reserve Board Chairman, replacing long-time fixture Alan Greenspan. The transition was less than smooth for investors, as they attempted to predict the FOMC’s future actions regarding interest rates. The FOMC’s statements first hinted that there may be a break from rate increases and then telegraphed additional rate hikes due to fears of rising inflation. In late June, the FOMC raised short-term rates for the 17th consecutive time, bringing the fed funds target rate to 5.25% — its highest level in more than five years. Despite repeated interest rate hikes and surging energy prices, the U.S. economy was surprisingly resilient. After gross domestic product (GDP) fell in the fourth quarter, the economy moved sharply higher in the first quarter of 2006. During this time, GDP rose 5.6%, its highest reading since the third quarter of 2003. Stocks Produce Positive Results The broad stock market, as measured by the S&P 500 Index, returned 2.71% for the six months ended June 30, 2006. After a fast start to the year, the market took a step backwards in mid-May on fears that additional rate hikes may adversely affect the economic expansion and temper corporate profits. Looking more closely at the market over the six months, small- and mid-cap stocks outperformed their large-cap counterparts, with the Russell Midcap, Russell 2000 and Russell 1000 Indexes returning 4.84%, 8.21%, and 2.76%, respectively. However, as many market pundits have anticipated, large-cap stocks generated relatively better results late in the period. After a prolonged period of lagging smaller-cap stocks, many large-caps appeared attractively valued and may be better equipped to handle more moderate economic growth. Outlook Looking ahead, the markets could continue to experience periods of volatility until the FOMC’s interest rate stance is better understood. Coinciding with its latest rate hike in June, the Fed said: “The extent and timing of any additional firming...will depend on the evolution of the outlook for both inflation and economic growth, as implied by incoming information.” Investors will likely be closely monitoring the economic “tea leaves” in an attempt to ascertain the FOMC’s next move. On behalf of us all at JPMorgan Asset Management, thank you for your confidence and the continued trust you have placed in us. We look forward to serving your investment needs for many years to come. Should you have any questions, please feel free to contact the JPMorgan Funds Service Center at 1-800-480-4111. Sincerely yours,
George C.W. Gatch
President
JPMorgan Funds JUNE 30, 2006 JPMORGAN INSURANCE TRUST 1
JPMorgan Insurance Trust Equity Index Portfolio
PORTFOLIO COMMENTARY
AS OF JUNE 30, 2006 (Unaudited)
PORTFOLIO FACTS
|
|
|
|
|
|---|
| Portfolio Inception | | | | May 1, 1998 | | Fiscal Year End | | | | December 31 | | Net Assets as of 6/30/06 | | | | $134,682,655 | | Primary Benchmark | | | | S&P 500 Index |
Q. | | HOW DID THE PORTFOLIO PERFORM? |
A. | | The JPMorgan Insurance Trust Equity Index Portfolio, which seeks investment results that correspond to the aggregate price and dividend performance of securities in the S&P 500 Index,* had a return of 2.51% for the six months ended June 30, 2006.** This compares to a return of 2.71% for the benchmark S&P 500 Index. |
Q. | | WHY DID THE PORTFOLIO PERFORM THIS WAY? |
A. | | During the six-month period, U.S. large cap equities turned in positive but not spectacular returns. Positive earnings news during the first quarter carried the market higher, yet the focus in the second quarter turned to inflation, rising short-term interest rates, and the prospect of a slowing economy, which led to a bit of a sell-off in May and June. At the sector level, a modest majority (12 out of 19) provided positive returns. Among the largest contributors were industrial services and non-energy minerals, with returns in the mid-to-high teens. Among the detractors were consumer durables and health services, with returns ranging from positive high single digits to negative low double digits. |
Q. | | HOW WAS THE PORTFOLIO MANAGED? |
A. | | The Portfolio as always was managed in strict conformity to the full replication index strategy, which holds the same stocks in the same proportions as those found in the benchmark. The Portfolio is always 100% invested. This is accomplished by using exchange-traded funds and index futures contracts at the margin to invest and divest daily cash flows. The transaction costs associated with implementing the strategy are minimized to lessen their impact on performance. The Portfolio is considered to be tax efficient, because of its low turnover and participates in securities lending, allowing for additional income generation. Regardless of the market outlook, the Portfolio’s strategy does not change, and the Portfolio continues to be fully invested with extremely limited active risk to the benchmark. |
PORTFOLIO COMPOSITION***
| Financials | | | | | 21.2 | % | | Information Technology | | | | | 14.7 | | | Health Care | | | | | 12.2 | | | Industrials | | | | | 11.6 | | | Energy | | | | | 10.1 | | | Consumer Discretionary | | | | | 10.1 | | | Consumer Staples | | | | | 9.5 | | | Utilities | | | | | 3.4 | | | Telecommunication Services | | | | | 3.3 | | | Materials | | | | | 3.0 | | | Investments of Cash Collateral for Securities Loaned | | | | | 3.2 | | | Short-Term Investments | | | | | 0.9 | |
TOP TEN EQUITY HOLDINGS OF THE PORTFOLIO***
| 1. | | | | Exxon Mobil Corp. | | | 3.2 | % | | 2. | | | | General Electric Co. | | | 3.0 | | | 3. | | | | Citigroup, Inc. | | | 2.1 | | | 4. | | | | Bank of America Corp. | | | 1.9 | | | 5. | | | | Microsoft Corp. | | | 1.8 | | | 6. | | | | Procter & Gamble Co. | | | 1.6 | | | 7. | | | | Johnson & Johnson | | | 1.5 | | | 8. | | | | Pfizer, Inc. | | | 1.5 | | | 9. | | | | American International Group, Inc. | | | 1.3 | | | 10. | | | | Altria Group, Inc. | | | 1.3 | |
| * | | S&P 500 is a registered service mark of Standard & Poor’s Corporation, which does not sponsor and is in no way affiliated with the Portfolio. |
| ** | | The advisor seeks to achieve the Portfolio’s objective. There can be no guarantee it will be achieved. |
| *** | | Percentages indicated are based upon net assets as of June 30, 2006. The portfolio’s composition is subject to change. |
2 JPMORGAN INSURANCE TRUST JUNE 30, 2006
AVERAGE ANNUAL TOTAL RETURNS AS OF JUNE 30, 2006
| | | | INCEPTION DATE
| | 1 YEAR
| | 5 YEAR
| | SINCE INCEPTION
|
|---|
EQUITY INDEX PORTFOLIO | | | | | 5/1/98 | | | | 8.16 | % | | | 1.99 | % | | | 2.72 | % |
LIFE OF PORTFOLIO PERFORMANCE (5/01/98 TO 6/30/06)
Source: Lipper, Inc. The performance quoted is past performance and is not a guarantee of future results. Mutual funds are subject to certain market risk. Investment returns and principal value of an investment will fluctuate so that an investor’s shares, when redeemed, may be worth more or less than their original cost. Current performance may be higher or lower than the performance data shown. For up-to-date month-end performance information please call 1-800-480-4111. The graph illustrates comparative performance for $10,000 invested in the JPMorgan Insurance Trust Equity Index Portfolio and the S&P 500 Index. The performance of the Portfolio assumes reinvestment of all dividends. The performance of the index does not include fees and expenses attributable to the Portfolio and has been adjusted to reflect reinvestment of all dividends and capital gains of the securities included in the benchmark. The S&P 500 Index represents the performance of large companies in the U.S. stock market. Investors cannot invest directly in an index. The performance does not reflect any charges imposed by the Policies or Eligible Plans. If these charges were included, the returns would be lower than shown. Performance may also reflect the waiver and reimbursement of the Portfolio’s fees/expenses for certain periods since the inception date. Without these waivers and reimbursements, performance would have been lower. JUNE 30, 2006 JPMORGAN INSURANCE TRUST 3
JPMorgan Insurance Trust Equity Index Portfolio
SCHEDULE OF PORTFOLIO INVESTMENTS
AS OF JUNE 30, 2006 (Unaudited)
SHARES
|
|
|
| SECURITY DESCRIPTION
|
|
| VALUE($)
|
|
|---|
Long-Term Investments — 99.3% | | | | | | | | | Common Stocks — 99.1% | | | | | | Aerospace & Defense — 2.4% | | 9,280 | | | | Boeing Co. | | | 760,125 | | | 4,685 | | | | General Dynamics Corp. | | | 306,680 | | | 1,438 | | | | Goodrich Corp. | | | 57,937 | | | 9,609 | | | | Honeywell International, Inc. | | | 387,243 | | | 1,416 | | | | L-3 Communications Holdings, Inc. | | | 106,795 | | | 4,110 | | | | Lockheed Martin Corp. | | | 294,851 | | | 3,990 | | | | Northrop Grumman Corp. | | | 255,599 | | | 5,179 | | | | Raytheon Co. | | | 230,828 | | | 1,986 | | | | Rockwell Collins, Inc. | | | 110,958 | | | 11,732 | | | | United Technologies Corp. | | | 744,043 | | | | | | | | | | 3,255,059 | | | | | | | Air Freight & Logistics — 1.1% | | 3,541 | | | | FedEx Corp. | | | 413,801 | | | 12,589 | | | | United Parcel Service, Inc., Class B | | | 1,036,453 | | | | | | | | | | 1,450,254 | | | | | | | Airlines — 0.1% | | 8,197 | | | | Southwest Airlines Co. | | | 134,185 | | | | | | | Auto Components — 0.2% | | 712 | | | | Cooper Tire & Rubber Co. (c) | | | 7,931 | | | 2,057 | | | | Goodyear Tire & Rubber Co. (The) (a) (c) | | | 22,833 | | | 2,263 | | | | Johnson Controls, Inc. | | | 186,064 | | | | | | | | | | 216,828 | | | | | | | Automobiles — 0.4% | | 21,773 | | | | Ford Motor Co. (c) | | | 150,887 | | | 6,564 | | | | General Motors Corp. (c) | | | 195,541 | | | 3,118 | | | | Harley-Davidson, Inc. | | | 171,147 | | | | | | | | | | 517,575 | | | | | | | Beverages — 2.1% | | 8,969 | | | | Anheuser-Busch Cos., Inc. | | | 408,897 | | | 965 | | | | Brown-Forman Corp., Class B | | | 68,949 | | | 23,787 | | | | Coca-Cola Co. (The) | | | 1,023,317 | | | 3,522 | | | | Coca-Cola Enterprises, Inc. | | | 71,743 | | | 2,308 | | | | Constellation Brands, Inc., Class A (a) (c) | | | 57,700 | | | 669 | | | | Molson Coors Brewing Co., Class B | | | 45,412 | | | 1,556 | | | | Pepsi Bottling Group, Inc. | | | 50,025 | | | 19,179 | | | | PepsiCo, Inc. | | | 1,151,507 | | | | | | | | | | 2,877,550 | | | | | | | Biotechnology — 1.2% | | 13,686 | | | | Amgen, Inc. (a) | | | 892,738 | | | 3,991 | | | | Biogen Idec, Inc. (a) (c) | | | 184,903 | | | 3,022 | | | | Genzyme Corp. (a) | | | 184,493 | | | 5,281 | | | | Gilead Sciences, Inc. (a) | | | 312,424 | | | 2,887 | | | | MedImmune, Inc. (a) | | | 78,238 | | | | | | | | | | 1,652,796 | | | | | | | Building Products — 0.2% | | 2,053 | | | | American Standard Cos., Inc. | | | 88,833 | | | 4,610 | | | | Masco Corp. (c) | | | 136,641 | | | | | | | | | | 225,474 | | | | | | | Capital Markets — 3.4% | | 2,836 | | | | Ameriprise Financial, Inc. | | | 126,684 | | | 8,957 | | | | Bank of New York Co., Inc. (The) | | | 288,415 | | | 1,400 | | | | Bear Stearns Cos., Inc. (The) | | | 196,112 | | | 11,975 | | | | Charles Schwab Corp. (The) | | | 191,361 | | | 4,949 | | | | E*Trade Financial Corp. (a) | | | 112,936 | | | 980 | | | | Federated Investors, Inc., Class B | | | 30,870 | | | 1,780 | | | | Franklin Resources, Inc. | | | 154,522 | | | 5,014 | | | | Goldman Sachs Group, Inc. | | | 754,256 | | | 2,456 | | | | Janus Capital Group, Inc. | | | 43,962 | | | 1,533 | | | | Legg Mason, Inc. | | | 152,564 | | | 6,214 | | | | Lehman Brothers Holdings, Inc. | | | 404,842 | | | 4,800 | | | | Mellon Financial Corp. | | | 165,264 | | | 10,724 | | | | Merrill Lynch & Co., Inc. | | | 745,962 | | | 12,431 | | | | Morgan Stanley | | | 785,764 | | | 2,151 | | | | Northern Trust Corp. | | | 118,950 | | | 3,857 | | | | State Street Corp. | | | 224,053 | | | 3,082 | | | | T. Rowe Price Group, Inc. | | | 116,530 | | | | | | | | | | 4,613,047 | | | | | | | Chemicals — 1.5% | | 2,602 | | | | Air Products & Chemicals, Inc. | | | 166,320 | | | 825 | | | | Ashland, Inc. | | | 55,027 | | | 11,162 | | | | Dow Chemical Co. (The) | | | 435,653 | | | 949 | | | | Eastman Chemical Co. (c) | | | 51,246 | | | 2,114 | | | | Ecolab, Inc. | | | 85,786 | | | 10,693 | | | | El Du Pont de Nemours & Co. | | | 444,829 | | | 1,319 | | | | Hercules, Inc. (a) (c) | | | 20,128 | | | 917 | | | | International Flavors & Fragrances, Inc. | | | 32,315 | | | 3,140 | | | | Monsanto Co. | | | 264,357 | | | 1,922 | | | | PPG Industries, Inc. | | | 126,852 | | | 3,750 | | | | Praxair, Inc. (c) | | | 202,500 | | | 1,687 | | | | Rohm & Haas Co. | | | 84,552 | | | 777 | | | | Sigma-Aldrich Corp. (c) | | | 56,441 | | | | | | | | | | 2,026,006 | |
SEE NOTES TO FINANCIAL STATEMENTS.
4 JPMORGAN INSURANCE TRUST JUNE 30, 2006
SHARES
|
|
|
| SECURITY DESCRIPTION
|
| VALUE($)
|
|---|
Long-Term Investments — Continued | | | | | | | | | Commercial Banks — 4.2% | | 4,017 | | | | AmSouth Bancorp | | | 106,250 | | | 6,384 | | | | BB&T Corp. | | | 265,511 | | | 1,885 | | | | Comerica, Inc. | | | 98,001 | | | 2,138 | | | | Commerce Bancorp, Inc. (c) | | | 76,262 | | | 1,499 | | | | Compass Bancshares, Inc. (c) | | | 83,344 | | | 6,459 | | | | Fifth Third Bancorp | | | 238,660 | | | 1,430 | | | | First Horizon National Corp. | | | 57,486 | | | 2,847 | | | | Huntington Bancshares, Inc. | | | 67,132 | | | 4,691 | | | | Keycorp | | | 167,375 | | | 916 | | | | M&T Bank Corp. | | | 108,015 | | | 2,615 | | | | Marshall & Ilsley Corp. | | | 119,610 | | | 6,296 | | | | National City Corp. | | | 227,852 | | | 5,399 | | | | North Fork Bancorp, Inc. | | | 162,888 | | | 3,435 | | | | PNC Financial Services Group, Inc. | | | 241,034 | | | 5,294 | | | | Regions Financial Corp. | | | 175,337 | | | 4,220 | | | | SunTrust Banks, Inc. | | | 321,817 | | | 3,746 | | | | Synovus Financial Corp. | | | 100,318 | | | 20,658 | | | | U.S. Bancorp | | | 637,919 | | | 18,669 | | | | Wachovia Corp. | | | 1,009,620 | | | 19,499 | | | | Wells Fargo & Co. | | | 1,307,993 | | | 1,232 | | | | Zions Bancorp | | | 96,022 | | | | | | | | | | 5,668,446 | | | | | | | Commercial Services & Supplies — 0.7% | | 2,807 | | | | Allied Waste Industries, Inc. (a) (c) | | | 31,887 | | | 1,274 | | | | Avery Dennison Corp. | | | 73,968 | | | 11,609 | | | | Cendant Corp. | | | 189,111 | | | 1,600 | | | | Cintas Corp. | | | 63,616 | | | 1,492 | | | | Equifax, Inc. | | | 51,235 | | | 1,490 | | | | Monster Worldwide, Inc. (a) | | | 63,563 | | | 2,576 | | | | Pitney Bowes, Inc. | | | 106,389 | | | 2,508 | | | | R.R. Donnelley & Sons Co. | | | 80,131 | | | 1,994 | | | | Robert Half International, Inc. | | | 83,748 | | | 6,327 | | | | Waste Management, Inc. | | | 227,013 | | | | | | | | | | 970,661 | | | | | | | Communications Equipment — 2.8% | | 1,361 | | | | ADC Telecommunications, Inc. (a) (m) | | | 22,946 | | | 1,853 | | | | Andrew Corp. (a) | | | 16,418 | | | 4,771 | | | | Avaya, Inc. (a) | | | 54,485 | | | 6,820 | | | | Ciena Corp. (a) (c) | | | 32,804 | | | 70,852 | | | | Cisco Systems, Inc. (a) | | | 1,383,740 | | | 2,344 | | | | Comverse Technology, Inc. (a) | | | 46,341 | | | 18,077 | | | | Corning, Inc. (a) | | | 437,283 | | | 19,553 | | | | JDS Uniphase Corp. (a) (c) | | | 49,469 | | | 6,566 | | | | Juniper Networks, Inc. (a) | | | 104,990 | | | 51,994 | | | | Lucent Technologies, Inc. (a) (c) | | | 125,825 | | | 28,667 | | | | Motorola, Inc. | | | 577,640 | | | 19,454 | | | | QUALCOMM, Inc. | | | 779,522 | | | 5,200 | | | | Tellabs, Inc. (a) | | | 69,212 | | | | | | | | | | 3,700,675 | | | | | | | Computers & Peripherals — 3.4% | | 9,871 | | | | Apple Computer, Inc. (a) | | | 563,831 | | | 26,365 | | | | Dell, Inc. (a) | | | 643,570 | | | 27,444 | | | | EMC Corp. (a) | | | 301,061 | | | 3,066 | | | | Gateway, Inc. (a) (c) | | | 5,825 | | | 32,376 | | | | Hewlett-Packard Co. | | | 1,025,672 | | | 17,994 | | | | International Business Machines Corp. | | | 1,382,299 | | | 1,222 | | | | Lexmark International, Inc., Class A (a) | | | 68,224 | | | 2,112 | | | | NCR Corp. (a) | | | 77,384 | | | 4,343 | | | | Network Appliance, Inc. (a) | | | 153,308 | | | 1,871 | | | | QLogic Corp. (a) | | | 32,256 | | | 2,267 | | | | SanDisk Corp. (a) | | | 115,572 | | | 40,596 | | | | Sun Microsystems, Inc. (a) | | | 168,473 | | | | | | | | | | 4,537,475 | | | | | | | Construction & Engineering — 0.1% | | 1,016 | | | | Fluor Corp. | | | 94,417 | | | | | | | Construction Materials — 0.1% | | 1,168 | | | | Vulcan Materials Co. | | | 91,104 | | | | | | | Consumer Finance — 1.0% | | 14,320 | | | | American Express Co. | | | 762,110 | | | 3,517 | | | | Capital One Financial Corp. | | | 300,528 | | | 4,769 | | | | SLM Corp. | | | 252,376 | | | | | | | | | | 1,315,014 | | | | | | | Containers & Packaging — 0.2% | | 1,215 | | | | Ball Corp. | | | 45,004 | | | 1,217 | | | | Bemis Co. | | | 37,265 | | | 1,638 | | | | Pactiv Corp. (a) | | | 40,540 | | | 947 | | | | Sealed Air Corp. | | | 49,320 | | | 1,283 | | | | Temple-Inland, Inc. | | | 55,002 | | | | | | | | | | 227,131 | | | | | | | Distributors — 0.1% | | 2,004 | | | | Genuine Parts Co. | | | 83,487 | | | | | | | Diversified Consumer Services — 0.1% | | 1,624 | | | | Apollo Group, Inc., Class A (a) | | | 83,912 | | | 3,811 | | | | H&R Block, Inc. (c) | | | 90,931 | | | | | | | | | | 174,843 | |
SEE NOTES TO FINANCIAL STATEMENTS.
JUNE 30, 2006 JPMORGAN INSURANCE TRUST 5
JPMorgan Insurance Trust Equity Index Portfolio
SCHEDULE OF PORTFOLIO INVESTMENTS
AS OF JUNE 30, 2006 (Unaudited) (continued)
SHARES
|
|
|
| SECURITY DESCRIPTION
|
| VALUE($)
|
|---|
Long-Term Investments — Continued | | | | | | | | | Diversified Financial Services — 5.4% | | 52,965 | | | | Bank of America Corp. | | | 2,547,616 | | | 2,314 | | | | CIT Group, Inc. | | | 120,999 | | | 57,698 | | | | Citigroup, Inc. | | | 2,783,352 | | | 40,327 | | | | JPMorgan Chase & Co. (q) | | | 1,693,734 | | | 2,835 | | | | Moody’s Corp. | | | 154,394 | | | | | | | | | | 7,300,095 | | | | | | | Diversified Telecommunication Services — 2.6% | | 45,125 | | | | AT&T, Inc. | | | 1,258,536 | | | 20,994 | | | | BellSouth Corp. | | | 759,983 | | | 1,348 | | | | CenturyTel, Inc. | | | 50,078 | | | 3,771 | | | | Citizens Communications Co. | | | 49,212 | | | 1,730 | | | | Embarq Corp. (a) | | | 70,913 | | | 18,169 | | | | Qwest Communications International, Inc. (a) | | | 146,987 | | | 33,858 | | | | Verizon Communications, Inc. | | | 1,133,904 | | | | | | | | | | 3,469,613 | | | | | | | Electric Utilities — 2.1% | | 1,896 | | | | Allegheny Energy, Inc. (a) | | | 70,285 | | | 4,572 | | | | American Electric Power Co., Inc. | | | 156,591 | | | 4,034 | | | | Dominion Resources, Inc. | | | 301,703 | | | 2,063 | | | | DTE Energy Co. (c) | | | 84,047 | | | 14,334 | | | | Duke Energy Corp. | | | 420,989 | | | 3,781 | | | | Edison International | | | 147,459 | | | 2,413 | | | | Entergy Corp. | | | 170,720 | | | 7,759 | | | | Exelon Corp. | | | 440,944 | | | 3,828 | | | | FirstEnergy Corp. | | | 207,516 | | | 4,692 | | | | FPL Group, Inc. | | | 194,155 | | | 1,151 | | | | Pinnacle West Capital Corp. | | | 45,936 | | | 4,416 | | | | PPL Corp. | | | 142,637 | | | 2,936 | | | | Progress Energy, Inc. | | | 125,866 | | | 8,612 | | | | Southern Co. (The) | | | 276,015 | | | 4,706 | | | | Xcel Energy, Inc. (c) | | | 90,261 | | | | | | | | | | 2,875,124 | | | | | | | Electrical Equipment — 0.5% | | 1,969 | | | | American Power Conversion Corp. (c) | | | 38,376 | | | 1,072 | | | | Cooper Industries Ltd., Class A | | | 99,610 | | | 4,764 | | | | Emerson Electric Co. | | | 399,271 | | | 2,060 | | | | Rockwell Automation, Inc. | | | 148,340 | | | | | | | | | | 685,597 | | | | | | | Electronic Equipment & Instruments — 0.3% | | 4,942 | | | | Agilent Technologies, Inc. (a) | | | 155,969 | | | 2,067 | | | | Jabil Circuit, Inc. | | | 52,915 | | | 1,647 | | | | Molex, Inc. (c) | | | 55,290 | | | 6,183 | | | | Sanmina-SCI Corp. (a) | | | 28,442 | | | 10,612 | | | | Solectron Corp. (a) | | | 36,293 | | | 2,945 | | | | Symbol Technologies, Inc. | | | 31,777 | | | 971 | | | | Tektronix, Inc. | | | 28,567 | | | | | | | | | | 389,253 | | | | | | | Energy Equipment & Services — 2.0% | | 3,955 | | | | Baker Hughes, Inc. | | | 323,717 | | | 3,731 | | | | BJ Services Co. | | | 139,017 | | | 5,991 | | | | Halliburton Co. | | | 444,592 | | | 3,603 | | | | Nabors Industries Ltd. (Bermuda) (a) | | | 121,745 | | | 2,031 | | | | National Oilwell Varco, Inc. (a) | | | 128,603 | | | 1,599 | | | | Noble Corp. (Cayman Islands) | | | 118,998 | | | 1,279 | | | | Rowan Cos., Inc. | | | 45,520 | | | 13,694 | | | | Schlumberger Ltd. (Netherlands) | | | 891,616 | | | 3,771 | | | | Transocean, Inc. (Cayman Islands) (a) | | | 302,887 | | | 4,047 | | | | Weatherford International Ltd. (Bermuda) (a) | | | 200,812 | | | | | | | | | | 2,717,507 | | | | | | | Food & Staples Retailing — 2.4% | | 5,469 | | | | Costco Wholesale Corp. | | | 312,444 | | | 9,499 | | | | CVS Corp. | | | 291,619 | | | 8,397 | | | | Kroger Co. (The) | | | 183,559 | | | 5,224 | | | | Safeway, Inc. | | | 135,824 | | | 2,374 | | | | Supervalu, Inc. | | | 72,882 | | | 7,179 | | | | Sysco Corp. | | | 219,390 | | | 29,019 | | | | Wal-Mart Stores, Inc. | | | 1,397,845 | | | 11,724 | | | | Walgreen Co. | | | 525,704 | | | 1,626 | | | | Whole Foods Market, Inc. (c) | | | 105,105 | | | | | | | | | | 3,244,372 | | | | | | | Food Products — 1.2% | | 7,595 | | | | Archer-Daniels-Midland Co. | | | 313,522 | | | 2,151 | | | | Campbell Soup Co. | | | 79,824 | | | 6,028 | | | | ConAgra Foods, Inc. | | | 133,279 | | | 1,579 | | | | Dean Foods Co. (a) (m) | | | 58,723 | | | 4,131 | | | | General Mills, Inc. | | | 213,407 | | | 3,888 | | | | H.J. Heinz Co. | | | 160,263 | | | 2,061 | | | | Hershey Co. (The) | | | 113,499 | | | 2,830 | | | | Kellogg Co. | | | 137,057 | | | 1,538 | | | | McCormick & Co., Inc. (Non-Voting) | | | 51,600 | | | 8,822 | | | | Sara Lee Corp. | | | 141,328 | | | 2,924 | | | | Tyson Foods, Inc., Class A (c) | | | 43,451 | | | 2,577 | | | | Wm. Wrigley Jr. Co. | | | 116,893 | | | | | | | | | | 1,562,846 | | | | | | | Gas Utilities — 0.0% (g) | | 515 | | | | Nicor, Inc. (c) | | | 21,372 | | | 446 | | | | Peoples Energy Corp. (c) | | | 16,016 | | | | | | | | | | 37,388 | |
SEE NOTES TO FINANCIAL STATEMENTS.
6 JPMORGAN INSURANCE TRUST JUNE 30, 2006
SHARES
|
|
|
| SECURITY DESCRIPTION
|
| VALUE($)
|
|---|
Long-Term Investments — Continued | | | | | | | | | Health Care Equipment & Supplies — 1.6% | | 624 | | | | Bausch & Lomb, Inc. | | | 30,601 | | | 7,600 | | | | Baxter International, Inc. | | | 279,376 | | | 2,870 | | | | Becton, Dickinson & Co. | | | 175,443 | | | 2,856 | | | | Biomet, Inc. | | | 89,364 | | | 14,102 | | | | Boston Scientific Corp. (a) | | | 237,478 | | | 1,202 | | | | CR Bard, Inc. | | | 88,059 | | | 1,441 | | | | Fisher Scientific International, Inc. (a) (c) | | | 105,265 | | | 1,813 | | | | Hospira, Inc. (a) | | | 77,850 | | | 14,009 | | | | Medtronic, Inc. | | | 657,302 | | | 4,189 | | | | St. Jude Medical, Inc. (a) | | | 135,807 | | | 3,394 | | | | Stryker Corp. | | | 142,921 | | | 2,880 | | | | Zimmer Holdings, Inc. (a) | | | 163,354 | | | | | | | | | | 2,182,820 | | | | | | | Health Care Providers & Services — 2.7% | | 6,581 | | | | Aetna, Inc. | | | 262,779 | | | 2,436 | | | | AmerisourceBergen Corp. | | | 102,117 | | | 4,848 | | | | Cardinal Health, Inc. | | | 311,872 | | | 5,135 | | | | Caremark Rx, Inc. | | | 256,082 | | | 1,390 | | | | Cigna Corp. | | | 136,929 | | | 1,863 | | | | Coventry Health Care, Inc. (a) | | | 102,353 | | | 1,706 | | | | Express Scripts, Inc. (a) | | | 122,388 | | | 4,736 | | | | HCA, Inc. | | | 204,358 | | | 2,794 | | | | Health Management Associates, Inc., Class A (c) | | | 55,070 | | | 1,911 | | | | Humana, Inc. (a) | | | 102,621 | | | 1,447 | | | | Laboratory Corp. of America Holdings (a) | | | 90,047 | | | 917 | | | | Manor Care, Inc. (c) | | | 43,026 | | | 3,530 | | | | McKesson Corp. | | | 166,898 | | | 3,501 | | | | Medco Health Solutions, Inc. (a) | | | 200,537 | | | 1,609 | | | | Patterson Cos., Inc. (a) (c) | | | 56,202 | | | 1,886 | | | | Quest Diagnostics, Inc. | | | 113,009 | | | 5,463 | | | | Tenet Healthcare Corp. (a) (c) | | | 38,132 | | | 15,634 | | | | UnitedHealth Group, Inc. | | | 700,091 | | | 7,398 | | | | WellPoint, Inc. (a) | | | 538,353 | | | | | | | | | | 3,602,864 | | | | | | | Health Care Technology — 0.0% (g) | | 2,318 | | | | IMS Health, Inc. | | | 62,238 | | | | | | | Hotels, Restaurants & Leisure — 1.5% | | 5,041 | | | | Carnival Corp. | | | 210,411 | | | 1,497 | | | | Darden Restaurants, Inc. | | | 58,982 | | | 2,144 | | | | Harrah’s Entertainment, Inc. | | | 152,610 | | | 3,839 | | | | Hilton Hotels Corp. | | | 108,567 | | | 3,936 | | | | International Game Technology | | | 149,332 | | | 3,795 | | | | Marriott International, Inc., Class A | | | 144,665 | | | 14,462 | | | | McDonald’s Corp. | | | 485,923 | | | 8,908 | | | | Starbucks Corp. (a) | | | 336,366 | | | 2,521 | | | | Starwood Hotels & Resorts Worldwide, Inc. | | | 152,117 | | | 1,354 | | | | Wendy’s International, Inc. | | | 78,925 | | | 3,156 | | | | Yum! Brands, Inc. | | | 158,652 | | | | | | | | | | 2,036,550 | | | | | | | Household Durables — 0.6% | | 882 | | | | Black & Decker Corp. | | | 74,494 | | | 1,409 | | | | Centex Corp. | | | 70,873 | | | 3,157 | | | | D.R. Horton, Inc. | | | 75,200 | | | 1,702 | | | | Fortune Brands, Inc. | | | 120,859 | | | 776 | | | | Harman International Industries, Inc. | | | 66,247 | | | 875 | | | | KB Home (c) | | | 40,119 | | | 2,116 | | | | Leggett & Platt, Inc. (c) | | | 52,858 | | | 1,618 | | | | Lennar Corp., Class A | | | 71,790 | | | 3,213 | | | | Newell Rubbermaid, Inc. (c) | | | 82,992 | | | 2,472 | | | | Pulte Homes, Inc. | | | 71,169 | | | 675 | | | | Snap-On, Inc. | | | 27,283 | | | 821 | | | | Stanley Works (The) | | | 38,767 | | | 905 | | | | Whirlpool Corp. (c) | | | 74,798 | | | | | | | | | | 867,449 | | | | | | | Household Products — 2.2% | | 1,751 | | | | Clorox Co. | | | 106,758 | | | 5,973 | | | | Colgate-Palmolive Co. | | | 357,783 | | | 5,336 | | | | Kimberly-Clark Corp. | | | 329,231 | | | 38,086 | | | | Procter & Gamble Co. | | | 2,117,582 | | | | | | | | | | 2,911,354 | | | | | | | Independent Power Producers & Energy Traders — 0.4% | | 7,641 | | | | AES Corp. (The) (a) (m) | | | 140,976 | | | 2,077 | | | | Constellation Energy Group, Inc. | | | 113,238 | | | 4,285 | | | | Dynegy, Inc., Class A (a) | | | 23,439 | | | 5,367 | | | | TXU Corp. | | | 320,893 | | | | | | | | | | 598,546 | | | | | | | Industrial Conglomerates — 4.1% | | 8,750 | | | | 3M Co. | | | 706,737 | | | 120,686 | | | | General Electric Co. | | | 3,977,811 | | | 1,510 | | | | Textron, Inc. | | | 139,192 | | | 23,637 | | | | Tyco International Ltd. (Bermuda) | | | 650,017 | | | | | | | | | | 5,473,757 | | | | | | | Insurance — 4.6% | | 3,774 | | | | ACE Ltd. (Cayman Islands) | | | 190,927 | | | 5,787 | | | | Aflac, Inc. (m) | | | 268,227 | | | 7,374 | | | | Allstate Corp. (The) | | | 403,579 | | | 960 | | | | AMBAC Financial Group, Inc. | | | 77,856 | | | 30,147 | | | | American International Group, Inc. | | | 1,780,180 | | | 3,699 | | | | AON Corp. | | | 128,799 | | | 4,816 | | | | Chubb Corp. | | | 240,318 | | | 2,011 | | | | Cincinnati Financial Corp. | | | 94,537 | |
SEE NOTES TO FINANCIAL STATEMENTS.
JUNE 30, 2006 JPMORGAN INSURANCE TRUST 7
JPMorgan Insurance Trust Equity Index Portfolio
SCHEDULE OF PORTFOLIO INVESTMENTS
AS OF JUNE 30, 2006 (Unaudited) (continued)
SHARES
|
|
|
| SECURITY DESCRIPTION
|
| VALUE($)
|
|---|
Long-Term Investments — Continued | | | | | | | | | Insurance — Continued | | 4,234 | | | | Genworth Financial, Inc. | | | 147,513 | | | 3,518 | | | | Hartford Financial Services Group, Inc. | | | 297,623 | | | 3,332 | | | | Lincoln National Corp. | | | 188,058 | | | 4,712 | | | | Loews Corp. | | | 167,040 | | | 6,377 | | | | Marsh & McLennan Cos., Inc. | | | 171,478 | | | 1,564 | | | | MBIA, Inc. (c) | | | 91,572 | | | 8,805 | | | | Metlife, Inc. | | | 450,904 | | | 3,215 | | | | Principal Financial Group | | | 178,915 | | | 9,082 | | | | Progressive Corp. (The) | | | 233,498 | | | 5,710 | | | | Prudential Financial, Inc. | | | 443,667 | | | 1,383 | | | | Safeco Corp. | | | 77,932 | | | 8,081 | | | | St. Paul Travelers Cos., Inc. (The) | | | 360,251 | | | 1,165 | | | | Torchmark Corp. | | | 70,739 | | | 3,475 | | | | UnumProvident Corp. (c) | | | 63,002 | | | 2,093 | | | | XL Capital Ltd., Class A (Cayman Islands) | | | 128,301 | | | | | | | | | | 6,254,916 | | | | | | | Internet & Catalog Retail — 0.1% | | 3,589 | | | | Amazon.com, Inc. (a) (c) | | | 138,823 | | | | | | | Internet Software & Services — 1.4% | | 13,420 | | | | eBay, Inc. (a) | | | 393,072 | | | 2,392 | | | | Google, Inc., Class A (a) | | | 1,003,037 | | | 2,845 | | | | VeriSign, Inc. (a) | | | 65,919 | | | 14,552 | | | | Yahoo!, Inc. (a) | | | 480,216 | | | | | | | | | | 1,942,244 | | | | | | | IT Services — 1.0% | | 1,376 | | | | Affiliated Computer Services, Inc., Class A (a) | | | 71,015 | | | 6,690 | | | | Automatic Data Processing, Inc. | | | 303,392 | | | 2,180 | | | | Computer Sciences Corp. (a) | | | 105,599 | | | 1,626 | | | | Convergys Corp. (a) | | | 31,707 | | | 6,017 | | | | Electronic Data Systems Corp. | | | 144,769 | | | 8,885 | | | | First Data Corp. | | | 400,180 | | | 2,039 | | | | Fiserv, Inc. (a) | | | 92,489 | | | 3,879 | | | | Paychex, Inc. (c) | | | 151,204 | | | 1,540 | | | | Sabre Holdings Corp., Class A (c) | | | 33,880 | | | 3,981 | | | | Unisys Corp. (a) | | | 25,001 | | | | | | | | | | 1,359,236 | | | | | | | Leisure Equipment & Products — 0.2% | | 1,098 | | | | Brunswick Corp. | | | 36,508 | | | 3,334 | | | | Eastman Kodak Co. (c) | | | 79,283 | | | 1,998 | | | | Hasbro, Inc. | | | 36,184 | | | 4,520 | | | | Mattel, Inc. | | | 74,625 | | | | | | | | | | 226,600 | | | | | | | Life Sciences Tools & Services — 0.2% | | 2,148 | | | | Applera Corp. — Applied Biosystems Group (c) | | | 69,488 | | | 617 | | | | Millipore Corp. (a) | | | 38,865 | | | 1,470 | | | | PerkinElmer, Inc. | | | 30,723 | | | 1,900 | | | | Thermo Electron Corp. (a) (c) | | | 68,856 | | | 1,201 | | | | Waters Corp. (a) | | | 53,324 | | | | | | | | | | 261,256 | | | | | | | Machinery — 1.6% | | 7,772 | | | | Caterpillar, Inc. | | | 578,859 | | | 539 | | | | Cummins, Inc. | | | 65,893 | | | 2,738 | | | | Danaher Corp. | | | 176,108 | | | 2,723 | | | | Deere & Co. | | | 227,343 | | | 2,366 | | | | Dover Corp. | | | 116,951 | | | 1,743 | | | | Eaton Corp. | | | 131,422 | | | 4,807 | | | | Illinois Tool Works, Inc. | | | 228,332 | | | 3,819 | | | | Ingersoll-Rand Co., Ltd. Class A (Bermuda) | | | 163,377 | | | 2,147 | | | | ITT Industries, Inc. | | | 106,277 | | | 716 | | | | Navistar International Corp. (a) (c) | | | 17,621 | | | 1,935 | | | | PACCAR, Inc. | | | 159,405 | | | 1,449 | | | | Pall Corp. (c) | | | 40,572 | | | 1,397 | | | | Parker-Hannifin Corp. | | | 108,407 | | | | | | | | | | 2,120,567 | | | | | | | Media — 3.4% | | 8,966 | | | | CBS Corp., Class B | | | 242,530 | | | 5,841 | | | | Clear Channel Communications, Inc. | | | 180,779 | | | 24,522 | | | | Comcast Corp., Class A (a) | | | 802,850 | | | 686 | | | | Dow Jones & Co., Inc. (c) | | | 24,017 | | | 987 | | | | E.W. Scripps Co., Class A | | | 42,579 | | | 2,760 | | | | Gannett Co., Inc. | | | 154,367 | | | 5,064 | | | | Interpublic Group of Cos., Inc. (a) | | | 42,285 | | | 4,153 | | | | McGraw-Hill Cos., Inc. (The) | | | 208,605 | | | 491 | | | | Meredith Corp. | | | 24,324 | | | 1,681 | | | | New York Times Co., Class A (c) | | | 41,252 | | | 27,455 | | | | News Corp., Class A | | | 526,587 | | | 1,980 | | | | Omnicom Group, Inc. | | | 176,398 | | | 49,700 | | | | Time Warner, Inc. | | | 859,810 | | | 2,545 | | | | Tribune Co. | | | 82,534 | | | 2,589 | | | | Univision Communications, Inc., Class A (a) | | | 86,732 | | | 8,369 | | | | Viacom, Inc., Class B (a) | | | 299,945 | | | 25,474 | | | | Walt Disney Co. | | | 764,220 | | | | | | | | | | 4,559,814 | | | | | | | Metals & Mining — 1.0% | | 10,099 | | | | Alcoa, Inc. | | | 326,804 | | | 1,012 | | | | Allegheny Technologies, Inc. | | | 70,071 | | | 2,187 | | | | Freeport-McMoRan Copper & Gold, Inc., Class B (c) | | | 121,182 | | | 5,210 | | | | Newmont Mining Corp. | | | 275,765 | | | 3,617 | | | | Nucor Corp. | | | 196,222 | |
SEE NOTES TO FINANCIAL STATEMENTS.
8 JPMORGAN INSURANCE TRUST JUNE 30, 2006
SHARES
|
|
|
| SECURITY DESCRIPTION
|
| VALUE($)
|
|---|
Long-Term Investments — Continued | | | | | | | | | Metals & Mining — Continued | | 2,366 | | | | Phelps Dodge Corp. | | | 194,390 | | | 1,449 | | | | United States Steel Corp. | | | 101,604 | | | | | | | | | | 1,286,038 | | | | | | | Multi-Utilities — 0.7% | | 2,383 | | | | Ameren Corp. (c) | | | 120,342 | | | 3,614 | | | | CenterPoint Energy, Inc. (c) | | | 45,175 | | | 2,566 | | | | CMS Energy Corp. (a) (c) | | | 33,204 | | | 2,852 | | | | Consolidated Edison, Inc. (c) | | | 126,743 | | | 2,031 | | | | KeySpan Corp. | | | 82,052 | | | 3,164 | | | | NiSource, Inc. | | | 69,102 | | | 4,029 | | | | PG&E Corp. | | | 158,259 | | | 2,919 | | | | Public Service Enterprise Group, Inc. | | | 193,004 | | | 3,007 | | | | Sempra Energy | | | 136,758 | | | 2,423 | | | | TECO Energy, Inc. | | | 36,200 | | | | | | | | | | 1,000,839 | | | | | | | Multiline Retail — 1.2% | | 1,323 | | | | Big Lots, Inc. (a) (c) | | | 22,597 | | | 717 | | | | Dillards, Inc., Class A (c) | | | 22,836 | | | 3,618 | | | | Dollar General Corp. | | | 50,580 | | | 1,803 | | | | Family Dollar Stores, Inc. | | | 44,047 | | | 6,421 | | | | Federated Department Stores, Inc. | | | 235,009 | | | 2,726 | | | | J.C. Penney Co., Inc. | | | 184,032 | | | 3,951 | | | | Kohl’s Corp. (a) | | | 233,583 | | | 2,499 | | | | Nordstrom, Inc. | | | 91,214 | | | 1,126 | | | | Sears Holdings Corp. (a) | | | 174,350 | | | 10,021 | | | | Target Corp. | | | 489,726 | | | | | | | | | | 1,547,974 | | | | | | | Office Electronics — 0.1% | | 10,658 | | | | Xerox Corp. (a) | | | 148,253 | | | | | | | Oil, Gas & Consumable Fuels — 8.1% | | 5,322 | | | | Anadarko Petroleum Corp. | | | 253,806 | | | 3,834 | | | | Apache Corp. | | | 261,670 | | | 4,783 | | | | Chesapeake Energy Corp. (c) | | | 144,686 | | | 25,726 | | | | Chevron Corp. | | | 1,596,556 | | | 19,158 | | | | ConocoPhillips | | | 1,255,424 | | | 2,132 | | | | Consol Energy, Inc. (c) | | | 99,607 | | | 5,107 | | | | Devon Energy Corp. | | | 308,514 | | | 8,075 | | | | El Paso Corp. (c) | | | 121,125 | | | 2,815 | | | | EOG Resources, Inc. | | | 195,192 | | | 70,222 | | | | Exxon Mobil Corp. | | | 4,308,120 | | | 2,799 | | | | Hess Corp. | | | 147,927 | | | 2,635 | | | | Kerr-McGee Corp. | | | 182,737 | | | 1,210 | | | | Kinder Morgan, Inc. | | | 120,867 | | | 4,206 | | | | Marathon Oil Corp. | | | 350,360 | | | 1,928 | | | | Murphy Oil Corp. (c) | | | 107,698 | | | 4,971 | | | | Occidental Petroleum Corp. | | | 509,776 | | | 1,539 | | | | Sunoco, Inc. (c) | | | 106,637 | | | 7,143 | | | | Valero Energy Corp. | | | 475,152 | | | 6,908 | | | | Williams Cos., Inc. | | | 161,371 | | | 4,226 | | | | XTO Energy, Inc. | | | 187,085 | | | | | | | | | | 10,894,310 | | | | | | | Paper & Forest Products — 0.3% | | 5,721 | | | | International Paper Co. | | | 184,788 | | | 1,233 | | | | Louisiana-Pacific Corp. | | | 27,003 | | | 2,102 | | | | MeadWestvaco Corp. | | | 58,709 | | | 2,858 | | | | Weyerhaeuser Co. | | | 177,910 | | | | | | | | | | 448,410 | | | | | | | Personal Products — 0.2% | | 883 | | | | Alberto-Culver Co. | | | 43,020 | | | 5,226 | | | | Avon Products, Inc. | | | 162,006 | | | 1,379 | | | | Estee Lauder Cos., Inc. (The) | | | 53,326 | | | | | | | | | | 258,352 | | | | | | | Pharmaceuticals — 6.4% | | 17,714 | | | | Abbott Laboratories | | | 772,507 | | | 1,772 | | | | Allergan, Inc. | | | 190,065 | | | 1,232 | | | | Barr Pharmaceuticals, Inc. (a) | | | 58,754 | | | 22,821 | | | | Bristol-Myers Squibb Co. | | | 590,151 | | | 13,117 | | | | Eli Lilly & Co. | | | 724,977 | | | 3,782 | | | | Forest Laboratories, Inc. (a) | | | 146,326 | | | 34,366 | | | | Johnson & Johnson | | | 2,059,211 | | | 2,811 | | | | King Pharmaceuticals, Inc. (a) | | | 47,787 | | | 25,331 | | | | Merck & Co., Inc. | | | 922,808 | | | 2,440 | | | | Mylan Laboratories, Inc. | | | 48,800 | | | 85,043 | | | | Pfizer, Inc. | | | 1,995,959 | | | 17,189 | | | | Schering-Plough Corp. | | | 327,107 | | | 1,184 | | | | Watson Pharmaceuticals, Inc. (a) | | | 27,563 | | | 15,621 | | | | Wyeth | | | 693,729 | | | | | | | | | | 8,605,744 | | | | | | | Real Estate Investment Trusts (REITs) — 0.9% | | 1,128 | | | | Apartment Investment & Management Co. REIT | | | 49,012 | | | 2,481 | | | | Archstone-Smith Trust REIT | | | 126,209 | | | 1,060 | | | | Boston Properties, Inc. REIT | | | 95,824 | | | 4,249 | | | | Equity Office Properties Trust REIT | | | 155,131 | | | 3,380 | | | | Equity Residential REIT | | | 151,187 | | | 2,456 | | | | Kimco Realty Corp. REIT | | | 89,619 | | | 2,139 | | | | Plum Creek Timber Co., Inc. REIT | | | 75,935 | | | 2,843 | | | | Prologis REIT | | | 148,177 | | | 961 | | | | Public Storage, Inc. REIT (c) | | | 72,940 | |
SEE NOTES TO FINANCIAL STATEMENTS.
JUNE 30, 2006 JPMORGAN INSURANCE TRUST 9
JPMorgan Insurance Trust Equity Index Portfolio
SCHEDULE OF PORTFOLIO INVESTMENTS
AS OF JUNE 30, 2006 (Unaudited) (continued)
SHARES
|
|
|
| SECURITY DESCRIPTION
|
| VALUE($)
|
|---|
Long-Term Investments — Continued | | | | | | | | | Real Estate Investment Trusts (REITs) — Continued | | 2,128 | | | | Simon Property Group, Inc. REIT | | | 176,496 | | | 1,380 | | | | Vornado Realty Trust REIT (c) | | | 134,619 | | | | | | | | | | 1,275,149 | | | | | | | Road & Rail — 0.8% | | 4,232 | | | | Burlington Northern Santa Fe Corp. | | | 335,386 | | | 2,572 | | | | CSX Corp. | | | 181,172 | | | 4,813 | | | | Norfolk Southern Corp. | | | 256,148 | | | 708 | | | | Ryder System, Inc. | | | 41,368 | | | 3,121 | | | | Union Pacific Corp. | | | 290,128 | | | | | | | | | | 1,104,202 | | | | | | | Semiconductors & Semiconductor Equipment — 2.7% | | 5,618 | | | | Advanced Micro Devices, Inc. (a) | | | 137,192 | | | 4,170 | | | | Altera Corp. (a) | | | 73,183 | | | 4,192 | | | | Analog Devices, Inc. | | | 134,731 | | | 18,150 | | | | Applied Materials, Inc. | | | 295,482 | | | 5,316 | | | | Broadcom Corp., Class A (a) | | | 159,746 | | | 4,710 | | | | Freescale Semiconductor, Inc., Class B (a) | | | 138,474 | | | 67,514 | | | | Intel Corp. | | | 1,279,390 | | | 2,312 | | | | KLA-Tencor Corp. | | | 96,110 | | | 3,524 | | | | Linear Technology Corp. | | | 118,019 | | | 4,605 | | | | LSI Logic Corp. (a) | | | 41,215 | | | 3,722 | | | | Maxim Integrated Products, Inc. | | | 119,513 | | | 8,415 | | | | Micron Technology, Inc. (a) | | | 126,730 | | | 3,919 | | | | National Semiconductor Corp. | | | 93,468 | | | 1,477 | | | | Novellus Systems, Inc. (a) | | | 36,482 | | | 4,091 | | | | Nvidia Corp. (a) | | | 87,097 | | | 2,397 | | | | PMC-Sierra, Inc. (a) (c) | | | 22,532 | | | 2,301 | | | | Teradyne, Inc. (a) (c) | | | 32,053 | | | 18,083 | | | | Texas Instruments, Inc. | | | 547,734 | | | 3,987 | | | | Xilinx, Inc. | | | 90,306 | | | | | | | | | | 3,629,457 | | | | | | | Software — 3.1% | | 6,949 | | | | Adobe Systems, Inc. (a) | | | 210,972 | | | 2,689 | | | | Autodesk, Inc. (a) | | | 92,663 | | | 2,470 | | | | BMC Software, Inc. (a) | | | 59,033 | | | 5,295 | | | | CA, Inc | | | 108,812 | | | 2,114 | | | | Citrix Systems, Inc. (a) | | | 84,856 | | | 4,381 | | | | Compuware Corp. (a) | | | 29,353 | | | 3,553 | | | | Electronic Arts, Inc. (a) | | | 152,921 | | | 1,983 | | | | Intuit, Inc. (a) | | | 119,753 | | | 101,822 | | | | Microsoft Corp. | | | 2,372,453 | | | 3,934 | | | | Novell, Inc. (a) (c) | | | 26,082 | | | 45,198 | | | | Oracle Corp. (a) | | | 654,919 | | | 1,293 | | | | Parametric Technology Corp. (a) | | | 16,434 | | | 12,014 | | | | Symantec Corp. (a) | | | 186,698 | | | | | | | | | | 4,114,949 | | | | | | | Specialty Retail — 2.0% | | 1,721 | | | | Autonation, Inc. (a) (c) | | | 36,898 | | | 621 | | | | AutoZone, Inc. (a) | | | 54,772 | | | 3,276 | | | | Bed Bath & Beyond, Inc. (a) | | | 108,665 | | | 4,673 | | | | Best Buy Co., Inc. | | | 256,267 | | | 1,748 | | | | Circuit City Stores, Inc. (c) | | | 47,581 | | | 6,384 | | | | Gap, Inc. (The) | | | 111,082 | | | 23,990 | | | | Home Depot, Inc. | | | 858,602 | | | 3,981 | | | | Limited Brands, Inc. | | | 101,874 | | | 9,004 | | | | Lowe’s Cos., Inc. | | | 546,273 | | | 3,339 | | | | Office Depot, Inc. (a) | | | 126,882 | | | 826 | | | | OfficeMax, Inc. | | | 33,659 | | | 1,571 | | | | RadioShack Corp. (c) | | | 21,994 | | | 1,293 | | | | Sherwin-Williams Co. (The) (c) | | | 61,392 | | | 8,451 | | | | Staples, Inc. | | | 205,528 | | | 1,632 | | | | Tiffany & Co. | | | 53,889 | | | 5,304 | | | | TJX Cos., Inc. | | | 121,249 | | | | | | | | | | 2,746,607 | | | | | | | Textiles, Apparel & Luxury Goods — 0.3% | | 4,468 | | | | Coach, Inc. (a) | | | 133,593 | | | 1,306 | | | | Jones Apparel Group, Inc. | | | 41,518 | | | 1,213 | | | | Liz Claiborne, Inc. | | | 44,954 | | | 2,191 | | | | Nike, Inc., Class B | | | 177,471 | | | 1,019 | | | | V.F. Corp. | | | 69,210 | | | | | | | | | | 466,746 | | | | | | | Thrifts & Mortgage Finance — 1.6% | | 7,052 | | | | Countrywide Financial Corp. | | | 268,540 | | | 11,234 | | | | Fannie Mae | | | 540,355 | | | 8,020 | | | | Freddie Mac | | | 457,220 | | | 2,973 | | | | Golden West Financial Corp. | | | 220,597 | | | 1,015 | | | | MGIC Investment Corp. (c) | | | 65,975 | | | 4,369 | | | | Sovereign Bancorp, Inc. | | | 88,727 | | | 11,151 | | | | Washington Mutual, Inc. | | | 508,263 | | | | | | | | | | 2,149,677 | | | | | | | Tobacco — 1.5% | | 24,235 | | | | Altria Group, Inc. | | | 1,779,576 | | | 995 | | | | Reynolds American, Inc. (c) | | | 114,724 | | | 1,873 | | | | UST, Inc. | | | 84,641 | | | | | | | | | | 1,978,941 | | | | | | | Trading Companies & Distributors — 0.1% | | 886 | | | | WW Grainger, Inc. | | | 66,654 | |
SEE NOTES TO FINANCIAL STATEMENTS.
10 JPMORGAN INSURANCE TRUST JUNE 30, 2006
SHARES
|
|
|
| SECURITY DESCRIPTION
|
| VALUE($)
|
|---|
Long-Term Investments — Continued | | | | | | | | | Wireless Telecommunication Services — 0.7% | | 4,516 | | | | Alltel Corp. | | | 288,257 | | | 34,575 | | | | Sprint Nextel Corp. | | | 691,154 | | | | | | | | | | 979,411 | | | | | | | Total Common Stocks
(Cost $128,038,760) | | | 133,414,569 | | | | | | | Investment Company — 0.2% | | 2,600 | | | | SPDR Trust Series 1
(Cost $327,996) | | | 330,928 | | | | | | | Total Long-Term Investments
(Cost $128,366,756) | | | 133,745,497 | | Short-Term Investments — 0.7% | | | | | | | | | Investment Company — 0.7% | | 884,183 | | | | JPMorgan Liquid Assets Money Market Fund (b) (m) | | | 884,183 | |
PRINCIPAL
AMOUNT($)
|
|
|
|
|
|
|
|---|
| | | | | U.S. Treasury Bills — 0.0% (g) | | 30,000 | | | | U.S. Treasury Bills, 4.64%,
07/13/06 (k) (m) (n) | | | 29,965 | | | 30,000 | | | | U.S. Treasury Bills, 4.66%,
08/03/06 (k) (m) (n) | | | 29,883 | | | | | | | | | | 59,848 | | | | | | | Total Short-Term Investments
(Cost $944,011) | | | 944,031 | | Investments of Cash Collateral for Securities Loaned — 3.2% | | | | | | Certificates of Deposit — 0.6% | | 250,000 | | | | Credit Suisse First Boston, FRN,
5.33%, 10/17/06 | | | 250,000 | | | 599,685 | | | | Societe Generale, New York,
5.26%, 06/20/07 | | | 599,685 | | | | | | | | | | 849,685 | |
| | | | | Corporate Notes — 2.0% | | 500,000 | | | | American Express Credit Corp., 5.21%, 01/15/08 | | | 500,000 | | | 300,000 | | | | Bank of America, FRN, 5.31%, 11/07/06 | | | 300,000 | | | 200,000 | | | | Banque Federative Du Credit Mutuel, 5.30%, 07/13/07 | | | 200,000 | | | 500,113 | | | | Beta Finance, Inc., FRN, 5.38%, 03/15/07 | | | 500,113 | | | 450,000 | | | | CDC Financial Products Inc., FRN, 5.41%, 07/31/06 | | | 450,000 | | | 250,000 | | | | Citigroup Global Markets, Inc., FRN, 5.38%, 07/07/06 | | | 250,000 | | | 37,551 | | | | Citigroup Global Markets Holding, Inc., FRN, 5.41%, 12/12/06 | | | 37,551 | | | 350,031 | | | | Links Finance LLC, FRN, 5.36%, 10/06/06 | | | 350,031 | | | 56,327 | | | | MBIA Global Funding LLC, FRN, 5.42%, 01/26/07 | | | 56,327 | | | | | | | | | | 2,644,022 | | | | | | | Repurchase Agreements — 0.6% | | 275,546 | | | | Banc of America Securities LLC, 5.32%, dated 06/30/06, due 07/03/06, repurchase price $275,688,
collateralized by U.S. Agency Mortgages | | | 275,546 | | | 300,000 | | | | Morgan Stanley, 5.33%, dated 06/30/06, due 07/03/06, repurchase price $300,133, collateralized by U.S. Agency Mortgages | | | 300,000 | | | 300,000 | | | | UBS Securities LLC, 5.32%, dated 06/30/06, due 07/03/06, repurchase price $300,133, collateralized by U.S. Agency Mortgages | | | 300,000 | | | | | | | | | | 875,546 | | | | | | | Total Investments of Cash Collateral for Securities Loaned (Cost $4,369,253) | | | 4,369,253 | | | | | | | Total Investments — 103.2%
(Cost $133,680,020) | | | 139,058,781 | | | | | | | Liabilities in Excess of Other Assets — (3.2)% | | | (4,376,126 | ) | | | | | | NET ASSETS — 100.0% | | $ | 134,682,655 | |
Percentages indicated are based on net assets. SEE NOTES TO FINANCIAL STATEMENTS.
JUNE 30, 2006 JPMORGAN INSURANCE TRUST 11
JPMorgan Insurance Trust Equity Index Portfolio
SCHEDULE OF PORTFOLIO INVESTMENTS
AS OF JUNE 30, 2006 (Unaudited) (continued)
Futures Contracts
NUMBER
OF CONTRACTS
|
|
|
| Description
|
| Expiration
Date
|
| Notional
Value at
06/30/06
(USD)
|
| Unrealized
Appreciation
(Depreciation)
(USD)
|
|---|
14
| | | | E-mini S&P 500 Index | | September, 2006 | | $ | 895,580 | | | $ | (560 | ) |
ABBREVIATIONS: | (a) | | — Non-income producing security. |
| (b) | | — Investment in affiliate. Money market fund registered under the investment Company Act of 1940, as amended, and advised by JPMorgan Investment Advisors Inc. |
| (c) | | — Security, or a portion of the security, has been delivered to a counterparty as part of a security lending transaction. |
| (g) | | — Amount rounds to less than 0.1% |
| (k) | | — Security is fully or partially segregated with the broker as collateral for futures or with brokers as initial margin for futures contracts. |
| (m) | | — All or a portion of this security is segregated for current or potential holdings of futures, swaps, options, TBAs, when-issued securities, delayed delivery securities, and reverse repurchase agreements. |
| (n) | | — The rate shown is the effective yield at the date of purchase. |
| (q) | | — Investment in affiliate. This security is included in an index in which the Portfolio, as an index fund, invests. |
| FRN | | — Floating Rate Note. The rate shown is the rate in effect as of June 30, 2006. |
| SPDR | | — Standard & Poor’s Depositary Receipt |
SEE NOTES TO FINANCIAL STATEMENTS.
12 JPMORGAN INSURANCE TRUST JUNE 30, 2006
STATEMENT OF ASSETS AND LIABILITIES
AS OF JUNE 30, 2006 (Unaudited)
|
|
|
|
Equity Index
Portfolio
|
|---|
ASSETS: | | | | | | | | Investments in non-affiliates, at value | | | | $ | 136,480,864 | | | Investments in affiliates, at value | | | | | 2,577,917 | | | Total investment securities, at value | | | | | 139,058,781 | | | Cash | | | | | 16,461 | | | Receivables: | | | | | | | | Investment securities sold | | | | | 77,544 | | | Portfolio shares sold | | | | | 26,570 | | | Interest and dividends | | | | | 157,310 | | | Prepaid expenses and other assets | | | | | 5,187 | | | Total Assets | | | | | 139,341,853 | | | | LIABILITIES: | | | | | | | | Payables: | | | | | | | | Investment securities purchased | | | | | 161,364 | | | Collateral for securities lending program | | | | | 4,369,253 | | | Variation margin on futures contracts | | | | | 2,240 | | | Portfolio shares redeemed | | | | | 100,487 | | | Accrued liabilities: | | | | | | | | Investment advisory fees | | | | | 14,230 | | | Administration fees | | | | | 11,563 | | | Trustees’ and Officers’ fees | | | | | 59 | | | Other | | | | | 2 | | | Total Liabilities | | | | $ | 4,659,198 | | | Net Assets | | | | $ | 134,682,655 | | | | NET ASSETS: | | | | | | | | Paid in capital | | | | $ | 134,444,093 | | | Accumulated undistributed (distributions in excess of) net investment income | | | | | 1,030,357 | | | Accumulated net realized gains (losses) | | | | | (6,169,996 | ) | | Net unrealized appreciation (depreciation) | | | | | 5,378,201 | | | Total Net Assets | | | | $ | 134,682,655 | | | | | Outstanding units of beneficial interest (shares) | | | | | 12,195,278 | | | Net asset value, offering and redemption price per share (unlimited amount authorized, no par value) | | | | $ | 11.04 | | | | | | | | | | | Cost of investments | | | | $ | 133,680,020 | | | Market value of securities on loan | | | | $ | 4,325,608 | |
SEE NOTES TO FINANCIAL STATEMENTS.
JUNE 30, 2006 JPMORGAN INSURANCE TRUST 13
STATEMENT OF OPERATIONS
FOR THE SIX MONTHS ENDED JUNE 30, 2006 (Unaudited)
|
|
|
| Equity Index
Portfolio
|
|---|
INVESTMENT INCOME: | | | | | | | | Dividend income | | | | $ | 1,258,373 | | | Dividend income from affiliates (a) | | | | | 41,925 | | | Interest income | | | | | 2,343 | | | Income from securities lending (net) | | | | | 8,514 | | | Total investment income | | | | | 1,311,155 | | | | EXPENSES: | | | | | | | | Investment advisory fees | | | | | 193,408 | | | Administration fees | | | | | 86,495 | | | Custodian and accounting fees | | | | | 29,582 | | | Interest expense | | | | | 16 | | | Professional fees | | | | | 26,485 | | | Trustees’ and Officers’ fees | | | | | 1,083 | | | Transfer agent fees | | | | | 1,980 | | | Printing and mailing costs | | | | | 35,625 | | | Other | | | | | 7,993 | | | Total expenses | | | | | 382,667 | | | Less amounts waived | | | | | (104,881 | ) | | Less earnings credits | | | | | (78 | ) | | Net expenses | | | | | 277,708 | | | Net investment income (loss) | | | | | 1,033,447 | | | | REALIZED/UNREALIZED GAINS (LOSSES): | | | | | | | | Net realized gain (loss) on transactions from: | | | | | | | | Investments | | | | | (183,976 | ) | | Affiliated investments | | | | | (5,146 | ) | | Futures | | | | | (17,158 | ) | | Net realized gain (loss) | | | | | (206,280 | ) | | Change in net unrealized appreciation (depreciation) of: | | | | | | | | Investments | | | | | 2,557,704 | | | Affiliated investments | | | | | 101,361 | | | Futures | | | | | 11,653 | | | Change in net unrealized appreciation (depreciation) | | | | | 2,670,718 | | | Net realized/unrealized gains (losses) | | | | | 2,464,438 | | | Change in net assets resulting from operations | | | | $ | 3,497,885 | |
| (a) | | Includes reimbursements of investment advisory and administration fees. Please see Fees and Other Transactions with Affiliates in the Notes to Financial Statements. |
SEE NOTES TO FINANCIAL STATEMENTS.
14 JPMORGAN INSURANCE TRUST JUNE 30, 2006
STATEMENT OF CHANGES IN NET ASSETS
FOR THE PERIODS INDICATED
| | | | Equity Index Portfolio
| |
|---|
|
|
|
| Six Months
Ended
6/30/2006
(Unaudited)
|
| Year Ended
12/31/2005
|
|---|
CHANGE IN NET ASSETS RESULTING FROM OPERATIONS: | | | | | | | | | | | | Net investment income (loss) | | | | $ | 1,033,447 | | | $ | 1,915,232 | | | Net realized gain (loss) | | | | | (206,280 | ) | | | (350,695 | ) | | Change in net unrealized appreciation (depreciation) | | | | | 2,670,718 | | | | 4,414,651 | | | Change in net assets resulting from operations | | | | | 3,497,885 | | | | 5,979,188 | | | | DISTRIBUTIONS TO SHAREHOLDERS: | | | | | | | | | | | | From net investment income | | | | | (1,915,411 | ) | | | (1,958,403 | ) | | | CHANGE IN NET ASSETS FROM CAPITAL TRANSACTIONS: | | | | | | | | | | | | Proceeds from shares issued | | | | | 7,031,400 | | | | 18,903,292 | | | Dividends reinvested | | | | | 1,915,411 | | | | 1,958,403 | | | Cost of shares redeemed | | | | | (12,775,291 | ) | | | (25,151,037 | ) | | Change in net assets from capital transactions | | | | | (3,828,480 | ) | | | (4,289,342 | ) | | | NET ASSETS: | | | | | | | | | | | | Change in net assets | | | | | (2,246,006 | ) | | | (268,557 | ) | | Beginning of period | | | | | 136,928,661 | | | | 137,197,218 | | | End of period | | | | $ | 134,682,655 | | | $ | 136,928,661 | | | Accumulated undistributed (distributions in excess of) net investment income | | | | $ | 1,030,357 | | | $ | 1,912,321 | | | | SHARE TRANSACTIONS: | | | | | | | | | | | | Issued | | | | | 630,074 | | | | 1,803,028 | | | Reinvested | | | | | 170,108 | | | | 191,625 | | | Redeemed | | | | | (1,139,261 | ) | | | (2,390,262 | ) | | Change in shares | | | | | (339,079 | ) | | | (395,609 | ) |
SEE NOTES TO FINANCIAL STATEMENTS.
JUNE 30, 2006 JPMORGAN INSURANCE TRUST 15
FINANCIAL HIGHLIGHTS
FOR THE PERIODS INDICATED
| | | |
|
|
|
|
|
| Per share operating performance
|
|
|---|
| | | |
| | Investment operations
|
| Distributions
|
|
|---|
|
|
|
| Net asset
value,
beginning
of period
|
| Net
investment
income
(loss)
|
| Net realized
and unrealized
gains
(losses) on
investments
|
| Total from
investment
operations
|
| Net
investment
income
|
| Total
distributions
|
|---|
Equity Index Portfolio | | | | | | | | | | | | | | | | | | | | | | | | | | | | Six Months Ended June 30, 2006 (Unaudited) | | | | $ | 10.92 | | | $ | 0.09 | | | | $0.19 | | | $ | 0.28 | | | $ | (0.16 | ) | | $ | (0.16 | ) | | Year Ended December 31, 2005 | | | | | 10.61 | | | | 0.15 | | | | 0.31 | | | | 0.46 | | | | (0.15 | ) | | | (0.15 | ) | | Year Ended December 31, 2004 | | | | | 9.72 | | | | 0.15 | | | | 0.85 | | | | 1.00 | | | | (0.11 | ) | | | (0.11 | ) | | Year Ended December 31, 2003 | | | | | 7.69 | | | | 0.11 | | | | 2.01 | | | | 2.12 | | | | (0.09 | ) | | | (0.09 | ) | | Year Ended December 31, 2002 | | | | | 9.92 | | | | 0.09 | | | | (2.32) | | | | (2.23 | ) | | | — | | | | — | | | Year Ended December 31, 2001 | | | | | 11.42 | | | | 0.09 | | | | (1.50) | | | | (1.41 | ) | | | (0.09 | ) | | | (0.09 | ) |
| (a) | | Annualized for periods less than one year. |
| (b) | | Not annualized for periods less than one year. |
| (c) | | Includes adjustments in accordance with accounting principles generally accepted in the United States of America and as such, the net asset value for
financial reporting purposes and the returns based upon those net asset values may differ from the net asset value and returns for shareholder transactions. |
SEE NOTES TO FINANCIAL STATEMENTS.
16 JPMORGAN INSURANCE TRUST JUNE 30, 2006
|
| Ratios/Supplemental data
|
|
|---|
| | | |
| |
| | Ratios to average net assets (a)
| |
|---|
Net asset
value, end
of period
|
|
|
| Total
return (b)(c)
|
| Net assets
end of
period
(000’s)
|
| Net
expenses
|
| Net
investment
income
(loss)
|
| Expenses
without waivers,
reimbursements
and earnings credits
|
| Portfolio
turnover
rate (b)
|
|---|
| $11.04 | | | | | 2.51 | % | | $ | 134,683 | | | | 0.41 | % | | | 1.51 | % | | | 0.56 | % | | | 4 | % | | 10.92 | | | | | 4.46 | | | | 136,929 | | | | 0.46 | | | | 1.41 | | | | 0.51 | | | | 12 | | | 10.61 | | | | | 10.34 | | | | 137,197 | | | | 0.50 | | | | 1.53 | | | | 0.51 | | | | 14 | | | 9.72 | | | | | 27.98 | | | | 126,733 | | | | 0.50 | | | | 1.32 | | | | 0.51 | | | | 1 | | | 7.69 | | | | | (22.48 | ) | | | 89,012 | | | | 0.50 | | | | 1.15 | | | | 0.51 | | | | 5 | | | 9.92 | | | | | (12.34 | ) | | | 104,301 | | | | 0.50 | | | | 0.90 | | | | 0.51 | | | | 1 | |
SEE NOTES TO FINANCIAL STATEMENTS.
JUNE 30, 2006 JPMORGAN INSURANCE TRUST 17
NOTES TO FINANCIAL STATEMENTS
AS OF JUNE 30, 2006 (Unaudited)
1. Organization JPMorgan Insurance Trust (formerly JPMorgan Investment Trust) (the “Trust”) is registered under the Investment Company Act of 1940, as amended (the “1940 Act”), as an open-end investment company established as a Massachusetts business trust. The JPMorgan Insurance Trust Equity Index Portfolio is a separate Portfolio of the Trust (the “Portfolio”). Effective May 1, 2006, the Board of Trustees approved the name change from JPMorgan Investment Trust Equity Index Portfolio to JPMorgan Insurance Trust Equity Index Portfolio and designated existing shares as Class 1 shares. Portfolio shares are offered only to separate accounts of participating insurance companies and eligible plans. Individuals may not purchase shares directly from the Portfolio. 2. Significant Accounting Policies The following is a summary of significant accounting policies followed by the Trust in preparation of its financial statements. The policies are in accordance with accounting principles generally accepted in the United States of America. The preparation of financial statements requires management to make estimates and assumptions that affect the reported amounts of assets and liabilities at the date of the financial statements and the reported amounts of income and expenses for the period. Actual results could differ from those estimates. A. Valuation of Investments — Listed securities are valued at the last sale price on the exchange on which they are primarily traded. The value of National Market Systems equity securities quoted by the NASDAQ Stock Market shall generally be the NASDAQ Official Closing Price. Unlisted securities are valued at the last sale price provided by an independent pricing agent or principal market maker. Listed securities for which the latest sales prices are not available are valued at the mean of the latest bid and ask price as of the closing of the primary exchange where such securities are normally traded. Corporate debt securities, debt securities issued by the U.S. Treasury or a U.S. government agency (other than short-term investments maturing in 61 days or less), and municipal securities are valued each day based on readily available market quotations received from third party broker-dealers of comparable securities or independent or affiliated pricing services approved by the Board of Trustees. Such pricing services and broker-dealers will generally provide bid-side quotations. Generally, short-term investments (other than certain high yield securities) maturing in 61 days or less are valued at amortized cost, which approximates market value. Futures, options and other derivatives are valued on the basis of available market quotations. Investments in other open-end investment companies are valued at such investment company’s current day closing net asset value per share. Securities or other assets for which market quotations are not readily available or for which market quotations do not represent the value at the time of pricing (including certain illiquid securities) are fair valued in accordance with procedures established by and under the supervision and responsibility of the Trustees. Trading in securities on most foreign exchanges and over-the-counter markets is normally completed before the close of the domestic market and may also take place on days when the domestic market is closed. In accordance with procedures adopted by the Trustees, the Portfolio applies fair value pricing on a daily basis except for North American, Central American, South American and Caribbean equity securities held in its portfolio by utilizing the quotations of an independent pricing service, unless the Portfolio’s adviser determines that use of another valuation methodology is appropriate. The pricing service uses statistical analyses and quantitative models to adjust local market prices using factors such as subsequent movement and changes in the prices of indices, securities and exchange rates in other markets, in determining fair value as of the time the Portfolio calculates its net asset value. B. Repurchase Agreements — The Portfolio may enter into repurchase agreement transactions with institutions that meet the advisor’s credit guidelines. Each repurchase agreement is valued at amortized cost. The Portfolio requires that the collateral received in a repurchase agreement transaction be transferred to a custodian in a manner sufficient to enable the Portfolio to obtain collateral in the event of a counterparty default. If the counterparty defaults and the fair value of the collateral declines, realization of the collateral by the Portfolio may be delayed or limited. C. Futures Contracts — The Portfolio may enter into futures contracts for the delayed delivery of securities at a fixed price at some future date or for the change in the value of a specified financial index over a predetermined time period. Upon entering into a futures contract, the Portfolio is required to pledge to the broker an amount of cash, U.S. government securities, or other assets, equal to a certain percentage of the contract amount. This is known as the initial margin deposit. Subsequent payments, known as variation margin, are made or received by the Portfolio each day, depending on the daily fluctuations in fair value of the position. Variation margin is recorded as unrealized appreciation or depreciation until the contract is closed out, at which time the Portfolio realizes a gain or loss. Use of long futures contracts subjects the Portfolio to risk of loss in excess of the amounts shown on the Statement of Assets and Liabilities, up to the notional value of the futures contracts. Use of short futures contracts subjects the Portfolio to unlimited risk of loss. The Portfolio may enter into futures contracts only on exchanges or boards of trade. The exchange or board of trade acts as the counterparty to each futures transaction; therefore, the Portfolio’s credit risk is limited to failure of the exchange or board of trade. As of June 30, 2006, the Portfolio had outstanding futures contracts as listed on its Schedule of Portfolio Investments. 18 JPMORGAN INSURANCE TRUST JUNE 30, 2006
D. Securities Lending — To generate additional income, the Portfolio may lend up to 33-1/3% of its assets pursuant to agreements (“borrower agreements”) requiring that the loan be continuously secured by cash or securities issued by the U.S. government or its agencies or its instrumentalities (“U.S. government securities”). JPMorgan Chase Bank, N.A. (“JPMCB”), an affiliate of the Portfolio, serves as lending agent pursuant to a Securities Lending Agreement approved by the Board of Trustees (the “Securities Lending Agreement”). Under the Securities Lending Agreement, JPMCB acting as agent for the Portfolio, loans securities to approved borrowers pursuant to approved borrower agreements in exchange for collateral equal to at least 100% of the market value of the loaned securities plus accrued interest. During the term of the loan, the Portfolio receives payments from borrowers equivalent to the dividends and interest that would have been earned on securities lent while simultaneously seeking to earn income on the investment of cash collateral in accordance with investment guidelines contained in the Securities Lending Agreement. For loans secured by cash, the Portfolio retains the interest on cash collateral investments but are required to pay the borrower a portion of such interest for the use of the cash collateral. For loans secured by U.S. government securities, the borrower pays a borrower fee to the lending agent on behalf of the Portfolio. The net income earned on the securities lending (after payment of rebates and the lending agent’s fee) is included in the Statement of Operations as Income from securities lending (net). Information on the investment of cash collateral is shown in the Schedule of Portfolio Investments. Under the Securities Lending Agreement, JPMCB is entitled to a fee equal to (i) 0.06% calculated on an annualized basis and accrued daily, based upon the value of collateral received from borrowers for each loan of U.S. securities outstanding during a given month; and (ii) 0.1142% calculated on an annualized basis and accrued daily, based upon the value of collateral received from borrowers for each loan of non-U.S. securities outstanding during a given month. For the period ended June 30, 2006, JPMCB voluntarily reduced its fees to: (i) 0.05% for each loan of U.S. Securities and (ii) 0.10% for each loan of the non-U.S. Securities, respectively. Risks of delay in recovery of securities or even loss of rights in the securities may occur should the borrower of the securities fail financially. Risks may also arise to the extent that the value of the securities loaned increases above the value of the collateral received. JPMCB will indemnify the Portfolio from losses resulting from a borrower’s failure to return a loaned security when due. Such indemnification does not extend to losses associated with declines in the value of cash collateral investments. Loans are subject to termination by the Portfolio or the borrower at any time, and are, therefore, not considered to be illiquid investments. As of June 30, 2006, the Portfolio had securities with the following market values on loan, received the following collateral and for the period then ended, paid the following amounts to related party affiliates:
|
|
|
| Lending
Agent
Fees Paid
|
| Market
Value of
Collateral
|
| Market Value
of Loaned
Securities
|
|---|
| | | | | $ | 2,232 | | | $ | 4,369,253 | | | $ | 4,325,608 | |
E. Security Transactions and Investment Income — Investment transactions are accounted for on the trade date (the date the order to buy or sell is executed). Securities gains and losses are calculated on a specifically identified cost basis. Interest income is determined on the basis of coupon interest accrued using the effective interest method adjusted for amortization of premiums and accretion of discounts. Dividend income less foreign taxes withheld (if any) is recorded on the ex-dividend date or when the Portfolio first learns of the dividend. F. Allocation of Expenses — Expenses directly attributable to the Portfolio are charged directly to the Portfolio while the expenses attributable to more than one portfolio of the Trust are allocated among the respective portfolios. G. Federal Income Taxes — The Portfolio is treated as a separate taxable entity for Federal income tax purposes. The Portfolio’s policy is to comply with the provisions of the Internal Revenue Code of 1986, as amended (the “Code”), applicable to regulated investment companies and to distribute to shareholders all of its distributable net investment income and net realized gain on investments. Accordingly, no provision for Federal income tax is necessary. The Portfolio is also a segregated portfolio of assets for insurance purposes and intends to comply with the diversification requirements at Subchapter L of the Code. H. Distributions to Shareholders — Dividends from net investment income and net realized capital gains, if any, are generally declared and paid annually. Distributions from net investment income and from net capital gains are determined in accordance with Federal income tax regulations, which may differ from accounting principles generally accepted in the United States of America. To the extent these “book/tax” differences are permanent in nature (i.e. that they result from other than timing of recognition — “temporary differences”), such amounts are reclassified within the capital accounts based on their Federal tax-basis treatment. I. New Accounting Pronouncement — In July 2006, the Financial Accounting Standards Board issued Interpretation No. 48, “Accounting for Uncertainty in Income Taxes — an Interpretation of FASB Statement No. 109” (the “Interpretation”). The Interpretation establishes for all entities, including pass-through entities such as the Portfolio, a minimum threshold for financial statement recognition of the benefit of positions taken in filing tax returns (including whether an entity is taxable in a particular jurisdiction), and requires certain expanded tax disclosures. The Interpretation is effective for fiscal years beginning after December 15, 2006, and is to be applied to all open tax years as of the date of effectiveness. Management has recently begun to evaluate the application of the Interpretation to the Portfolio, and is not in a position at this time to estimate the significance of its impact, if any, on the Portfolio’s financial statements. JUNE 30, 2006 JPMORGAN INSURANCE TRUST 19
NOTES TO FINANCIAL STATEMENTS
AS OF JUNE 30, 2006 (Unaudited) (continued)
3. Fees and Other Transactions with Affiliates A. Investment Advisory Fee — Pursuant to the Investment Advisory Agreement, JPMorgan Investment Advisors Inc. (the “Advisor”) acts as the investment advisor to the Portfolio. The Advisor is an indirect wholly-owned subsidiary of JPMorgan Chase & Co. (“JPMorgan”). The Advisor supervises the investments of the Portfolio and for such services is paid a fee. The fee is accrued daily and paid monthly based on the Portfolio’s average daily net assets at an annual fee rate of 0.25%. Prior to May 1, 2006, the investment advisory fee for the Portfolio was 0.30%. The Advisor waived and/or reimbursed Investment Advisory fees as outlined in Note 3.E. The Portfolio may invest in one or more money market funds advised by the Advisor or its affiliates. Advisory and administrative fees are waived and/or reimbursed from the Portfolio in an amount sufficient to offset any doubling up of these fees related to the Portfolio’s investment in an affiliated money market fund to the extent required by law. B. Administration Fee — Pursuant to an Administration Agreement, JPMorgan Funds Management, Inc. (the “Administrator”), an indirect, wholly-owned subsidiary of JPMorgan, provides certain administration services to the Portfolio. In consideration of these services, the Administrator receives a fee computed daily and paid monthly at the annual rate of 0.15% of the first $25 billion of the average daily net assets of all funds in the JPMorgan Fund Complex (excluding funds of funds and money market funds) and 0.075% of the average daily net assets in excess of $25 billion of all such funds. The Administrator waived Administration fees as outlined in Note 3.E. Prior to May 1, 2006, the Administrator provided services for a fee computed daily and paid monthly at the annual rate of 0.14% of the average daily net assets of the Portfolio. J.P. Morgan Investor Services, Co. (“JPMIS”), an indirect, wholly owned subsidiary of JPMorgan, serves as the Portfolio’s Sub-administrator (the “Sub-administrator”). For its services as Sub-administrator, JPMIS receives a portion of the fees payable to the Administrator. Prior to May 1, 2006, JPMIS also received a portion of the fees payable to the Administrator as compensation for accounting services. C. Distribution Fees — Pursuant to a Distribution Agreement, JPMorgan Distribution Services, Inc. (the “Distributor”), a wholly-owned subsidiary of JPMorgan, serves as the Trust’s exclusive underwriter and promotes and arranges for the sale of the Portfolio’s shares. The Distributor receives no compensation in its capacity as the Portfolio’s underwriter. D. Custodian and Accounting Fees — JPMCB provides portfolio custody and accounting services for the Portfolio. The amounts paid directly to JPMCB by the Portfolio for custody and accounting services are included in custodian and accounting fees in the Statement of Operations. (Effective May 1, 2006, the Portfolio began paying the fees for accounting services directly to JPMCB.) The custodian fees may be reduced by credits earned by the Portfolio, based on uninvested cash balances held by the custodian. Such earnings credits are presented separately in the Statement of Operations. Interest expense, if any, paid to the custodian related to cash overdrafts is presented as interest expense in the Statement of Operations. E. Waivers and Reimbursements — The Advisor and Administrator have contractually agreed to waive fees or reimburse the Portfolio to the extent that total annual operating expenses (excluding dividend expenses on short sales, interest, taxes, extraordinary expenses and expenses related to the Board of Trustees’ deferred compensation plan) exceed 0.40% (0.41% prior to May 1, 2006) of the Portfolio’s average daily net assets. The contractual expense limitation agreement was in effect for the six months ended June 30, 2006. The new expense limitation percentage is in place until at least April 30, 2007. For the six months ended June 30, 2006, the Portfolio’s Advisor contractually waived fees for the Portfolio in the amount of $104,881. The Advisor does not expect the Portfolio to repay any such waived fees in future years. F. Other — Certain officers of the Trust are affiliated with the Advisor, the Administrator, the Sub-Administrator and the Distributor. Such officers, with the exception of the Chief Compliance Officer, receive no compensation from the Portfolio for serving in their respective roles. The Board of Trustees appointed a Chief Compliance Officer to the Portfolio in accordance with federal securities regulations. The Portfolio, along with other affiliated portfolios, make reimbursement payments, on a pro-rata basis, to the Administrator for a portion of the fees associated with the Office of the Chief Compliance Officer. Such fees are included in Trustees’ and Officers’ Fees in the Statement of Operations. The Trust adopted a Trustee Deferred Compensation Plan (the “Plan”) which allows the independent Trustees to defer the receipt of all or a portion of compensation related to performance of their duties as a Trustee. The deferred fees are invested in various funds until distribution in accordance with the Plan. 20 JPMORGAN INSURANCE TRUST JUNE 30, 2006
During the period, the Portfolio may have purchased securities from an underwriting syndicate in which the principal underwriter or members of the syndicate are affiliated with the Advisor. The Portfolio may use related party brokers/dealers. For the six months ended June 30, 2006, the Portfolio did not incur any brokerage commissions with brokers/dealers affiliated with the Advisor. The SEC has granted an exemptive order permitting the Portfolio to engage in principal transactions with J.P. Morgan Securities, Inc., an affiliated broker, involving taxable money market instruments subject to certain conditions. 4. Investment Transactions During the six months ended June 30, 2006, purchases and sales of investments (excluding short-term investments) were as follows:
|
|
|
| Purchases
(excluding U.S.
Government)
|
| Sales
(excluding U.S.
Government)
|
|---|
| | | | | $ | 5,880,299 | | | $ | 10,687,204 | |
During the six months ended June 30, 2006, there were no purchases or sales of U.S. Government securities. 5. Federal Income Tax Matters For Federal income tax purposes, the cost and unrealized appreciation (depreciation) in value of the investment securities at June 30, 2006, were as follows:
|
|
|
| Aggregate
Cost
|
| Gross
Unrealized
Appreciation
|
| Gross
Unrealized
Depreciation
|
| Net Unrealized
Appreciation
(Depreciation)
|
|---|
| | | | | $ | 133,680,020 | | | $ | 28,820,733 | | | $ | (23,441,972 | ) | | $ | 5,378,761 | |
6. Borrowings The Trust and JPMCB have entered into a financing arrangement. Under this arrangement, JPMCB provides an unsecured, uncommitted credit facility in the aggregate amount of $100 million to certain of the JPMorgan Funds including the Portfolio. Advances under the arrangement are taken primarily for temporary or emergency purposes, including the meeting of redemption requests that otherwise might require the untimely disposition of securities, and are subject to the Portfolio’s borrowing restrictions. Interest on borrowings is payable at a rate determined by JPMCB at the time of borrowing. This agreement has been extended until November 21, 2006. The Portfolio had no borrowings outstanding at June 30, 2006, or at any time during the six months ended. 7. Concentrations and Indemnification In the normal course of business, the Portfolio enters into contracts that contain a variety of representations which provide general indemnifications. The Portfolio’s maximum exposure under these arrangements is unknown, as this would involve future claims that may be made against the Portfolio that have not yet occurred. However, based on experience, the Portfolio expects the risk of loss to be remote. From time to time, the Portfolio may have a concentration of several shareholders, holding a significant percentage of shares outstanding. Investment activities of these shareholders could have a material impact on the Portfolio. JUNE 30, 2006 JPMORGAN INSURANCE TRUST 21
TRUSTEES
(Unaudited)
The Portfolio’s Statement of Additional Information includes additional information about the Portfolio’s Trustees and is available, without charge, upon request by calling 1-800-480-4111 or on the Portfolio’s website at www.jpmorganfunds.com. Name (Year of Birth);
Positions With
the Portfolio
|
|
|
| Principal Occupations
During Past 5 Years
|
| Number of
Portfolios/Funds
in JPMorgan
Funds Complex (1)
Overseen by Trustee
|
| Other Directorships Held
Outside Fund Complex
|
|---|
Independent Trustees | | William J. Armstrong (1941); Trustee of Trust since 2005; Trustee of heritage JPMorgan Funds since 1987. | | | | Retired; CFO and Consultant, EduNeering, Inc. (internet business education supplier) (2000–2001); Vice President and Treasurer, Ingersoll–Rand Company (manufacturer of industrial equipment) (1972–2000). | | 120 | | None. | | Roland R. Eppley, Jr. (1932); Trustee of Trust since 2005; Trustee of heritage JPMorgan Funds since 1989. | | | | Retired; President and Chief Executive Officer, Eastern States Bankcard (1971–1988). | | 120 | | None. | | John F. Finn (1947); Trustee of Trust since 2005; Trustee of heritage One Group Mutual Funds since 1998. | | | | President and Chief Executive Officer, Gardner, Inc. (wholesale distributor to outdoor power equipment industry) (1979–present). | | 120 | | Director, Cardinal Health, Inc (CAH) (1994–present); Chairman, The Columbus Association for the Performing Arts (CAPA) (2003–present). | | Dr. Matthew Goldstein (1941); Trustee of Trust since 2005; Trustee of heritage JPMorgan Funds since 2003. | | | | Chancellor of the City University of New York (1999–present); President, Adelphi University (New York) (1998–1999). | | 120 | | Director, Albert Einstein School of Medicine (1998–present); Director, New Plan Excel Realty Trust, Inc. (real estate investment trust)
(2000–present); Director, Lincoln Center Institute for the Arts in Education (1999–present). | | Robert J. Higgins (1945); Trustee of Trust since 2005; Trustee of heritage JPMorgan Funds since 2002. | | | | Retired; Director of Administration of the State of Rhode Island (2003–2004); President — Consumer Banking and Investment Services, Fleet Boston Financial (1971–2001). | | 120 | | None. | | Peter C. Marshall (1942); Trustee of Trust since 2005; Trustee of heritage One Group Mutual Funds since 1994. | | | | Self-employed business consultant (2002–present); Senior Vice President, W.D. Hoard, Inc. (corporate parent of DCI Marketing, Inc.) (2000–2002); President, DCI Marketing, Inc. (1992–2000). | | 120 | | None. | | Marilyn McCoy (1948); Trustee of Trust since 2005; Trustee of heritage One Group Mutual Funds since 1999. | | | | Vice President of Administration and Planning, Northwestern University (1985–present). | | 120 | | Trustee, Mather LifeWays (1994–present); Trustee, Carleton College (2003–present). | | William G. Morton, Jr. (1937); Trustee of Trust since 2005; Trustee of heritage JPMorgan Funds since 2003. | | | | Retired; Chairman Emeritus (2001–2002), and Chairman and Chief Executive Officer, Boston Stock Exchange (1985–2001). | | 120 | | Director, Radio Shack Corporation (electronics) (1987–present); Director, The National Football Foundation and College Hall of Fame (1994–present); Trustee, Stratton Mountain School (2001–present). |
22 JPMORGAN INSURANCE TRUST JUNE 30, 2006
Name (Year of Birth);
Positions With
the Portfolio
|
|
|
| Principal Occupations
During Past 5 Years
|
| Number of
Portfolios/Funds
in JPMorgan
Funds Complex (1)
Overseen by Trustee
|
| Other Directorships Held
Outside Fund Complex
|
|---|
Independent Trustees | | Robert A. Oden, Jr. (1946); Trustee of Trust since 2005; Trustee of heritage One Group Mutual Funds since 1997. | | | | President, Carleton College (2002–present); President, Kenyon College (1995–2002). | | 120 | | Director, American University in Cairo. | | Fergus Reid, III (1932); Trustee of Trust (Chairman) since 2005; Trustee (Chairman) of heritage JPMorgan Funds since 1987. | | | | Chairman, Lumelite Corporation (plastics manufacturing) (2003–present); Chairman and Chief Executive Officer, Lumelite Corporation (1985–2002). | | 120 | | Trustee, Morgan Stanley Funds (198 portfolios) (1995–present). | | Frederick W. Ruebeck (1939); Trustee of Trust since 2005; Trustee of heritage One Group Mutual Funds since 1994. | | | | Advisor, Jerome P. Green & Associates, LLC (broker-dealer) (2000–present); Chief Investment Officer, Wabash College (2004–present); self-employed consultant (2000–present); Director of Investments, Eli Lilly and Company (1988–1999). | | 120 | | Trustee, Wabash College (1988–present); Chairman, Indianapolis Symphony Orchestra Foundation (1994–present). | | James J. Schonbachler (1943); Trustee of Trust since 2005; Trustee of heritage JPMorgan Funds since 2001. | | | | Retired; Managing Director of Bankers Trust Company (financial services) (1968–1998). | | 120 | | None. | Interested Trustee | | Leonard M. Spalding, Jr.* (1935); Trustee of Trust since 2005; Trustee of heritage JPMorgan Funds since 1998. | | | | Retired; Chief Executive Officer of Chase Mutual Funds (investment company) (1989–1998); President & Chief Executive Officer, Vista Capital Management (investment management) (1990–1998); Chief Investment Executive, Chase Manhattan Private Bank (investment management) (1990–1998). | | 120 | | Director, Glenview Trust Company, LLC (2001–present); Trustee, St. Catherine College (1998–present); Trustee, Bellarmine University (2000–present); Director, Springfield-Washington County Economic Development Authority (1997–present); Trustee, Marion and Washington County, Kentucky Airport Board (1998–present); Trustee, Catholic Education Foundation (2005–present). |
| (1) | | A Fund Complex means two or more registered investment companies that hold themselves out to investors as related companies for purposes of investment and investor services or have a common investment adviser or have an investment adviser that is an affiliated person of the investment adviser of any of the other registered investment companies. The JPMorgan Funds Complex which the Board of Trustees currently oversees includes eight registered investment companies (120 portfolios/funds). |
| * | | Mr. Spalding is deemed to be an “interested person” due to his ownership of JPMorgan Chase stock. |
The contact address for each of the Trustees is 245 Park Avenue, New York, NY 10167. JUNE 30, 2006 JPMORGAN INSURANCE TRUST 23
OFFICERS
(Unaudited)
Name (Year of Birth),
Positions Held with
the Trust
|
|
|
| Principal Occupations During Past 5 Years
|
|---|
George C.W. Gatch (1962),
President since 2005 | | | | Managing Director, JPMorgan Investment Management Inc.; Director and President, JPMorgan Distribution Services, Inc. and JPMorgan Funds Management, Inc. since 2005. Mr. Gatch is CEO and President of JPMorgan Funds. Mr. Gatch has been an employee since 1986 and has held positions such as President and CEO of DKB Morgan, a Japanese mutual fund company which was a joint venture between J.P. Morgan and Dai-Ichi Kangyo Bank, as well as positions in business management, marketing and sales. | Robert L. Young (1963),
Senior Vice President since 2005* | | | | Director and Vice President, JPMorgan Distribution Services, Inc. and JPMorgan Funds Management, Inc.; Chief Operating Officer, JPMorgan Funds since 2005, and One Group Mutual Funds from 2001 until 2005. Mr. Young was Vice President and Treasurer, JPMorgan Funds Management, Inc. (formerly One Group Administrative Services) and Vice President and Treasurer, JPMorgan Distribution Services, Inc. (formerly One Group Dealer Services, Inc.) from 1999 to 2005. | Patricia A. Maleski (1960),
Vice President and Chief
Administrative Officer since 2005 | | | | Managing Director, JPMorgan Funds Management, Inc.; previously, Treasurer, JPMorgan Funds and Head of Funds Administration and Board Liaison. Ms. Maleski was Vice President of Finance for the Pierpont Group, Inc. from 1996–2001, an independent company owned by the Board of Directors/Trustees of the JPMorgan Funds, prior to joining J.P. Morgan Chase & Co. in 2001. | Stephanie J. Dorsey (1969),
Treasurer since 2005* | | | | Vice President, JPMorgan Funds Management, Inc.; Director of Mutual Fund Administration, JPMorgan Funds Management, Inc. (formerly One Group Administrative Services), from 2004 to 2005; Ms. Dorsey worked for JPMorgan Chase & Co., (formerly Bank One Corporation) from 2003 to 2004; prior to joining Bank One Corporation, she was a Senior Manager specializing in Financial Services audits at PricewaterhouseCoopers LLP from 1992 through 2002. | Stephen M. Ungerman (1953),
Senior Vice President and Chief
Compliance Officer since 2005
| | | | Senior Vice President, JPMorgan Chase & Co.; Mr. Ungerman was head of Fund Administration — Pooled Vehicles from 2000 to 2004. Mr. Ungerman held a number of positions in Prudential Financial’s asset management business prior to 2000. | Paul L. Gulinello (1950), AML
Compliance Officer since 2005 | | | | Vice President and Anti Money Laundering Compliance Officer for JPMorgan Asset Management Americas, additionally responsible for personal trading and compliance testing since 2004; Treasury Services Operating Risk Management and Compliance Executive supporting all JPMorgan Treasury Services business units from July 2000 to 2004. | Stephen M. Benham (1959),
Secretary since 2005 | | | | Vice President and Assistant General Counsel, JPMorgan Chase & Co. since 2004; Vice President (Legal Advisory) of Merrill Lynch Investment Managers, L.P. from 2000 to 2004; attorney associated with Kirkpatrick & Lockhart LLP from 1997 to 2000. | Elizabeth A. Davin (1964),
Assistant Secretary since 2005* | | | | Vice President and Assistant General Counsel, JPMorgan Chase & Co. since 2005; Senior Counsel, JPMorgan Chase & Co. (formerly Bank One Corporation) from 2004 to 2005; Assistant General Counsel and Associate General Counsel and Vice President, Gartmore Global Investments, Inc. from 1999 to 2004. | Jessica K. Ditullio (1962),
Assistant Secretary since 2005* | | | | Vice President and Assistant General Counsel, JPMorgan Chase & Co. since 2005; Ms. Ditullio has served as an attorney with various titles for JPMorgan Chase & Co. (formerly Bank One Corporation) since 1990. | Nancy E. Fields (1949),
Assistant Secretary since 2005* | | | | Vice President, JPMorgan Funds Management, Inc. and JPMorgan Distribution Services, Inc.; From 1999 to 2005, Director, Mutual Fund Administration, JPMorgan Funds Management, Inc. (formerly One Group Administrative Services, Inc.) and Senior Project Manager, Mutual Funds, JPMorgan Distribution Services, Inc. (formerly One Group Dealer Services, Inc.). | Michael C. Raczynski (1975),
Assistant Secretary (2006) | | | | Vice President and Assistant General Counsel, JPMorgan Chase & Co. since 2006; Associate, Stroock & Stroock & Lavan LLP from 2001 to 2006. | Ellen W. O’Brien (1957),
Assistant Secretary since 2005** | | | | Assistant Vice President, JPMorgan Investor Services, Co., responsible for Blue Sky registration. Ms. O’Brien has served in this capacity since joining the firm in 1991. |
24 JPMORGAN INSURANCE TRUST JUNE 30, 2006
Name (Year of Birth),
Positions Held with
the Trust
|
|
|
| Principal Occupations During Past 5 Years
|
|---|
Suzanne E. Cioffi (1967),
Assistant Treasurer since 2005 | | | | Vice President, JPMorgan Funds Management, Inc., responsible for mutual fund financial reporting. Ms. Cioffi has overseen various fund accounting, custody and administration conversion projects during the past five years. | Arthur A. Jensen (1966),
Assistant Treasurer since 2005* | | | | Vice President, JPMorgan Funds Management, Inc. since April 2005; formerly, Vice President of Financial Services of BISYS Fund Services, Inc. from 2001 until 2005; Mr. Jensen was Section Manager at Northern Trust Company and Accounting Supervisor at Allstate Insurance Company prior to 2001. |
The contact address for each of the officers, unless otherwise noted, is 245 Park Avenue, New York, NY 10167. | * | | The contact address for the officer is 1111 Polaris Parkway, Columbus, OH 43271. |
| ** | | The contact address for the officer is 73 Tremont Street, Floor 1, Boston MA 02108. |
JUNE 30, 2006 JPMORGAN INSURANCE TRUST 25
SCHEDULE OF SHAREHOLDER EXPENSES
(Unaudited)
Hypothetical $1,000 Investment at Beginning of Period
June 30, 2006
As a shareholder of the Portfolio, you incur ongoing costs: including investment advisory, administration fees and other Portfolio expenses. Because the Portfolio is a funding vehicle for Policies and Eligible Plans, you may also incur sales charges and other fees relating to the Policies or Eligible Plans. The examples below are intended to help you understand your ongoing costs (in dollars) of investing in the Portfolio, but not the costs of the Policies or Eligible Plans, and to compare these costs with the ongoing costs of investing in other mutual funds. The examples assume that you had a $1,000 investment in the Portfolio at the beginning of the reporting period, January 1, 2006, and continued to hold your shares at the end of the reporting period, June 30, 2006. Actual Expenses The first line provides information about actual account values and actual expenses. You may use the information in this line, together with the amount you invested, to estimate the expenses that you paid over the period. Simply divide your account value by $1,000 (for example, an $8,600 account value divided by $1,000 = 8.6), then multiply the result by the number in the first line under the heading entitled “Expenses Paid During Period” to estimate the expenses you paid on your account during this period. Hypothetical Example for Comparison Purposes The second line in the table below provides information about hypothetical account values and hypothetical expenses based on the actual expense ratio and an assumed rate of return of 5% per year before expenses, which is not the Portfolio’s actual return. The hypothetical account values and expenses may not be used to estimate the actual ending account balance or expenses you paid for the period. You may use this information to compare the ongoing costs of investing in the Portfolio and other portfolios. To do so, compare this 5% hypothetical example with the 5% hypothetical examples that appear in the shareholder reports of the other funds. Please note that the expenses shown in the table are meant to highlight your ongoing costs only and do not reflect any transaction costs, such as sales charges (loads) or redemption fees or the costs associated with the Policies and Eligible Plans through which the Portfolio is held. Therefore, the second line in the table is useful in comparing ongoing costs only, and will not help you determine the relative total costs of owning different portfolios. In addition, if these transaction costs were included, your costs would have been higher. The examples also assume all dividends and distributions have been reinvested.
|
|
|
| Beginning
Account Value,
January 1, 2006
|
| Ending
Account Value,
June 30, 2006
|
| Expenses
Paid During
January 1 to
June 30, 2006*
|
| Annualized
Expense Ratio
|
|---|
Equity Index Portfolio | | | | | | | | | | | | | | | | | | | | Actual | | | | $ | 1,000.00 | | | $ | 1,025.10 | | | | $2.06 | | | | 0.41 | % | | Hypothetical | | | | | 1,000.00 | | | | 1,022.76 | | | | 2.06 | | | | 0.41 | |
| * | | Expenses are equal to the Portfolio’s annualized expense ratio, multiplied by the average account value over the period, multiplied by 181/365 (to reflect the one-half year period). |
26 JPMORGAN INSURANCE TRUST JUNE 30, 2006
THIS PAGE IS INTENTIONALLY LEFT BLANK
THIS PAGE IS INTENTIONALLY LEFT BLANK
JPMorgan Funds are distributed by JPMorgan Distribution Services, Inc., which is an affiliate of JPMorgan Chase & Co. Affiliates of JPMorgan Chase & Co. receive fees for providing various services to the funds. This report is submitted for the general information of the shareholders of the Portfolio. It is not authorized for distribution to prospective investors in the Portfolio unless preceded or accompanied by a prospectus. Contact JPMorgan Funds Distribution Services at 1-800-480-4111 for a portfolio prospectus. You can also visit us at www.jpmorganfunds.com. Investors should carefully consider the investment objectives and risk as well as charges and expenses of the mutual fund before investing. The prospectus contains this and other information about the mutual fund. Read the prospectus carefully before investing. The Portfolio files a complete schedule of its portfolio holdings for the first and third quarters of its fiscal year with the SEC on Form N-Q. The Portfolio’s Forms N-Q are available on the SEC’s website at http://www.sec.gov and may be reviewed and copied at the SEC’s Public Reference Room in Washington, DC. Information on the operation of the SEC’s Public Reference Room may be obtained by calling 1-800-SEC-0330. Shareholders may request the Form N-Q without charge by calling 1-800-480-4111 or by visiting the variable insurance portfolio section of the JPMorgan Funds’ website at www.jpmorganfunds.com. A description of the Portfolio’s policies and procedures with respect to the disclosure of the Portfolio’s holdings is available in the Statement of Additional Information. A copy of proxy policies and procedures are available without charge upon request by calling 1-800-480-4111 and on the SEC’s website at www.sec.gov. The Trustees have delegated the authority to vote proxies for securities owned by the Portfolio to the Advisor. A copy of the Portfolio’s voting record for the most recent 12-month period ended June 30 is available on the SEC’s website at www.sec.gov or at the Portfolio’s website at www.jpmorganfunds.com no later than August 31 of each year. The Portfolio’s proxy voting record will include, among other things, a brief description of the matter voted on for each portfolio security, and will state how each vote was cast, for example, for or against the proposal.
© JPMorgan Chase & Co., 2006 All rights reserved. June 2006. | | SAN-JPMITEIP-606 |
SEMI-ANNUAL REPORT
SIX MONTHS ENDED JUNE 30, 2006 (UNAUDITED) JPMorgan
Insurance
Trust JPMorgan Insurance Trust Government Bond Portfolio
(formerly JPMorgan Investment Trust Government Bond Portfolio)
NOT FDIC INSURED • NO BANK GUARANTEE • MAY LOSE VALUE
This material must be preceded or accompanied by a current prospectus.
CONTENTS | President’s Letter | | | | | 1 | | Portfolio Commentary:
| | | | | | | | JPMorgan Insurance Trust Government Bond Portfolio | | | | | 2 | | | Schedule of Portfolio Investments | | | | | 4 | | | Statement of Assets and Liabilities | | | | | 7 | | | Statement of Operations | | | | | 8 | | | Statement of Changes in Net Assets | | | | | 9 | | | Financial Highlights | | | | | 10 | | | Notes to Financial Statements | | | | | 12 | | | Trustees | | | | | 16 | | | Officers | | | | | 18 | | | Schedule of Shareholder Expenses | | | | | 20 | |
HIGHLIGHTS | • | | The Fed continued to hike short-term interest rates |
| • | | Despite rate increases, the yield curve remained relatively flat |
| • | | Bond prices declined throughout the six months |
| • | | Market volatility expected until interest rate picture is clearer |
Effective May 1, 2006, the existing shares of the Portfolio were designated as Class 1 shares. The performance, expenses and other information shown in this report for the Portfolio is information applicable to the Class 1 shares. Investments in the Portfolio are not bank deposits or obligations of, or guaranteed or endorsed by, any bank and are not insured or guaranteed by the FDIC, the Federal Reserve Board or any other government agency. You could lose money if you sell when the Portfolio’s share price is lower than when you invested. Past performance is no guarantee for future performance. The general market views expressed in this report are opinions based on current market conditions and are subject to change without notice. These views are not intended to predict the future performance of the Portfolio or the securities markets. References to specific securities and their issuers are for illustrative purposes only and are not intended to be, and should not be interpreted as, recommendations to purchase or sell such securities. Such views are not meant as investment advice and may not be relied on as an indication of trading intent on behalf of any Portfolio. This Portfolio is intended to be a funding vehicle for variable annuity contracts and variable life insurance policies (collectively “Policies”) offered by separate accounts of participating insurance companies. Portfolio shares are also offered to qualified pension and retirement plans (“Eligible Plans”). Individuals may not purchase shares directly from the Portfolio. Prospective investors should refer to the Portfolio’s prospectus for a discussion of the Portfolio’s investment objective, strategies and risks. Call JPMorgan Funds Service Center at 1-800-480-4111 for a prospectus containing more complete information about the Portfolio including management fees and other expenses. Please read it carefully before investing.
PRESIDENT’S LETTER
JULY 14, 2006 (Unaudited)
Dear Shareholder: We are pleased to present this semi-annual report for the JPMorgan Insurance Trust Government Bond Portfolio for the six months ended June 30, 2006. Inside, you’ll find information detailing the performance of the Portfolio, along with a report from the Portfolio Manager. | |
“A flight to quality unfolded throughout the period, as investors shifted away from the riskier sectors of the fixed income market and into Treasuries.”
|
Economy’s strength sparks inflation concerns, rate hikes After the gross domestic product (GDP) slowed to 1.7% in the fourth quarter of 2005, the economy regained steam early in 2006, when the U.S. GDP rate surged 5.6% in the first quarter. Given the continued strength in the U.S. economy and growing inflationary pressures, the Federal Reserve (Fed) continued to hike short-term interest rates, implementing four 25 basis points (bps) increases in the federal funds rate during the first half of 2006. By June 30, the fed funds rate was 5.25%, up 425 bps from June 2004, when the Fed embarked on its tightening campaign. Rates along the yield curve followed suit, with yields on the two-, 10- and 30-year Treasuries advancing by 75, 76 and 64 bps, respectively. Despite the period’s rate increases, the yield curve remained relatively flat. As of June 30, the difference in yield between the two- and 30-year Treasuries was only 3.6 bps, compared to 13.5 bps on December 31, 2005. Quality regains favor Given the rising-rate environment, bond prices declined throughout the six months. Fixed income investors grappled not only with the effects of rising interest rates, but also with the uncertainty surrounding Fed policy in the wake of continued economic growth, rising commodity prices and increasing concerns about rising inflation. A flight to quality unfolded throughout the period, as investors shifted away from the riskier sectors of the fixed income market and into Treasuries. For example, high-yield bonds were the market’s top performers in the first quarter of 2006 and the worst performers in the second quarter. Economic data show no clear-cut signs Some economic reports released late in the period pointed to a slight moderation in the pace of U.S. economic activity, but the overall data remained mixed. In particular, consumer confidence declined throughout the period, payroll growth softened and the housing and mortgage markets decelerated. On the other hand, data from the manufacturing sector remained healthy, with regional and national surveys holding at respectable levels. In addition, after falling to 4.6% in May, the unemployment rate remained unchanged in June, continuing a new cycle-low for the series. Inflation, as measured by the core consumer price index (CPI), inched upward in each of the first five months of 2006, ending May at a year-over-year rate of 2.4%. Fed keeps markets guessing Trying to anticipate the final rate hike by the Fed has become the markets’ favorite pastime over the last several months. This fixation has contributed to increased volatility in the financial markets. While the economy may finally be starting to slow, the evidence is not yet conclusive. Late in the period, job gains averaged a mere 108,000 per month. This is on par with the average of approximately 100,000 that historically has signaled a mid-cycle soft patch that reduced inflationary pressures and eventually gave way to an easing of monetary policy. So far, though, consumer spending generally has remained solid, and capital goods orders continue to rise. With core inflation rising, it will be difficult for the Fed to stop tightening until there is evidence of a broader economic slowdown than currently is apparent. In the meantime, we expect quality to remain in favor and bond yields to remain in a range, awaiting the next signal from the Fed. On behalf of us all at JPMorgan Asset Management, thank you for your confidence and the continued trust you have placed in us. We look forward to serving your investment needs for many years to come. Should you have any questions, please feel free to contact the JPMorgan Funds Service Center at 1-800-480-4111. George C.W. Gatch
President
JPMorgan Funds JUNE 30, 2006 JPMORGAN INSURANCE TRUST 1
JPMorgan Insurance Trust Government Bond Portfolio
PORTFOLIO COMMENTARY
AS OF JUNE 30, 2006 (Unaudited)
PORTFOLIO FACTS
| Portfolio Inception | | | | August 1, 1994 | | Fiscal Year End | | | | December 31 | | Net Asset as of 06/30/06 | | | | $179,774,880 | | Primary Benchmark | | | | Lehman Brothers Government Bond Index | | Average Credit Quality | | | | AAA | | Duration | | | | 5.44 Years |
Q: | | HOW DID THE PORTFOLIO PERFORM? |
A: | | The JPMorgan Insurance Trust Government Bond Portfolio, which seeks a high level of current income with liquidity and safety of principal, returned -1.24% for the six month period ended June 30, 2006.* This is compared to a return of -0.89% for its benchmark, the Lehman Brothers Government Bond Index. |
Q: | | WHY DID THE PORTFOLIO PERFORM THIS WAY? |
A: | | During the six-month period, interest rates continued to climb higher across the yield curve, forcing bond prices downward. U.S. economic growth remained surprisingly strong and inflationary pressures began to build. This prompted the Federal Reserve (Fed) to maintain its rate-tightening campaign, implementing four 25-basis point (bps) increases in the fed funds rate, from 4.25% at the start of the period to 5.25% at the end.
The Fed’s actions led to further yield increases at the short end of the curve. The two-year Treasury was up 75 bps to yield 5.16%, the 10-year Treasury rose 76 bps to yield 5.15% and the 30-year Treasury advanced 64 bps to yield 5.19% by the end of the period. The magnitude of the rate increases for short-term securities caused the yield curve to continue to flatten, with the difference in yield between the two-year and the 30-year Treasuries narrowing from 13.5 bps on December 31, 2005, to 3.6 bps on June 30. |
Q: | | HOW WAS THE PORTFOLIO MANAGED? |
A: | | We continued to focus on security selection as our primary strategy, looking for attractively valued securities that fit our “buy and hold” strategy. Our specific security selections in all sectors of the government bond market contributed positively to the Portfolio’s six-month return, but those results were not enough to offset the negative impact of a longer-duration posture.
The Portfolio’s duration (sensitivity to interest rate changes) typically falls within our target range of five to 5.25 years, yet ended the period with a slightly longer duration of 5.44 years. This was a strategic decision based on the potential for a more stable rate environment. In addition, the rising-rate environment reduced the pace of mortgage prepayments, which naturally extended overall duration in the mortgage market.
We continued to overweight mortgages in general and well-structured collateralized mortgage obligations (CMOs) in particular. We also underweighted agency securities and Treasury notes and overweighted Treasury strips. Overall, the underweight to U.S. Treasury securities was a negative. |
| Collateralized Mortgage Obligations | | | | | 44.7 | % | | U.S. Treasury Obligations | | | | | 26.4 | | | Mortgage Pass-Through Securities | | | | | 12.6 | | | U.S. Government Agency Securities | | | | | 11.2 | | | Short-Term Investments | | | | | 4.5 | | | Investments of Cash Collateral for Securities Loaned | | | | | 20.6 | |
| * | | The advisor seeks to achieve the Portfolio’s objective. There can be no guarantee it will be achieved. |
| ** | | Portfolio composition percentages are based on net assets as of June 30, 2006. The Portfolio’s composition is subject to change. |
2 JPMORGAN INSURANCE TRUST JUNE 30, 2006
AVERAGE ANNUAL TOTAL RETURNS AS OF JUNE 30, 2006
| | | | INCEPTION DATE
| | 1 YEAR
| | 5 YEAR
| | 10 YEAR
|
|---|
GOVERNMENT BOND PORTFOLIO | | | | | 8/1/1994 | | | | (1.67 | )% | | | 4.99 | % | | | 5.98 | % |
TEN-YEAR PERFORMANCE (6/30/96 TO 6/30/06)
The performance quoted is past performance and is not a guarantee of future results. Mutual funds are subject to certain market risk. Investment returns and principal value of an investment will fluctuate so that an investor’s shares, when redeemed, may be worth more or less than their original cost. Current performance may be higher or lower than the performance data shown. For up-to-date month-end performance information please call 1-800-480-4111. The graph illustrates comparative performance for $10,000 invested in the JPMorgan Insurance Trust Government Bond Portfolio, the Lehman Brothers Government Bond Index and the Lipper General U.S. Government Fund Index. The performance of the Portfolio assumes reinvestment of all dividends and does not include a sales charge. The performance of the indices does not include fees and expenses attributable to the Portfolio and has been adjusted to reflect reinvestment of all dividends and capital gains of the securities included in the benchmark. The Lehman Brothers Government Bond Index represents the performance of securities issued by the U.S. Government. The Lipper General U.S. Government Fund Index represents the total returns of the funds in the indicated category, as defined by Lipper Inc. Investors cannot invest directly in an index. The performance does not reflect any charges imposed by the Policies or Eligible Plans. If these charges were included, the returns would be lower than shown. Performance may also reflect the waiver and reimbursement of the Portfolio’s fees/expenses for certain periods since the inception date. Without these waivers and reimbursements, performance would have been lower. JUNE 30, 2006 JPMORGAN INSURANCE TRUST 3
JPMorgan Insurance Trust Government Bond Portfolio
SCHEDULE OF PORTFOLIO INVESTMENTS
AS OF JUNE 30, 2006 (Unaudited)
PRINCIPAL
AMOUNT($)
|
|
|
| SECURITY DESCRIPTION
|
| VALUE($)
|
|---|
Long-Term Investments — 94.9% | Collateralized Mortgage Obligations — 44.7% | | | | | | Federal Home Loan Mortgage Corp., | | | | | | 246,093 | | | | Series 1343, Class LA, 8.00%, 08/15/22 | | | 247,016 | | | 74,229 | | | | Series 1561, Class TA, PO, 08/15/08 | | | 70,410 | | | 399,959 | | | | Series 1577, Class PV, 6.50%, 09/15/23 | | | 404,249 | | | 1,234,385 | | | | Series 1584, Class L, 6.50%, 09/15/23 | | | 1,253,290 | | | 56,767 | | | | Series 1604, Class MB, IF, 7.99%, 11/15/08 | | | 57,484 | | | 84,479 | | | | Series 1625, Class SC, IF, 8.20%, 12/15/08 | | | 85,243 | | | 867,959 | | | | Series 1633, Class Z, 6.50%, 12/15/23 | | | 880,845 | | | 201,000 | | | | Series 1694, Class PK, 6.50%, 03/15/24 | | | 205,761 | | | 111,788 | | | | Series 1985, Class PL, 6.50%, 10/17/26 (m) | | | 111,937 | | | 527,606 | | | | Series 1999, Class PU, 7.00%, 10/15/27 | | | 539,980 | | | 960,871 | | | | Series 2031, Class PG, 7.00%, 02/15/28 (m) | | | 984,661 | | | 798,173 | | | | Series 2035, Class PC, 6.95%, 03/15/28 | | | 810,375 | | | 750,000 | | | | Series 2095, Class PE, 6.00%, 11/15/28 | | | 747,817 | | | 153,578 | | | | Series 2132, Class PD, 6.00%, 11/15/27 | | | 153,660 | | | 2,643 | | | | Series 2165, Class PD, 6.00%, 02/15/28 | | | 2,643 | | | 19,461 | | | | Series 2170, Class PE, 6.00%, 08/15/13 | | | 19,425 | | | 290,872 | | | | Series 2178, Class PB, 7.00%, 08/15/29 | | | 296,283 | | | 327,382 | | | | Series 2259, Class ZC, 7.35%, 10/15/30 | | | 341,246 | | | 814,982 | | | | Series 2345, Class PQ, 6.50%, 08/15/16 | | | 829,024 | | | 556,049 | | | | Series 2366, Class VG, 6.00%, 06/15/11 | | | 556,475 | | | 1,000,000 | | | | Series 2367, Class ME, 6.50%, 10/15/31 | | | 1,022,976 | | | 103,402 | | | | Series 2390, Class DO, PO, 12/15/31 | | | 80,771 | | | 883,000 | | | | Series 2527, Class BP, 5.00%, 11/15/17 | | | 844,814 | | | 5,000,000 | | | | Series 2543, Class YX, 6.00%, 12/15/32 (m) | | | 4,882,159 | | | 3,230,000 | | | | Series 2578, Class PG, 5.00%, 02/15/18 | | | 3,054,817 | | | 2,000,000 | | | | Series 2626, Class KA, 3.00%, 03/15/30 | | | 1,810,485 | | | 650,000 | | | | Series 2631, Class TE, 4.50%, 02/15/28 | | | 613,440 | | | 783,752 | | | | Series 2647, Class A, 3.25%, 04/15/32 | | | 698,927 | | | 2,849,932 | | | | Series 2651, Class VZ, 4.50%, 07/15/18 | | | 2,585,172 | | | 2,438,000 | | | | Series 2656, Class BG, 5.00%, 10/15/32 | | | 2,299,780 | | | 410,000 | | | | Series 2682, Class LC, 4.50%, 07/15/32 | | | 375,752 | | | 2,500,000 | | | | Series 2684, Class PD, 5.00%, 03/15/29 | | | 2,387,102 | | | 1,250,000 | | | | Series 2749, Class TD, 5.00%, 06/15/21 | | | 1,202,817 | | | 650,000 | | | | Series 2773, Class TB, 4.00%, 04/15/19 | | | 559,237 | | | 625,000 | | | | Series 2827, Class DG, 4.50%, 07/15/19 | | | 562,721 | | | 1,200,000 | | | | Series 2827, Class TC, 5.00%, 10/15/28 | | | 1,169,668 | | | 917,653 | | | | Series 2927, Class GA, 5.50%, 10/15/34 | | | 906,454 | | | 1,250,000 | | | | Series 2929, Class PC, 5.00%, 01/15/28 | | | 1,214,817 | | | 946,850 | | | | Series 3085, Class VS, IF, 7.92%, 12/15/35 | | | 943,118 | | | | | | | Federal Home Loan Mortgage Corp. Structured Pass-Through Securities, | | | | | | 902,369 | | | | Series T-54, Class 2A, 6.50%, 02/25/43 | | | 908,749 | | | 549,152 | | | | Series T-56, Class A, PO, 05/25/43 | | | 449,863 | | | | | | | Federal National Mortgage Association, | | | | | | 34,552 | | | | Series 1988-16, Class B, 9.50%, 06/25/18 | | | 37,280 | | | 154,331 | | | | Series 1993-146, Class E, PO, 05/25/23 | | | 121,694 | | | 245,000 | | | | Series 1993-155, Class PJ, 7.00%, 09/25/23 | | | 254,117 | | | 68,388 | | | | Series 1993-197, Class SC, IF, 8.30%, 10/25/08 | | | 69,747 | | | 24,644 | | | | Series 1993-205, Class H, PO, 09/25/23 | | | 19,409 | | | 192,964 | | | | Series 1993-221, Class SG, IF, 3.62%, 12/25/08 | | | 187,060 | | | 1,798,879 | | | | Series 1993-223, Class PZ, 6.50%, 12/25/23 | | | 1,845,563 | | | 791,872 | | | | Series 1993-250, Class Z, 7.00%, 12/25/23 | | | 809,084 | | | 186,799 | | | | Series 1994-12, Class C, 6.25%, 01/25/09 | | | 186,449 | | | 21,053 | | | | Series 1994-13, Class SM, IF, 11.99%, 02/25/09 | | | 22,145 | | | 448,855 | | | | Series 1994-28, Class K, 6.50%, 08/25/23 | | | 449,987 | | | 1,203,542 | | | | Series 1994-37, Class L, 6.50%, 03/25/24 | | | 1,213,896 | | | 6,388,638 | | | | Series 1994-72, Class K, 6.00%, 04/25/24 | | | 6,348,935 | | | 31,250 | | | | Series 1994-76, Class H, 5.00%, 02/25/24 | | | 30,977 | | | 231,497 | | | | Series 1998-46, Class GZ, 6.50%, 08/18/28 | | | 234,805 | | | 574,973 | | | | Series 1998-58, Class PC, 6.50%, 10/25/28 | | | 583,909 | | | 1,153,648 | | | | Series 1999-39, Class JH, IO, 6.50%, 08/25/29 | | | 273,948 | | | 1,766,034 | | | | Series 2001-33, Class ID, IO, 6.00%, 07/25/31 | | | 421,562 | | | 542,438 | | | | Series 2001-4, Class PC, 7.00%, 03/25/21 | | | 557,831 | | | 2,000,000 | | | | Series 2002-18, Class PC, 5.50%, 04/25/17 | | | 1,984,625 | | | 519,131 | | | | Series 2002-2, Class UC, 6.00%, 02/25/17 | | | 517,578 | | | 2,901,667 | | | | Series 2003-128, Class DY, 4.50%, 01/25/24 | | | 2,548,679 | | | 2,000,000 | | | | Series 2003-35, Class MD, 5.00%, 11/25/16 | | | 1,954,083 | | | 1,250,000 | | | | Series 2003-70, Class BE, 3.50%, 12/25/25 | | | 1,175,784 | | | 3,600,000 | | | | Series 2003-81, Class MC, 5.00%, 12/25/32 | | | 3,391,389 | | | 600,000 | | | | Series 2003-82, Class VB, 5.50%, 08/25/33 | | | 574,584 | | | 1,850,000 | | | | Series 2004-2, Class OE, 5.00%, 05/25/23 | | | 1,740,315 | | | 1,473,048 | | | | Series 2004-75, Class VK, 4.50%, 09/25/22 | | | 1,354,736 | | | 96,123 | | | | Series G92-44, Class ZQ, 8.00%, 07/25/22 | | | 100,782 | | | 40,573 | | | | Series G92-66, Class KA, 6.00%, 12/25/22 | | | 40,084 | | | | | | | Federal National Mortgage Association Whole Loan, | | | | | | 914,624 | | | | Series 1999-W4, Class A9, 6.25%, 02/25/29 | | | 908,056 | | | 1,620,663 | | | | Series 2002-W7, Class A4, 6.00%, 06/25/29 | | | 1,612,302 | | | 877,513 | | | | Series 2003-W1, Class 1A1, 6.50%, 12/25/42 | | | 883,638 | | | 792,812 | | | | Series 2005-W1, Class 1A2, 6.50%, 10/25/44 | | | 796,170 | | | | | | | Government National Mortgage Association, | | | | | | 435,106 | | | | Series 1998-22, Class PD, 6.50%, 09/20/28 | �� | | 441,461 | | | 139,395 | | | | Series 1999-17, Class L, 6.00%, 05/20/29 | | | 139,067 | | | 2,500,000 | | | | Series 2001-10, Class PE, 6.50%, 03/16/31 (m) | | | 2,546,815 | | | 729,162 | | | | Series 2001-6, Class PM, 6.50%, 06/16/30 | | | 732,426 | | | 1,000,000 | | | | Series 2001-64, Class PB, 6.50%, 12/20/31 | | | 1,018,997 | |
SEE NOTES TO FINANCIAL STATEMENTS.
4 JPMORGAN INSURANCE TRUST JUNE 30, 2006
PRINCIPAL
AMOUNT($)
|
|
|
| SECURITY DESCRIPTION
|
| VALUE($)
|
|---|
Long-Term Investments — Continued | | | | | | Collateralized Mortgage Obligations — Continued | | 7,119,567 | | | | Series 2003-59, Class XA, IO, VAR, 0.60%, 06/16/34 | | | 605,411 | | | 2,759,774 | | | | Series 2003-75, Class BE, 6.00%, 04/16/28 | | | 2,765,508 | | | 1,740,716 | | | | Series 2004-62, Class VA, 5.50%, 07/20/15 | | | 1,720,485 | | | | | | | Total Collateralized Mortgage Obligations (Cost $82,628,407) | | | 80,392,836 | | | | | | | Mortgage Pass-Through Securities — 12.6% | | | | | | Federal Home Loan Mortgage Corp. Gold Pools, | | | | | | 458,541 | | | | 5.00%, 12/01/13–04/01/14 | | | 442,072 | | | 161,084 | | | | 5.50%, 03/01/14 | | | 158,269 | | | 335,276 | | | | 6.00%, 04/01/14–02/01/32 | | | 332,200 | | | 2,047,449 | | | | 6.50%, 06/01/14–04/01/32 | | | 2,067,927 | | | 42,948 | | | | 7.00%, 02/01/11 | | | 43,669 | | | 117,106 | | | | 7.50%, 09/01/10 | | | 118,801 | | | 27,156 | | | | 8.50%, 12/01/09–07/01/28 | | | 28,906 | | | | | | | Federal Home Loan Mortgage Corp. Conventional Pools, | | | | | | 286,730 | | | | ARM, 6.04%, 01/01/27 | | | 291,977 | | | 95,400 | | | | ARM, 6.23%, 04/01/30 | | | 97,109 | | | 47,439 | | | | 9.00%, 12/01/09 | | | 47,564 | | | | | | | Federal National Mortgage Association Various Pools, | | | | | | 4,337,928 | | | | 5.00%, 11/01/13–11/01/33 | | | 4,113,342 | | | 7,690,694 | | | | 5.50%, 11/01/16–01/01/34 | | | 7,437,292 | | | 2,319,257 | | | | 6.00%, 04/01/13–09/01/28 | | | 2,308,445 | | | 669,384 | | | | 6.50%, 11/01/11–04/01/32 | | | 678,237 | | | 205,082 | | | | 7.50%, 02/01/13–08/01/30 | | | 211,225 | | | 539,255 | | | | 8.00%, 11/01/12–01/01/16 | | | 558,343 | | | | | | | Government National Mortgage Association Various Pools, | | | | | | 3,298,227 | | | | ARM, 4.50%, 07/20/34–09/20/34 | | | 3,230,224 | | | 16,698 | | | | ARM, 4.75%, 07/20/27 | | | 16,742 | | | 33,171 | | | | 6.50%, 03/15/28–09/15/28 | | | 33,684 | | | 87,677 | | | | 7.00%, 12/15/25–06/15/28 | | | 90,492 | | | 48,089 | | | | 7.50%, 05/15/23–12/20/26 | | | 50,222 | | | 83,011 | | | | 7.75%, 07/15/30 | | | 87,485 | | | 257,255 | | | | 8.00%, 11/20/26–10/15/27 | | | 272,245 | | | 20,576 | | | | 9.00%, 11/15/24 | | | 22,133 | | | | | | | Total Mortgage Pass-Through Securities (Cost $23,438,313) | | | 22,738,605 | | | | | | | U.S. Government Agency Securities — 11.2% | | 1,500,000 | | | | Federal Farm Credit Bank, 6.75%, 07/07/09 | | | 1,554,310 | | | 1,000,000 | | �� | | Federal Home Loan Bank System, 5.90%, 03/26/09 (c) | | | 1,006,011 | | | | | | | Federal National Mortgage Association, | | | | | | 6,000,000 | | | | PO, 09/23/20 | | | 2,675,496 | | | 3,000,000 | | | | Zero Coupon, 10/09/19 | | | 1,367,391 | | | | | | | Financing Corp. Fico, | | | | | | 630,000 | | | | Zero Coupon, 03/23/28 | | | 187,073 | | | 8,000,000 | | | | PO, 12/06/18 | | | 4,031,496 | | | 2,000,000 | | | | PO, 11/02/18 | | | 1,013,586 | | | | | | | Resolution Funding Corp., | | | | | | 1,000,000 | | | | PO, 10/15/17 | | | 545,544 | | | 2,000,000 | | | | PO, 01/15/20 | | | 957,174 | | | 4,000,000 | | | | Residual Funding Corp., PO, 07/15/20 | | | 1,865,480 | | | | | | | Tennessee Valley Authority, | | | | | | 5,000,000 | | | | PO, 07/15/16 | | | 2,848,615 | | | 2,000,000 | | | | 6.00%, 03/15/13 | | | 2,051,790 | | | | | | | Total U.S. Government Agency Securities (Cost $18,938,190) | | | 20,103,966 | | | | | | | U.S. Treasury Obligations — 26.4% | | | | | | U.S. Treasury Bonds, | | | | | | 650,000 | | | | 6.13%, 11/15/27 (c) | | | 718,199 | | | 2,700,000 | | | | 7.25%, 05/15/16 (c) | | | 3,126,306 | | | 1,250,000 | | | | 8.13%, 08/15/19 (c) | | | 1,582,520 | | | 2,000,000 | | | | 9.13%, 05/15/18 (c) | | | 2,678,282 | | | 2,800,000 | | | | 10.38%, 11/15/12 | | | 2,988,345 | | | | | | | U.S. Treasury Inflation Indexed Bonds, | | | | | | 578,827 | | | | 3.50%, 01/15/11 | | | 605,439 | | | 6,235,750 | | | | 3.63%, 01/15/08 | | | 6,342,930 | | | | | | | U.S. Treasury Notes, | | | | | | 2,250,000 | | | | 4.25%, 08/15/13 (c) | | | 2,134,688 | | | 2,500,000 | | | | 5.00%, 08/15/11 (c) | | | 2,492,480 | | | 200,000 | | | | 6.00%, 08/15/09 (c) | | | 204,992 | | | 7,000,000 | | | | 6.13%, 08/15/07 (c) | | | 7,063,161 | | | | | | | U.S. Treasury Bonds Coupon STRIPS | | | | | | 2,500,000 | | | | 08/15/14 (c) | | | 1,648,090 | | | 2,000,000 | | | | 11/15/2014 | | | 1,300,598 | | | 1,750,000 | | | | 2/15/2015 | | | 1,123,484 | | | 500,000 | | | | 05/15/15 (c) | | | 316,895 | | | 750,000 | | | | 08/15/15 (c) | | | 469,269 | | | 3,000,000 | | | | 11/15/15 (c) | | | 1,848,027 | | | 400,000 | | | | 05/15/16 (c) | | | 239,650 | |
SEE NOTES TO FINANCIAL STATEMENTS.
JUNE 30, 2006 JPMORGAN INSURANCE TRUST 5
JPMorgan Insurance Trust Government Bond Portfolio
SCHEDULE OF PORTFOLIO INVESTMENTS
AS OF JUNE 30, 2006 (Unaudited) (continued)
PRINCIPAL
AMOUNT($)
|
|
|
| SECURITY DESCRIPTION
|
| VALUE($)
|
|---|
Long-Term Investments — Continued | | | | | | U.S. Treasury Obligations — Continued | | | | | | U.S. Treasury Bonds Principal STRIPS | | | | | | 4,000,000 | | | | 11/15/09 (c) | | | 3,373,416 | | | 15,000,000 | | | | 05/15/20 (c) | | | 7,193,880 | | | | | | | Total U.S. Treasury Obligations (Cost $47,424,034) | | | 47,450,651 | | | | | | | Total Long-Term Investments (Cost $172,428,944) | | | 170,686,058 | |
SHARES
|
|
|
| SECURITY DESCRIPTION
|
| VALUE ($)
|
|---|
Short-Term Investments — 4.5% | | | | | | Investment Company — 4.5% | | 8,111,976 | | | | JPMorgan U.S. Government Money Market Fund (b) (Cost $8,111,976) | | | 8,111,976 | |
PRINCIPAL
AMOUNT($)
|
|
|
| SECURITY DESCRIPTION
|
| VALUE ($)
|
|---|
Investment of Cash Collateral for Securities Loaned — 20.6% | | | | | | Repurchase Agreement — 20.6% | | 7,488,865 | | | | Bank of America Securities LLC, 5.32%, dated 06/30/06, due 07/03/06, repurchase price $7,492,187,
collateralized by U.S. Government Agency Mortgages. | | | 7,488,865 | | | 7,000,000 | | | | Bear Stearns Cos., Inc., 5.31%, dated 06/30/06, due 07/03/06, repurchase price $7,003,099,
collateralized by U.S. Government Agency Mortgages. | | | 7,000,000 | | | 7,500,000 | | | | Lehman Brothers, Inc., 5.32%, dated 06/30/06, due 07/03/06, repurchase price $7,503,325,
collateralized by U.S. Government Agency Mortgages. | | | 7,500,000 | | | 7,500,000 | | | | Morgan Stanley & Co., Inc., 5.33%, dated 06/30/06, due 07/03/06, repurchase price $7,503,333,
collateralized by U.S. Government Agency Mortgages. | | | 7,500,000 | | | 7,500,000 | | | | UBS Securities LLC, 5.32%, dated 06/30/06, due 07/03/06, repurchase price $7,503,325,
collateralized by U.S. Government Agency Mortgages. | | | 7,500,000 | | | | | | | Total Investment of Cash Collateral for Securities Loaned (Cost $36,988,865) | | | 36,988,865 | | | | | | | Total Investments — 120.0% (Cost $217,529,785) | | | 215,786,899 | | | | | | | Liabilities in Excess of Other Assets — (20.0)% | | | (36,012,019 | ) | | | | | | NET ASSETS — 100.0% | | $ | 179,774,880 | |
Percentages indicated are based on net assets. | (b) | — | Investment in affiliate. Money market fund registered under the Investment Company Act of 1940, as amended, and advised by JPMorgan Investment Advisors Inc. |
| (c) | — | Security, or a portion of the security, has been delivered to a counterparty as part of a security lending transaction. |
| (m) | — | All or a portion of this security is segregated for current or potential holdings of futures, swaps, options, TBAs, when-issued securities, delayed delivery securities, and reverse repurchase agreements. |
| ARM | — | Adjustable Rate Mortgage. |
| IF | — | Inverse Floaters represent securities that pay interest at a rate that increases (decreases) with a decline (incline) in a specified index. |
| IO | — | Interest Only represents the right to receive the monthly interest payment on an underlying pool of mortgage loans. The face amount shown represents the par value on the generally higher than prevailing market underlying pool. The yields on these securities are yields on other mortgage-backed securities because their cash flow patterns are more volatile and there is a greater risk that the initial investment will not be fully recouped. These securities are subject to accelerated principal paydowns as a result of prepayment or refinancing of the underlying pool of mortgage instruments. As a result, interest income may be reduced considerably. |
| PO | — | Principal Only represents the right to receive the principal portion only on an underlying pool of mortgage loans. The market value of these securities is extremely volatile in response to changes in market interest rates. As prepayments on the underlying mortgages of these securities increase, the yield on these securities increases. |
| STRIPS | — | Separate Trading of Registered Interest and Principal Securities. |
| VAR | — | Variable. The interest rate shown is the rate in effect at June 30, 2006. |
SEE NOTES TO FINANCIAL STATEMENTS.
6 JPMORGAN INSURANCE TRUST JUNE 30, 2006
STATEMENT OF ASSETS AND LIABILITIES
AS OF JUNE 30, 2006 (Unaudited)
|
|
|
| Government Bond
Portfolio
|
|---|
ASSETS: | | | | | | | | Investments in non-affiliates, at value | | | | $ | 170,686,058 | | | Investments in affiliates, at value | | | | | 8,111,976 | | | Repurchase agreements, at value | | | | | 36,988,865 | | | Total investment securities, at value | | | | | 215,786,899 | | | Receivables: | | | | | | | | Investment securities sold | | | | | 4,727 | | | Portfolio shares sold | | | | | 17,132 | | | Interest and dividends | | | | | 1,124,747 | | | Prepaid expenses and other assets | | | | | 7,607 | | | Total Assets | | | | | 216,941,112 | | | | LIABILITIES: | | | | | | | | Payables: | | | | | | | | Collateral for securities lending program | | | | | 36,988,865 | | | Portfolio shares redeemed | | | | | 78,057 | | | Accrued liabilities: | | | | | | | | Investment advisory fees | | | | | 58,955 | | | Administration fees | | | | | 15,158 | | | Custodian and accounting fees | | | | | 812 | | | Trustees’ and Officers’ fees | | | | | 79 | | | Other | | | | | 24,306 | | | Total Liabilities | | | | | 37,166,232 | | | Net Assets | | | | $ | 179,774,880 | | | | NET ASSETS: | | | | | | | | Paid in capital | | | | $ | 177,302,958 | | | Accumulated undistributed (distributions in excess of) net investment income | | | | | 4,488,456 | | | Accumulated net realized gains (losses) | | | | | (273,648 | ) | | Net unrealized appreciation (depreciation) | | | | | (1,742,886 | ) | | Total Net Assets | | | | $ | 179,774,880 | | | | | Outstanding units of beneficial interest (shares) (unlimited amount authorized, no par value) | | | | | 16,820,248 | | | Net asset value, offering and redemption price per share | | | | $ | 10.69 | | | | | Cost of investments | | | | $ | 217,529,785 | | | Market value of securities on loan | | | | $ | 36,371,158 | |
SEE NOTES TO FINANCIAL STATEMENTS.
JUNE 30, 2006 JPMORGAN INSURANCE TRUST 7
STATEMENT OF OPERATIONS
FOR THE SIX MONTHS Ended JUNE 30, 2006 (Unaudited)
|
|
|
| Government Bond
Portfolio
|
|---|
INVESTMENT INCOME: | | | | | | | | Interest income | | | | $ | 4,978,857 | | | Dividend income from affiliates (a) | | | | | 120,485 | | | Income from securities lending (net) | | | | | 19,933 | | | Total investment income | | | | | 5,119,275 | | | | EXPENSES: | | | | | | | | Investment advisory fees | | | | | 404,466 | | | Administration fees | | | | | 122,477 | | | Custodian and accounting fees | | | | | 954 | | | Professional fees | | | | | 30,995 | | | Trustees’ and Officers’ fees | | | | | 1,386 | | | Transfer agent fees | | | | | 2,611 | | | Printing and mailing costs | | | | | 40,183 | | | Other | | | | | 10,198 | | | Total expenses | | | | | 613,270 | | | Less amounts waived | | | | | (1,844 | ) | | Less earnings credits | | | | | (21 | ) | | Net expenses | | | | | 611,405 | | | Net investment income (Loss) | | | | | 4,507,870 | | | | REALIZED/UNREALIZED GAINS (LOSSES): | | | | | | | | Net realized gain (loss) on transactions from investments | | | | | (143,028 | ) | | Change in net unrealized appreciation (depreciation) of investments | | | | | (6,689,571 | ) | | Net realized/unrealized gains (losses) | | | | | (6,832,599 | ) | | Change in net assets resulting from operations | | | | $ | (2,324,729 | ) |
| (a) | | Includes reimbursements of investment advisory and administration fees. Please see Fees and Other Transactions with Affiliates in the Notes to Financial Statements. |
SEE NOTES TO FINANCIAL STATEMENTS.
8 JPMORGAN INSURANCE TRUST JUNE 30, 2006
STATEMENT OF CHANGES IN NET ASSETS
FOR THE PERIODS INDICATED
| | | | Government Bond Portfolio
| |
|---|
|
|
|
| Six Months Ended
June 30, 2006
(Unaudited)
|
| Year Ended
December 31, 2005
|
|---|
CHANGE IN NET ASSETS RESULTING FROM OPERATIONS: | | | | | | | | | | | | Net investment income (loss) | | | | $ | 4,507,870 | | | $ | 9,591,180 | | | Net realized gain (loss) | | | | | (143,028 | ) | | | 211,918 | | | Change in net unrealized appreciation (depreciation) | | | | | (6,689,571 | ) | | | (3,691,230 | ) | | Change in net assets resulting from operations | | | | | (2,324,729 | ) | | | 6,111,868 | | | | DISTRIBUTIONS TO SHAREHOLDERS: | | | | | | | | | | | | From net investment income | | | | | (9,635,666 | ) | | | (9,946,227 | ) | | | CHANGE IN NET ASSETS FROM CAPITAL TRANSACTIONS: | | | | | | | | | | | | Proceeds from shares issued | | | | | 5,402,111 | | | | 14,789,507 | | | Dividends reinvested | | | | | 9,635,666 | | | | 9,946,227 | | | Cost of shares redeemed | | | | | (19,116,433 | ) | | | (38,413,574 | ) | | Change in net assets from capital transactions | | | | | (4,078,656 | ) | | | (13,677,840 | ) | | | NET ASSETS: | | | | | | | | | | | | Change in net assets | | | | | (16,039,051 | ) | | | (17,512,199 | ) | | Beginning of period | | | | | 195,813,931 | | | | 213,326,130 | | | End of period | | | | $ | 179,774,880 | | | $ | 195,813,931 | | | Accumulated undistributed (distributions in excess of) net investment income | | | | $ | 4,488,456 | | | $ | 9,616,252 | | | | SHARE TRANSACTIONS: | | | | | | | | | | | | Issued | | | | | 492,282 | | | | 1,296,364 | | | Reinvested | | | | | 900,529 | | | | 899,297 | | | Redeemed | | | | | (1,742,532 | ) | | | (3,367,833 | ) | | Change in shares | | | | | (349,721 | ) | | | (1,172,172 | ) |
SEE NOTES TO FINANCIAL STATEMENTS.
JUNE 30, 2006 JPMORGAN INSURANCE TRUST 9
FINANCIAL HIGHLIGHTS
FOR THE PERIODS INDICATED
| | | |
|
| Per share operating performance
|
|
|---|
| | | |
| | Investment operations
|
| Distributions
|
|
|---|
|
|
|
| Net asset
value,
beginning
of period
|
| Net
investment
income
(loss)
|
| Net realized
and unrealized
gains
(losses) on
investments
|
| Total from
investment
operations
|
| Net
investment
income
|
| Net asset
value
end
of period
| Government Bond Portfolio | | | | | | | | | | | | | | | | | | | | | | | | | | | | Six Months Ended June 30, 2006 (Unaudited) | | | | $ | 11.40 | | | $ | 0.29 | | | $ | (0.42 | ) | | $ | (0.13 | ) | | $ | (0.58 | ) | | $ | 10.69 | | | Year Ended December 31, 2005 | | | | | 11.63 | | | | 0.58 | | | | (0.25 | ) | | | 0.33 | | | | (0.56 | ) | | | 11.40 | | | Year Ended December 31, 2004 | | | | | 11.67 | | | | 0.54 | | | | (0.01 | ) | | | 0.53 | | | | (0.57 | ) | | | 11.63 | | | Year Ended December 31, 2003 | | | | | 11.92 | | | | 0.56 | | | | (0.26 | ) | | | 0.30 | | | | (0.55 | ) | | | 11.67 | | | Year Ended December 31, 2002 | | | | | 10.62 | | | | 0.55 | | | | 0.75 | | | | 1.30 | | | | — | (d) | | | 11.92 | | | Year Ended December 31, 2001 | | | | | 10.50 | | | | 0.61 | | | | 0.12 | | | | 0.73 | | | | (0.61 | ) | | | 10.62 | |
| (a) | | Annualized for periods less than one year. |
| (b) | | Not annualized for periods less than one year. |
| (c) | | Includes adjustments in accordance with accounting principles generally accepted in the United States of America and as such, the net asset value for
financial reporting purposes and the returns based upon those net asset values may differ from the net asset value and returns for shareholder transactions. |
| (d) | | Amount rounds to less than $0.01. |
SEE NOTES TO FINANCIAL STATEMENTS.
10 JPMORGAN INSURANCE TRUST JUNE 30, 2006
|
|
|
| Ratios/Supplemental data
|
|
|---|
| | | |
| | Ratios to average net assets (a)
| |
|---|
Total
return (b)(c)
|
|
|
| Net assets
end of
period
(000’s)
|
| Net
expenses
|
| Net
investment
income
(loss)
|
| Expenses
without waivers,
reimbursements
and earnings credits
|
| Portfolio
turnover
rate (b)
| | (1.15 | )% | | | $ | 179,775 | | | | 0.66 | % | | | 4.84 | % | | | 0.66 | % | | | 1 | % | | 3.08 | | | | | 195,814 | | | | 0.65 | | | | 4.70 | | | | 0.65 | | | | 10 | | | 4.64 | | | | | 213,326 | | | | 0.62 | | | | 4.65 | | | | 0.63 | | | | 14 | | | 2.54 | | | | | 211,642 | | | | 0.62 | | | | 4.76 | | | | 0.63 | | | | 23 | | | 12.26 | | | | | 208,305 | | | | 0.63 | | | | 5.33 | | | | 0.63 | | | | 16 | | | 7.05 | | | | | 151,391 | | | | 0.62 | | | | 5.93 | | | | 0.62 | | | | 25 | |
SEE NOTES TO FINANCIAL STATEMENTS.
JUNE 30, 2006 JPMORGAN INSURANCE TRUST 11
NOTES TO FINANCIAL STATEMENTS
AS OF JUNE 30, 2006 (Unaudited)
1. Organization JPMorgan Insurance Trust (formerly JPMorgan Investment Trust) (the “Trust”) is registered under the Investment Company Act of 1940, as amended (the “1940 Act”), as an open-end investment company established as a Massachusetts business trust. The JP Morgan Insurance Trust Government Bond Portfolio is a separate Portfolio of the Trust (the “Portfolio”). Effective May 1, 2006, the Board of Trustees approved the name change from JPMorgan Investment Trust Government Bond Portfolio to JPMorgan Insurance Trust Government Bond Portfolio and designated the existing shares as Class 1 shares. Portfolio shares are offered only to separate accounts of participating insurance companies and eligible plans. Individuals may not purchase shares directly from the Portfolio. 2. Significant Accounting Policies The following is a summary of significant accounting policies followed by the Trust in preparation of its financial statements. The policies are in accordance with accounting principles generally accepted in the United States of America. The preparation of financial statements requires management to make estimates and assumptions that affect the reported amounts of assets and liabilities at the date of the financial statements and the reported amounts of income and expenses for the period. Actual results could differ from those estimates. A. Valuation of Investments — Corporate debt securities, debt securities issued by the U.S. Treasury or a U.S. government agency (other than short-term investments maturing in 61 days or less), and municipal securities are valued each day based on readily available market quotations received from third party broker-dealers of comparable securities or independent or affiliated pricing services approved by the Board of Trustees. Such pricing services and broker-dealers generally provide bid-side quotations. Generally, short-term investments (other than certain high yield securities) maturing in 61 days or less are valued at amortized cost, which approximates market value. Futures, options and other derivatives are valued on the basis of available market quotations. Investments in other open-end investment companies are valued at such investment company’s current day closing net asset value per share. Securities or other assets for which market quotations are not readily available or for which market quotations do not represent the value at the time of pricing (including certain illiquid securities) are fair valued in accordance with procedures established by and under the supervision and responsibility of the Trustees. Valuations may be based upon current market prices of securities that are comparable in coupon, rating, maturity and industry. It is possible that the estimated values may differ significantly from the values that would have been used had a ready market for the investments existed, and such differences could have been material. B. Repurchase Agreements — The Portfolio may enter into repurchase agreement transactions with institutions that meet the advisor’s credit guidelines. Each repurchase agreement is valued at amortized cost. The Portfolio requires that the collateral received in a repurchase agreement transaction be transferred to a custodian in a manner sufficient to enable the Portfolio to obtain collateral in the event of a counterparty default. If the counterparty defaults and the fair value of the collateral declines, realization of the collateral by the Portfolio may be delayed or limited. C. Securities Lending — To generate additional income, the Portfolio may lend up to 33-1/3% of its assets pursuant to agreements (“borrower agreements”) requiring that the loan be continuously secured by cash or securities issued by the U.S. government or its agencies or its instrumentalities (“U.S. government securities”). JPMorgan Chase Bank, N.A. (“JPMCB”), an affiliate of the Portfolio, serves as lending agent pursuant to a Securities Lending Agreement approved by the Board of Trustees (the “Securities Lending Agreement”). Under the Securities Lending Agreement, JPMCB acting as agent for the Portfolio, loans securities to approved borrowers pursuant to approved borrower agreements in exchange for collateral equal to at least 100% of the market value of the loaned securities plus accrued interest. During the term of the loan, the Portfolio receives payments from borrowers equivalent to the dividends and interest that would have been earned on securities lent while simultaneously seeking to earn income on the investment of cash collateral in accordance with investment guidelines contained in the Securities Lending Agreement. For loans secured by cash, the Portfolio retains the interest on cash collateral investments but is required to pay the borrower a portion of such interest for the use of the cash collateral. For loans secured by U.S. government securities, the borrower pays a borrower fee to the lending agent on behalf of the Portfolio. The net income earned on the securities lending (after payment of rebates and the lending agent’s fee) is included in the Statement of Operations as Income from securities lending (net). Information on the investment of cash collateral is shown in the Schedule of Portfolio Investments. Under the Securities Lending Agreement, JPMCB is entitled to a fee equal to (i) 0.06% calculated on an annualized basis and accrued daily, based upon the value of collateral received from borrowers for each loan of U.S. Securities outstanding during a given month; and (ii) 0.1142% calculated on an annualized basis and accrued daily, based upon the value of collateral received from borrowers for each loan of non-U.S. Securities outstanding during a given month. For the period ended June 30, 2006, JPMCB voluntarily reduced its fees to: (i) 0.05% for each loan of U.S. Securities and (ii) 0.10% for each loan of non-U.S. Securities, respectively. Risks of delay in recovery of securities or even loss of rights in the securities may occur should the borrower of the securities fail financially. Risks may also arise to the extent that the value of the securities loaned increases above the value of the collateral received. JPMCB will 12 JPMORGAN INSURANCE TRUST JUNE 30, 2006
indemnify the Portfolio from losses resulting from a borrower’s failure to return a loaned security when due. Such indemnification does not extend to losses associated with declines in the value of cash collateral investments. Loans are subject to termination by the Portfolio or the borrower at any time, and are, therefore, not considered to be illiquid investments.
As of June 30, 2006, the Portfolio had securities with the following market values on loan, received the following collateral and for the period then ended, paid the following amounts to related party affiliates:
|
|
|
| Lending
Agent
Fees Paid
|
| Market
Value of
Collateral
|
| Market Value
of Loaned
Securities
|
|---|
| | | | | $ | 7,329 | | | $ | 36,988,865 | | | $ | 36,371,158 | |
D. Security Transactions and Investment Income — Investment transactions are accounted for on the trade date (the date the order to buy or sell is executed). Securities gains and losses are calculated on a specifically identified cost basis. Interest income is determined on the basis of coupon interest accrued using the effective interest method adjusted for amortization of premiums and accretion of discounts. Dividend income less foreign taxes withheld (if any) is recorded on the ex-dividend date or when the Portfolio first learns of the dividend. Purchases of TBA, when-issued or delayed delivery securities may be settled a month or more after the trade date; interest income is not accrued until settlement date. It is the Portfolio’s policy to segregate assets with a current value at least equal to the amount of its TBA, when-issued or delayed delivery purchase commitments. E. Allocation of Expenses — Expenses directly attributable to the Portfolio are charged directly to the Portfolio while the expenses attributable to more than one portfolio of the Trust are allocated among the respective portfolios. F. Federal Income Taxes — The Portfolio is treated as a separate taxable entity for Federal income tax purposes. The Portfolio’s policy is to comply with the provisions of the Internal Revenue Code of 1986, as amended (the “Code”) applicable to regulated investment companies and to distribute to shareholders all of its distributable net investment income and net realized gain on investments. Accordingly, no provision for Federal income tax is necessary. The Portfolio is also a segregated Portfolio of assets for insurance purposes and intends to comply with the diversification requirements of Subchapter L of the Code. G. Distributions to Shareholders — Dividends from net investment income and distributions of net realized capital gains are declared and paid at least annually. The amount of dividends and distributions from net investment income and net realized capital gains is determined in accordance with Federal income tax regulations, which may differ from accounting principles generally accepted in the United States of America. To the extent these “book/tax” differences are permanent in nature (i.e., that they result from other than timing of recognition — “temporary differences”), such amounts are reclassified within the capital accounts based on their Federal tax-basis treatment. H. New Accounting Pronouncement — In July 2006, the Financial Accounting Standards Board issued Interpretation No. 48, “Accounting for Uncertainty in Income Taxes — an Interpretation of FASB Statement No. 109” (the “Interpretation”). The Interpretation establishes for all entities, including pass-through entities such as the Portfolio, a minimum threshold for financial statement recognition of the benefit of positions taken in filing tax returns (including whether an entity is taxable in a particular jurisdiction), and requires certain expanded tax disclosures. The Interpretation is effective for fiscal years beginning after December 15, 2006, and is to be applied to all open tax years as of the date of effectiveness. Management has recently begun to evaluate the application of the Interpretation to the Portfolio, and is not in a position at this time to estimate the significance of its impact, if any, on the Portfolio’s financial statements. 3. Fees and Other Transactions with Affiliates A. Investment Advisory Fee — Pursuant to the Investment Advisory Agreement, JPMorgan Investment Advisors Inc. (the “Advisor”) acts as the investment advisor to the Portfolio. The Advisor is an indirect wholly-owned subsidiary of JPMorgan Chase & Co. (“JPMorgan”). The Advisor supervises the investments of the Portfolio and for such services is paid a fee. The fee is accrued daily and paid monthly based on the Portfolio’s average daily net assets at an annual fee rate of 0.40%. Prior to May 1, 2006, the investment advisory fee for the Portfolio was 0.45%. The Advisor waived and/or reimbursed Investment Advisory fees as outlined in Note 3.E. The Portfolio may invest in one or more money market funds advised by the Advisor or its affiliates. Advisory, administrative and shareholder servicing fees are waived and/or reimbursed from the Portfolio in an amount sufficient to offset any doubling up of these fees related to the Portfolio’s investment in an affiliated money market fund to the extent required by law. The amount of these waivers/reimbursements from the money market funds for the six months ended June 30, 2006 was $4,745. B. Administration Fee — Pursuant to an Administration Agreement, JPMorgan Funds Management, Inc. (the “Administrator”), an indirect, wholly-owned subsidiary of JPMorgan, provides certain administration services to the Portfolio. In consideration of these services, the Administrator receives a fee computed daily and paid monthly at the annual rate of 0.15% of the first $25 billion of the average daily net assets of all funds in the JPMorgan Fund Complex (excluding funds of funds and money market funds) and 0.075% of the average daily net assets in excess of $25 billion of all such funds. JUNE 30, 2006 JPMORGAN INSURANCE TRUST 13
NOTES TO FINANCIAL STATEMENTS
AS OF JUNE 30, 2006 (Unaudited) (continued)
The Administrator waived and/or reimbursed Administration fees as outlined in Note 3.E. Prior to May 1, 2006, the Administrator provided services for a fee computed daily and paid monthly at the annual rate of 0.18% of the first $250 million of the average daily net assets of the Trust (excluding the Equity Index Portfolio) and 0.14% of the average daily net assets of the Trust in excess of $250 million (excluding the Equity Index Portfolio). J.P. Morgan Investor Services, Co. (“JPMIS”), an indirect, wholly owned subsidiary of JPMorgan, serves as the Portfolio’s Sub-administrator (the “Sub-administrator”). For its services as Sub-administrator, JPMIS receives a portion of the fees payable to the Administrator. Prior to May 1, 2006, JPMIS also received a portion of the fees payable to the Administrator as compensation for fund accounting services. C. Distribution Fees — Pursuant to a Distribution Agreement, JPMorgan Distribution Services, Inc. (the “Distributor”), a wholly-owned subsidiary of JPMorgan, serves as the Trust’s exclusive underwriter and promotes and arranges for the sale of the Portfolio’s shares. The Distributor receives no compensation in its capacity as the Portfolio’s underwriter. D. Custodian and Accounting Fees — JPMCB provides portfolio custody and accounting services for the Portfolio. The amounts paid directly to JPMCB by the Portfolio for custody and accounting services are included in custodian and accounting fees in the Statement of Operations. (Effective May 1, 2006, the Portfolio began paying the fees for accounting services directly to JPMCB.) The custodian fees may be reduced by credits earned by the Portfolio, based on uninvested cash balances held by the custodian. Such earnings credits are presented separately in the Statement of Operations. Interest expense, if any, paid to the custodian related to cash overdrafts is presented as interest expense in the Statement of Operations. E. Waivers and Reimbursements — The Advisor and Administrator have contractually agreed to waive fees or reimburse the Portfolio to the extent that total operating expenses (excluding interest, taxes, extraordinary expenses and expenses related to the Board of Trustees’ deferred compensation plan) exceed 0.60% (0.75% prior to May 1, 2006) of the Portfolio’s average daily net assets. The contractual expense limitation agreements were in effect for the six months ended June 30, 2006. The new expense limitation percentage above is in place until at least April 30, 2007. For the six months ended June 30, 2006, the Portfolio’s Advisor contractually waived fees for the Portfolio in the amount of $1,844. The Advisor does not expect the Portfolio to repay any such waived fees in future years. F. Other — Certain officers of the Trust are affiliated with the Advisor, the Administrator, the Sub-Administrator and the Distributor. Such officers, with the exception of the Chief Compliance Officer, receive no compensation from the Portfolio for serving in their respective roles. The Board of Trustees appointed a Chief Compliance Officer to the Portfolio in accordance with federal securities regulations. The Portfolio, along with other affiliated portfolios, make reimbursement payments, on a pro-rata basis, to the Administrator for a portion of the fees associated with the Office of the Chief Compliance Officer. Such fees are included in Trustees’ and Officers’ Fees in the Statement of Operations. The Trust adopted a Trustee Deferred Compensation Plan (the “Plan”) which allows the independent Trustees to defer the receipt of all or a portion of compensation related to performance of their duties as a Trustee. The deferred fees are invested in various JPMorgan Funds until distribution in accordance with the Plan. During the period, the Portfolio may have purchased securities from an underwriting syndicate in which the principal underwriter or members of the syndicate are affiliated with the Advisor. The Portfolio may use related party brokers/dealers. For the six months ended June 30, 2006, the Portfolio did not incur any brokerage commission with brokers/dealers affiliated with the Advisor. The SEC has granted an exemptive order permitting the Portfolio to engage in principal transactions with J.P. Morgan Securities, Inc., an affiliated broker, involving taxable money market instruments subject to certain conditions. 4. Investment Transactions During the six months ended June 30, 2006, purchases and sales of investments (excluding short-term investments) were as follows:
|
|
|
| Purchases
(excluding U.S.
Government)
|
| Sales
(excluding U.S.
Government)
|
| Purchases
of U.S.
Government
|
| Sales
of U.S.
Government
|
|---|
| | | | | $ | 1,253,634 | | | $ | 15,097,217 | | | $ | 411,231 | | | $ | 1,202,141 | |
14 JPMORGAN INSURANCE TRUST JUNE 30, 2006
5. Federal Income Tax Matters For Federal income tax purposes, the cost and unrealized appreciation (depreciation) in value of the investment securities at June 30, 2006, were as follows:
|
|
|
| Aggregate
Cost
|
| Gross
Unrealized
Appreciation
|
| Gross
Unrealized
Depreciation
|
| Net Unrealized
Appreciation
(Depreciation)
|
|---|
| | | | | $ | 217,529,785 | | | $ | 2,841,124 | | | $ | (4,584,010 | ) | | $ | (1,742,886 | ) |
6. Borrowings The Trust and JPMCB have entered into a financing arrangement. Under this arrangement, JPMCB provides an unsecured, uncommitted credit facility in the aggregate amount of $100 million to certain of the JPMorgan Funds including the Portfolio. Advances under the arrangement are taken primarily for temporary or emergency purposes, including the meeting of redemption requests that otherwise might require the untimely disposition of securities, and are subject to the Portfolio’s borrowing restrictions. Interest on borrowings is payable at a rate determined by JPMCB at the time of borrowing. This agreement has been extended until November 21, 2006. The Portfolio had no borrowings outstanding at June 30, 2006, or at any time during the six months ended. 7. Concentrations and Indemnifications In the normal course of business the Portfolio enters into contracts that contain a variety of representations which provide general indemnifications. The Portfolio’s maximum exposure under these arrangements is unknown, as this would involve future claims that may be made against the Portfolio that have not yet occurred. However, based on experience, the Portfolio expects the risk of loss to be remote. The ability of the issuers of debt, asset-backed and mortgage-backed securities, along with counterparties to swap and option agreements, to meet their obligations may be affected by the economic and political developments in a specific industry or region. The value of asset-backed and mortgage-backed securities can be significantly affected by changes in interest rates or rapid principal payments including prepayments. From time to time, the Portfolio may have a concentration of several shareholders holding a significant percentage of shares outstanding. Investment activities of these shareholders could have a material impact on the Portfolio. JUNE 30, 2006 JPMORGAN INSURANCE TRUST 15
TRUSTEES
(Unaudited)
The Portfolio’s Statement of Additional Information includes additional information about the Portfolio’s Trustees and is available, without charge, upon request by calling 1-800-480-4111 or on the Portfolio’s website at www.jpmorganfunds.com. Name (Year of Birth);
Positions With
the Portfolio
|
|
|
| Principal Occupations
During Past 5 Years
|
| Number of
Portfolios/Funds
in JPMorgan
Funds Complex (1)
Overseen by Trustee
|
| Other Directorships Held
Outside Fund Complex
| Independent Trustees | | William J. Armstrong (1941); Trustee of Trust since 2005; Trustee of heritage JPMorgan Funds since 1987. | | | | Retired; CFO and Consultant, EduNeering, Inc. (internet business education supplier) (2000–2001); Vice President and Treasurer, Ingersoll–Rand Company (manufacturer of industrial equipment) (1972–2000). | | 120 | | None. | | | | Roland R. Eppley, Jr. (1932); Trustee of Trust since 2005; Trustee of heritage JPMorgan Funds since 1989. | | | | Retired; President and Chief Executive Officer, Eastern States Bankcard (1971–1988). | | 120 | | None. | | | | John F. Finn (1947); Trustee of Trust since 2005; Trustee of heritage One Group Mutual Funds since 1998. | | | | President and Chief Executive Officer, Gardner, Inc. (wholesale distributor to outdoor power equipment industry) (1979–present). | | 120 | | Director, Cardinal Health, Inc (CAH) (1994–present); Chairman, The Columbus Association for the Performing Arts (CAPA) (2003–present). | | | | Dr. Matthew Goldstein (1941); Trustee of Trust since 2005; Trustee of heritage JPMorgan Funds since 2003. | | | | Chancellor of the City University of New York (1999–present); President, Adelphi University (New York) (1998–1999). | | 120 | | Director, Albert Einstein School of Medicine (1998–present); Director, New Plan Excel Realty Trust, Inc. (real estate investment trust)
(2000–present); Director, Lincoln Center Institute for the Arts in Education (1999–present). | | | | Robert J. Higgins (1945); Trustee of Trust since 2005; Trustee of heritage JPMorgan Funds since 2002. | | | | Retired; Director of Administration of the State of Rhode Island (2003–2004); President — Consumer Banking and Investment Services, Fleet Boston Financial (1971–2001). | | 120 | | None. | | | | Peter C. Marshall (1942); Trustee of Trust since 2005; Trustee of heritage One Group Mutual Funds since 1994. | | | | Self-employed business consultant (2002–present); Senior Vice President, W.D. Hoard, Inc. (corporate parent of DCI Marketing, Inc.) (2000–2002); President, DCI Marketing, Inc. (1992–2000). | | 120 | | None. | | | | Marilyn McCoy (1948); Trustee of Trust since 2005; Trustee of heritage One Group Mutual Funds since 1999. | | | | Vice President of Administration and Planning, Northwestern University (1985–present). | | 120 | | Trustee, Mather LifeWays (1994–present); Trustee, Carleton College (2003–present). | | | | William G. Morton, Jr. (1937); Trustee of Trust since 2005; Trustee of heritage JPMorgan Funds since 2003. | | | | Retired; Chairman Emeritus (2001–2002), and Chairman and Chief Executive Officer, Boston Stock Exchange (1985–2001). | | 120 | | Director, Radio Shack Corporation (electronics) (1987–present); Director, The National Football Foundation and College Hall of Fame (1994–present); Trustee, Stratton Mountain School (2001–present). |
16 JPMORGAN INSURANCE TRUST JUNE 30, 2006
Name (Year of Birth);
Positions With
the Portfolio
|
|
|
| Principal Occupations
During Past 5 Years
|
| Number of
Portfolios/Funds
in JPMorgan
Funds Complex (1)
Overseen by Trustee
|
| Other Directorships Held
Outside Fund Complex
|
|---|
Independent Trustees | | Robert A. Oden, Jr. (1946); Trustee of Trust since 2005; Trustee of heritage One Group Mutual Funds since 1997. | | | | President, Carleton College (2002–present); President, Kenyon College (1995–2002). | | 120 | | Director, American University in Cairo. | | | | Fergus Reid, III (1932); Trustee of Trust (Chairman) since 2005; Trustee (Chairman) of heritage JPMorgan Funds since 1987. | | | | Chairman, Lumelite Corporation (plastics manufacturing) (2003–present); Chairman and Chief Executive Officer, Lumelite Corporation (1985–2002). | | 120 | | Trustee, Morgan Stanley Funds (198 portfolios) (1995–present). | | | | Frederick W. Ruebeck (1939); Trustee of Trust since 2005; Trustee of heritage One Group Mutual Funds since 1994. | | | | Advisor, Jerome P. Green & Associates, LLC (broker-dealer) (2000–present); Chief Investment Officer, Wabash College (2004–present); self-employed consultant (2000–present); Director of Investments, Eli Lilly and Company (1988–1999). | | 120 | | Trustee, Wabash College (1988–present); Chairman, Indianapolis Symphony Orchestra Foundation (1994–present). | | | | James J. Schonbachler (1943); Trustee of Trust since 2005; Trustee of heritage JPMorgan Funds since 2001. | | | | Retired; Managing Director of Bankers Trust Company (financial services) (1968–1998). | | 120 | | None. | | | Interested Trustee | | Leonard M. Spalding, Jr.* (1935); Trustee of Trust since 2005; Trustee of heritage JPMorgan Funds since 1998. | | | | Retired; Chief Executive Officer of Chase Mutual Funds (investment company) (1989–1998); President & Chief Executive Officer, Vista Capital Management (investment management) (1990–1998); Chief Investment Executive, Chase Manhattan Private Bank (investment management) (1990–1998). | | 120 | | Director, Glenview Trust Company, LLC (2001–present); Trustee, St. Catherine College (1998–present); Trustee, Bellarmine University (2000–present); Director, Springfield-Washington County Economic Development Authority (1997–present); Trustee, Marion and Washington County, Kentucky Airport Board (1998–present); Trustee, Catholic Education Foundation (2005–present). |
| (1) | | A Fund Complex means two or more registered investment companies that hold themselves out to investors as related companies for purposes of investment and investor services or have a common investment adviser or have an investment adviser that is an affiliated person of the investment adviser of any of the other registered investment companies. The JPMorgan Funds Complex which the Board of Trustees currently oversees includes eight registered investment companies (120 portfolios/funds). |
| * | | Mr. Spalding is deemed to be an “interested person” due to his ownership of JPMorgan Chase stock. |
The contact address for each of the Trustees is 245 Park Avenue, New York, NY 10167. JUNE 30, 2006 JPMORGAN INSURANCE TRUST 17
OFFICERS
(Unaudited)
Name (Year of Birth),
Positions Held with
the Trust
|
|
|
| Principal Occupations During Past 5 Years
|
|---|
| | George C.W. Gatch (1962),
President since 2005 | | | | Managing Director, JPMorgan Investment Management Inc.; Director and President, JPMorgan Distribution Services, Inc. and JPMorgan Funds Management, Inc. since 2005. Mr. Gatch is CEO and President of JPMorgan Funds. Mr. Gatch has been an employee since 1986 and has held positions such as President and CEO of DKB Morgan, a Japanese mutual fund company which was a joint venture between J.P. Morgan and Dai-Ichi Kangyo Bank, as well as positions in business management, marketing and sales. | | | Robert L. Young (1963),
Senior Vice President since 2005* | | | | Director and Vice President, JPMorgan Distribution Services, Inc. and JPMorgan Funds Management, Inc.; Chief Operating Officer, JPMorgan Funds since 2005, and One Group Mutual Funds from 2001 until 2005. Mr. Young was Vice President and Treasurer, JPMorgan Funds Management, Inc. (formerly One Group Administrative Services) and Vice President and Treasurer, JPMorgan Distribution Services, Inc. (formerly One Group Dealer Services, Inc.) from 1999 to 2005. | | | Patricia A. Maleski (1960),
Vice President and Chief
Administrative Officer since 2005 | | | | Managing Director, JPMorgan Funds Management, Inc.; previously, Treasurer, JPMorgan Funds and Head of Funds Administration and Board Liaison. Ms. Maleski was Vice President of Finance for the Pierpont Group, Inc. from 1996–2001, an independent company owned by the Board of Directors/Trustees of the JPMorgan Funds, prior to joining J.P. Morgan Chase & Co. in 2001. | | | Stephanie J. Dorsey (1969),
Treasurer since 2005* | | | | Vice President, JPMorgan Funds Management, Inc.; Director of Mutual Fund Administration, JPMorgan Funds Management, Inc. (formerly One Group Administrative Services), from 2004 to 2005; Ms. Dorsey worked for JPMorgan Chase & Co., (formerly Bank One Corporation) from 2003 to 2004; prior to joining Bank One Corporation, she was a Senior Manager specializing in Financial Services audits at PricewaterhouseCoopers LLP from 1992 through 2002. | | | Stephen M. Ungerman (1953),
Senior Vice President and Chief
Compliance Officer since 2005
| | | | Senior Vice President, JPMorgan Chase & Co.; Mr. Ungerman was head of Fund Administration — Pooled Vehicles from 2000 to 2004. Mr. Ungerman held a number of positions in Prudential Financial’s asset management business prior to 2000. | | | Paul L. Gulinello (1950), AML
Compliance Officer since 2005 | | | | Vice President and Anti Money Laundering Compliance Officer for JPMorgan Asset Management Americas, additionally responsible for personal trading and compliance testing since 2004; Treasury Services Operating Risk Management and Compliance Executive supporting all JPMorgan Treasury Services business units from July 2000 to 2004. | | | Stephen M. Benham (1959),
Secretary since 2005 | | | | Vice President and Assistant General Counsel, JPMorgan Chase & Co. since 2004; Vice President (Legal Advisory) of Merrill Lynch Investment Managers, L.P. from 2000 to 2004; attorney associated with Kirkpatrick & Lockhart LLP from 1997 to 2000. | | | Elizabeth A. Davin (1964),
Assistant Secretary since 2005* | | | | Vice President and Assistant General Counsel, JPMorgan Chase & Co. since 2005; Senior Counsel, JPMorgan Chase & Co. (formerly Bank One Corporation) from 2004 to 2005; Assistant General Counsel and Associate General Counsel and Vice President, Gartmore Global Investments, Inc. from 1999 to 2004. | | | Jessica K. Ditullio (1962),
Assistant Secretary since 2005* | | | | Vice President and Assistant General Counsel, JPMorgan Chase & Co. since 2005; Ms. Ditullio has served as an attorney with various titles for JPMorgan Chase & Co. (formerly Bank One Corporation) since 1990. | | | Nancy E. Fields (1949),
Assistant Secretary since 2005* | | | | Vice President, JPMorgan Funds Management, Inc. and JPMorgan Distribution Services, Inc.; From 1999 to 2005, Director, Mutual Fund Administration, JPMorgan Funds Management, Inc. (formerly One Group Administrative Services, Inc.) and Senior Project Manager, Mutual Funds, JPMorgan Distribution Services, Inc. (formerly One Group Dealer Services, Inc.). | | | Michael C. Raczynski (1975),
Assistant Secretary (2006) | | | | Vice President and Assistant General Counsel, JPMorgan Chase & Co. since 2006; Associate, Stroock & Stroock & Lavan LLP from 2001 to 2006. | | | Ellen W. O’Brien (1957),
Assistant Secretary since 2005** | | | | Assistant Vice President, JPMorgan Investor Services, Co., responsible for Blue Sky registration. Ms. O’Brien has served in this capacity since joining the firm in 1991. |
18 JPMORGAN INSURANCE TRUST JUNE 30, 2006
Name (Year of Birth),
Positions Held with
the Trust
|
|
|
| Principal Occupations During Past 5 Years
|
|---|
Suzanne E. Cioffi (1967),
Assistant Treasurer since 2005 | | | | Vice President, JPMorgan Funds Management, Inc., responsible for mutual fund financial reporting. Ms. Cioffi has overseen various fund accounting, custody and administration conversion projects during the past five years. | | | Arthur A. Jensen (1966),
Assistant Treasurer since 2005* | | | | Vice President, JPMorgan Funds Management, Inc. since April 2005; formerly, Vice President of Financial Services of BISYS Fund Services, Inc. from 2001 until 2005; Mr. Jensen was Section Manager at Northern Trust Company and Accounting Supervisor at Allstate Insurance Company prior to 2001. |
The contact address for each of the officers, unless otherwise noted, is 245 Park Avenue, New York, NY 10167. | * | | The contact address for the officer is 1111 Polaris Parkway, Columbus, OH 43271. |
| ** | | The contact address for the officer is 73 Tremont Street, Floor 1, Boston MA 02108. |
JUNE 30, 2006 JPMORGAN INSURANCE TRUST 19
SCHEDULE OF SHAREHOLDER EXPENSES
(Unaudited)
Hypothetical $1,000 Investment at Beginning of Period
June 30, 2006
As a shareholder of the Portfolio, you incur ongoing costs, including investment advisory fees, administration fees and other Portfolio expenses. Because the Portfolio is a funding vehicle for Policies and Eligible Plans, you may also incur sales charges and other fees relating to the Policies or Eligible Plans. The examples below are intended to help you understand your ongoing costs (in dollars) of investing in the Portfolio, but not the costs of the Policies or Eligible Plans, and to compare these ongoing costs with the ongoing costs of investing in other mutual funds. The examples assume that you had a $1,000 investment in the Portfolio at the beginning of the reporting period, January 1, 2006, and continued to hold your shares at the end of the reporting period, June 30, 2006. Actual Expenses The first line provides information about actual account values and actual expenses. You may use the information in this line, together with the amount you invested, to estimate the expenses that you paid over the period. Simply divide your account value by $1,000 (for example, an $8,600 account value divided by $1,000 = 8.6), then multiply the result by the number in the first line under the heading entitled “Expenses Paid During Period” to estimate the expenses you paid on your account during this period. Hypothetical Example for Comparison Purposes The second line in the table below provides information about hypothetical account values and hypothetical expenses based on the actual expense ratio and an assumed rate of return of 5% per year before expenses, which is not the Portfolio’s actual return. The hypothetical account values and expenses may not be used to estimate the actual ending account balance or expenses you paid for the period. You may use this information to compare the ongoing costs of investing in the Portfolio and other portfolios. To do so, compare this 5% hypothetical example with the 5% hypothetical examples that appear in the shareholder reports of the other funds. Please note that the expenses shown in the table are meant to highlight your ongoing costs only and do not reflect any transaction costs, such as sales charges (loads) or redemption fees or the costs associated with the Policies and Eligible Plans through which the Portfolio is held. Therefore, the second line in the table is useful in comparing ongoing costs only, and will not help you determine the relative total costs of owning different portfolios. In addition, if these transaction costs were included, your costs would have been higher. The examples also assume all dividends and distributions have been reinvested.
|
|
|
| Beginning
Account Value,
January 1, 2006
|
| Ending
Account Value,
June 30, 2006
|
| Expenses
Paid During
January 1 to
June 30, 2006*
|
| Annualized
Expense Ratio
|
|---|
Government Bond Portfolio
| | Actual | | | | $ | 1,000.00 | | | $ | 988.50 | | | $ | 3.25 | | | | 0.66 | % | | Hypothetical | | | | | 1,000.00 | | | | 1,021.52 | | | | 3.31 | | | | 0.66 | |
| * | | Expenses are equal to the Portfolio’s annualized expense ratio, multiplied by the average account value over the period, multiplied by 181/365 (to reflect the one-half year period). |
20 JPMORGAN INSURANCE TRUST JUNE 30, 2006
JPMorgan Funds are distributed by JPMorgan Distribution Services, Inc., which is an affiliate of JPMorgan Chase & Co. Affiliates of JPMorgan Chase & Co. receive fees for providing various services to the funds. This report is submitted for the general information of the shareholders of the Portfolio. It is not authorized for distribution to prospective investors in the Portfolio unless preceded or accompanied by a prospectus. Contact JPMorgan Funds Distribution Services at 1-800-480-4111 for a portfolio prospectus. You can also visit us at www.jpmorganfunds.com. Investors should carefully consider the investment objectives and risk as well as charges and expenses of the mutual fund before investing. The prospectus contains this and other information about the mutual fund. Read the prospectus carefully before investing. The Portfolio files a complete schedule of its portfolio holdings for the first and third quarters of its fiscal year with the SEC on Form N-Q. The Portfolio’s Forms N-Q are available on the SEC’s website at http://www.sec.gov and may be reviewed and copied at the SEC’s Public Reference Room in Washington, DC. Information on the operation of the SEC’s Public Reference Room may be obtained by calling 1-800-SEC-0330. Shareholders may request the Form N-Q without charge by calling 1-800-480-4111 or by visiting the variable insurance portfolio section of the JPMorgan Funds’ website at www.jpmorganfunds.com. A description of the Portfolio’s policies and procedures with respect to the disclosure of the Portfolio’s holdings is available in the Statement of Additional Information. A copy of proxy policies and procedures are available without charge upon request by calling 1-800-480-4111 and on the SEC’s website at www.sec.gov. The Trustees have delegated the authority to vote proxies for securities owned by the Portfolio to the Advisor. A copy of the Portfolio’s voting record for the most recent 12-month period ended June 30 is available on the SEC’s website at www.sec.gov or at the Portfolio’s website at www.jpmorganfunds.com no later than August 31 of each year. The Portfolio’s proxy voting record will include, among other things, a brief description of the matter voted on for each portfolio security, and will state how each vote was cast, for example, for or against the proposal.
© JPMorgan Chase & Co., 2006 All rights reserved. June 2006. | | SAN-JPMITGBP-606 |
SEMI-ANNUAL REPORT
SIX MONTHS ENDED JUNE 30, 2006 (UNAUDITED) JPMorgan Insurance Trust JPMorgan Insurance Trust Intrepid Mid Cap Portfolio
(formerly JPMorgan Investment Trust Diversified Mid Cap Portfolio) | NOT FDIC INSURED • NO BANK GUARANTEE • MAY LOSE VALUE | | | | This material must be preceded or accompanied by a current prospectus. | | |
CONTENTS | President’s Letter | | | | | 1 | | Portfolio Commentary:
| | | | | | | | JPMorgan Insurance Trust Intrepid Mid Cap Portfolio | | | | | 2 | | | Schedule of Portfolio Investments | | | | | 4 | | | Statement of Assets and Liabilities | | | | | 8 | | | Statement of Operations | | | | | 9 | | | Statement of Changes in Net Assets | | | | | 10 | | | Financial Highlights | | | | | 12 | | | Notes to Financial Statements | | | | | 14 | | | Trustees | | | | | 18 | | | Officers | | | | | 20 | | | Schedule of Shareholder Expenses | | | | | 22 | |
HIGHLIGHTS | • | | U.S. stocks generally positive in first half of 2006 |
| • | | Investors tried to predict interest rate hikes |
| • | | Gross domestic product (GDP) moved sharply higher |
| • | | Market volatility expected until interest rate picture is clearer |
Effective May 1, 2006, the existing shares of the Portfolio were designated as Class 1 shares. The performance, expenses and other information shown in this report for the Portfolio is information applicable to the Class 1 shares. Investments in the Portfolio are not bank deposits or obligations of, or guaranteed or endorsed by, any bank and are not insured or guaranteed by the FDIC, the Federal Reserve Board or any other government agency. You could lose money if you sell when the Portfolio’s share price is lower than when you invested. Past performance is no guarantee for future performance. The general market views expressed in this report are opinions based on current market conditions and are subject to change without notice. These views are not intended to predict the future performance of the Portfolio or the securities markets. References to specific securities and their issuers are for illustrative purposes only and are not intended to be, and should not be interpreted as, recommendations to purchase or sell such securities. Such views are not meant as investment advice and may not be relied on as an indication of trading intent on behalf of any Portfolio. This Portfolio is intended to be a funding vehicle for variable annuity contracts and variable life insurance policies (collectively “Policies”) offered by separate accounts of participating insurance companies. Portfolio shares are also offered to qualified pension and retirement plans (“Eligible Plans”). Individuals may not purchase shares directly from the Portfolio. Prospective investors should refer to the Portfolio’s prospectus for a discussion of the Portfolio’s investment objective, strategies and risks. Call JPMorgan Funds Service Center at 1-800-480-4111 for a prospectus containing more complete information about the Portfolio including management fees and other expenses. Please read it carefully before investing.
PRESIDENT’S LETTER
JULY 14, 2006 (Unaudited)
Dear Shareholder: We are pleased to present this semi-annual report for the JPMorgan Insurance Trust Intrepid Mid Cap Portfolio for the six months ended June 30, 2006. Inside, you’ll find information detailing the performance of the Portfolio, along with a report from the portfolio manager. | | | |
“Despite repeated interest rate hikes and surging energy prices, the U.S. economy was surprisingly resilient.”
|
All Eyes on the Federal Reserve Board While the U.S. stock market weakened late in the reporting period, overall it produced positive returns for the first half of the calendar year. The equity market kicked off 2006 with investors encouraged by overall strong economic growth and positive corporate earnings. However, the last two months were marked by increased volatility. A great deal of the driving forces behind the market’s ups and downs resulted from the actions of the Federal Open Market Committee (FOMC). In February 2006, Ben Bernanke assumed the role of Federal Reserve (Fed) Board Chairman, replacing long-time fixture Alan Greenspan. The transition was less than smooth for investors, as they attempted to predict the FOMC’s future actions regarding interest rates. The FOMC’s statements first hinted that there may be a break from rate increases and then telegraphed additional rate hikes due to fears of rising inflation. In late June, the FOMC raised short-term rates for the 17th consecutive time, bringing the fed funds target rate to 5.25% — its highest level in more than five years. Despite repeated interest rate hikes and surging energy prices, the U.S. economy was surprisingly resilient. After gross domestic product (GDP) fell in the fourth quarter, the economy moved sharply higher in the first quarter of 2006. During this time, GDP rose 5.6%, its highest reading since the third quarter of 2003. Stocks Produce Positive Results The broad stock market, as measured by the S&P 500 Index, returned 2.71% for the six months ended June 30, 2006. After a fast start to the year, the market took a step backwards in mid-May on fears that additional rate hikes may adversely affect the economic expansion and temper corporate profits. Looking more closely at the market over the six months, small- and mid-cap stocks outperformed their large-cap counterparts, with the Russell Midcap, Russell 2000 and Russell 1000 Indexes returning 4.84%, 8.21% and 2.76%, respectively. However, as many market pundits have anticipated, large-cap stocks generated relatively better results late in the period. After a prolonged period of lagging smaller-cap stocks, many large-caps appeared attractively valued and may be better equipped to handle more moderate economic growth. Outlook Looking ahead, the markets could continue to experience periods of volatility until the FOMC’s interest rate stance is better understood. Coinciding with its latest rate hike in June, the Fed said: “The extent and timing of any additional firming...will depend on the evolution of the outlook for both inflation and economic growth, as implied by incoming information.” Investors will likely be closely monitoring the economic “tea leaves” in an attempt to ascertain the FOMC’s next move. On behalf of us all at JPMorgan Asset Management, thank you for your confidence and the continued trust you have placed in us. We look forward to serving your investment needs for many years to come. Should you have any questions, please feel free to contact the JPMorgan Funds Service Center at 1-800-480-4111. 
George C.W. Gatch
President
JPMorgan Funds JUNE 30, 2006 JPMORGAN INSURANCE TRUST 1
JPMorgan Insurance Trust Intrepid Mid Cap Portfolio
(formerly JPMorgan Investment Trust Diversified Mid Cap Portfolio)
PORTFOLIO COMMENTARY
AS OF JUNE 30, 2006 (Unaudited)
PORTFOLIO FACTS
| Portfolio Inception | | | | March 30, 1995 | | Fiscal Year End | | | | December 31 | | Net Assets as of 6/30/06 | | | | $68,270,749 | | Primary Benchmark | | | | Russell Midcap Index |
Q. | | HOW DID THE PORTFOLIO PERFORM?
| A. | | The JPMorgan Insurance Trust Intrepid Mid Cap Portfolio, which seeks long-term capital growth by investing primarily in equity securities of companies with intermediate capitalizations, returned 6.33% for the six months ended June 30, 2006.* This is compared to a return of 4.84% for its benchmark, the Russell Midcap Index. |
Q. | | WHY DID THE PORTFOLIO PERFORM THIS WAY?
| A. | | Both the momentum and value factors employed by the behavioral finance investment process, along with strong stock selection, positively impacted the Portfolio’s relative performance. The materials and energy sectors were the largest contributors to performance during the period, as our factors correctly drove stock selection. Within the materials sector, metal stocks gained on the anticipation of strong demand as futures touched new highs. These companies have benefited from elevated prices, combined with robust global demand. The energy sector’s performance was largely due to positive stock selection, coupled with a rally in crude oil prices. The increase in crude oil prices was driven by ongoing production concerns related to Iraq, Iran and Nigeria.
| | | Despite the Portfolio’s relative outperformance, stock selection in the health services and information technology sectors detracted from results. Healthcare providers have been negatively impacted by accelerating medical costs, which have led to concerns over deteriorating medical-cost ratios, or the percentage of premium revenue used to pay patient medical bills. Within information technology, poor stock selection in the software and services and technology hardware and equipment industries negatively impacted results. |
Q. | | HOW WAS THE PORTFOLIO MANAGED?
| A. | | The investment philosophy of the Intrepid Mid Cap strategy is to employ behavioral finance concepts to capitalize on persistent market inefficiencies and maximize long-term capital growth. Behavioral finance is the study of how investors are consistently irrational in making many investment decisions. As with any diversified portfolio, stocks held are exposed to potential upside and downside risks of market news and security-specific information. Grounded firmly in the behavioral finance process, the portfolio management team refrains from engaging in the practice of making qualitative assessments or purchase/sell decisions as a result of such news and information, a critical step toward eliminating overconfidence and biases in the portfolio management process. |
PORTFOLIO COMPOSITION**
| Financials | | | | | 19.9 | % | | Consumer Discretionary | | | | | 16.4 | | | Information Technology | | | | | 13.4 | | | Industrials | | | | | 12.0 | | | Health Care | | | | | 9.8 | | | Energy | | | | | 8.0 | | | Utilities | | | | | 7.2 | | | Materials | | | | | 5.6 | | | Consumer Staples | | | | | 4.7 | | | Telecommunication Services | | | | | 1.6 | | | Investments of Cash Collateral for Securities Loaned | | | | | 13.9 | | | Short-Term Investments | | | | | 1.2 | |
TOP TEN EQUITY HOLDINGS OF THE PORTFOLIO**
| 1. | | | | Kerr-McGee Corp. | | | 1.2 | % | | 2. | | | | Keycorp | | | 1.0 | | | 3. | | | | E*Trade Financial Corp. | | | 1.0 | | | 4. | | | | American Eagle Outfitters, Inc. | | | 1.0 | | | 5. | | | | J.C. Penney Co., Inc. | | | 0.9 | | | 6. | | | | PPL Corp. | | | 0.9 | | | 7. | | | | Host Hotels & Resorts, Inc. REIT | | | 0.9 | | | 8. | | | | Freeport-McMoRan Copper & Gold, Inc., Class B | | | 0.9 | | | 9. | | | | Southern Copper Corp. | | | 0.9 | | | 10. | | | | Frontier Oil Corp. | | | 0.9 | |
| * | | The advisor seeks to achieve the Portfolio’s objective. There can be no guarantee it will be achieved. |
| ** | | Percentages indicated are based upon net assets as of June 30, 2006. The portfolio’s composition is subject to change. |
2 JPMORGAN INSURANCE TRUST JUNE 30, 2006
AVERAGE ANNUAL TOTAL RETURNS AS OF JUNE 30, 2006
| | | | INCEPTION DATE
| | 1 YEAR
| | 5 YEAR
| | 10 YEAR
|
|---|
INTREPID MID CAP PORTFOLIO | | | | | 3/30/95 | | | | 16.70 | % | | | 8.21 | % | | | 11.22 | % |
TEN YEAR PERFORMANCE (6/30/96 TO 6/30/06)
Source: Lipper, Inc. The performance quoted is past performance and is not a guarantee of future results. Mutual funds are subject to certain market risk. Investment returns and principal value of an investment will fluctuate so that an investor’s shares, when redeemed, may be worth more or less than their original cost. Current performance may be higher or lower than the performance data shown. For up-to-date month-end performance information please call 1-800-480-4111. The graph illustrates comparative performance for $10,000 invested in the JPMorgan Insurance Trust Intrepid Mid Cap Portfolio and the Russell Midcap Index. The performance of the Portfolio assumes reinvestment of all dividends. The performance of the index does not include fees and expenses attributable to the Portfolio and has been adjusted to reflect reinvestment of all dividends and capital gains of the securities included in the benchmark. The Russell Midcap Index measures the performance of 800 smallest companies of the Russell 1000 Index. Investors cannot invest directly in an index. The performance does not reflect any charges imposed by the Policies or Eligible Plans. If these charges were included, the returns would be lower than shown. Performance may also reflect the waiver and reimbursement of the Portfolio’s fees/expenses for certain periods since the inception date. Without these waivers and reimbursements, performance would have been lower. JUNE 30, 2006 JPMORGAN INSURANCE TRUST 3
JPMorgan Insurance Trust Intrepid Mid Cap Portfolio
(formerly JPMorgan Investment Trust Diversified Mid Cap Portfolio)
SCHEDULE OF PORTFOLIO INVESTMENTS
AS OF JUNE 30, 2006 (Unaudited)
SHARES
|
|
|
| SECURITY DESCRIPTION
|
| VALUE($)
|
|---|
| | | | | Long-Term Investments — 98.6% | | | | | | Common Stocks — 98.6% | | | | | | Aerospace & Defense — 0.6% | | 7,900 | | | | Armor Holdings, Inc. (a) (c) | | | 433,157 | | | | | | | Airlines — 1.3% | | 15,600 | | | | Continental Airlines, Inc., Class B (a) (c) | | | 464,880 | | | 8,600 | | | | US Airways Group, Inc. (a) | | | 434,644 | | | | | | | | | | 899,524 | | | | | | | Auto Components — 0.5% | | 5,700 | | | | Autoliv, Inc. (Sweden) | | | 322,449 | | | | | | | Automobiles — 0.7% | | 9,300 | | | | Thor Industries, Inc. (c) | | | 450,585 | | | | | | | Biotechnology — 1.4% | | 11,400 | | | | Celgene Corp. (a) | | | 540,702 | | | 10,600 | | | | ImClone Systems, Inc. (a) | | | 409,584 | | | | | | | | | | 950,286 | | | | | | | Building Products — 0.7% | | 6,725 | | | | USG Corp. (a) (c) | | | 490,454 | | | | | | | Capital Markets — 2.8% | | 5,200 | | | | A.G. Edwards, Inc. (c) | | | 287,664 | | | 5,363 | | | | Affiliated Managers Group, Inc. (a) (c) | | | 465,991 | | | 29,084 | | | | E*Trade Financial Corp. (a) | | | 663,697 | | | 15,850 | | | | Raymond James Financial, Inc. | | | 479,779 | | | | | | | | | | 1,897,131 | | | | | | | Commercial Banks — 2.6% | | 18,150 | | | | Colonial BancGroup, Inc. (The) | | | 466,092 | | | 19,000 | | | | Keycorp | | | 677,920 | | | 4,900 | | | | PNC Financial Services Group, Inc. | | | 343,833 | | | 4,800 | | | | UnionBanCal Corp. | | | 310,032 | | | | | | | | | | 1,797,877 | | | | | | | Commercial Services & Supplies — 2.1% | | 6,225 | | | | Equifax, Inc. | | | 213,766 | | | 7,800 | | | | Manpower, Inc. | | | 503,880 | | | 16,400 | | | | R.R. Donnelley & Sons Co. | | | 523,980 | | | 3,800 | | | | West Corp. (a) | | | 182,058 | | | | | | | | | | 1,423,684 | | | | | | | Communications Equipment — 0.7% | | 11,590 | | | | Harris Corp. (c) | | | 481,101 | | | | | | | Computers & Peripherals — 1.2% | | 19,100 | | | | Palm, Inc. (a) (c) | | | 307,510 | | | 25,275 | | | | Western Digital Corp. (a) (c) | | | 500,698 | | | | | | | | | | 808,208 | | | | | | | Construction Materials — 0.7% | | 10,475 | | | | Eagle Materials, Inc. | | | 497,563 | | | | | | | Consumer Finance — 1.2% | | 14,825 | | | | AmeriCredit Corp. (a) | | | 413,914 | | | 9,825 | | | | CompuCredit Corp. (a) (c) | | | 377,673 | | | | | | | | | | 791,587 | | | | | | | Diversified Consumer Services — 0.6% | | 14,700 | | | | Career Education Corp. (a) | | | 439,383 | | | | | | | Diversified Telecommunication Services — 1.4% | | 15,540 | | | | AT&T, Inc. | | | 433,410 | | | 13,725 | | | | CenturyTel, Inc. | | | 509,884 | | | | | | | | | | 943,294 | | | | | | | Electric Utilities — 1.8% | | 15,025 | | | | Edison International | | | 585,975 | | | 19,725 | | | | PPL Corp. | | | 637,117 | | | | | | | | | | 1,223,092 | | | | | | | Electrical Equipment — 0.3% | | 4,400 | | | | Thomas & Betts Corp. (a) | | | 225,720 | | | | | | | Electronic Equipment & Instruments — 2.4% | | 14,450 | | | | Arrow Electronics, Inc. (a) | | | 465,290 | | | 7,100 | | | | Mettler-Toledo International, Inc.
(Switzerland) (a) | | | 430,047 | | | 8,900 | | | | Plexus Corp. (a) | | | 304,469 | | | 28,200 | | | | Vishay Intertechnology, Inc. (a) (c) | | | 443,586 | | | | | | | | | | 1,643,392 | | | | | | | Energy Equipment & Services — 2.0% | | 6,000 | | | | Maverick Tube Corp. (a) (c) | | | 379,140 | | | 14,900 | | | | Pride International, Inc. (a) | | | 465,327 | | | 12,400 | | | �� | Todco, Class A | | | 506,540 | | | | | | | | | | 1,351,007 | | | | | | | Food & Staples Retailing — 1.0% | | 9,900 | | | | Kroger Co. (The) | | | 216,414 | | | 14,000 | | | | Supervalu, Inc. | | | 429,800 | | | | | | | | | | 646,214 | | | | | | | Food Products — 1.5% | | 14,175 | | | | Archer-Daniels-Midland Co. | | | 585,144 | | | 37,600 | | | | Del Monte Foods Co. | | | 422,248 | | | | | | | | | | 1,007,392 | | | | | | | Gas Utilities — 2.4% | | 10,400 | | | | AGL Resources, Inc. | | | 396,448 | | | 5,575 | | | | Energen Corp. | | | 214,136 | | | 14,375 | | | | National Fuel Gas Co. (c) | | | 505,137 | | | 15,700 | | | | Oneok, Inc. | | | 534,428 | | | | | | | | | | 1,650,149 | |
SEE NOTES TO FINANCIAL STATEMENTS.
4 JPMORGAN INSURANCE TRUST JUNE 30, 2006
SHARES
|
|
|
| SECURITY DESCRIPTION
|
| VALUE($)
|
|---|
| | | | | Health Care Providers & Services — 5.5% | | 12,900 | | | | AmerisourceBergen Corp. | | | 540,768 | | | 9,901 | | | | Coventry Health Care, Inc. (a) | | | 543,961 | | | 3,725 | | | | Express Scripts, Inc. (a) | | | 267,232 | | | 10,500 | | | | Health Net, Inc. (a) | | | 474,285 | | | 10,975 | | | | Humana, Inc. (a) | | | 589,357 | | | 9,000 | | | | Pediatrix Medical Group, Inc. (a) | | | 407,700 | | | 10,300 | | | | Sierra Health Services, Inc. (a) | | | 463,809 | | | 8,900 | | | | WellCare Health Plans, Inc. (a) | | | 436,545 | | | | | | | | | | 3,723,657 | | | | | | | Health Care Technology — 0.7% | | 38,900 | | | | Emdeon Corp. (a) | | | 482,749 | | | | | | | Hotels, Restaurants & Leisure — 2.9% | | 12,100 | | | | Brinker International, Inc. | | | 439,230 | | | 7,750 | | | | Choice Hotels International, Inc. (c) | | | 469,650 | | | 14,100 | | | | Darden Restaurants, Inc. | | | 555,540 | | | 14,175 | | | | GTECH Holdings Corp. | | | 493,006 | | | | | | | | | | 1,957,426 | | | | | | | Household Durables — 3.3% | | 6,025 | | | | Black & Decker Corp. | | | 508,871 | | | 7,000 | | | | Jarden Corp. (a) (c) | | | 213,150 | | | 21,900 | | | | Newell Rubbermaid, Inc. | | | 565,677 | | | 9,500 | | | | Stanley Works (The) | | | 448,590 | | | 6,100 | | | | Whirlpool Corp. | | | 504,165 | | | | | | | | | | 2,240,453 | | | | | | | Household Products — 0.6% | | 7,525 | | | | Energizer Holdings, Inc. (a) | | | 440,739 | | | | | | | Independent Power Producers & Energy Traders — 1.4% | | 26,900 | | | | AES Corp. (The) (a) | | | 496,305 | | | 8,100 | | | | TXU Corp. | | | 484,299 | | | | | | | | | | 980,604 | | | | | | | Industrial Conglomerates — 0.5% | | 6,300 | | | | Walter Industries, Inc. (c) | | | 363,195 | | | | | | | Insurance — 3.6% | | 10,000 | | | | American Financial Group, Inc. | | | 429,000 | | | 10,250 | | | | Assurant, Inc. | | | 496,100 | | | 5,800 | | | | CNA Financial Corp. (a) | | | 191,168 | | | 13,950 | | | | HCC Insurance Holdings, Inc. | | | 410,688 | | | 13,000 | | | | Philadelphia Consolidated Holding Co. (a) (c) | | | 394,680 | | | 14,612 | | | | W.R. Berkley Corp. | | | 498,708 | | | | | | | | | | 2,420,344 | | | | | | | IT Services — 2.2% | | 7,500 | | | | Acxiom Corp. | | | 187,500 | | | 10,600 | | | | Computer Sciences Corp. (a) | | | 513,464 | | | 7,400 | | | | Global Payments, Inc. | | | 359,270 | | | 21,100 | | | | Sabre Holdings Corp., Class A (c) | | | 464,200 | | | | | | | | | | 1,524,434 | | | | | | | Life Sciences Tools & Services — 0.8% | | 17,800 | | | | Applera Corp. — Applied Biosystems Group | | | 575,830 | | | | | | | Machinery — 4.5% | | 18,000 | | | | AGCO Corp. (a) (c) | | | 473,760 | | | 10,800 | | | | Crane Co. | | | 449,280 | | | 4,034 | | | | Cummins, Inc. | | | 493,157 | | | 11,100 | | | | Manitowoc Co., Inc. (The) | | | 493,950 | | | 7,400 | | | | Parker-Hannifin Corp. | | | 574,240 | | | 5,625 | | | | Terex Corp. (a) | | | 555,187 | | | | | | | | | | 3,039,574 | | | | | | | Media — 2.9% | | 10,500 | | | | John Wiley & Sons, Inc., Class A | | | 348,600 | | | 6,900 | | | | McGraw-Hill Cos., Inc. (The) | | | 346,587 | | | 8,200 | | | | Meredith Corp. | | | 406,228 | | | 4,400 | | | | Omnicom Group, Inc. | | | 391,996 | | | 15,900 | | | | Warner Music Group Corp. | | | 468,732 | | | | | | | | | | 1,962,143 | | | | | | | Metals & Mining — 4.8% | | 11,200 | | | | Freeport-McMoRan Copper & Gold, Inc., Class B | | | 620,592 | | | 10,300 | | | | Nucor Corp. | | | 558,775 | | | 6,550 | | | | Phelps Dodge Corp. | | | 538,148 | | | 5,900 | | | | Reliance Steel & Aluminum Co. | | | 489,405 | | | 6,875 | | | | Southern Copper Corp. (c) | | | 612,769 | | | 7,300 | | | | Steel Dynamics, Inc. | | | 479,902 | | | | | | | | | | 3,299,591 | | | | | | | Multi-Utilities — 1.6% | | 13,950 | | | | MDU Resources Group, Inc. | | | 510,710 | | | 13,025 | | | | Sempra Energy | | | 592,377 | | | | | | | | | | 1,103,087 | | | | | | | Multiline Retail — 0.9% | | 9,500 | | | | J.C. Penney Co., Inc. | | | 641,345 | | | | | | | Oil, Gas & Consumable Fuels — 6.0% | | 18,600 | | | | Frontier Oil Corp. (c) | | | 602,640 | | | 11,700 | | | | Helix Energy Solutions Group, Inc. (a) | | | 472,212 | | | 11,600 | | | | Kerr-McGee Corp. | | | 804,460 | | | 3,750 | | | | Marathon Oil Corp. | | | 312,375 | | | 3,275 | | | | Occidental Petroleum Corp. | | | 335,851 | | | 7,875 | | | | Sunoco, Inc. | | | 545,659 | | | 7,725 | | | | Tesoro Corp. | | | 574,431 | |
SEE NOTES TO FINANCIAL STATEMENTS.
JUNE 30, 2006 JPMORGAN INSURANCE TRUST 5
JPMorgan Insurance Trust Intrepid Mid Cap Portfolio
(formerly JPMorgan Investment Trust Diversified Mid Cap Portfolio)
SCHEDULE OF PORTFOLIO INVESTMENTS
AS OF JUNE 30, 2006 (Unaudited) (continued)
SHARES
|
|
|
| SECURITY DESCRIPTION
|
| VALUE($)
|
|---|
| | | | | Oil, Gas & Consumable Fuels — Continued | | 6,586 | | | | Valero Energy Corp. | | | 438,101 | | | | | | | | | | 4,085,729 | | | | | | | Pharmaceuticals — 1.5% | | 14,825 | | | | Endo Pharmaceuticals Holdings, Inc. (a) | | | 488,929 | | | 29,550 | | | | King Pharmaceuticals, Inc. (a) | | | 502,350 | | | | | | | | | | 991,279 | | | | | | | Real Estate Investment Trusts (REITs) — 5.2% | | 9,650 | | | | AMB Property Corp. REIT | | | 487,808 | | | 8,700 | | | | Colonial Properties Trust REIT (c) | | | 429,780 | | | 11,820 | | | | General Growth Properties, Inc. REIT | | | 532,609 | | | 10,000 | | | | Hospitality Properties Trust REIT | | | 439,200 | | | 28,900 | | | | Host Hotels & Resorts, Inc. REIT | | | 632,043 | | | 4,700 | | | | iStar Financial, Inc. REIT | | | 177,425 | | | 9,000 | | | | New Century Financial Corp. REIT (c) | | | 411,750 | | | 13,500 | | | | Ventas, Inc. REIT | | | 457,380 | | | | | | | | | | 3,567,995 | | | | | | | Real Estate Management & Development — 1.7% | | 23,125 | | | | CB Richard Ellis Services, Inc., Class A (a) | | | 575,813 | | | 6,800 | | | | Jones Lang LaSalle, Inc. (c) | | | 595,340 | | | | | | | | | | 1,171,153 | | | | | | | Road & Rail — 1.2% | | 5,125 | | | | Burlington Northern Santa Fe Corp. | | | 406,156 | | | 7,785 | | | | Norfolk Southern Corp. | | | 414,318 | | | | | | | | | | 820,474 | | | | | | | Semiconductors & Semiconductor Equipment — 4.1% | | 47,400 | | | | Atmel Corp. (a) | | | 263,070 | | | 20,225 | | | | Freescale Semiconductor, Inc., Class B (a) | | | 594,615 | | | 10,925 | | | | Lam Research Corp. (a) | | | 509,324 | | | 25,900 | | | | LSI Logic Corp. (a) | | | 231,805 | | | 15,625 | | | | MEMC Electronic Materials, Inc. (a) | | | 585,937 | | | 24,200 | | | | Nvidia Corp. (a) | | | 515,218 | | | 19,900 | | | | ON Semiconductor Corp. (a) (c) | | | 117,012 | | | | | | | | | | 2,816,981 | | | | | | | Software — 2.7% | | 35,800 | | | | BEA Systems, Inc. (a) | | | 468,622 | | | 22,650 | | | | BMC Software, Inc. (a) | | | 541,335 | | | 28,425 | | | | Cadence Design Systems, Inc. (a) | | | 487,489 | | | 18,925 | | | | Sybase, Inc. (a) | | | 367,145 | | | | | | | | | | 1,864,591 | | | | | | | Specialty Retail — 4.4% | | 19,275 | | | | American Eagle Outfitters, Inc. | | | 656,121 | | | 10,300 | | | | AnnTaylor Stores Corp. (a) | | | 446,814 | | | 9,600 | | | | Guess?, Inc. (a) (c) | | | 400,800 | | | 20,700 | | | | Limited Brands, Inc. | | | 529,713 | | | 14,400 | | | | Office Depot, Inc. (a) | | | 547,200 | | | 9,200 | | | | Sherwin-Williams Co. (The) | | | 436,816 | | | | | | | | | | 3,017,464 | | | | | | | Textiles, Apparel & Luxury Goods — 0.3% | | 2,700 | | | | V.F. Corp. | | | 183,384 | | | | | | | Thrifts & Mortgage Finance — 2.8% | | 6,425 | | | | Downey Financial Corp. (c) | | | 435,936 | | | 7,600 | | | | MGIC Investment Corp. | | | 494,000 | | | 10,100 | | | | PMI Group, Inc. (The) (c) | | | 450,258 | | | 8,850 | | | | Radian Group, Inc. (c) | | | 546,753 | | | | | | | | | | 1,926,947 | | | | | | | Tobacco — 1.7% | | 11,000 | | | | Loews Corp. - Carolina Group | | | 565,070 | | | 5,000 | | | | Reynolds American, Inc. (c) | | | 576,500 | | | | | | | | | | 1,141,570 | | | | | | | Trading Companies & Distributors — 0.7% | | 7,300 | | | | WESCO International, Inc. (a) | | | 503,700 | | | | | | | Wireless Telecommunication Services — 0.2% | | 3,000 | | | | Leap Wireless International, Inc. (a) | | | 142,350 | | | | | | | Total Common Stocks (Cost $58,403,785) | | | 67,362,037 | | | | | | | Short-Term Investment — 1.2% | | | | | | Investment Company — 1.2% | | 805,141 | | | | JPMorgan Liquid Assets Money Market Fund (b) (m) (Cost $805,141) | | | 805,141 | |
PRINCIPAL
AMOUNT($)
|
|
|
|
|
|
|
|---|
| | | | | Investment of Cash Collateral for Securities Loaned — 13.9% | | | | | | Certificates of Deposit — 1.7% | | 350,000 | | | | Credit Suisse First Boston, FRN, 5.33%, 10/17/06 | | | 350,000 | | | 400,000 | | | | Deutsche Bank New York, FRN, 5.41%, 01/22/08 | | | 400,000 | | | 399,790 | | | | Societe Generale New York, FRN, 5.26%, 06/20/07 | | | 399,790 | | | | | | | | | | 1,149,790 | | | | | | | Corporate Notes — 4.0% | | 400,000 | | | | American Express Credit Corp., FRN, 5.21%, 01/15/08 | | | 400,000 | | | 500,000 | | | | Bank of America, FRN, 5.31%, 11/07/06 | | | 500,000 | | | 500,113 | | | | Beta Finance, Inc., FRN, 5.38%, 03/15/07 | | | 500,113 | |
SEE NOTES TO FINANCIAL STATEMENTS.
6 JPMORGAN INSURANCE TRUST JUNE 30, 2006
PRINCIPAL
AMOUNT($)
|
|
|
| SECURITY DESCRIPTION
|
| VALUE($)
|
|
|
|---|
| | | | | Corporate Notes — Continued | | 500,000 | | | | CDC Financial Products Inc., FRN, 5.41%, 07/31/06 | | | 500,000 | | | 300,000 | | | | Citigroup Global Markets Holding, Inc., FRN, 5.38%, 07/07/06 | | | 300,000 | | | 39,502 | | | | Citigroup Global Markets Holding, Inc., FRN, 5.41%, 12/12/06 | | | 39,502 | | | 450,040 | | | | Links Finance LLC, FRN, 5.36%, 10/06/06 | | | 450,040 | | | 59,253 | | | | MBIA Global Funding LLC, FRN, 5.42%, 01/26/07 | | | 59,253 | | | | | | | | | | 2,748,908 | | | | | | | Repurchase Agreements — 8.2% | | 1,981,564 | | | | Banc of America Securities LLC, 5.32%, dated 06/30/06, due 07/03/06, repurchase price
$1,982,443, collateralized by U.S. Government Agency Mortgages. | | | 1,981,564 | | | 1,200,000 | | | | Lehman Brothers Inc., 5.32%, dated 06/30/06, due 07/03/06, repurchase price
$1,200,532, collateralized by U.S. Government Agency Mortgages. | | | 1,200,000 | | | 1,200,000 | | | | Morgan Stanley, 5.33%, dated 06/30/06, due 07/03/06, repurchase price $1,200,533, collateralized by
U.S. Government Agency Mortgages. | | | 1,200,000 | | | 1,200,000 | | | | UBS Securities LLC, 5.32%, dated 06/30/06, due 07/03/06, repurchase price
$1,200,532, collateralized by U.S. Government Agency Mortgages. | | | 1,200,000 | | | | | | | | | | 5,581,564 | | | | | | | Total Investment of Cash Collateral for Securities Loaned (Cost $9,480,262) | | | 9,480,262 | | | | | | | Total Investments — 113.7% | | | | | | (Cost $68,689,188) | | | 77,647,440 | | | | | | | Liabilities in Excess of Other Assets — (13.7)% | | | (9,376,691 | ) | | | | | | NET ASSETS — 100.0% | | $ | 68,270,749 | |
Percentages indicated are based on net assets. | (a) | | — Non-income producing security. |
| (b) | | — Investment in affiliate. Money market fund registered under the Investment Company Act of 1940, as amended, and advised by JPMorgan Investment Advisors Inc. |
| (c) | | — Security, or a portion of the security, has been delivered to a counterparty as part of a security lending transaction. |
| (m) | | — All or a portion of this security is segregated for current or potential holdings of futures, swaps, options, TBA, when-issued securities, delayed delivery securities, and reverse repurchase agreements. |
| FRN | | — Floating Rate Note. The rate shown is the rate in effect as of June 30, 2006. |
SEE NOTES TO FINANCIAL STATEMENTS.
JUNE 30, 2006 JPMORGAN INSURANCE TRUST 7
STATEMENT OF ASSETS AND LIABILITIES
AS OF JUNE 30, 2006 (Unaudited)
|
|
|
| Intrepid
Mid Cap
Portfolio
|
|---|
ASSETS: | | | | | | | | Investments in non-affiliates, at value | | | | $ | 76,842,299 | | | Investments in affiliates, at value | | | | | 805,141 | | | Total investment securities, at value | | | | | 77,647,440 | | | Cash at securities lending agent | | | | | 274,975 | | | Receivables: | | | | | | | | Portfolio shares sold | | | | | 64,287 | | | Interest and dividends | | | | | 90,897 | | | Prepaid expenses and other assets | | | | | 2,543 | | | Total Assets | | | | | 78,080,142 | | | | LIABILITIES: | | | | | | | | Payables: | | | | | | | | Collateral for securities lending program | | | | | 9,755,237 | | | Portfolio shares redeemed | | | | | 7,940 | | | Accrued liabilities: | | | | | | | | Investment advisory fees | | | | | 32,438 | | | Administration fees | | | | | 4,750 | | | Custodian and accounting fees | | | | | 3,325 | | | Trustees’ and Officers’ fees | | | | | 29 | | | Other | | | | | 5,674 | | | Total Liabilities | | | | $ | 9,809,393 | | | Net Assets | | | | $ | 68,270,749 | | | | NET ASSETS: | | | | | | | | Paid in capital | | | | | 56,205,982 | | | Accumulated undistributed (distributions in excess of) net investment income | | | | | 208,026 | | | Accumulated net realized gains (losses) | | | | | 2,898,489 | | | Net unrealized appreciation (depreciation) | | | | | 8,958,252 | | | Total Net Assets | | | | $ | 68,270,749 | | | | | Outstanding units of beneficial interest (shares) (unlimited amount authorized, no par value) | | | | | 3,876,482 | | | Net asset value, offering and redemption price per share | | | | $ | 17.61 | | | | | Cost of investments | | | | $ | 68,689,188 | | | Market value of securities on loan | | | | $ | 9,731,543 | |
SEE NOTES TO FINANCIAL STATEMENTS.
8 JPMORGAN INSURANCE TRUST JUNE 30, 2006
STATEMENT OF OPERATIONS
FOR THE SIX MONTHS ENDED JUNE 30, 2006 (Unaudited)
|
|
|
| Intrepid
Mid Cap
Portfolio
|
|---|
INVESTMENT INCOME: | | | | | | | | Dividend income | | | | $ | 479,560 | | | Dividend income from affiliates (a) | | | | | 25,953 | | | Income from securities lending (net) | | | | | 12,152 | | | Total investment income | | | | | 517,665 | | | | EXPENSES: | | | | | | | | Investment advisory fees | | | | | 234,120 | | | Administration fees | | | | | 43,204 | | | Custodian and accounting fees | | | | | 11,031 | | | Interest expense | | | | | 160 | | | Professional fees | | | | | 26,840 | | | Trustees’ and Officers’ fees | | | | | 622 | | | Transfer agent fees | | | | | 1,319 | | | Printing and mailing costs | | | | | 16,163 | | | Other | | | | | 4,588 | | | Total expenses | | | | | 338,047 | | | Less amounts waived | | | | | (30,051 | ) | | Less earnings credits | | | | | (87 | ) | | Net expenses | | | | | 307,909 | | | Net investment income (loss) | | | | | 209,756 | | | | REALIZED/UNREALIZED GAINS (LOSSES): | | | | | | | | Net realized gain (loss) on transactions from investments | | | | | 2,940,369 | | | Change in net unrealized appreciation (depreciation) of investments | | | | | 976,993 | | | Net realized/unrealized gains (losses) | | | | | 3,917,362 | | | Change in net assets resulting from operations | | | | $ | 4,127,118 | |
| (a) | | Includes reimbursements of investment advisory and administration fees. Please see Fees and Other Transactions with Affiliates in the Notes to Financial Statements. |
SEE NOTES TO FINANCIAL STATEMENTS.
JUNE 30, 2006 JPMORGAN INSURANCE TRUST 9
STATEMENT OF CHANGES IN NET ASSETS
FOR THE PERIODS INDICATED
| | | | Intrepid Mid Cap Portfolio
| |
|---|
|
|
|
| Six Months
Ended
6/30/2006
(Unaudited)
|
| Year Ended
12/31/2005
|
|---|
CHANGE IN NET ASSETS RESULTING FROM OPERATIONS: | | | | | | | | | | | | Net investment income (loss) | | | | $ | 209,756 | | | $ | 260,048 | | | Net realized gain (loss) | | | | | 2,940,369 | | | | 11,456,788 | | | Change in net unrealized appreciation (depreciation) | | | | | 976,993 | | | | (2,165,263 | ) | | Change in net assets resulting from operations | | | | | 4,127,118 | | | | 9,551,573 | | | | DISTRIBUTIONS TO SHAREHOLDERS: | | | | | | | | | | | | From net investment income | | | | | (260,173 | ) | | | (79,752 | ) | | From net realized gains | | | | | (11,481,092 | ) | | | (1,921,835 | ) | | Total distributions to shareholders | | | | | (11,741,265 | ) | | | (2,001,587 | ) | | | CHANGE IN NET ASSETS FROM CAPITAL TRANSACTIONS: | | | | | | | | | | | | Proceeds from shares issued | | | | | 9,270,713 | | | | 7,980,708 | | | Dividends reinvested | | | | | 11,741,265 | | | | 2,001,587 | | | Cost of shares redeemed | | | | | (8,086,123 | ) | | | (14,970,000 | ) | | Change in net assets from capital transactions | | | | | 12,925,855 | | | | (4,987,705 | ) | | | NET ASSETS: | | | | | | | | | | | | Change in net assets | | | | | 5,311,708 | | | | 2,562,281 | | | Beginning of period | | | | | 62,959,041 | | | | 60,396,760 | | | End of period | | | | $ | 68,270,749 | | | $ | 62,959,041 | | | Accumulated undistributed (distributions in excess of) net investment income | | | | $ | 208,026 | | | $ | 258,443 | | | | SHARE TRANSACTIONS: | | | | | | | | | | | | Issued | | | | | 497,381 | | | | 425,575 | | | Reinvested | | | | | 652,655 | | | | 115,299 | | | Redeemed | | | | | (418,788 | ) | | | (807,861 | ) | | Change in shares | | | | | 731,248 | | | | (266,987 | ) |
SEE NOTES TO FINANCIAL STATEMENTS.
10 JPMORGAN INSURANCE TRUST JUNE 30, 2006
THIS PAGE IS INTENTIONALLY LEFT BLANK JUNE 30, 2006 JPMORGAN INSURANCE TRUST 11
FINANCIAL HIGHLIGHTS
FOR THE PERIODS INDICATED
| |
|
|
|
|
|
|
|
| Per share operating performance
|
|---|
| |
| | Investment operations
| | Distributions
|
|---|
|
| Net asset
value,
beginning
of period
|
| Net
investment
income
(loss)
|
| Net realized
and unrealized
gains
(losses) on
investments
|
| Total from
investment
operations
|
| Net
investment
income
|
| Net
realized
gains
|
| Total
distributions
|
|---|
Intrepid Mid Cap Portfolio | | | | | | | | | | | | | | | | | | | | | | | | | | | | | | Six Months Ended June 30, 2006 (Unaudited) | | $ | 20.02 | | | $ | 0.06 | | | $ | 1.28 | | | $ | 1.34 | | | $ | (0.08 | ) | | $ | (3.67 | ) | | $ | (3.75 | ) | | Year Ended December 31, 2005 | | | 17.70 | | | | 0.08 | | | | 2.85 | | | | 2.93 | | | | (0.02 | ) | | | (0.59 | ) | | | (0.61 | ) | | Year Ended December 31, 2004 | | | 15.50 | | | | 0.02 | | | | 2.21 | | | | 2.23 | | | | (0.03 | ) | | | — | | | | (0.03 | ) | | Year Ended December 31, 2003 | | | 11.91 | | | | 0.03 | | | | 3.59 | | | | 3.62 | | | | (0.03 | ) | | | — | | | | (0.03 | ) | | Year Ended December 31, 2002 | | | 14.49 | | | | 0.03 | | | | (2.61 | ) | | | (2.58 | ) | | | — | | | | — | | | | — | | | Year Ended December 31, 2001 | | | 17.83 | | | | 0.04 | | | | (0.95 | ) | | | (0.91 | ) | | | (0.04 | ) | | | (2.39 | ) | | | (2.43 | ) |
| (a) | | Annualized for periods less than one year. |
| (b) | | Not annualized for periods less than one year. |
| (c) | | Includes adjustments in accordance with accounting principles generally accepted in the United States of America and as such, the net asset value for financial reporting purposes and the returns based upon those net asset values may differ from the net asset value and returns for shareholder transactions. |
SEE NOTES TO FINANCIAL STATEMENTS.
12 JPMORGAN INSURANCE TRUST JUNE 30, 2006
|
| Ratios/Supplemental data
|
|
|---|
| | | |
| |
| | Ratios to average net assets (a)
| |
|---|
Net asset
value, end
of period
|
|
|
| Total
return (b)(c)
|
| Net assets
end of
period
(000’s)
|
| Net
expenses
|
| Net
investment
income
(loss)
|
| Expenses
without waivers,
reimbursements
and earnings credits
|
| Portfolio
turnover
rate (b)
|
|---|
| $17.61 | | | | | 6.33 | % | | $ | 68,271 | | | | 0.93 | % | | | 0.64 | % | | | 1.03 | % | | | 69 | % | | 20.02 | | | | | 17.10 | | | | 62,959 | | | | 0.95 | | | | 0.43 | | | | 0.98 | | | | 151 | | | 17.70 | | | | | 14.42 | | | | 60,397 | | | | 0.93 | | | | 0.14 | | | | 0.94 | | | | 98 | | | 15.50 | | | | | 30.44 | | | | 59,207 | | | | 0.94 | | | | 0.24 | | | | 0.98 | | | | 79 | | | 11.91 | | | | | (17.81 | ) | | | 43,303 | | | | 0.95 | | | | 0.20 | | | | 1.00 | | | | 29 | | | 14.49 | | | | | (4.03 | ) | | | 50,785 | | | | 0.95 | | | | 0.24 | | | | 0.98 | | | | 52 | |
SEE NOTES TO FINANCIAL STATEMENTS.
JUNE 30, 2006 JPMORGAN INSURANCE TRUST 13
NOTES TO FINANCIAL STATEMENTS
AS OF JUNE 30, 2006 (Unaudited)
1. Organization JPMorgan Insurance Trust (formerly JPMorgan Investment Trust) (the “Trust”) is registered under the Investment Company Act of 1940, as amended (the “1940 Act”), as an open-end investment company established as a Massachusetts business trust. The JPMorgan Insurance Trust Intrepid Mid Cap Portfolio is a separate Portfolio of the Trust (the “Portfolio”). Effective May 1, 2006, the Board of Trustees approved the name change from JPMorgan Investment Trust Diversified Mid Cap Portfolio to JPMorgan Insurance Trust Intrepid Mid Cap Portfolio and designated the existing shares as Class 1 shares. Portfolio shares are offered only to separate accounts of participating insurance companies and eligible plans. Individuals may not purchase shares directly from the Portfolio. 2. Significant Accounting Policies The following is a summary of significant accounting policies followed by the Trust in preparation of its financial statements. The policies are in accordance with accounting principles generally accepted in the United States of America. The preparation of financial statements requires management to make estimates and assumptions that affect the reported amounts of assets and liabilities at the date of the financial statements and the reported amounts of income and expenses for the period. Actual results could differ from those estimates. A. Valuation of Investments — Listed securities are valued at the last sale price on the exchange on which they are primarily traded. The value of National Market Systems equity securities quoted by the NASDAQ Stock Market shall generally be the NASDAQ Official Closing Price. Unlisted securities are valued at the last sale price provided by an independent pricing agent or principal market maker. Listed securities for which the latest sales prices are not available are valued at the mean of the latest bid and ask price as of the closing of the primary exchange where such securities are normally traded. Corporate debt securities, debt securities issued by the U.S. Treasury or a U.S. government agency (other than short-term investments maturing in 61 days or less), and municipal securities are valued each day based on readily available market quotations received from third party broker-dealers of comparable securities or independent or affiliated pricing services approved by the Board of Trustees. Such pricing services and broker-dealers will generally provide bid-side quotations. Generally, short-term investments (other than certain high yield securities) maturing in 61 days or less are valued at amortized cost, which approximates market value. Futures, options and other derivatives are valued on the basis of available market quotations. Investments in other open-end investment companies are valued at such investment company’s current day closing net asset value per share. Securities or other assets for which market quotations are not readily available or for which market quotations do not represent the value at the time of pricing (including certain illiquid securities) are fair valued in accordance with procedures established by and under the supervision and responsibility of the Trustees. Trading in securities on most foreign exchanges and over-the-counter markets is normally completed before the close of the domestic market and may also take place on days when the domestic market is closed. In accordance with procedures adopted by the Trustees, the Portfolio applies fair value pricing on a daily basis except for North American, Central American, South American and Caribbean equity securities held in its portfolio by utilizing the quotations of an independent pricing service, unless the Portfolio’s adviser determines that use of another valuation methodology is appropriate. The pricing service uses statistical analyses and quantitative models to adjust local market prices using factors such as subsequent movement and changes in the prices of indices, securities and exchange rates in other markets, in determining fair value as of the time the Portfolio calculates its net asset value. B. Repurchase Agreements — The Portfolio may enter into repurchase agreement transactions with institutions that meet the advisor’s credit guidelines. Each repurchase agreement is valued at amortized cost. The Portfolio requires that the collateral received in a repurchase agreement transaction be transferred to a custodian in a manner sufficient to enable the Portfolio to obtain collateral in the event of a counterparty default. If the counterparty defaults and the fair value of the collateral declines, realization of the collateral by the Portfolio may be delayed or limited. C. Securities Lending — To generate additional income, the Portfolio may lend up to 33-1/3% of its assets pursuant to agreements (“borrower agreements”) requiring that the loan be continuously secured by cash or securities issued by the U.S. government or its agencies or its instrumentalities (“U.S. government securities”). JPMorgan Chase Bank, N.A. (“JPMCB”), an affiliate of the Portfolio, serves as lending agent pursuant to a Securities Lending Agreement approved by the Board of Trustees (the “Securities Lending Agreement”). Under the Securities Lending Agreement, JPMCB acting as agent for the Portfolio, loans securities to approved borrowers pursuant to approved borrower agreements in exchange for collateral equal to at least 100% of the market value of the loaned securities plus accrued interest. During the term of the loan, the Portfolio receives payments from borrowers equivalent to the dividends and interest that would have been earned on securities lent while simultaneously seeking to earn income on the investment of cash collateral in accordance with investment guidelines contained in the Securities Lending Agreement. For loans secured by cash, the Portfolio retains the interest on cash collateral investments but is required to pay the borrower a portion of such interest for the use of the cash collateral. For loans secured by U.S. government securities, the borrower pays a borrower fee to the lending agent on behalf of the Portfolio. The net income earned on the securities lending (after payment of rebates and the lending agent’s fee) is included in the Statement of Operations as Income from securities lending (net). Information on the investment of cash collateral is shown in the Schedule of Portfolio Investments. 14 JPMORGAN INSURANCE TRUST JUNE 30, 2006
Under the Securities Lending Agreement, JPMCB is entitled to a fee equal to (i) 0.06% calculated on an annualized basis and accrued daily, based upon the value of collateral received from borrowers for each loan of U.S. Securities outstanding during a given month; and (ii) 0.1142% calculated on an annualized basis and accrued daily, based upon the value of collateral received from borrowers for each loan of non-U.S. Securities outstanding during a given month. For the period ended June 30, 2006, JPMCB voluntarily reduced its fees to: (i) 0.05% for each loan of U.S. Securities and (ii) 0.10% for each loan of non-U.S. Securities, respectively. Risks of delay in recovery of securities or even loss of rights in the securities may occur should the borrower of the securities fail financially. Risks may also arise to the extent that the value of the securities loaned increases above the value of the collateral received. JPMCB will indemnify the Portfolio from losses resulting from a borrower’s failure to return a loaned security when due. Such indemnification does not extend to losses associated with declines in the value of cash collateral investments. Loans are subject to termination by the Portfolio or the borrower at any time, and are, therefore, not considered to be illiquid investments. As of June 30, 2006, the Portfolio had securities with the following market values on loan, received the following collateral and for the period then ended, paid the following amounts to related party affiliates:
|
|
|
| Lending
Agent
Fees Paid
|
| Market
Value of
Collateral
|
| Market Value
of Loaned
Securities
|
|---|
| | | | | $ | 2,182 | | | $ | 9,755,237 | | | $ | 9,731,543 | |
D. Security Transactions and Investment Income — Investment transactions are accounted for on the trade date (the date the order to buy or sell is executed). Securities gains and losses are calculated on a specifically identified cost basis. Interest income is determined on the basis of coupon interest accrued using the effective interest method adjusted for amortization of premiums and accretion of discounts. Dividend income less foreign taxes withheld (if any) is recorded on the ex-dividend date or when the Portfolio first learns of the dividend. E. Allocation of Expenses — Expenses directly attributable to the Portfolio are charged directly to the Portfolio while the expenses attributable to more than one portfolio of the Trust are allocated among the respective portfolios. F. Federal Income Taxes — The Portfolio is treated as a separate taxable entity for Federal income tax purposes. The Portfolio’s policy is to comply with the provisions of the Internal Revenue Code of 1986, as amended (the “Code”), applicable to regulated investment companies and to distribute to shareholders all of its distributable net investment income and net realized gain on investments. Accordingly, no provision for Federal income tax is necessary. The Portfolio is also a segregated portfolio of assets for insurance purposes and intends to comply with the diversification requirements at Subchapter L of the Code. G. Foreign Taxes — The Portfolio may be subject to foreign taxes on income, gains on investments or currency repatriation, a portion of which may be recoverable. The Portfolio will accrue such taxes and recoveries as applicable, based upon its current interpretation of tax rules and regulations that exist in the markets in which it invests. H. Distributions to Shareholders — Dividends from net investment income and net realized capital gains, if any, are generally declared and paid annually. Distributions from net investment income and from net capital gains are determined in accordance with Federal income tax regulations, which may differ from accounting principles generally accepted in the United States of America. To the extent these “book/tax” differences are permanent in nature (i.e. that they result from other than timing of recognition — “temporary differences”), such amounts are reclassified within the capital accounts based on their Federal tax-basis treatment. I. New Accounting Pronouncement — In July 2006, the Financial Accounting Standards Board issued Interpretation No. 48, “Accounting for Uncertainty in Income Taxes — an Interpretation of FASB Statement No. 109” (the “Interpretation”). The Interpretation establishes for all entities, including pass-through entities such as the Portfolio, a minimum threshold for financial statement recognition of the benefit of positions taken in filing tax returns (including whether an entity is taxable in a particular jurisdiction), and requires certain expanded tax disclosures. The Interpretation is effective for fiscal years beginning after December 15, 2006, and is to be applied to all open tax years as of the date of effectiveness. Management has recently begun to evaluate the application of the Interpretation to the Portfolio, and is not in a position at this time to estimate the significance of its impact, if any, on the Portfolio’s financial statements. 3. Fees and Other Transactions with Affiliates
A. Investment Advisory Fee — Pursuant to the Investment Advisory Agreement, JPMorgan Investment Advisors Inc. (the “Advisor”) acts as the investment advisor to the Portfolio. The Advisor is an indirect wholly-owned subsidiary of JPMorgan Chase & Co. (“JPMorgan”). The Advisor supervises the investments of the Portfolio and for such services is paid a fee. The fee is accrued daily and paid monthly based on the Portfolio’s average daily net assets at an annual fee rate of 0.65%. Prior to May 1, 2006, the investment advisory fee for the Portfolio was 0.74%. The Advisor waived and/or reimbursed Investment Advisory fees as outlined in Note 3.E. The Portfolio may invest in one or more money market funds advised by the Advisor or its affiliates. Investment advisory and administrative fees are waived and/or reimbursed from the Portfolio in an amount sufficient to offset any doubling up of these fees related to the Portfolio’s investment in an affiliated money market fund to the extent required by law. JUNE 30, 2006 JPMORGAN INSURANCE TRUST 15
NOTES TO FINANCIAL STATEMENTS
AS OF JUNE 30, 2006 (Unaudited) (continued)
B. Administration Fee — Pursuant to an Administration Agreement, JPMorgan Funds Management, Inc. (the “Administrator”), an indirect, wholly-owned subsidiary of JPMorgan, provides certain administration services to the Portfolio. In consideration of these services, the Administrator receives a fee computed daily and paid monthly at the annual rate of 0.15% of the first $25 billion of the average daily net assets of all funds in the JPMorgan Fund Complex (excluding funds of funds and money market funds) and 0.075% of the average daily net assets in excess of $25 billion of all such funds. The Administrator waived and/or reimbursed Administration fees as outlined in Note 3.E. Prior to May 1, 2006, the Administrator provided services for a fee computed daily and paid monthly at the annual rate of 0.18% of the first $250 million of the average daily net assets of the Trust (excluding the Equity Index Portfolio) and 0.14% of the average daily net assets of the Trust in excess of $250 million (excluding the Equity Index Portfolio). J.P. Morgan Investor Services, Co. (“JPMIS”), an indirect, wholly owned subsidiary of JPMorgan, serves as the Portfolio’s Sub-administrator (the “Sub-administrator”). For its services as Sub-administrator, JPMIS receives a portion of the fees payable to the Administrator. Prior to May 1, 2006, JPMIS also received a portion of the fees payable to the Administrator as compensation for fund accounting services. C. Distribution Fees — Pursuant to a Distribution Agreement, JPMorgan Distribution Services, Inc. (the “Distributor”), a wholly-owned subsidiary of JPMorgan, serves as the Trust’s exclusive underwriter and promotes and arranges for the sale of the Portfolio’s shares. The Distributor receives no compensation in its capacity as the Portfolio’s underwriter. D. Custodian and Accounting Fees —JPMCB provides portfolio custody and accounting services for the Portfolio. The amounts paid directly to JPMCB by the Portfolio for custody and accounting services are included in custodian and accounting fees in the Statement of Operations. (Effective May 1, 2006, the Portfolio began paying the fees for accounting services directly to JPMCB.) The custodian fees may be reduced by credits earned by the Portfolio, based on uninvested cash balances held by the custodian. Such earnings credits are presented separately in the Statement of Operations. Interest expense, if any, paid to the custodian related to cash overdrafts is presented as interest expense in the Statement of Operations. E. Waivers and Reimbursements — The Advisor and Administrator have contractually agreed to waive fees or reimburse the Portfolio to the extent that total annual operating expenses (excluding interest, taxes, extraordinary expenses and expenses related to the Board of Trustees’ deferred compensation plan) exceed 0.90% (0.95% prior to May 1, 2006) of the Portfolio’s average daily net assets. The contractual expense limitation agreements were in effect for the six months ended June 30, 2006. The new expense limitation percentage above is in place until at least April 30, 2007. For the six months ended June 30, 2006, the Portfolio’s Advisor contractually waived fees for the Portfolio in the amount of $30,051. The Advisor does not expect the Portfolio to repay any such waived fees in future years. F. Other — Certain officers of the Trust are affiliated with the Advisor, the Administrator, the Sub-Administrator and the Distributor. Such officers, with the exception of the Chief Compliance Officer, receive no compensation from the Portfolio for serving in their respective roles. The Board of Trustees appointed a Chief Compliance Officer to the Portfolio in accordance with federal securities regulations. The Portfolio, along with other affiliated portfolios, make reimbursement payments, on a pro-rata basis, to the Administrator for a portion of the fees associated with the Office of the Chief Compliance Officer. Such fees are included in Trustees’ and Officers’ Fees in the Statement of Operations. The Trust adopted a Trustee Deferred Compensation Plan (the “Plan”) which allows the independent Trustees to defer the receipt of all or a portion of compensation related to performance of their duties as a Trustee. The deferred fees are invested in various JPMorgan funds until distribution in accordance with the Plan. During the period, the Portfolio may have purchased securities from an underwriting syndicate in which the principal underwriter or members of the syndicate are affiliated with the Advisor. The Portfolio may use related party brokers/dealers. For the six months ended June 30, 2006, the Portfolio did not incur any brokerage commissions with brokers/dealers affiliated with the Advisor. The SEC has granted an exemptive order permitting the Portfolio to engage in principal transactions with J.P. Morgan Securities, Inc., an affiliated broker, involving taxable money market instruments subject to certain conditions. 16 JPMORGAN INSURANCE TRUST JUNE 30, 2006
4. Investment Transactions During the six months ended June 30, 2006, purchases and sales of investments (excluding short-term investments) were as follows:
|
|
|
| Purchases
(excluding
U.S. Government)
|
| Sales
(excluding
U.S. Government)
|
|---|
| | | | | $ | 46,447,518 | | | $ | 45,221,731 | |
During the six months ended June 30, 2006, there were no purchases or sales of U.S. Government securities. 5. Federal Income Tax Matters For Federal income tax purposes, the cost and unrealized appreciation (depreciation) in value of the investment securities at June 30, 2006, were as follows:
|
|
|
| Aggregate
Cost
|
| Gross
Unrealized
Appreciation
|
| Gross
Unrealized
Depreciation
|
| Net
Unrealized
Appreciation
(Depreciation)
|
|---|
| | | | | $ | 68,689,188 | | | $ | 10,010,607 | | | $ | (1,052,355 | ) | | $ | 8,958,252 | |
6. Borrowings The Trust and JPMCB have entered into a financing arrangement. Under this arrangement, JPMCB provides an unsecured, uncommitted credit facility in the aggregate amount of $100 million to certain of the JPMorgan Funds including the Portfolio. Advances under the arrangement are taken primarily for temporary or emergency purposes, including the meeting of redemption requests that otherwise might require the untimely disposition of securities, and are subject to the Portfolio’s borrowing restrictions. Interest on borrowings is payable at a rate determined by JPMCB at the time of borrowing. This agreement has been extended until November 21, 2006. The Portfolio had no borrowings outstanding at June 30, 2006, or at any time during the six months ended. 7. Concentrations and Indemnification In the normal course of business the Portfolio enters into contracts that contain a variety of representations which provide general indemnifications. The Portfolio’s maximum exposure under these arrangements is unknown, as this would involve future claims that may be made against the Portfolio that have not yet occurred. However, based on experience, the Portfolio expects the risk of loss to be remote. From time to time, the Portfolio may have a concentration of several shareholders holding a significant percentage of shares outstanding. Investment activities of these shareholders could have a material impact on the Portfolio. JUNE 30, 2006 JPMORGAN INSURANCE TRUST 17
TRUSTEES
(Unaudited)
The Portfolio’s Statement of Additional Information includes additional information about the Portfolio’s Trustees and is available, without charge, upon request by calling 1-800-480-4111 or on the Portfolio’s website at www.jpmorganfunds.com. Name (Year of Birth);
Positions With
the Portfolio
|
|
|
| Principal Occupations
During Past 5 Years
|
| Number of
Portfolios/Funds
in JPMorgan
Funds Complex (1)
Overseen by Trustee
|
| Other Directorships Held
Outside Fund Complex
|
|---|
Independent Trustees | | William J. Armstrong (1941); Trustee of Trust since 2005; Trustee of heritage JPMorgan Funds since 1987. | | | | Retired; CFO and Consultant, EduNeering, Inc. (internet business education supplier) (2000–2001); Vice President and Treasurer, Ingersoll–Rand Company (manufacturer of industrial equipment) (1972–2000). | | 120 | | None. | | Roland R. Eppley, Jr. (1932); Trustee of Trust since 2005; Trustee of heritage JPMorgan Funds since 1989. | | | | Retired; President and Chief Executive Officer, Eastern States Bankcard (1971–1988). | | 120 | | None. | | John F. Finn (1947); Trustee of Trust since 2005; Trustee of heritage One Group Mutual Funds since 1998. | | | | President and Chief Executive Officer, Gardner, Inc. (wholesale distributor to outdoor power equipment industry) (1979–present). | | 120 | | Director, Cardinal Health, Inc (CAH) (1994–present); Chairman, The Columbus Association for the Performing Arts (CAPA) (2003–present). | | Dr. Matthew Goldstein (1941); Trustee of Trust since 2005; Trustee of heritage JPMorgan Funds since 2003. | | | | Chancellor of the City University of New York (1999–present); President, Adelphi University (New York) (1998–1999). | | 120 | | Director, Albert Einstein School of Medicine (1998–present); Director, New Plan Excel Realty Trust, Inc. (real estate investment trust)
(2000–present); Director, Lincoln Center Institute for the Arts in Education (1999–present). | | Robert J. Higgins (1945); Trustee of Trust since 2005; Trustee of heritage JPMorgan Funds since 2002. | | | | Retired; Director of Administration of the State of Rhode Island (2003–2004); President — Consumer Banking and Investment Services, Fleet Boston Financial (1971–2001). | | 120 | | None. | | Peter C. Marshall (1942); Trustee of Trust since 2005; Trustee of heritage One Group Mutual Funds since 1994. | | | | Self-employed business consultant (2002–present); Senior Vice President, W.D. Hoard, Inc. (corporate parent of DCI Marketing, Inc.) (2000–2002); President, DCI Marketing, Inc. (1992–2000). | | 120 | | None. | | Marilyn McCoy (1948); Trustee of Trust since 2005; Trustee of heritage One Group Mutual Funds since 1999. | | | | Vice President of Administration and Planning, Northwestern University (1985–present). | | 120 | | Trustee, Mather LifeWays (1994–present); Trustee, Carleton College (2003–present). | | William G. Morton, Jr. (1937); Trustee of Trust since 2005; Trustee of heritage JPMorgan Funds since 2003. | | | | Retired; Chairman Emeritus (2001–2002), and Chairman and Chief Executive Officer, Boston Stock Exchange (1985–2001). | | 120 | | Director, Radio Shack Corporation (electronics) (1987–present); Director, The National Football Foundation and College Hall of Fame (1994–present); Trustee, Stratton Mountain School (2001–present). |
18 JPMORGAN INSURANCE TRUST JUNE 30, 2006
Name (Year of Birth);
Positions With
the Portfolio
|
|
|
| Principal Occupations
During Past 5 Years
|
| Number of
Portfolios/Funds
in JPMorgan
Funds Complex (1)
Overseen by Trustee
|
| Other Directorships Held
Outside Fund Complex
|
|---|
Independent Trustees | | Robert A. Oden, Jr. (1946); Trustee of Trust since 2005; Trustee of heritage One Group Mutual Funds since 1997. | | | | President, Carleton College (2002–present); President, Kenyon College (1995–2002). | | 120 | | Director, American University in Cairo. | | Fergus Reid, III (1932); Trustee of Trust (Chairman) since 2005; Trustee (Chairman) of heritage JPMorgan Funds since 1987. | | | | Chairman, Lumelite Corporation (plastics manufacturing) (2003–present); Chairman and Chief Executive Officer, Lumelite Corporation (1985–2002). | | 120 | | Trustee, Morgan Stanley Funds (198 portfolios) (1995–present). | | Frederick W. Ruebeck (1939); Trustee of Trust since 2005; Trustee of heritage One Group Mutual Funds since 1994. | | | | Advisor, Jerome P. Green & Associates, LLC (broker-dealer) (2000–present); Chief Investment Officer, Wabash College (2004–present); self-employed consultant (2000–present); Director of Investments, Eli Lilly and Company (1988–1999). | | 120 | | Trustee, Wabash College (1988–present); Chairman, Indianapolis Symphony Orchestra Foundation (1994–present). | | James J. Schonbachler (1943); Trustee of Trust since 2005; Trustee of heritage JPMorgan Funds since 2001. | | | | Retired; Managing Director of Bankers Trust Company (financial services) (1968–1998). | | 120 | | None. | Interested Trustee | | Leonard M. Spalding, Jr.* (1935); Trustee of Trust since 2005; Trustee of heritage JPMorgan Funds since 1998. | | | | Retired; Chief Executive Officer of Chase Mutual Funds (investment company) (1989–1998); President & Chief Executive Officer, Vista Capital Management (investment management) (1990–1998); Chief Investment Executive, Chase Manhattan Private Bank (investment management) (1990–1998). | | 120 | | Director, Glenview Trust Company, LLC (2001–present); Trustee, St. Catherine College (1998–present); Trustee, Bellarmine University (2000–present); Director, Springfield-Washington County Economic Development Authority (1997–present); Trustee, Marion and Washington County, Kentucky Airport Board (1998–present); Trustee, Catholic Education Foundation (2005–present). |
| (1) | | A Fund Complex means two or more registered investment companies that hold themselves out to investors as related companies for purposes of investment and investor services or have a common investment adviser or have an investment adviser that is an affiliated person of the investment adviser of any of the other registered investment companies. The JPMorgan Funds Complex which the Board of Trustees currently oversees includes eight registered investment companies (120 portfolios/funds). |
| * | | Mr. Spalding is deemed to be an “interested person” due to his ownership of JPMorgan Chase stock. |
The contact address for each of the Trustees is 245 Park Avenue, New York, NY 10167. JUNE 30, 2006 JPMORGAN INSURANCE TRUST 19
OFFICERS
(Unaudited)
Name (Year of Birth),
Positions Held with
the Trust
|
|
|
| Principal Occupations During Past 5 Years
|
|---|
George C.W. Gatch (1962),
President since 2005 | | | | Managing Director, JPMorgan Investment Management Inc.; Director and President, JPMorgan Distribution Services, Inc. and JPMorgan Funds Management, Inc. since 2005. Mr. Gatch is CEO and President of JPMorgan Funds. Mr. Gatch has been an employee since 1986 and has held positions such as President and CEO of DKB Morgan, a Japanese mutual fund company which was a joint venture between J.P. Morgan and Dai-Ichi Kangyo Bank, as well as positions in business management, marketing and sales. | Robert L. Young (1963),
Senior Vice President since 2005* | | | | Director and Vice President, JPMorgan Distribution Services, Inc. and JPMorgan Funds Management, Inc.; Chief Operating Officer, JPMorgan Funds since 2005, and One Group Mutual Funds from 2001 until 2005. Mr. Young was Vice President and Treasurer, JPMorgan Funds Management, Inc. (formerly One Group Administrative Services) and Vice President and Treasurer, JPMorgan Distribution Services, Inc. (formerly One Group Dealer Services, Inc.) from 1999 to 2005. | Patricia A. Maleski (1960),
Vice President and Chief
Administrative Officer since 2005 | | | | Managing Director, JPMorgan Funds Management, Inc.; previously, Treasurer, JPMorgan Funds and Head of Funds Administration and Board Liaison. Ms. Maleski was Vice President of Finance for the Pierpont Group, Inc. from 1996–2001, an independent company owned by the Board of Directors/Trustees of the JPMorgan Funds, prior to joining J.P. Morgan Chase & Co. in 2001. | Stephanie J. Dorsey (1969),
Treasurer since 2005* | | | | Vice President, JPMorgan Funds Management, Inc.; Director of Mutual Fund Administration, JPMorgan Funds Management, Inc. (formerly One Group Administrative Services), from 2004 to 2005; Ms. Dorsey worked for JPMorgan Chase & Co., (formerly Bank One Corporation) from 2003 to 2004; prior to joining Bank One Corporation, she was a Senior Manager specializing in Financial Services audits at PricewaterhouseCoopers LLP from 1992 through 2002. | Stephen M. Ungerman (1953),
Senior Vice President and Chief
Compliance Officer since 2005
| | | | Senior Vice President, JPMorgan Chase & Co.; Mr. Ungerman was head of Fund Administration — Pooled Vehicles from 2000 to 2004. Mr. Ungerman held a number of positions in Prudential Financial’s asset management business prior to 2000. | Paul L. Gulinello (1950), AML
Compliance Officer since 2005 | | | | Vice President and Anti Money Laundering Compliance Officer for JPMorgan Asset Management Americas, additionally responsible for personal trading and compliance testing since 2004; Treasury Services Operating Risk Management and Compliance Executive supporting all JPMorgan Treasury Services business units from July 2000 to 2004. | Stephen M. Benham (1959),
Secretary since 2005 | | | | Vice President and Assistant General Counsel, JPMorgan Chase & Co. since 2004; Vice President (Legal Advisory) of Merrill Lynch Investment Managers, L.P. from 2000 to 2004; attorney associated with Kirkpatrick & Lockhart LLP from 1997 to 2000. | Elizabeth A. Davin (1964),
Assistant Secretary since 2005* | | | | Vice President and Assistant General Counsel, JPMorgan Chase & Co. since 2005; Senior Counsel, JPMorgan Chase & Co. (formerly Bank One Corporation) from 2004 to 2005; Assistant General Counsel and Associate General Counsel and Vice President, Gartmore Global Investments, Inc. from 1999 to 2004. | Jessica K. Ditullio (1962),
Assistant Secretary since 2005* | | | | Vice President and Assistant General Counsel, JPMorgan Chase & Co. since 2005; Ms. Ditullio has served as an attorney with various titles for JPMorgan Chase & Co. (formerly Bank One Corporation) since 1990. | Nancy E. Fields (1949),
Assistant Secretary since 2005* | | | | Vice President, JPMorgan Funds Management, Inc. and JPMorgan Distribution Services, Inc.; From 1999 to 2005, Director, Mutual Fund Administration, JPMorgan Funds Management, Inc. (formerly One Group Administrative Services, Inc.) and Senior Project Manager, Mutual Funds, JPMorgan Distribution Services, Inc. (formerly One Group Dealer Services, Inc.). | Michael C. Raczynski (1975),
Assistant Secretary (2006) | | | | Vice President and Assistant General Counsel, JPMorgan Chase & Co. since 2006; Associate, Stroock & Stroock & Lavan LLP from 2001 to 2006. | Ellen W. O’Brien (1957),
Assistant Secretary since 2005** | | | | Assistant Vice President, JPMorgan Investor Services, Co., responsible for Blue Sky registration. Ms. O’Brien has served in this capacity since joining the firm in 1991. |
20 JPMORGAN INSURANCE TRUST JUNE 30, 2006
Name (Year of Birth),
Positions Held with
the Trust
|
|
|
| Principal Occupations During Past 5 Years
|
|---|
Suzanne E. Cioffi (1967),
Assistant Treasurer since 2005 | | | | Vice President, JPMorgan Funds Management, Inc., responsible for mutual fund financial reporting. Ms. Cioffi has overseen various fund accounting, custody and administration conversion projects during the past five years. | Arthur A. Jensen (1966),
Assistant Treasurer since 2005* | | | | Vice President, JPMorgan Funds Management, Inc. since April 2005; formerly, Vice President of Financial Services of BISYS Fund Services, Inc. from 2001 until 2005; Mr. Jensen was Section Manager at Northern Trust Company and Accounting Supervisor at Allstate Insurance Company prior to 2001. |
The contact address for each of the officers, unless otherwise noted, is 245 Park Avenue, New York, NY 10167. | * | | The contact address for the officer is 1111 Polaris Parkway, Columbus, OH 43271. |
| ** | | The contact address for the officer is 73 Tremont Street, Floor 1, Boston MA 02108. |
JUNE 30, 2006 JPMORGAN INSURANCE TRUST 21
SCHEDULE OF SHAREHOLDER EXPENSES
(Unaudited)
Hypothetical $1,000 Investment at Beginning of Period
June 30, 2006
As a shareholder of the Portfolio, you incur ongoing costs, including investment advisory fees, administration fees and other Portfolio expenses. Because the Portfolio is a funding vehicle for Policies and Eligible Plans, you may also incur sales charges and other fees relating to the Policies or Eligible Plans. The examples below are intended to help you understand your ongoing costs (in dollars) of investing in the Portfolio, but not the costs of the Policies or Eligible Plans, and to compare these ongoing costs with the ongoing costs of investing in other mutual funds. The examples assume that you had a $1,000 investment in the Portfolio at the beginning of the reporting period, January 1, 2006, and continued to hold your shares at the end of the reporting period, June 30, 2006. Actual Expenses The first line provides information about actual account values and actual expenses. You may use the information in this line, together with the amount you invested, to estimate the expenses that you paid over the period. Simply divide your account value by $1,000 (for example, an $8,600 account value divided by $1,000 = 8.6), then multiply the result by the number in the first line under the heading entitled “Expenses Paid During Period” to estimate the expenses you paid on your account during this period. Hypothetical Example for Comparison Purposes The second line in the table below provides information about hypothetical account values and hypothetical expenses based on the actual expense ratio and an assumed rate of return of 5% per year before expenses, which is not the Portfolio’s actual return. The hypothetical account values and expenses may not be used to estimate the actual ending account balance or expenses you paid for the period. You may use this information to compare the ongoing costs of investing in the Portfolio and other portfolios. To do so, compare this 5% hypothetical example with the 5% hypothetical examples that appear in the shareholder reports of the other funds. Please note that the expenses shown in the table are meant to highlight your ongoing costs only and do not reflect any transaction costs, such as sales charges (loads) or redemption fees or the costs associated with the Policies and Eligible Plans through which the Portfolio is held. Therefore, the second line in the table is useful in comparing ongoing costs only, and will not help you determine the relative total costs of owning different portfolios. In addition, if these transaction costs were included, your costs would have been higher. The examples also assume all dividends and distributions have been reinvested.
|
|
|
| Beginning
Account Value,
January 1, 2006
|
| Ending
Account Value,
June 30, 2006
|
| Expenses
Paid During
January 1, 2006 to
June 30, 2006*
|
| Annualized
Expense
Ratio
|
|---|
Intrepid Mid Cap Portfolio | | Actual | | | | $ | 1,000.00 | | | $ | 1,063.30 | | | $ | 4.76 | | | | 0.93 | % | | Hypothetical | | | | | 1,000.00 | | | | 1,020.18 | | | | 4.66 | | | | 0.93 | |
| * | | Expenses are equal to the Portfolio’s annualized expense ratio, multiplied by the average account value over the period, multiplied by 181/365 (to reflect the one-half year period). |
22 JPMORGAN INSURANCE TRUST JUNE 30, 2006
THIS PAGE IS INTENTIONALLY LEFT BLANK
THIS PAGE IS INTENTIONALLY LEFT BLANK
JPMorgan Funds are distributed by JPMorgan Distribution Services, Inc., which is an affiliate of JPMorgan Chase & Co. Affiliates of JPMorgan Chase & Co. receive fees for providing various services to the funds. This report is submitted for the general information of the shareholders of the Portfolio. It is not authorized for distribution to prospective investors in the Portfolio unless preceded or accompanied by a prospectus. Contact JPMorgan Funds Distribution Services at 1-800-480-4111 for a portfolio prospectus. You can also visit us at www.jpmorganfunds.com. Investors should carefully consider the investment objectives and risk as well as charges and expenses of the mutual fund before investing. The prospectus contains this and other information about the mutual fund. Read the prospectus carefully before investing. The Portfolio files a complete schedule of its portfolio holdings for the first and third quarters of its fiscal year with the SEC on Form N-Q. The Portfolio’s Forms N-Q are available on the SEC’s website at http://www.sec.gov and may be reviewed and copied at the SEC’s Public Reference Room in Washington, DC. Information on the operation of the SEC’s Public Reference Room may be obtained by calling 1-800-SEC-0330. Shareholders may request the Form N-Q without charge by calling 1-800-480-4111 or by visiting the variable insurance portfolio section of the JPMorgan Funds’ website at www.jpmorganfunds.com. A description of the Portfolio’s policies and procedures with respect to the disclosure of the Portfolio’s holdings is available in the Statement of Additional Information. A copy of proxy policies and procedures are available without charge upon request by calling 1-800-480-4111 and on the SEC’s website at www.sec.gov. The Trustees have delegated the authority to vote proxies for securities owned by the Portfolio to the Advisor. A copy of the Portfolio’s voting record for the most recent 12-month period ended June 30 is available on the SEC’s website at www.sec.gov or at the Portfolio’s website at www.jpmorganfunds.com no later than August 31 of each year. The Portfolio’s proxy voting record will include, among other things, a brief description of the matter voted on for each portfolio security, and will state how each vote was cast, for example, for or against the proposal.
© JPMorgan Chase & Co., 2006 All rights reserved. June 2006. | | SAN-JPMITIMCP-606 |
SEMI-ANNUAL REPORT
SIX MONTHS ENDED JUNE 30, 2006 (UNAUDITED) JPMorgan Insurance Trust | |
|---|
JPMorgan Insurance Trust Large Cap Growth Portfolio
(formerly JPMorgan Investment Trust Large Cap
Growth Portfolio) |
This material must be preceded or accompanied by a current prospectus. | |
CONTENTS | President’s Letter | | | | | 1 | | Portfolio Commentary:
| | | | | | | | JPMorgan Insurance Trust Large Cap Growth Portfolio | | | | | 2 | | | Schedule of Portfolio Investments | | | | | 4 | | | Statement of Assets and Liabilities | | | | | 7 | | | Statement of Operations | | | | | 8 | | | Statement of Changes in Net Assets | | | | | 9 | | | Financial Highlights | | | | | 10 | | | Notes to Financial Statements | | | | | 12 | | | Trustees | | | | | 16 | | | Officers | | | | | 18 | | | Schedule of Shareholder Expenses | | | | | 20 | |
HIGHLIGHTS | • | | U.S. stocks generally positive in first half of 2006 |
| • | | Investors tried to predict interest rate hikes |
| • | | Gross domestic product (GDP) moved sharply higher |
| • | | Market volatility expected until interest rate picture is clearer |
Effective May 1, 2006, the existing shares of the Portfolio were designated as Class 1 shares. The performance, expenses and other information shown in this report for the Portfolio is information applicable to the Class 1 shares. Investments in the Portfolio are not bank deposits or obligations of, or guaranteed or endorsed by, any bank and are not insured or guaranteed by the FDIC, the Federal Reserve Board or any other government agency. You could lose money if you sell when the Portfolio’s share price is lower than when you invested. Past performance is no guarantee for future performance. The general market views expressed in this report are opinions based on current market conditions and are subject to change without notice. These views are not intended to predict the future performance of the Portfolio or the securities markets. References to specific securities and their issuers are for illustrative purposes only and are not intended to be, and should not be interpreted as, recommendations to purchase or sell such securities. Such views are not meant as investment advice and may not be relied on as an indication of trading intent on behalf of any Portfolio. This Portfolio is intended to be a funding vehicle for variable annuity contracts and variable life insurance policies (collectively “Policies”) offered by separate accounts of participating insurance companies. Portfolio shares are also offered to qualified pension and retirement plans (“Eligible Plans”). Individuals may not purchase shares directly from the Portfolio. Prospective investors should refer to the Portfolio’s prospectus for a discussion of the Portfolio’s investment objective, strategies and risks. Call JPMorgan Funds Service Center at 1-800-480-4111 for a prospectus containing more complete information about the Portfolio including management fees and other expenses. Please read it carefully before investing.
PRESIDENT’S LETTER
JULY 14, 2006 (Unaudited)
Dear Shareholder: We are pleased to present this semi-annual report for the JPMorgan Insurance Trust Large Cap Growth Portfolio for the six months ended June 30, 2006. Inside, you’ll find information detailing the performance of the Portfolio, along with a report from the portfolio manager. | | | |
“Despite repeated interest rate hikes and surging energy prices, the U.S. economy was surprisingly resilient.”
|
All Eyes on the Federal Reserve Board While the U.S. stock market weakened late in the reporting period, overall it produced positive returns for the first half of the calendar year. The equity market kicked off 2006 with investors encouraged by overall strong economic growth and positive corporate earnings. However, the last two months were marked by increased volatility. A great deal of the driving forces behind the market’s ups and downs resulted from the actions of the Federal Open Market Committee (FOMC). In February 2006, Ben Bernanke assumed the role of Federal Reserve (Fed) Board Chairman, replacing long-time fixture Alan Greenspan. The transition was less than smooth for investors, as they attempted to predict the FOMC’s future actions regarding interest rates. The FOMC’s statements first hinted that there may be a break from rate increases and then telegraphed additional rate hikes due to fears of rising inflation. In late June, the FOMC raised short-term rates for the 17th consecutive time, bringing the fed funds target rate to 5.25% — its highest level in more than five years. Despite repeated interest rate hikes and surging energy prices, the U.S. economy was surprisingly resilient. After gross domestic product (GDP) fell in the fourth quarter, the economy moved sharply higher in the first quarter of 2006. During this time, GDP rose 5.6%, its highest reading since the third quarter of 2003. Stocks Produce Positive Results The broad stock market, as measured by the S&P 500 Index, returned 2.71% for the six months ended June 30, 2006. After a fast start to the year, the market took a step backwards in mid-May on fears that additional rate hikes may adversely affect the economic expansion and temper corporate profits. Looking more closely at the market over the six months, small- and mid-cap stocks outperformed their large-cap counterparts, with the Russell Midcap, Russell 2000 and Russell 1000 Indexes returning 4.84%, 8.21% and 2.76%, respectively. However, as many market pundits have anticipated, large-cap stocks generated relatively better results late in the period. After a prolonged period of lagging smaller-cap stocks, many large-caps appeared attractively valued and may be better equipped to handle more moderate economic growth. Outlook Looking ahead, the markets could continue to experience periods of volatility until the FOMC’s interest rate stance is better understood. Coinciding with its latest rate hike in June, the Fed said: “The extent and timing of any additional firming...will depend on the evolution of the outlook for both inflation and economic growth, as implied by incoming information.” Investors will likely be closely monitoring the economic “tea leaves” in an attempt to ascertain the FOMC’s next move. On behalf of us all at JPMorgan Asset Management, thank you for your confidence and the continued trust you have placed in us. We look forward to serving your investment needs for many years to come. Should you have any questions, please feel free to contact the JPMorgan Funds Service Center at 1-800-480-4111. George C.W. Gatch
President
JPMorgan Funds JUNE 30, 2006 JPMORGAN INSURANCE TRUST 1
JPMorgan Insurance Trust Large Cap Growth Portfolio
PORTFOLIO COMMENTARY
AS OF JUNE 30, 2006 (Unaudited)
PORTFOLIO FACTS
|
|
|
|
|
|---|
| | | Portfolio Inception | | | | August 1, 1994 | | Fiscal Year End | | | | December 31 | | Net Assets as of 6/30/06 | | | | $215,353,007 | | Primary Benchmark | | | | Russell 1000
Growth Index |
Q: | | HOW DID THE PORTFOLIO PERFORM? |
A: | | The JPMorgan Insurance Trust Large Cap Growth Portfolio, which seeks long-term capital appreciation and growth of income by investing primarily in equity securities, returned –0.86% for the six months ended June 30, 2006.* This is compared with a return of –0.93% for its benchmark, the Russell 1000 Growth Index. |
Q: | | WHY DID THE PORTFOLIO PERFORM THIS WAY? |
A: | | Stock selection in a several sectors added to the Portfolio’s performance, including capital markets, business services and trucking and freight, while pharmaceuticals, business machines and electronics detracted from performance. |
| | Positively contributing to the Portfolio was our overweight in Chicago Mercantile Exchange (CME), the futures financial exchange, which experienced strong trading volume in the increasingly popular futures market. Our overweight in Cognizant Technology, an information technology services provider, also contributed to performance as shares rallied in the period. The company’s business model allowed for above-market growth, relative to its peers. Cognizant continued to deliver strong earnings as demand for offshore delivery remained strong. Our overweight position in Expeditors International, the air freight company, added value to the Portfolio. The company experienced strong revenue growth in the first half of the year due to significant new business internationally. |
| | Detractors to the Portfolio included our overweight in Teva Pharmaceutical, a global pharmaceutical company. Teva has been embroiled in patent litigation with Novartis and also reported a loss due to its acquisition of Ivax. Our underweight in Cisco Systems, the networking company, was a detractor. Cisco’s shares rallied as investors embraced the Scientific-Atlanta transaction and as sales of its data networking switches and routers rose. We are currently underweight in Cisco based on its forecast, which raised concerns that higher spending may negatively affect profits later this year. Our overweight in the semiconductor Broadcom also detracted from performance. Concern over product inventory, as well as an ongoing SEC investigation into Broadcom’s stock-option granting practices, hampered the stock. |
Q: | | HOW WAS THE PORTFOLIO MANAGED? |
A: | | The Portfolio invests mainly in equity securities of large, well-established companies. Large companies are defined as companies with market capitalizations in excess of $4 billion at the time of investment. Typically, the Portfolio invests in companies with a history of above-average growth or companies expected to enter periods of above average growth. Companies are selected based upon such valuation characteristics as price-to-earnings, price-to-sales and price-to-cash flows as compared to their peers and their expected and historic growth rates. Stocks are sold based upon price considerations or when deteriorating fundamentals are expected to be long-term in nature. To help ensure that stock selection is the principal source of the potential excess return in the Portfolio, we typically maintain sector weightings within ±5% relative to the Russell 1000 Growth Index. We also stay fully invested at all times, with frictional cash limited to no more than 5% of Portfolio value. |
| | The Portfolio, which continues to focus on a bottom-up stock selection, has an average market capitalization lower than the benchmark with a forward price/earnings (P/E) ratio similar to the benchmark but with a slightly higher growth rate. |
PORTFOLIO COMPOSITION**
| Information Technology | | | | | 25.7 | % | | Industrials | | | | | 17.4 | | | Health Care | | | | | 14.9 | | | Consumer Discretionary | | | | | 8.9 | | | Financials | | | | | 8.8 | | | Consumer Staples | | | | | 8.1 | | | Energy | | | | | 6.7 | | | Telecommunication Services | | | | | 4.0 | | | Materials | | | | | 3.5 | | | Investments of Cash Collateral for Securities Loaned | | | | | 3.0 | | | Short-Term Investments | | | | | 2.2 | |
TOP TEN EQUITY HOLDINGS OF THE PORTFOLIO**
| 1. | | | | Google, Inc., Class A | | | 3.7 | % | | 2. | | | | Chicago Mercantile Exchange
Holdings, Inc. | | | 3.1 | | | 3. | | | | Corning, Inc. | | | 2.7 | | | 4. | | | | Boeing Co. | | | 2.7 | | | 5. | | | | Altria Group, Inc. | | | 2.5 | | | 6. | | | | Hewlett-Packard Co. | | | 2.5 | | | 7. | | | | Crown Castle International Corp. | | | 2.4 | | | 8. | | | | QUALCOMM, Inc. | | | 2.2 | | | 9. | | | | Microsoft Corp. | | | 2.1 | | | 10. | | | | Cognizant Technology Solutions Corp., Class A | | | 2.1 | |
| * | | The advisor seeks to achieve the Portfolio’s objective. There can be no guarantee it will be achieved. |
| ** | | Percentages indicated are based upon net assets as of June 30, 2006. The portfolio’s composition is subject to change. |
2 JPMORGAN INSURANCE TRUST JUNE 30, 2006
AVERAGE ANNUAL TOTAL RETURNS AS OF JUNE 30, 2006
| | | | INCEPTION DATE
| | 1 YEAR
| | 5 YEAR
| | 10 YEAR
|
|---|
LARGE CAP GROWTH PORTFOLIO | | | | | 08/01/94 | | | | 7.28 | % | | | (1.54 | )% | | | 5.05 | % |
TEN YEAR PERFORMANCE (6/30/96 TO 6/30/06)
Source: Lipper, Inc. The performance quoted is past performance and is not a guarantee of future results. Mutual funds are subject to certain market risk. Investment returns and principal value of an investment will fluctuate so that an investor’s shares, when redeemed, may be worth more or less than their original cost. Current performance may be higher or lower than the performance data shown. For up-to-date month-end performance information please call 1-800-480-4111. The graph illustrates comparative performance for $10,000 invested in the JPMorgan Insurance Trust Large Cap Growth Portfolio and the Russell 1000 Growth Index. The performance of the Portfolio assumes reinvestment of all dividends. The performance of the index does not include fees and expenses attributable to the Portfolio and has been adjusted to reflect reinvestment of all dividends and capital gains of the securities included in the benchmark. The Russell 1000 Growth Index measures the performance of Russell 1000 companies with higher price-to-book ratios and higher forecasted growth values. Investors cannot invest directly in an index. The performance does not reflect any charges imposed by the Policies or Eligible Plans. If these charges were included, the returns would be lower than shown. Performance may also reflect the waiver and reimbursement of the Portfolio’s fees/expenses for certain periods since the inception date. Without these waivers and reimbursements, performance would have been lower. JUNE 30, 2006 JPMORGAN INSURANCE TRUST 3
JPMorgan Insurance Trust Large Cap Growth Portfolio
SCHEDULE OF PORTFOLIO INVESTMENTS
AS OF JUNE 30, 2006 (Unaudited)
SHARES
|
|
|
| SECURITY DESCRIPTION
|
| VALUE($)
|
|---|
Long-Term Investments — 98.0% | | | | | | Common Stocks — 98.0% | | | | | | Aerospace & Defense — 6.1% | | 70,430 | | | | Boeing Co. | | | 5,768,921 | | | 55,140 | | | | General Dynamics Corp. | | | 3,609,464 | | | 51,475 | | | | Lockheed Martin Corp. | | | 3,692,817 | | | | | | | | | | 13,071,202 | | | | | | | Air Freight & Logistics — 2.0% | | 77,590 | | | | Expeditors International of Washington, Inc. | | | 4,345,816 | | | | | | | Beverages — 1.3% | | 47,375 | | | | PepsiCo, Inc. | | | 2,844,395 | | | | | | | Biotechnology — 5.9% | | 52,179 | | | | Amgen, Inc. (a) | | | 3,403,636 | | | 66,550 | | | | Celgene Corp. (a) | | | 3,156,467 | | | 42,620 | | | | Genentech, Inc. (a) | | | 3,486,316 | | | 45,450 | | | | Gilead Sciences, Inc. (a) | | | 2,688,822 | | | | | | | | | | 12,735,241 | | | | | | | Capital Markets — 4.5% | | 26,820 | | | | Franklin Resources, Inc. | | | 2,328,244 | | | 14,000 | | | | Goldman Sachs Group, Inc. | | | 2,106,020 | | | 87,004 | | | | Lazard Ltd., Class A (Bermuda) | | | 3,514,962 | | | 17,300 | | | | Legg Mason, Inc. | | | 1,721,696 | | | | | | | | | | 9,670,922 | | | | | | | Chemicals — 3.1% | | 50,505 | | | | Monsanto Co. | | | 4,252,016 | | | 45,465 | | | | Praxair, Inc. | | | 2,455,110 | | | | | | | | | | 6,707,126 | | | | | | | Commercial Services & Supplies — 2.3% | | 27,360 | | | | Corporate Executive Board Co. (c) | | | 2,741,472 | | | 50,855 | | | | Robert Half International, Inc. | | | 2,135,910 | | | | | | | | | | 4,877,382 | | | | | | | Communications Equipment — 6.2% | | 240,825 | | | | Corning, Inc. (a) | | | 5,825,557 | | | 144,915 | | | | Motorola, Inc. | | | 2,920,037 | | | 116,965 | | | | QUALCOMM, Inc. | | | 4,686,788 | | | | | | | | | | 13,432,382 | | | | | | | Computers & Peripherals — 4.2% | | 65,935 | | | | Apple Computer, Inc. (a) | | | 3,766,207 | | | 168,780 | | | | Hewlett-Packard Co. | | | 5,346,951 | | | | | | | | | | 9,113,158 | | | | | | | Construction Materials — 0.4% | | 11,000 | | | | Vulcan Materials Co. | | | 858,000 | | | | | | | Diversified Financial Services — 3.1% | | 13,540 | | | | Chicago Mercantile Exchange Holdings, Inc. (c) | | | 6,650,171 | | | | | | | Electrical Equipment — 1.2% | | 53,505 | | | | Roper Industries, Inc. (c) | | | 2,501,359 | | | | | | | Energy Equipment & Services — 2.9% | | 45,430 | | | | Schlumberger Ltd. (Netherlands) | | | 2,957,947 | | | 73,030 | | | | Smith International, Inc. (c) | | | 3,247,644 | | | | | | | | | | 6,205,591 | | | | | | | Food & Staples Retailing — 3.8% | | 33,420 | | | | Costco Wholesale Corp. | | | 1,909,285 | | | 141,490 | | | | CVS Corp. | | | 4,343,743 | | | 71,700 | | | | Safeway, Inc. | | | 1,864,200 | | | | | | | | | | 8,117,228 | | | | | | | Health Care Equipment & Supplies — 0.5% | | 11,440 | | | | Alcon, Inc. (Switzerland) | | | 1,127,412 | | | | | | | Health Care Providers & Services — 2.6% | | 30,280 | | | | DaVita, Inc. (a) | | | 1,504,916 | | | 27,280 | | | | Express Scripts, Inc. (a) | | | 1,957,067 | | | 22,570 | | | | Laboratory Corp. of America Holdings (a) | | | 1,404,531 | | | 13,020 | | | | Medco Health Solutions, Inc. (a) | | | 745,786 | | | | | | | | | | 5,612,300 | | | | | | | Hotels, Restaurants & Leisure — 2.9% | | 107,870 | | | | Marriott International, Inc., Class A | | | 4,112,004 | | | 62,605 | | | | McDonald’s Corp. | | | 2,103,528 | | | | | | | | | | 6,215,532 | | | | | | | Household Products — 0.5% | | 18,698 | | | | Procter & Gamble Co. | | | 1,039,609 | | | | | | | Industrial Conglomerates — 1.5% | | 99,425 | | | | General Electric Co. | | | 3,277,048 | | | | | | | Insurance — 1.2% | | 34,170 | | | | Prudential Financial, Inc. | | | 2,655,009 | | | | | | | Internet Software & Services — 3.7% | | 19,190 | | | | Google, Inc., Class A (a) | | | 8,046,943 | | | | | | | IT Services — 3.8% | | 16,640 | | | | Affiliated Computer Services, Inc., Class A (a) (m) | | | 858,790 | | | 58,730 | | | | Automatic Data Processing, Inc. | | | 2,663,405 | | | 67,315 | | | | Cognizant Technology Solutions Corp., Class A (a) | | | 4,535,012 | | | | | | | | | | 8,057,207 | | | | | | | Machinery — 1.5% | | 43,200 | | | | Caterpillar, Inc. | | | 3,217,536 | |
SEE NOTES TO FINANCIAL STATEMENTS.
4 JPMORGAN INSURANCE TRUST JUNE 30, 2006
SHARES
|
|
|
| SECURITY DESCRIPTION
|
| VALUE($)
|
|---|
Long-Term Investments — Continued | | | | | | Multiline Retail — 0.7% | | 39,515 | | | | Nordstrom, Inc. | | | 1,442,297 | | | | | | | Oil, Gas & Consumable Fuels — 3.8% | | 43,130 | | | | EOG Resources, Inc. | | | 2,990,634 | | | 28,100 | | | | Peabody Energy Corp. | | | 1,566,575 | | | 54,585 | | | | Valero Energy Corp. | | | 3,630,994 | | | | | | | | | | 8,188,203 | | | | | | | Pharmaceuticals — 5.8% | | 13,800 | | | | Allergan, Inc. (m) | | | 1,480,188 | | | 27,800 | | | | AstraZeneca plc ADR (United Kingdom) | | | 1,662,996 | | | 22,100 | | | | GlaxoSmithKline plc ADR (United Kingdom) | | | 1,233,180 | | | 35,790 | | | | Johnson & Johnson | | | 2,144,537 | | | 14,900 | | | | Novartis AG ADR (Switzerland) | | | 803,408 | | | 19,500 | | | | Sanofi-Aventis ADR (France) | | | 949,650 | | | 41,500 | | | | Teva Pharmaceutical Industries Ltd. ADR (Israel) (c) | | | 1,310,985 | | | 67,300 | | | | Wyeth | | | 2,988,793 | | | | | | | | | | 12,573,737 | | | | | | | Road & Rail — 2.9% | | 46,400 | | | | Burlington Northern Santa Fe Corp. | | | 3,677,200 | | | 48,500 | | | | Norfolk Southern Corp. | | | 2,581,170 | | | | | | | | | | 6,258,370 | | | | | | | Semiconductors & Semiconductor Equipment — 3.6% | | 37,200 | | | | Broadcom Corp., Class A (a) | | | 1,117,860 | | | 56,385 | | | | Marvell Technology Group Ltd. (Bermuda) (a) | | | 2,499,547 | | | 41,600 | | | | MEMC Electronic Materials, Inc. (a) | | | 1,560,000 | | | 86,425 | | | | Texas Instruments, Inc. | | | 2,617,813 | | | | | | | | | | 7,795,220 | | | | | | | Software — 4.1% | | 26,990 | | | | Adobe Systems, Inc. (a) (m) | | | 819,416 | | | 60,425 | | | | Autodesk, Inc. (a) | | | 2,082,246 | | | 22,400 | | | | Intuit, Inc. (a) | | | 1,352,736 | | | 195,425 | | | | Microsoft Corp. | | | 4,553,402 | | | | | | | | | | 8,807,800 | | | | | | | Specialty Retail — 5.4% | | 32,800 | | | | Best Buy Co., Inc. | | | 1,798,752 | | | 67,685 | | | | Lowe’s Cos., Inc. | | | 4,106,449 | | | 46,235 | | | | Michaels Stores, Inc. | | | 1,906,732 | | | 155,685 | | | �� | Staples, Inc. | | | 3,786,259 | | | | | | | | | | 11,598,192 | | | | | | | Tobacco — 2.5% | | 73,115 | | | | Altria Group, Inc. (m) | | | 5,368,834 | | | | | | | Wireless Telecommunication Services — 4.0% | | 101,500 | | | | America Movil S.A. de C.V., Series L ADR (Mexico) | | | 3,375,890 | | | 150,640 | | | | Crown Castle International Corp. (a) | | | 5,203,106 | | | | | | | | | | 8,578,996 | | | | | | | Total Common Stocks (Cost $184,549,092) | | | 210,990,218 | | Short-Term Investments — 2.2% | | | | | | Investment Company — 2.2% | | 4,712,932 | | | | JPMorgan Liquid Assets Money Market Fund (b) (m) (Cost $4,712,932) | | | 4,712,932 | |
PRINCIPAL
AMOUNT ($)
|
|
|
|
|
|
|
|---|
Investment of Cash Collateral for Securities Loaned — 3.0% | | | | | | Certificates of Deposit — 0.6% | | 200,000 | | | | Credit Suisse First Boston, FRN, 5.33%, 10/17/06 | | | 200,000 | | | 500,000 | | | | Deutsche Bank New York, FRN, 5.41%, 01/22/08 | | | 500,000 | | | 499,737 | | | | Societe Generale, New York, FRN, 5.26%, 06/20/07 | | | 499,737 | | | | | | | | | | 1,199,737 | | | | | | | Corporate Notes — 1.2% | | 500,000 | | | | Bank of America, FRN, 5.31%, 11/07/06 | | | 500,000 | | | 200,000 | | | | Banque Federative Du Credit Mutuel Bank of America Securities LLC, FRN, 5.30%, 07/13/07 | | | 200,000 | | | 100,000 | | | | Beta Finance, Inc., FRN, 5.37%, 01/15/08 | | | 100,000 | | | 500,113 | | | | Beta Finance, Inc., FRN, 5.38%, 03/15/07 | | | 500,113 | | | 550,000 | | | | CDC Financial Products Inc., FRN, 5.41%, 07/31/06 | | | 550,000 | | | 122,165 | | | | Citigroup Global Markets Holding, Inc. FRN, 5.41%, 12/12/06 | | | 122,165 | | | 450,041 | | | | Links Finance LLC, FRN, 5.36%, 10/06/06 | | | 450,041 | | | 183,247 | | | | MBIA Global Funding LLC FRN, 5.42%, 01/26/07 | | | 183,247 | | | | | | | | | | 2,605,566 | | | | | | | Repurchase Agreements — 1.2% | | 1,132,798 | | | | Bank of America Securities LLC, 5.32%, dated 06/30/06, due 07/03/06, repurchase price $1,133,300, collateralized by U.S. Government Agency Mortgages. | | | 1,132,798 | |
SEE NOTES TO FINANCIAL STATEMENTS.
JUNE 30, 2006 JPMORGAN INSURANCE TRUST 5
JPMorgan Insurance Trust Large Cap Growth Portfolio
SCHEDULE OF PORTFOLIO INVESTMENTS
AS OF JUNE 30, 2006 (Unaudited) (continued)
PRINCIPAL
AMOUNT($)
|
|
|
| SECURITY DESCRIPTION
|
| VALUE($)
|
|---|
Investment of Cash Collateral for Securities Loaned — Continued | | | | | | | | | | Repurchase Agreements — Continued | | | | | | 500,000 | | | | Bear Stearns, 5.31%, dated 06/30/06, due 07/03/06, repurchase price $500,221, collateralized by U.S. Government Agency Mortgages. | | | 500,000 | | | 500,000 | | | | Lehman Brothers Inc., 5.32%, dated 06/30/06, due 07/03/06, repurchase price $500,222, collateralized by U.S. Government Agency Mortgages. | | | 500,000 | | | 500,000 | | | | UBS Securities LLC, 5.32%, dated 06/30/06, due 07/03/06, repurchase price $500,222, collateralized by U.S. Government Agency Mortgages. | | | 500,000 | | | | | | | | | | 2,632,798 | | | | | | | Total Investment of Cash Collateral for Securities Loaned
(Cost $6,438,101) | | | 6,438,101 | | | | | | | Total Investments — 103.2%
(Cost $195,700,125) | | | 222,141,251 | | | | | | | Liabilities in Excess of Other Assets — (3.2)% | | | (6,788,244 | ) | | | | | | NET ASSETS — 100.0% | | $ | 215,353,007 | |
_______________
Percentages indicated are based on net assets. ABBREVIATIONS: | (a) | — | Non-income producing security. |
| (b) | — | Investment in affiliate. Money market fund registered under the Investment Company Act of 1940, as amended, and advised by JPMorgan Investment Advisors Inc. |
| (c) | — | Security, or a portion of the security, has been delivered to a counterparty as part of a security lending transaction. |
| (m) | — | All or a portion of this security is segregated for current or potential holdings of futures, swaps, options, TBAs, when-issued securities, delayed delivery securities, and reverse repurchase agreements. |
| ADR | — | American Depositary Receipt. |
| FRN | — | Floating Rate Note. The rate shown is the rate in effect as of June 30, 2006. |
SEE NOTES TO FINANCIAL STATEMENTS.
6 JPMORGAN INSURANCE TRUST JUNE 30, 2006
STATEMENT OF ASSETS AND LIABILITIES
As of June 30, 2006 (Unaudited)
|
|
|
| Large Cap Growth
Portfolio
|
|---|
ASSETS: | | | | | | | | Investments in non-affiliates, at value | | | | $ | 217,428,319 | | | Investments in affiliates, at value | | | | | 4,712,932 | | | Total investment securities, at value | | | | | 222,141,251 | | | Receivables: | | | | | | | | Investment securities sold | | | | | 9,501,199 | | | Portfolio shares sold | | | | | 116,213 | | | Interest and dividends | | | | | 197,579 | | | Prepaid expenses and other assets | | | | | 9,026 | | | Total Assets | | | | | 231,965,268 | | | | LIABILITIES: | | | | | | | | Payables: | | | | | | | | Due to custodian | | | | | 21,201 | | | Investment securities purchased | | | | | 9,894,233 | | | Collateral for securities lending program | | | | | 6,438,101 | | | Portfolio shares redeemed | | | | | 108,898 | | | Accrued liabilities: | | | | | | | | Investment advisory fees | | | | | 111,670 | | | Administration fees | | | | | 17,781 | | | Custodian and accounting fees | | | | | 6,821 | | | Trustees’ and Officers’ fees | | | | | 93 | | | Other | | | | | 13,463 | | | Total Liabilities | | | | | 16,612,261 | | | Net Assets | | | | $ | 215,353,007 | | | | NET ASSETS: | | | | | | | | Paid in capital | | | | $ | 320,942,615 | | | Accumulated undistributed (distributions in excess of) net investment income | | | | | 74,186 | | | Accumulated net realized gains (losses) | | | | | (132,104,920 | ) | | Net unrealized appreciation (depreciation) | | | | | 26,441,126 | | | Total Net Assets | | | | $ | 215,353,007 | | | | | Outstanding units of beneficial interest (shares) (unlimited amount authorized, no par value) | | | | | 15,572,053 | | | Net asset value, offering and redemption price per share | | | | $ | 13.83 | | | | | Cost of investments | | | | $ | 195,700,125 | | | Market value of securities on loan | | | | $ | 6,314,694 | |
SEE NOTES TO FINANCIAL STATEMENTS.
JUNE 30, 2006 JPMORGAN INSURANCE TRUST 7
STATEMENT OF OPERATIONS
For the Six Months Ended June 30, 2006 (Unaudited)
|
|
|
| Large Cap Growth
Portfolio
|
|---|
INVESTMENT INCOME: | | | | | | | | Dividend income | | | | $ | 961,882 | | | Dividend income from affiliates (a) | | | | | 100,767 | | | Income from securities lending (net) | | | | | 7,051 | | | Total investment income | | | | | 1,069,700 | | | | EXPENSES: | | | | | | | | Investment advisory fees | | | | | 738,167 | | | Administration fees | | | | | 149,660 | | | Custodian and accounting fees | | | | | 6,068 | | | Professional fees | | | | | 27,925 | | | Trustees’ and Officers’ fees | | | | | 1,797 | | | Transfer agent fees | | | | | 3,067 | | | Printing and mailing costs | | | | | 43,628 | | | Other | | | | | 12,345 | | | Total expenses | | | | | 982,657 | | | Less earnings credits | | | | | (8 | ) | | Net expenses | | | | | 982,649 | | | Net investment income (loss) | | | | | 87,051 | | | | REALIZED/UNREALIZED GAINS (LOSSES): | | | | | | | | Net realized gain (loss) on transactions from investments | | | | | 1,445,643 | | | Change in net unrealized appreciation (depreciation) of investments | | | | | (2,812,749 | ) | | Net realized/unrealized gains (losses) | | | | | (1,367,106 | ) | | Change in net assets resulting from operations | | | | $ | (1,280,055 | ) |
| (a) | | Includes reimbursements of investment advisory and administration fees. Please see Fees and Other Transactions with Affiliates in the Notes to Financial Statements. |
SEE NOTES TO FINANCIAL STATEMENTS.
8 JPMORGAN INSURANCE TRUST JUNE 30, 2006
STATEMENT OF CHANGES IN NET ASSETS
FOR THE PERIODS INDICATED
| | | | Large Cap Growth Portfolio
| |
|---|
|
|
|
| Six Months Ended
6/30/2006
(Unaudited)
|
| Year Ended
12/31/2005
|
|---|
CHANGE IN NET ASSETS RESULTING FROM OPERATIONS: | | | | | | | | | | | | Net investment income (loss) | | | | $ | 87,051 | | | $ | 164,483 | | | Net realized gain (loss) | | | | | 1,445,643 | | | | (4,357,084 | ) | | Change in net unrealized appreciation (depreciation) of investments | | | | | (2,812,749 | ) | | | 15,043,002 | | | Change in net assets resulting from operations | | | | | (1,280,055 | ) | | | 10,850,401 | | | | DISTRIBUTIONS TO SHAREHOLDERS: | | | | | | | | | | | | From net investment income | | | | | (164,938 | ) | | | (1,147,913 | ) | | | CHANGE IN NET ASSETS FROM CAPITAL TRANSACTIONS: | | | | | | | | | | | | Proceeds from shares issued | | | | | 24,847,551 | | | | 62,244,338 | | | Dividends reinvested | | | | | 164,938 | | | | 1,147,913 | | | Cost of shares redeemed | | | | | (37,601,536 | ) | | | (60,515,553 | ) | | Change in net assets from capital transactions | | | | | (12,589,047 | ) | | | 2,876,698 | | | | NET ASSETS: | | | | | | | | | | | | Change in net assets | | | | | (14,034,040 | ) | | | 12,579,186 | | | Beginning of period | | | | | 229,387,047 | | | | 216,807,861 | | | End of period | | | | $ | 215,353,007 | | | $ | 229,387,047 | | | Accumulated undistributed (distributions in excess of) net investment income | | | | $ | 74,186 | | | $ | 152,073 | | | | SHARE TRANSACTIONS: | | | | | | | | | | | | Issued | | | | | 1,762,546 | | | | 4,793,958 | | | Reinvested | | | | | 11,478 | | | | 92,128 | | | Redeemed | | | | | (2,628,271 | ) | | | (4,692,063 | ) | | Change in shares | | | | | (854,247 | ) | | | 194,023 | |
SEE NOTES TO FINANCIAL STATEMENTS.
JUNE 30, 2006 JPMORGAN INSURANCE TRUST 9
FINANCIAL HIGHLIGHTS
FOR THE PERIODS INDICATED
| | | |
|
|
|
|
|
| Per share operating performance
|
|
|---|
| | | |
| | Investment operations
| | Distributions
|
|
|---|
|
|
|
| Net asset
value,
beginning
of period
|
| Net
investment
income
(loss)
|
| Net realized
and unrealized
gains
(losses) on
investments
|
| Total from
investment
operations
|
| Net
investment
income
|
| Total
distributions
|
|---|
Large Cap Growth Portfolio | | | | | | | | | | | | | | | | | | | | | | | | | | | | Six Months Ended June 30, 2006 (Unaudited) | | | | $ | 13.96 | | | $ | 0.01 | | | $ | (0.13 | ) | | $ | (0.12 | ) | | $ | (0.01 | ) | | $ | (0.01 | ) | | Year Ended December 31, 2005 | | | | | 13.36 | | | | 0.01 | | | | 0.66 | | | | 0.67 | | | | (0.07 | ) | | | (0.07 | ) | | Year Ended December 31, 2004 | | | | | 12.51 | | | | 0.07 | | | | 0.81 | | | | 0.88 | | | | (0.03 | ) | | | (0.03 | ) | | Year Ended December 31, 2003 | | | | | 9.82 | | | | 0.03 | | | | 2.67 | | | | 2.70 | | | | (0.01 | ) | | | (0.01 | ) | | Year Ended December 31, 2002 | | | | | 13.73 | | | | 0.01 | | | | (3.92 | ) | | | (3.91 | ) | | | — | | | | — | | | Year Ended December 31, 2001 | | | | | 20.07 | | | | (0.01 | ) | | | (4.01 | ) | | | (4.02 | ) | | | — | | | | (2.32 | ) |
| (a) | | Annualized for periods less than one year. |
| (b) | | Not annualized for periods less than one year. |
| (c) | | Includes adjustments in accordance with accounting principles generally accepted in the United States of America and as such, the net asset value for financial reporting purposes and the returns based upon those net asset values may differ from the net asset value and returns for shareholder transactions. |
SEE NOTES TO FINANCIAL STATEMENTS.
10 JPMORGAN INSURANCE TRUST JUNE 30, 2006
| |
| Ratios/Supplemental data
|
|
|---|
| | | |
| |
| | Ratios to average net assets (a)
| |
|---|
Net asset
value, end
of period
|
| Total
return (b)(c)
|
| Net assets
end of
period
(000’s)
|
| Net
expenses
|
| Net
investment
income
(loss)
|
| Expenses
without waivers,
reimbursements
and earnings credits
|
| Portfolio
turnover
rate (b)
|
|---|
| $13.83 | | | | | (0.86 | )% | | $ | 215,353 | | | | 0.87 | % | | | 0.08 | % | | | 0.87 | % | | | 32 | % | | 13.96 | | | | | 5.05 | | | | 229,387 | | | | 0.85 | | | | 0.08 | | | | 0.85 | | | | 92 | | | 13.36 | | | | | 7.05 | | | | 216,808 | | | | 0.82 | | | | 0.58 | | | | 0.83 | | | | 95 | | | 12.51 | | | | | 27.54 | | | | 205,662 | | | | 0.81 | | | | 0.26 | | | | 0.83 | | | | 49 | | | 9.82 | | | | | (28.48 | ) | | | 169,693 | | | | 0.92 | | | | 0.68 | | | | 0.93 | | | | 71 | | | 13.73 | | | | | (20.28 | ) | | | 259,557 | | | | 0.81 | | | | (0.06 | ) | | | 0.82 | | | | 75 | |
SEE NOTES TO FINANCIAL STATEMENTS.
JUNE 30, 2006 JPMORGAN INSURANCE TRUST 11
NOTES TO FINANCIAL STATEMENTS
AS OF JUNE 30, 2006 (Unaudited)
1. Organization JPMorgan Insurance Trust (formerly JPMorgan Investment Trust) (the “Trust”) is registered under the Investment Company Act of 1940, as amended (the “1940 Act”), as an open-end management investment company established as a Massachusetts business trust. The JPMorgan Insurance Trust Large Cap Growth Portfolio is a separate Portfolio of the Trust (the “Portfolio”). Effective May 1, 2006, the Board of Trustees approved the name change from JPMorgan Investment Trust Large Cap Growth Portfolio to JPMorgan Insurance Trust Large Cap Growth Portfolio and designated the existing shares as Class 1 shares. Portfolio shares are offered only to separate accounts of participating insurance companies and eligible plans. Individuals may not purchase shares directly from the Portfolio. 2. Significant Accounting Policies The following is a summary of significant accounting policies followed by the Trust in preparation of its financial statements. The policies are in accordance with accounting principles generally accepted in the United States of America. The preparation of financial statements requires management to make estimates and assumptions that affect the reported amounts of assets and liabilities at the date of the financial statements and the reported amounts of income and expenses for the period. Actual results could differ from those estimates. A. Valuation of Investments — Listed securities are valued at the last sale price on the exchange on which they are primarily traded. The value of National Market Systems equity securities quoted by the NASDAQ Stock Market shall generally be the NASDAQ Official Closing Price. Unlisted securities are valued at the last sale price provided by an independent pricing agent or principal market maker. Listed securities for which the latest sales prices are not available are valued at the mean of the latest bid and ask price as of the closing of the primary exchange where such securities are normally traded. Corporate debt securities, debt securities issued by the U.S. Treasury or a U.S. government agency (other than short-term investments maturing in 61 days or less), and municipal securities are valued each day based on readily available market quotations received from third party broker-dealers of comparable securities or independent or affiliated pricing services approved by the Board of Trustees. Such pricing services and broker-dealers generally provide bid-side quotations. Generally, short-term investments (other than certain high yield securities) maturing in 61 days or less are valued at amortized cost, which approximates market value. Futures, options and other derivatives are valued on the basis of available market quotations. Investments in other open-end investment companies are valued at such investment company’s current day closing net asset value per share. Securities or other assets for which market quotations are not readily available or for which market quotations do not represent the value at the time of pricing (including certain illiquid securities) are fair valued in accordance with procedures established by and under the supervision and responsibility of the Trustees. Trading in securities on most foreign exchanges and over-the-counter markets is normally completed before the close of the domestic market and may also take place on days when the domestic market is closed. In accordance with procedures adopted by the Trustees, the Portfolio applies fair value pricing on a daily basis except for North American, Central American, South American and Caribbean equity securities held in its portfolio by utilizing the quotations of an independent pricing service, unless the Portfolio’s adviser determines that use of another valuation methodology is appropriate. The pricing service uses statistical analyses and quantitative models to adjust local market prices using factors such as subsequent movement and changes in the prices of indices, securities and exchange rates in other markets, in determining fair value as of the time the Portfolio calculates its net asset value. B. Repurchase Agreements — The Portfolio may enter into repurchase agreement transactions with institutions that meet the advisor’s credit guidelines. Each repurchase agreement is valued at amortized cost. The Portfolio requires that the collateral received in a repurchase agreement transaction be transferred to a custodian in a manner sufficient to enable the Portfolio to obtain collateral in the event of a counterparty default. If the counterparty defaults and the fair value of the collateral declines, realization of the collateral by the Portfolio may be delayed or limited. C. Securities Lending — To generate additional income, the Portfolio may lend up to 33-1/3% of its assets pursuant to agreements (“borrower agreements”) requiring that the loan be continuously secured by cash or securities issued by the U.S. government or its agencies or instrumentalities (“U.S. government securities”). JPMorgan Chase Bank, N.A. (“JPMCB”), an affiliate of the Portfolio, serves as lending agent pursuant to a Securities Lending Agreement approved by the Board of Trustees (the “Securities Lending Agreement”). Under the Securities Lending Agreement, JPMCB acting as agent for the Portfolio, loans securities to approved borrowers pursuant to approved borrower agreements in exchange for collateral equal to at least 100% of the market value of the loaned securities plus accrued interest. During the term of the loan, the Portfolio receives payments from borrowers equivalent to the dividends and interest that would have been earned on securities lent while simultaneously seeking to earn income on the investment of cash collateral in accordance with investment guidelines contained in the Securities Lending Agreement. For loans secured by cash, the Portfolio retains the interest on cash collateral investments but is required to pay the borrower a portion of such interest for the use of the cash collateral. For loans secured by U.S. government securities, the borrower pays a borrower fee to the lending agent on behalf of the Portfolio. The net income earned on the securities lending (after payment of rebates and the lending agent’s fee) is included in the Statement of Operations as Income from securities lending (net). Information on the investment of cash collateral is shown in the Schedule of Portfolio Investments. 12 JPMORGAN INSURANCE TRUST JUNE 30, 2006
Under the Securities Lending Agreement, JPMCB is entitled to a fee equal to (i) 0.06% calculated on an annualized basis and accrued daily, based upon the value of collateral received from borrowers for each loan of U.S. securities outstanding during a given month; and (ii) 0.1142% calculated on an annualized basis and accrued daily, based upon the value of collateral received from borrowers for each loan of non-U.S. securities outstanding during a given month. For the period ended June 30, 2006, JPMCB voluntarily reduced its fees to: (i) 0.05% for each loan of U.S. securities and (ii) 0.10% for each loan of non-U.S. securities, respectively. Risks of delay in recovery of securities or even loss of rights in the securities may occur should the borrower of the securities fail financially. Risks may also arise to the extent that the value of the securities loaned increases above the value of the collateral received. JPMCB will indemnify the Portfolio from losses resulting from a borrower’s failure to return a loaned security when due. Such indemnification does not extend to losses associated with declines in the value of cash collateral investments. Loans are subject to termination by the Portfolio or the borrower at any time, and are, therefore, not considered to be illiquid investments. As of June 30, 2006, the Portfolio had securities with the following market values on loan, received the following collateral and for the period then ended, paid the following amounts to related party affiliates:
|
| Lending
Agent
Fees Paid
|
| Market
Value of
Collateral
|
| Market Value
of Loaned
Securities
|
|
|---|
| | | | $2,827
| | $6,438,101
| | $6,314,694
|
D. Security Transactions and Investment Income — Investment transactions are accounted for on the trade date (the date the order to buy or sell is executed). Securities gains and losses are calculated on a specifically identified cost basis. Interest income is determined on the basis of coupon interest accrued using the effective interest method adjusted for amortization of premiums and accretion of discounts. Dividend income less foreign taxes withheld (if any) is recorded on the ex-dividend date or when the Portfolio first learns of the dividend. E. Allocation of Expenses — Expenses directly attributable to the Portfolio are charged directly to the Portfolio while the expenses attributable to more than one portfolio of the Trust are allocated among the respective portfolios. F. Federal Income Taxes — The Portfolio is treated as a separate taxable entity for Federal income tax purposes. The Portfolio’s policy is to comply with the provisions of the Internal Revenue Code of 1986, as amended (the ���Code”), applicable to regulated investment companies and to distribute to shareholders all of its distributable net investment income and net realized gain on investments. Accordingly, no provision for Federal income tax is necessary. The Portfolio is also a segregated Portfolio of assets for insurance purposes and intends to comply with the diversification requirements at Subchapter L of the Code. G. Distributions to Shareholders — Dividends from net investment income and distributions of net realized capital gains, if any, are generally declared and paid at least annually. The amount of dividends and distributions from net investment income and net realized capital gains is determined in accordance with Federal income tax regulations, which may differ from accounting principles generally accepted in the United States of America. To the extent these “book/tax” differences are permanent in nature (i.e., that they result from other than timing of recognition — “temporary differences”), such amounts are reclassified within the capital accounts based on their Federal tax-basis treatment. H. New Accounting Pronouncement — In July 2006, the Financial Accounting Standards Board issued Interpretation No. 48, “Accounting for Uncertainty in Income Taxes — an Interpretation of FASB Statement No. 109” (the “Interpretation”). The Interpretation establishes for all entities, including pass-through entities such as the Portfolio, a minimum threshold for financial statement recognition of the benefit of positions taken in filing tax returns (including whether an entity is taxable in a particular jurisdiction), and requires certain expanded tax disclosures. The Interpretation is effective for fiscal years beginning after December 15, 2006, and is to be applied to all open tax years as of the date of effectiveness. Management has recently begun to evaluate the application of the Interpretation to the Portfolio, and is not in a position at this time to estimate the significance of its impact, if any, on the Portfolio’s financial statements. 3. Fees and Other Transactions with Affiliates A. Investment Advisory Fee — Pursuant to the Investment Advisory Agreement, JPMorgan Investment Advisors Inc. (the “Advisor”) acts as the investment advisor to the Portfolio. The Advisor is an indirect wholly-owned subsidiary of JPMorgan Chase & Co. (“JPMorgan”). The Advisor supervises the investments of the Portfolio and for such services is paid a fee. The fee is accrued daily and paid monthly based on the Portfolio’s average daily net assets at an annual fee rate of 0.65%. The Advisor waived and/or reimbursed Investment Advisory fees as outlined in Note 3.E. The Portfolio may invest in one or more money market funds advised by the Advisor or its affiliates. Advisory and administrative fees are waived and/or reimbursed to the Portfolio in an amount sufficient to offset any doubling up of these fees related to the Portfolio’s investment in an affiliated money market fund to the extent required by law. B. Administration Fee — Pursuant to an Administration Agreement, JPMorgan Funds Management, Inc. (the “Administrator”), an indirect, wholly-owned subsidiary of JPMorgan, provides certain administration services to the Portfolio. In consideration of these services, the Administrator receives a fee computed daily and paid monthly at the annual rate of 0.15% of the first $25 billion of the average daily net assets of JUNE 30, 2006 JPMORGAN INSURANCE TRUST 13
NOTES TO FINANCIAL STATEMENTS
AS OF JUNE 30, 2006 (Unaudited) (continued)
all funds in the JPMorgan Fund Complex (excluding funds of funds and money market funds) and 0.075% of the average daily net assets in excess of $25 billion of all such funds.
The Administrator waived and/or reimbursed Administration fees as outlined in Note 3.E. Prior to May 1, 2006, the Administrator provided services for a fee computed daily and paid monthly at the annual rate of 0.18% of the first $250 million of the average daily net assets of the Trust (excluding the Equity Index Portfolio) and 0.14% of the average daily net assets of the Trust in excess of $250 million (excluding the Equity Index Portfolio). J.P. Morgan Investor Services, Co. (”JPMIS“), an indirect, wholly owned subsidiary of JPMorgan, serves as the Portfolio’s Sub-administrator (the “Sub-administrator”). For its services as Sub-administrator, JPMIS receives a portion of the fees payable to the Administrator. Prior to May 1, 2006, JPMIS also received a portion of the fees payable to the Administrator as compensation for fund accounting services. C. Distribution Fees — Pursuant to a Distribution Agreement, JPMorgan Distribution Services, Inc. (the “Distributor”), a wholly-owned subsidiary of JPMorgan, serves as the Trust’s exclusive underwriter and promotes and arranges for the sale of the Portfolio’s shares. The Distributor receives no compensation in its capacity as the Portfolio’s underwriter. D. Custodian and Accounting Fees — JPMCB provides portfolio custody and accounting services for the Portfolio. The amounts paid directly to JPMCB by the Portfolio for custody and accounting services are included in custodian and accounting fees in the Statement of Operations. (Effective May 1, 2006, the Portfolio began paying the fees for accounting services directly to JPMCB.) The custodian fees may be reduced by credits earned by the Portfolio, based on uninvested cash balances held by the custodian. Such earnings credits are included separately in the Statement of Operations. Interest expense, if any, paid to the custodian related to cash overdrafts is presented as interest expense in the Statement of Operations. E. Waivers and Reimbursements — The Advisor and Administrator have contractually agreed to waive fees or reimburse the Portfolio to the extent that total annual operating expenses (excluding dividend expenses on short sales, interest, taxes, extraordinary expenses and expenses related to the Board of Trustees’ deferred compensation plan) exceed 0.90% (0.95% prior to May 1, 2006) of the Portfolio’s average daily net assets. The contractual expense limitation agreements were in effect for the six months ended June 30, 2006. The new expense limitation percentage above is in place until at least April 30, 2007. No fees or expenses were waived or reimbursed by the Advisor or Administrator for the six months ended June 30, 2006. F. Other — Certain officers of the Trust are affiliated with the Advisor, the Administrator, the Sub-Administrator and the Distributor. Such officers, with the exception of the Chief Compliance Officer, receive no compensation from the Portfolio for serving in their respective roles. The Board of Trustees appointed a Chief Compliance Officer to the Portfolio in accordance with federal securities regulations. The Portfolio, along with other affiliated portfolios, make reimbursement payments, on a pro-rata basis, to the Administrator for a portion of the fees associated with the Office of the Chief Compliance Officer. Such fees are included in Trustees’ and Officers’ Fees in the Statement of Operations. The Trust adopted a Trustee Deferred Compensation Plan (the “Plan”) which allows the independent Trustees to defer the receipt of all or a portion of compensation related to performance of their duties as a Trustee. The deferred fees are invested in various JPMorgan funds until distribution in accordance with the Plan. During the period, the Portfolio may have purchased securities from an underwriting syndicate in which the principal underwriter or members of the syndicate are affiliated with the Advisor. The Portfolio may use related party brokers/dealers. For the six months ended June 30, 2006, the Portfolio did not incur any brokerage commissions with brokers/dealers affiliated with the Advisor. The SEC has granted an exemptive order permitting the Portfolio to engage in principal transactions with J.P. Morgan Securities, Inc., an affiliated broker, involving taxable money market instruments subject to certain conditions. 4. Investment Transactions During the six months ended June 30, 2006, purchases and sales of investments (excluding short-term investments) were as follows:
|
|
|
| Purchases
(excluding U.S.
Government)
|
| Sales
(excluding U.S.
Government)
|
|---|
| | | | | $ | 70,981,409 | | | $ | 83,194,958 | |
During the six months ended June 30, 2006, there were no purchases or sales of U.S. Government securities. 14 JPMORGAN INSURANCE TRUST JUNE 30, 2006
5. Federal Income Tax Matters For Federal income tax purposes, the cost and unrealized appreciation (depreciation) in value of the investment securities at June 30, 2006, were as follows:
|
|
|
| Aggregate
Cost
|
| Gross
Unrealized
Appreciation
|
| Gross
Unrealized
Depreciation
|
| Net Unrealized
Appreciation
(Depreciation)
|
|---|
| | | | | $ | 195,700,125 | | | $ | 31,054,822 | | | $ | (4,613,696 | ) | | $ | 26,441,126 | |
The Trust and JPMCB have entered into a financing arrangement. Under this arrangement, JPMCB provides an unsecured, uncommitted credit facility in the aggregate amount of $100 million to certain of the JPMorgan Funds including the Portfolio. Advances under the arrangement are taken primarily for temporary or emergency purposes, including the meeting of redemption requests that otherwise might require the untimely disposition of securities, and are subject to the Portfolio’s borrowing restrictions. Interest on borrowings is payable at a rate determined by JPMCB at the time of borrowing. This agreement has been extended until November 21, 2006. The Portfolio had no borrowings outstanding at June 30, 2006, or at any time during the six months ended. 7. Concentrations and Indemnifications In the normal course of business, the Portfolio enters into contracts that contain a variety of representations which provide general indemnifications. The Portfolio’s maximum exposure under these arrangements is unknown, as this would involve future claims that may be made against the Portfolio that have not yet occurred. However, based on experience, the Portfolio expects the risk of loss to be remote. From time to time, the Portfolio may have a concentration of several shareholders holding a significant percentage of shares outstanding. Investment activities of these shareholders could have a material impact on the Portfolio. 8. Subsequent Event As approved by the Portfolio’s Board of Trustees, a special meeting of shareholders of the JPMorgan Insurance Trust Large Cap Growth Portfolio (the ”meeting“) is scheduled to be held on September 22, 2006. Shareholders of record of the Portfolio at the close of business on June 30, 2006 are entitled to vote at the meeting. At the meeting, shareholders of the Portfolio will be asked to approve the replacement of the Portfolio’s current fundamental investment objective with a new nonfundamental investment objective that can be changed in the future without shareholder approval. If approved by Portfolio shareholders, the Portfolio’s new investment objective would seek long-term capital growth. In addition, if the new investment objective is approved, the Portfolio will change its name, modify its investment strategy and process and change its portfolio management team. One of the results, if all the changes are implemented, will be that the Portfolio will no longer be required to invest, under normal circumstances, at least 80% of its assets in equity securities of large, well-established companies. JUNE 30, 2006 JPMORGAN INSURANCE TRUST 15
TRUSTEES
(Unaudited)
The Portfolio’s Statement of Additional Information includes additional information about the Portfolio’s Trustees and is available, without charge, upon request by calling 1-800-480-4111 or on the Portfolio’s website at www.jpmorganfunds.com. Name (Year of Birth);
Positions With
the Portfolio
|
|
|
| Principal Occupations
During Past 5 Years
|
| Number of
Portfolios/Funds
in JPMorgan
Funds Complex (1)
Overseen by Trustee
|
| Other Directorships Held
Outside Fund Complex
|
|---|
Independent Trustees | | William J. Armstrong (1941); Trustee of Trust since 2005; Trustee of heritage JPMorgan Funds since 1987. | | | | Retired; CFO and Consultant, EduNeering, Inc. (internet business education supplier) (2000–2001); Vice President and Treasurer, Ingersoll–Rand Company (manufacturer of industrial equipment) (1972–2000). | | 120 | | None. | | Roland R. Eppley, Jr. (1932); Trustee of Trust since 2005; Trustee of heritage JPMorgan Funds since 1989. | | | | Retired; President and Chief Executive Officer, Eastern States Bankcard (1971–1988). | | 120 | | None. | | John F. Finn (1947); Trustee of Trust since 2005; Trustee of heritage One Group Mutual Funds since 1998. | | | | President and Chief Executive Officer, Gardner, Inc. (wholesale distributor to outdoor power equipment industry) (1979–present). | | 120 | | Director, Cardinal Health, Inc (CAH) (1994–present); Chairman, The Columbus Association for the Performing Arts (CAPA) (2003–present). | | Dr. Matthew Goldstein (1941); Trustee of Trust since 2005; Trustee of heritage JPMorgan Funds since 2003. | | | | Chancellor of the City University of New York (1999–present); President, Adelphi University (New York) (1998–1999). | | 120 | | Director, Albert Einstein School of Medicine (1998–present); Director, New Plan Excel Realty Trust, Inc. (real estate investment trust)
(2000–present); Director, Lincoln Center Institute for the Arts in Education (1999–present). | | Robert J. Higgins (1945); Trustee of Trust since 2005; Trustee of heritage JPMorgan Funds since 2002. | | | | Retired; Director of Administration of the State of Rhode Island (2003–2004); President — Consumer Banking and Investment Services, Fleet Boston Financial (1971–2001). | | 120 | | None. | | Peter C. Marshall (1942); Trustee of Trust since 2005; Trustee of heritage One Group Mutual Funds since 1994. | | | | Self-employed business consultant (2002–present); Senior Vice President, W.D. Hoard, Inc. (corporate parent of DCI Marketing, Inc.) (2000–2002); President, DCI Marketing, Inc. (1992–2000). | | 120 | | None. | | Marilyn McCoy (1948); Trustee of Trust since 2005; Trustee of heritage One Group Mutual Funds since 1999. | | | | Vice President of Administration and Planning, Northwestern University (1985–present). | | 120 | | Trustee, Mather LifeWays (1994–present); Trustee, Carleton College (2003–present). | | William G. Morton, Jr. (1937); Trustee of Trust since 2005; Trustee of heritage JPMorgan Funds since 2003. | | | | Retired; Chairman Emeritus (2001–2002), and Chairman and Chief Executive Officer, Boston Stock Exchange (1985–2001). | | 120 | | Director, Radio Shack Corporation (electronics) (1987–present); Director, The National Football Foundation and College Hall of Fame (1994–present); Trustee, Stratton Mountain School (2001–present). |
16 JPMORGAN INSURANCE TRUST JUNE 30, 2006
Name (Year of Birth);
Positions With
the Portfolio
|
|
|
| Principal Occupations
During Past 5 Years
|
| Number of
Portfolios/Funds
in JPMorgan
Funds Complex (1)
Overseen by Trustee
|
| Other Directorships Held
Outside Fund Complex
|
|---|
Independent Trustees | | Robert A. Oden, Jr. (1946); Trustee of Trust since 2005; Trustee of heritage One Group Mutual Funds since 1997. | | | | President, Carleton College (2002–present); President, Kenyon College (1995–2002). | | 120 | | Director, American University in Cairo. | | Fergus Reid, III (1932); Trustee of Trust (Chairman) since 2005; Trustee (Chairman) of heritage JPMorgan Funds since 1987. | | | | Chairman, Lumelite Corporation (plastics manufacturing) (2003–present); Chairman and Chief Executive Officer, Lumelite Corporation (1985–2002). | | 120 | | Trustee, Morgan Stanley Funds (198 portfolios) (1995–present). | | Frederick W. Ruebeck (1939); Trustee of Trust since 2005; Trustee of heritage One Group Mutual Funds since 1994. | | | | Advisor, Jerome P. Green & Associates, LLC (broker-dealer) (2000–present); Chief Investment Officer, Wabash College (2004–present); self-employed consultant (2000–present); Director of Investments, Eli Lilly and Company (1988–1999). | | 120 | | Trustee, Wabash College (1988–present); Chairman, Indianapolis Symphony Orchestra Foundation (1994–present). | | James J. Schonbachler (1943); Trustee of Trust since 2005; Trustee of heritage JPMorgan Funds since 2001. | | | | Retired; Managing Director of Bankers Trust Company (financial services) (1968–1998). | | 120 | | None. | Interested Trustee | | Leonard M. Spalding, Jr.* (1935); Trustee of Trust since 2005; Trustee of heritage JPMorgan Funds since 1998. | | | | Retired; Chief Executive Officer of Chase Mutual Funds (investment company) (1989–1998); President & Chief Executive Officer, Vista Capital Management (investment management) (1990–1998); Chief Investment Executive, Chase Manhattan Private Bank (investment management) (1990–1998). | | 120 | | Director, Glenview Trust Company, LLC (2001–present); Trustee, St. Catherine College (1998–present); Trustee, Bellarmine University (2000–present); Director, Springfield-Washington County Economic Development Authority (1997–present); Trustee, Marion and Washington County, Kentucky Airport Board (1998–present); Trustee, Catholic Education Foundation (2005–present). |
| (1) | | A Fund Complex means two or more registered investment companies that hold themselves out to investors as related companies for purposes of investment and investor services or have a common investment adviser or have an investment adviser that is an affiliated person of the investment adviser of any of the other registered investment companies. The JPMorgan Funds Complex which the Board of Trustees currently oversees includes eight registered investment companies (120 portfolios/funds). |
| * | | Mr. Spalding is deemed to be an “interested person” due to his ownership of JPMorgan Chase stock. |
The contact address for each of the Trustees is 245 Park Avenue, New York, NY 10167. JUNE 30, 2006 JPMORGAN INSURANCE TRUST 17
OFFICERS
(Unaudited)
Name (Year of Birth),
Positions Held with
the Trust
|
|
|
| Principal Occupations During Past 5 Years
|
|---|
George C.W. Gatch (1962),
President since 2005 | | | | Managing Director, JPMorgan Investment Management Inc.; Director and President, JPMorgan Distribution Services, Inc. and JPMorgan Funds Management, Inc. since 2005. Mr. Gatch is CEO and President of JPMorgan Funds. Mr. Gatch has been an employee since 1986 and has held positions such as President and CEO of DKB Morgan, a Japanese mutual fund company which was a joint venture between J.P. Morgan and Dai-Ichi Kangyo Bank, as well as positions in business management, marketing and sales. | Robert L. Young (1963),
Senior Vice President since 2005* | | | | Director and Vice President, JPMorgan Distribution Services, Inc. and JPMorgan Funds Management, Inc.; Chief Operating Officer, JPMorgan Funds since 2005, and One Group Mutual Funds from 2001 until 2005. Mr. Young was Vice President and Treasurer, JPMorgan Funds Management, Inc. (formerly One Group Administrative Services) and Vice President and Treasurer, JPMorgan Distribution Services, Inc. (formerly One Group Dealer Services, Inc.) from 1999 to 2005. | Patricia A. Maleski (1960),
Vice President and Chief
Administrative Officer since 2005 | | | | Managing Director, JPMorgan Funds Management, Inc.; previously, Treasurer, JPMorgan Funds and Head of Funds Administration and Board Liaison. Ms. Maleski was Vice President of Finance for the Pierpont Group, Inc. from 1996–2001, an independent company owned by the Board of Directors/Trustees of the JPMorgan Funds, prior to joining J.P. Morgan Chase & Co. in 2001. | Stephanie J. Dorsey (1969),
Treasurer since 2005* | | | | Vice President, JPMorgan Funds Management, Inc.; Director of Mutual Fund Administration, JPMorgan Funds Management, Inc. (formerly One Group Administrative Services), from 2004 to 2005; Ms. Dorsey worked for JPMorgan Chase & Co., (formerly Bank One Corporation) from 2003 to 2004; prior to joining Bank One Corporation, she was a Senior Manager specializing in Financial Services audits at PricewaterhouseCoopers LLP from 1992 through 2002. | Stephen M. Ungerman (1953),
Senior Vice President and Chief
Compliance Officer since 2005
| | | | Senior Vice President, JPMorgan Chase & Co.; Mr. Ungerman was head of Fund Administration — Pooled Vehicles from 2000 to 2004. Mr. Ungerman held a number of positions in Prudential Financial’s asset management business prior to 2000. | Paul L. Gulinello (1950), AML
Compliance Officer since 2005 | | | | Vice President and Anti Money Laundering Compliance Officer for JPMorgan Asset Management Americas, additionally responsible for personal trading and compliance testing since 2004; Treasury Services Operating Risk Management and Compliance Executive supporting all JPMorgan Treasury Services business units from July 2000 to 2004. | Stephen M. Benham (1959),
Secretary since 2005 | | | | Vice President and Assistant General Counsel, JPMorgan Chase & Co. since 2004; Vice President (Legal Advisory) of Merrill Lynch Investment Managers, L.P. from 2000 to 2004; attorney associated with Kirkpatrick & Lockhart LLP from 1997 to 2000. | Elizabeth A. Davin (1964),
Assistant Secretary since 2005* | | | | Vice President and Assistant General Counsel, JPMorgan Chase & Co. since 2005; Senior Counsel, JPMorgan Chase & Co. (formerly Bank One Corporation) from 2004 to 2005; Assistant General Counsel and Associate General Counsel and Vice President, Gartmore Global Investments, Inc. from 1999 to 2004. | Jessica K. Ditullio (1962),
Assistant Secretary since 2005* | | | | Vice President and Assistant General Counsel, JPMorgan Chase & Co. since 2005; Ms. Ditullio has served as an attorney with various titles for JPMorgan Chase & Co. (formerly Bank One Corporation) since 1990. | Nancy E. Fields (1949),
Assistant Secretary since 2005* | | | | Vice President, JPMorgan Funds Management, Inc. and JPMorgan Distribution Services, Inc.; From 1999 to 2005, Director, Mutual Fund Administration, JPMorgan Funds Management, Inc. (formerly One Group Administrative Services, Inc.) and Senior Project Manager, Mutual Funds, JPMorgan Distribution Services, Inc. (formerly One Group Dealer Services, Inc.). | Michael C. Raczynski (1975),
Assistant Secretary (2006) | | | | Vice President and Assistant General Counsel, JPMorgan Chase & Co. since 2006; Associate, Stroock & Stroock & Lavan LLP from 2001 to 2006. | Ellen W. O’Brien (1957),
Assistant Secretary since 2005** | | | | Assistant Vice President, JPMorgan Investor Services, Co., responsible for Blue Sky registration. Ms. O’Brien has served in this capacity since joining the firm in 1991. |
18 JPMORGAN INSURANCE TRUST JUNE 30, 2006
Name (Year of Birth),
Positions Held with
the Trust
|
|
|
| Principal Occupations During Past 5 Years
|
|---|
Suzanne E. Cioffi (1967),
Assistant Treasurer since 2005 | | | | Vice President, JPMorgan Funds Management, Inc., responsible for mutual fund financial reporting. Ms. Cioffi has overseen various fund accounting, custody and administration conversion projects during the past five years. | Arthur A. Jensen (1966),
Assistant Treasurer since 2005* | | | | Vice President, JPMorgan Funds Management, Inc. since April 2005; formerly, Vice President of Financial Services of BISYS Fund Services, Inc. from 2001 until 2005; Mr. Jensen was Section Manager at Northern Trust Company and Accounting Supervisor at Allstate Insurance Company prior to 2001. |
The contact address for each of the officers, unless otherwise noted, is 245 Park Avenue, New York, NY 10167. | * | | The contact address for the officer is 1111 Polaris Parkway, Columbus, OH 43271. |
| ** | | The contact address for the officer is 73 Tremont Street, Floor 1, Boston MA 02108. |
JUNE 30, 2006 JPMORGAN INSURANCE TRUST 19
SCHEDULE OF SHAREHOLDER EXPENSES
(Unaudited)
Hypothetical $1,000 Investment at Beginning of Period
June 30, 2006
As a shareholder of the Portfolio, you incur ongoing costs, including investment advisory fees, administration fees and other Portfolio expenses. Because the Portfolio is a funding vehicle for Policies and Eligible Plans, you may also incur sales charges and other fees relating to the Policies or Eligible Plans. The examples below are intended to help you understand your ongoing costs (in dollars) of investing in the Portfolio, but not the costs of the Policies or Eligible Plans, and to compare these ongoing costs with the ongoing costs of investing in other mutual funds. The examples assume that you had a $1,000 investment in the Portfolio at the beginning of the reporting period, January 1, 2006, and continued to hold your shares at the end of the reporting period, June 30, 2006. Actual Expenses The first line provides information about actual account values and actual expenses. You may use the information in this line, together with the amount you invested, to estimate the expenses that you paid over the period. Simply divide your account value by $1,000 (for example, an $8,600 account value divided by $1,000 = 8.6), then multiply the result by the number in the first line under the heading entitled “Expenses Paid During Period” to estimate the expenses you paid on your account during this period. Hypothetical Example for Comparison Purposes The second line in the table below provides information about hypothetical account values and hypothetical expenses based on the actual expense ratio and an assumed rate of return of 5% per year before expenses, which is not the Portfolio’s actual return. The hypothetical account values and expenses may not be used to estimate the actual ending account balance or expenses you paid for the period. You may use this information to compare the ongoing costs of investing in the Portfolio and other portfolios. To do so, compare this 5% hypothetical example with the 5% hypothetical examples that appear in the shareholder reports of the other funds. Please note that the expenses shown in the table are meant to highlight your ongoing costs only and do not reflect any transaction costs, such as sales charges (loads) or redemption fees or the costs associated with the Policies and Eligible Plans through which the Portfolio is held. Therefore, the second line in the table is useful in comparing ongoing costs only, and will not help you determine the relative total costs of owning different portfolios. In addition, if these transaction costs were included, your costs would have been higher. The examples also assume all dividends and distributions have been reinvested.
|
|
|
| Beginning
Account Value,
January 1, 2006
|
| Ending
Account Value,
June 30, 2006
|
| Expenses
Paid During
Period January 1 to
June 30, 2006*
|
| Annualized
Expense Ratio
|
|---|
Large Cap Growth Portfolio | | Actual | | | | $ | 1,000.00 | | | $ | 991.40 | | | $ | 4.30 | | | | 0.87 | % | | Hypothetical | | | | | 1,000.00 | | | | 1,020.48 | | | | 4.36 | | | | 0.87 | |
| * | | Expenses are equal to the Portfolio’s annualized expense ratio, multiplied by the average account value over the period, multiplied by 181/365 (to reflect the one-half year period). |
20 JPMORGAN INSURANCE TRUST JUNE 30, 2006
JPMorgan Funds are distributed by JPMorgan Distribution Services, Inc., which is an affiliate of JPMorgan Chase & Co. Affiliates of JPMorgan Chase & Co. receive fees for providing various services to the funds. This report is submitted for the general information of the shareholders of the Portfolio. It is not authorized for distribution to prospective investors in the Portfolio unless preceded or accompanied by a prospectus. Contact JPMorgan Funds Distribution Services at 1-800-480-4111 for a portfolio prospectus. You can also visit us at www.jpmorganfunds.com. Investors should carefully consider the investment objectives and risk as well as charges and expenses of the mutual fund before investing. The prospectus contains this and other information about the mutual fund. Read the prospectus carefully before investing. The Portfolio files a complete schedule of its portfolio holdings for the first and third quarters of its fiscal year with the SEC on Form N-Q. The Portfolio’s Forms N-Q are available on the SEC’s website at http://www.sec.gov and may be reviewed and copied at the SEC’s Public Reference Room in Washington, DC. Information on the operation of the SEC’s Public Reference Room may be obtained by calling 1-800-SEC-0330. Shareholders may request the Form N-Q without charge by calling 1-800-480-4111 or by visiting the variable insurance portfolio section of the JPMorgan Funds’ website at www.jpmorganfunds.com. A description of the Portfolio’s policies and procedures with respect to the disclosure of the Portfolio’s holdings is available in the Statement of Additional Information. A copy of proxy policies and procedures are available without charge upon request by calling 1-800-480-4111 and on the SEC’s website at www.sec.gov. The Trustees have delegated the authority to vote proxies for securities owned by the Portfolio to the Advisor. A copy of the Portfolio’s voting record for the most recent 12-month period ended June 30 is available on the SEC’s website at www.sec.gov or at the Portfolio’s website at www.jpmorganfunds.com no later than August 31 of each year. The Portfolio’s proxy voting record will include, among other things, a brief description of the matter voted on for each portfolio security, and will state how each vote was cast, for example, for or against the proposal.
© JPMorgan Chase & Co., 2006 All rights reserved. June 2006. | | SAN-JPMITLCGP-606 |
ITEM 2. CODE OF ETHICS. Disclose whether, as of the end of the period covered by the report, the registrant has adopted a code of ethics that applies to the registrant's principal executive officer, principal financial officer, principal accounting officer or controller, or persons performing similar functions, regardless of whether these individuals are employed by the registrant or a third party. If the registrant has not adopted such a code of ethics, explain why it has not done so. Not applicable to a semi-annual report. ITEM 3. AUDIT COMMITTEE FINANCIAL EXPERT. (a) (1) Disclose that the registrant's board of directors has determined that the registrant either: (i) Has at least one audit committee financial expert serving on its audit committee; or (ii) Does not have an audit committee financial expert serving on its audit committee. (2) If the registrant provides the disclosure required by paragraph (a)(1)(i) of this Item, it must disclose the name of the audit committee financial expert and whether that person is "independent." In order to be considered "independent" for purposes of this Item, a member of an audit committee may not, other than in his or her capacity as a member of the audit committee, the board of directors, or any other board committee: (i) Accept directly or indirectly any consulting, advisory, or other compensatory fee from the issuer; or (ii) Be an "interested person" of the investment company as defined in Section 2(a)(19) of the Act (15 U.S.C. 80a-2(a)(19)). (3) If the registrant provides the disclosure required by paragraph (a)(1)(ii) of this Item, it must explain why it does not have an audit committee financial expert. Not applicable to a semi-annual report. ITEM 4. PRINCIPAL ACCOUNTANT FEES AND SERVICES. (a) Disclose, under the caption AUDIT FEES, the aggregate fees billed for each of the last two fiscal years for professional services rendered by the principal accountant for the audit of the registrant's annual financial statements or services that are normally provided by the accountant in connection with statutory and regulatory filings or engagements for those fiscal years. (b) Disclose, under the caption AUDIT-RELATED FEES, the aggregate fees billed in each of the last two fiscal years for assurance and related services by the principal accountant that are reasonably related to the performance of the audit of the registrant's financial statements and are not reported under paragraph (a) of this Item. Registrants shall describe the nature of the services comprising the fees disclosed under this category. (c) Disclose, under the caption TAX FEES, the aggregate fees billed in each of the last two fiscal years for professional services rendered by the principal accountant for tax compliance, tax advice, and tax planning. Registrants shall describe the nature of the services comprising the fees disclosed under this category. (d) Disclose, under the caption ALL OTHER FEES, the aggregate fees billed in each of the last two fiscal years for products and services provided by the principal accountant, other than the services reported in paragraphs (a) through (c) of this Item. Registrants shall describe the nature of the services comprising the fees disclosed under this category. (e) (1) Disclose the audit committee's pre-approval policies and procedures described in paragraph (c)(7) of Rule 2-01 of Regulation S-X.
(2) Disclose the percentage of services described in each of paragraphs (b) through (d) of this Item that were approved by the audit committee pursuant to paragraph (c)(7)(i)(C) of Rule 2-01 of Regulation S-X. (f) If greater than 50 percent, disclose the percentage of hours expended on the principal accountant's engagement to audit the registrant's financial statements for the most recent fiscal year that were attributed to work performed by persons other than the principal accountant's full-time, permanent employees. (g) Disclose the aggregate non-audit fees billed by the registrant's accountant for services rendered to the registrant, and rendered to the registrant's investment adviser (not including any sub-adviser whose role is primarily portfolio management and is subcontracted with or overseen by another investment adviser), and any entity controlling, controlled by, or under common control with the adviser that provides ongoing services to the registrant for each of the last two fiscal years of the registrant. (h) Disclose whether the registrant's audit committee of the board of directors has considered whether the provision of non-audit services that were rendered to the registrant's investment adviser (not including any subadviser whose role is primarily portfolio management and is subcontracted with or overseen by another investment adviser), and any entity controlling, controlled by, or under common control with the investment adviser that provides ongoing services to the registrant that were not pre-approved pursuant to paragraph (c)(7)(ii) of Rule 2-01 of Regulation S-X is compatible with maintaining the principal accountant's independence. Not applicable to a semi-annual report. ITEM 5. AUDIT COMMITTEE OF LISTED REGISTRANTS. (a) If the registrant is a listed issuer as defined in Rule 10A-3 under the Exchange Act (17CFR 240.10A-3), state whether or not the registrant has a separately-designated standing audit committee established in accordance with Section 3(a)(58)(A) of the Exchange Act (15 U.S.C. 78c(a)(58)(A)). If the registrant has such a committee, however designated, identify each committee member. If the entire board of directors is acting as the registrant's audit committee as specified in Section 3(a)(58)(B) of the Exchange Act (15 U.S.C. 78c(a)(58)(B)), so state. (b)If applicable, provide the disclosure required by Rule 10A-3(d) under the Exchange Act (17CFR 240.10A-3(d)) regarding an exemption from the listing standards for all audit committees. Not applicable to a semi-annual report. ITEM 6. SCHEDULE OF INVESTMENTS File Schedule I - Investments in securities of unaffiliated issuers as of the close of the reporting period as set forth in Section 210.12-12 of Regulation S-X, unless the schedule is included as part of the report to shareholders filed under Item 1 of this Form. Included in Item 1. ITEM 7. DISCLOSURE OF PROXY VOTING POLICIES AND PROCEDURES FOR CLOSED-END MANAGEMENT INVESTMENT COMPANIES. A closed-end management investment company that is filing an annual report on this Form N-CSR must, unless it invests exclusively in non-voting securities, describe the policies and procedures that it uses to determine how to vote proxies relating to portfolio securities, including the procedures that the company uses when a vote presents a conflict between the interests of its shareholders, on the one hand, and those of the company's investment adviser; principal underwriter; or any affiliated person (as defined in Section 2(a)(3) of the Investment Company Act of 1940 (15 U.S.C. 80a-2(a)(3)) and the rules thereunder) of the company, its investment adviser, or its principal underwriter, on the other. Include any policies and procedures of the company's investment adviser, or any other third party, that the company uses, or that are used on the company's behalf, to determine how to vote proxies relating to portfolio securities.
Not applicable. ITEM 8. PORTFOLIO MANAGERS OF CLOSED-END MANAGEMENT INVESTMENT COMPANIES. Not applicable. ITEM 9. PURCHASE OF EQUITY SECURITIES BY CLOSED-END MANAGEMENT INVESTMENT COMPANY AND AFFILIATED PURCHASERS. (a) If the registrant is a closed-end management investment company, provide the information specified in paragraph (b) of this Item with respect to any purchase made by or on behalf of the registrant or any "affiliated purchaser," as defined in Rule 10b-18(a)(3) under the Exchange Act (17 CFR 240.10b-18(a)(3)), of shares or other units of any class of the registrant's equity securities that is registered by the registrant pursuant to Section 12 of the Exchange Act (15 U.S.C. 781). Not applicable. ITEM 10. SUBMISSION OF MATTERS TO A VOTE OF SECURITY HOLDERS. Describe any material changes to the procedures by which shareholders may recommend nominees to the registrant's board of directors, where those changes were implemented after the registrant last provided disclosure in response to the requirements of Item 7(d)(2)(ii)(G) of Schedule 14A (17 CFR 240.14a-101), or this Item. No material change to report. ITEM 11. CONTROLS AND PROCEDURES. (a) Disclose the conclusions of the registrant's principal executive and principal financial officers, or persons performing similar functions, regarding the effectiveness of the registrant's disclosure controls and procedures (as defined in Rule 30a-3(c) under the Act (17 CFR 270.30a-3(c))) as of a date within 90 days of the filing date of the report that includes the disclosure required by this paragraph, based on the evaluation of these controls and procedures required by Rule 30a-3(b) under the Act (17 CFR 270.30a-3(b)) and Rules 13a-15(b) or 15d-15(b) under the Exchange Act (17 CFR 240.13a-15(b) or 240.15d-15(b)) The Registrant's principal executive and principal financial officers have concluded, based on their evaluation of the Registrant's disclosure controls and procedures as of a date within 90 days of the filing date of this report, that the Registrant's disclosure controls and procedures are reasonably designed to ensure that information required to be disclosed by the Registrant on Form N-CSR is recorded, processed, summarized and reported within the required time periods and that information required to be disclosed by the Registrant in the reports that it files or submits on Form N-CSR is accumulated and communicated to the Registrant's management, including its principal executive and principal financial officers, as appropriate to allow timely decisions regarding required disclosure. (b) Disclose any change in the registrant's internal control over financial reporting (as defined in Rule 30a-3(d) under the Act (17 CFR 270.30a-3(d)) that occurred during the registrant's second fiscal quarter of the period covered by this report that has materially affected, or is reasonably likely to materially affect, the registrant's internal control over financial reporting. There were no changes in the Registrant's internal control over financial reporting that occurred during the Registrant's second fiscal quarter of the period covered by this report that have materially affected, or are reasonably likely to materially affect, the Registrant's internal control over financial reporting.
ITEM 12. EXHIBITS. (a) File the exhibits listed below as part of this Form. Letter or number the exhibits in the sequence indicated. (a)(1) Any code of ethics, or amendment thereto, that is the subject of the disclosure required by Item 2, to the extent that the registrant intends to satisfy the Item 2 requirements through filing of an exhibit. Not applicable. (a)(2) A separate certification for each principal executive officer and principal financial officer of the registrant as required by Rule 30a-2(a) under the Act (17 CFR 270.30a-2). Certifications pursuant to Rule 30a-2(a) under the Investment Company Act of 1940 are attached hereto. (a)(3) Any written solicitation to purchase securities under Rule 23c-1 under the Act (17 CFR 270.23c-1) sent or given during the period covered by the report by or on behalf of the registrant to 10 or more persons. Not applicable. (b) A separate or combined certification for each principal executive officer and principal officer of the registrant as required by Rule 30a-2(b) under the Act of 1940. Certifications pursuant to Rule 30a-2(b) under the Investment Company Act of 1940 are attached hereto.
SIGNATURES Pursuant to the requirements of the Securities Exchange Act of 1934 and the Investment Company Act of 1940, the registrant has duly caused this report to be signed on its behalf by the undersigned, thereunto duly authorized. JPMorgan Insurance Trust (formerly JPMorgan Investment Trust) George C.W. Gatch President and Principal Executive Officer September 7, 2006 Pursuant to the requirements of the Securities Exchange Act of 1934 and the Investment Company Act of 1940, this report has been signed below by the following persons on behalf of the registrant and in the capacities and on the dates indicated. George C.W. Gatch President and Principal Executive Officer September 7, 2006 Arthur A. Jensen Assistant Treasurer and Principal Financial Officer September 7, 2006 |