UNITED STATES
SECURITIES AND EXCHANGE COMMISSION
Washington, D.C. 20549
FORM N-CSR
CERTIFIED SHAREHOLDER REPORT OF REGISTERED
MANAGEMENT INVESTMENT COMPANIES
Investment Company Act file number: 811-07874
JPMorgan Insurance Trust
(Exact name of registrant as specified in charter)
245 Park Avenue
New York, NY 10167
(Address of principal executive offices) (Zip code)
Stephen M. Benham
245 Park Avenue
New York, NY 10167
(Name and Address of Agent for Service)
Registrant’s telephone number, including area code: (800) 480-4111
Date of fiscal year end: December 31
Date of reporting period: January 1, 2006 through December 31, 2006
Form N-CSR is to be used by management investment companies to file reports with the Commission not later than 10 days after the transmission to stockholders of any report that is required to be transmitted to stockholders under Rule 30e-1 under the Investment Company Act of 1940 (17 CFR 270.30e-1). The Commission may use the information provided on Form N-CSR in its regulatory, disclosure review, inspection, and policymaking roles.
A registrant is required to disclose the information specified by Form N-CSR, and the Commission will make this information public. A registrant is not required to respond to the collection of information contained in Form N-CSR unless the Form displays a currently valid Office of Management and Budget (“OMB”) control number. Please direct comments concerning the accuracy of the information collection burden estimate and any suggestions for reducing the burden to Secretary, Securities and Exchange Commission, 450 Fifth Street, NW, Washington, DC 20549-0609. The OMB has reviewed this collection of information under the clearance requirements of 44 U.S.C. Section 3507.
ITEM 1. REPORTS TO STOCKHOLDERS.
The following is a copy of the report transmitted to shareholders pursuant to Rule 30e-1 under the Investment Company Act of 1940 (17 CFR 270.30e-1).
This material must be preceded or accompanied by a current prospectus.

| President’s Letter | 1 | |||||
| Portfolio Commentary: | ||||||
| JPMorgan Insurance Trust Balanced Portfolio | 2 | |||||
| Schedule of Portfolio Investments | 4 | |||||
| Financial Statements | 13 | |||||
| Financial Highlights | 16 | |||||
| Notes to Financial Statements | 18 | |||||
| Report of Independent Registered Public Accounting Firm | 23 | |||||
| Trustees | 24 | |||||
| Officers | 26 | |||||
| Schedule of Shareholder Expenses | 28 | |||||
| Board Approval of Investment Advisory Agreement | 29 | |||||
| Tax Letter | 32 |
| • | Bonds generated modestly positive performance for 2006 |
| • | Home sales stabilized toward year-end but were offset somewhat by amount of unsold homes |
| • | Fed paused rate hike cycle in the latter half of 2006, triggering a rally in the markets |
| • | Consumer spending likely to moderate as job gains decrease |
JANUARY 5, 2007 (Unaudited)
 | “We expect economic growth to remain subdued over the next few quarters, keeping the pressure off inflation.” | |||||

President
JPMorgan Funds
AS OF DECEMBER 31, 2006 (Unaudited)
| Portfolio Inception | August 1, 1994 | |||||
| Fiscal Year End | December 31 | |||||
| Net Assets as of 12/31/2006 | $98,291,923 | |||||
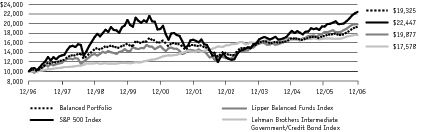
| Primary Benchmarks | S&P 500 Index, Lehman Brothers Intermediate Government/Credit Bond Index | |||||
Q: | HOW DID THE PORTFOLIO PERFORM? |
A: | The JPMorgan Insurance Trust Balanced Portfolio, which seeks to provide total return while preserving capital, returned 10.98% (Class 1 Shares) over the 12 months ended December 31, 2006.* This compares to the 15.80% return for the S&P 500 Index, the Portfolio’s equity benchmark, and the 4.08% return for the Lehman Brothers Intermediate Government/Credit Bond Index, the Portfolio’s fixed income benchmark, over the same period. |
Q: | WHY DID THE PORTFOLIO PERFORM THIS WAY? |
A: | On the equity side, 2006 was driven by fundamentals. The quintile ranking system, which estimates the worth of individual firms (i.e., the Portfolio would underweight or not own those stocks in the more expensive quintiles), utilized in equities proved fairly balanced. The markets rewarded low-security valuations and had a bias toward large-capitalization stocks. For the year, the majority of the Portfolio’s positive performance was driven by stock selection in the retail and software and services sectors. Specific holdings positively affecting performance included department store chain Kohl’s Corporation, investment bank Lazard Ltd. and power company Northeast Utilities. On the negative side, stock selection in the telecommunications and media sectors hurt returns. Holdings that detracted from performance included online marketplace eBay Inc., cable operator Comcast Corporation and oilfield services company Schlumberger Limited. |
| We continued to employ the same fixed income strategy since the Portfolio’s inception, which included holding an overweight position in mortgage-backed securities, specifically well-structured collateralized mortgage obligations (CMOs). We maintained an underweight in the corporate and agency sectors. In the corporate sector, we continued to be biased toward financial credits as well as higher-rated credit, which served well during the year. |
Q: | HOW WAS THE PORTFOLIO MANAGED? |
A: | The Balanced Portfolio invests in a combination of equity, fixed income and money market instruments. In equities, high-quality, undervalued names were given the largest portfolio weights, a strategy that worked well during 2006. In fixed income, the Portfolio continued its bias toward strong credit quality names, helping to minimize individual security risk. Further, a research style that emphasizes individual security analysis rather than large macro bets provided for low turnover. |
| General Electric Co. | 2.3 | % | ||||
| Exxon Mobil Corp. | 2.3 | |||||
| Citigroup, Inc. | 1.9 | |||||
| Bank of America Corp. | 1.7 | |||||
| Proctor & Gamble Co. | 1.6 | |||||
| Microsoft Corp. | 1.6 | |||||
| Altria Group, Inc. | 1.5 | |||||
| Morgan Stanley | 1.0 | |||||
| Wells Fargo & Co. | 0.9 | |||||
| Abbott Laboratories | 0.9 |
| Financials | 18.9 | % | ||||
| Collateralized Mortgage Obligations | 11.3 | |||||
| U.S. Treasury Obligations | 10.6 | |||||
| Information Technology | 9.4 | |||||
| Health Care | 7.3 | |||||
| Industrials | 7.3 | |||||
| Consumer Discretionary | 7.0 | |||||
| Energy | 6.1 | |||||
| Consumer Staples | 5.5 | |||||
| Telecommunication Services | 3.1 | |||||
| Utilities | 2.8 | |||||
| Materials | 2.2 | |||||
| Mortgage Pass-Through Securities | 1.9 | |||||
| U.S. Government Agency Securities | 1.7 | |||||
| Asset-Backed Securities | 1.2 | |||||
| Other (Less than 1.0%) | 0.7 | |||||
| Short-Term Investments | 2.9 | |||||
| Investments of Cash Collateral for Securities on Loan | 12.6 |
| * | The advisor seeks to achieve the Portfolio’s objective. There can be no guarantee it will be achieved. |
| ** | Percentages indicated are based upon net assets as of December 31, 2006. The Portfolio’s composition is subject to change. |
| INCEPTION DATE | 1 YEAR | 5 YEAR | 10 YEAR | |||||||||||||||
|---|---|---|---|---|---|---|---|---|---|---|---|---|---|---|---|---|---|---|
BALANCED PORTFOLIO | 8/01/94 | 10.98 | % | 4.48 | % | 6.81 | % | |||||||||||
AS OF DECEMBER 31, 2006
| SHARES | | SECURITY DESCRIPTION | | VALUE($) | |||||||
|---|---|---|---|---|---|---|---|---|---|---|---|
Long-Term Investments — 97.0% | |||||||||||
Common Stocks — 60.4% | |||||||||||
Aerospace & Defense — 1.7% | |||||||||||
| 5,160 | Goodrich Corp. (c) | 235,038 | |||||||||
| 10,500 | Honeywell International, Inc. | 475,020 | |||||||||
| 5,100 | Northrop Grumman Corp. | 345,270 | |||||||||
| 9,980 | United Technologies Corp. | 623,950 | |||||||||
| 1,679,278 | |||||||||||
Auto Components — 0.5% | |||||||||||
| 5,770 | Johnson Controls, Inc. | 495,758 | |||||||||
Beverages — 0.6% | |||||||||||
| 11,270 | Coca-Cola Co. (The) | 543,778 | |||||||||
| 1,300 | Coca-Cola Enterprises, Inc. | 26,546 | |||||||||
| 570,324 | |||||||||||
Biotechnology — 0.9% | |||||||||||
| 11,520 | Amgen, Inc. (a) | 786,931 | |||||||||
| 3,030 | MedImmune, Inc. (a) | 98,081 | |||||||||
| 1,000 | Vertex Pharmaceuticals, Inc. (a) (c) | 37,420 | |||||||||
| 922,432 | |||||||||||
Capital Markets — 2.5% | |||||||||||
| 600 | Bank of New York Co., Inc. (The) | 23,622 | |||||||||
| 2,200 | E*Trade Financial Corp. (a) | 49,324 | |||||||||
| 3,900 | Franklin Resources, Inc. | 429,663 | |||||||||
| 1,200 | Goldman Sachs Group, Inc. | 239,220 | |||||||||
| 1,012 | Lazard Ltd., Class A (Bermuda) | 47,908 | |||||||||
| 12,290 | Morgan Stanley | 1,000,775 | |||||||||
| 7,120 | State Street Corp. | 480,173 | |||||||||
| 11,920 | TD AMERITRADE Holding Corp. (c) | 192,865 | |||||||||
| 2,463,550 | |||||||||||
Chemicals — 1.2% | |||||||||||
| 800 | Air Products & Chemicals, Inc. | 56,224 | |||||||||
| 2,000 | Dow Chemical Co. (The) | 79,880 | |||||||||
| 7,590 | Praxair, Inc. | 450,315 | |||||||||
| 12,060 | Rohm & Haas Co. (c) | 616,507 | |||||||||
| 1,202,926 | |||||||||||
Commercial Banks — 2.7% | |||||||||||
| 200 | Associated Banc-Corp. (c) | 6,976 | |||||||||
| 100 | BB&T Corp. | 4,393 | |||||||||
| 3,400 | Comerica, Inc. | 199,512 | |||||||||
| 100 | First Horizon National Corp. (c) | 4,178 | |||||||||
| 4,890 | Marshall & Ilsley Corp. | 235,258 | |||||||||
| 3,890 | SunTrust Banks, Inc. | 328,510 | |||||||||
| 6,710 | TCF Financial Corp. (c) | 183,988 | |||||||||
| 20,090 | U.S. Bancorp | 727,057 | |||||||||
| 1,600 | Wachovia Corp. | 91,120 | |||||||||
| 25,780 | Wells Fargo & Co. | 916,737 | |||||||||
| 2,697,729 | |||||||||||
Communications Equipment — 2.6% | |||||||||||
| 26,340 | Cisco Systems, Inc. (a) | 719,872 | |||||||||
| 26,370 | Corning, Inc. (a) | 493,383 | |||||||||
| 4,400 | Juniper Networks, Inc. (a) | 83,336 | |||||||||
| 18,090 | Motorola, Inc. | 371,930 | |||||||||
| 22,310 | QUALCOMM, Inc. | 843,095 | |||||||||
| 8,780 | Tellabs, Inc. (a) | 90,083 | |||||||||
| 2,601,699 | |||||||||||
Computers & Peripherals — 2.0% | |||||||||||
| 2,980 | Apple Computer, Inc. (a) | 252,823 | |||||||||
| 700 | Dell, Inc. (a) | 17,563 | |||||||||
| 9,750 | EMC Corp. (a) | 128,700 | |||||||||
| 16,780 | Hewlett-Packard Co. | 691,168 | |||||||||
| 8,370 | International Business Machines Corp. | 813,146 | |||||||||
| 500 | NCR Corp. (a) | 21,380 | |||||||||
| 16,200 | Sun Microsystems, Inc. (a) | 87,804 | |||||||||
| 2,012,584 | |||||||||||
Consumer Finance — 0.1% | |||||||||||
| 1,500 | American Express Co. | 91,005 | |||||||||
| 500 | Capital One Financial Corp. | 38,410 | |||||||||
| 129,415 | |||||||||||
Diversified Financial Services — 4.2% | |||||||||||
| 31,739 | Bank of America Corp. | 1,694,545 | |||||||||
| 10,520 | CIT Group, Inc. | 586,701 | |||||||||
| 33,530 | Citigroup, Inc. | 1,867,621 | |||||||||
| 4,148,867 | |||||||||||
Diversified Telecommunication Services — 1.7% | |||||||||||
| 22,410 | AT&T, Inc. | 801,157 | |||||||||
| 23,240 | Verizon Communications, Inc. | 865,458 | |||||||||
| 1,666,615 | |||||||||||
Electric Utilities — 1.4% | |||||||||||
| 6,400 | American Electric Power Co., Inc. | 272,512 | |||||||||
| 14,830 | Edison International | 674,468 | |||||||||
| 5,700 | Northeast Utilities (c) | 160,512 | |||||||||
| 18,100 | Sierra Pacific Resources (a) | 304,623 | |||||||||
| 1,412,115 | |||||||||||
Electrical Equipment — 0.1% | |||||||||||
| 1,300 | Rockwell Automation, Inc. | 79,404 | |||||||||
| SHARES | | SECURITY DESCRIPTION | | VALUE($) | |||||||
|---|---|---|---|---|---|---|---|---|---|---|---|
Long-Term Investments — Continued | |||||||||||
Energy Equipment & Services — 1.0% | |||||||||||
| 3,800 | Baker Hughes, Inc. | 283,708 | |||||||||
| 2,000 | BJ Services Co. (c) | 58,640 | |||||||||
| 6,300 | Halliburton Co. | 195,615 | |||||||||
| 3,360 | Schlumberger Ltd. | 212,218 | |||||||||
| 5,410 | Weatherford International Ltd. (a) | 226,084 | |||||||||
| 976,265 | |||||||||||
Food & Staples Retailing — 1.1% | |||||||||||
| 5,490 | CVS Corp. | 169,696 | |||||||||
| 7,420 | Safeway, Inc. | 256,435 | |||||||||
| 2,610 | SUPERVALU, Inc. (c) | 93,307 | |||||||||
| 9,930 | SYSCO Corp. | 365,027 | |||||||||
| 3,700 | Wal-Mart Stores, Inc. | 170,866 | |||||||||
| 1,055,331 | |||||||||||
Food Products — 0.5% | |||||||||||
| 3,900 | Kellogg Co. | 195,234 | |||||||||
| 5,500 | Kraft Foods, Inc., Class A (c) | 196,350 | |||||||||
| 2,600 | Wm. Wrigley, Jr., Co. | 134,472 | |||||||||
| 526,056 | |||||||||||
Health Care Equipment & Supplies — 0.6% | |||||||||||
| 13,240 | Baxter International, Inc. | 614,204 | |||||||||
| 300 | Medtronic, Inc. | 16,053 | |||||||||
| 630,257 | |||||||||||
Health Care Providers & Services — 1.6% | |||||||||||
| 4,940 | Aetna, Inc. | 213,309 | |||||||||
| 600 | Cigna Corp. | 78,942 | |||||||||
| 5,300 | McKesson Corp. | 268,710 | |||||||||
| 2,420 | Medco Health Solutions, Inc. (a) | 129,325 | |||||||||
| 4,260 | UnitedHealth Group, Inc. | 228,890 | |||||||||
| 8,660 | WellPoint, Inc. (a) | 681,455 | |||||||||
| 1,600,631 | |||||||||||
Hotels, Restaurants & Leisure — 0.7% | |||||||||||
| 3,560 | Carnival Corp. | 174,618 | |||||||||
| 6,710 | Hilton Hotels Corp. (c) | 234,179 | |||||||||
| 2,500 | McDonald’s Corp. | 110,825 | |||||||||
| 1,200 | Starwood Hotels & Resorts Worldwide, Inc. | 75,000 | |||||||||
| 2,650 | Wyndham Worldwide Corp. (a) | 84,853 | |||||||||
| 679,475 | |||||||||||
Household Durables — 0.4% | |||||||||||
| 800 | Centex Corp. (c) | 45,016 | |||||||||
| 900 | Lennar Corp., Class A | 47,214 | |||||||||
| 100 | Mohawk Industries, Inc. (a) (c) | 7,486 | |||||||||
| 8,180 | Toll Brothers, Inc. (a) (c) | 263,641 | |||||||||
| 363,357 | |||||||||||
Household Products — 1.6% | |||||||||||
| 24,147 | Procter & Gamble Co. | 1,551,928 | |||||||||
Industrial Conglomerates — 2.4% | |||||||||||
| 61,520 | General Electric Co. | 2,289,159 | |||||||||
| 500 | Textron, Inc. | 46,885 | |||||||||
| 2,336,044 | |||||||||||
Insurance — 2.6% | |||||||||||
| 7,460 | AMBAC Financial Group, Inc. | 664,462 | |||||||||
| 2,300 | American International Group, Inc. | 164,818 | |||||||||
| 1,800 | Assurant, Inc. | 99,450 | |||||||||
| 900 | Chubb Corp. | 47,619 | |||||||||
| 13,700 | Genworth Financial, Inc. | 468,677 | |||||||||
| 5,330 | Hartford Financial Services Group, Inc. | 497,342 | |||||||||
| 4,000 | MBIA, Inc. (c) | 292,240 | |||||||||
| 200 | Progressive Corp. (The) | 4,844 | |||||||||
| 1,400 | Protective Life Corp. | 66,500 | |||||||||
| 1,200 | Prudential Financial, Inc. | 103,032 | |||||||||
| 2,390 | RenaissanceRe Holdings Ltd. (Bermuda) | 143,400 | |||||||||
| 2,552,384 | |||||||||||
Internet & Catalog Retail — 0.0% (g) | |||||||||||
| 100 | Expedia, Inc. (a) (c) | 2,098 | |||||||||
Internet Software & Services — 1.3% | |||||||||||
| 6,000 | eBay, Inc. (a) | 180,420 | |||||||||
| 1,640 | Google, Inc., Class A (a) | 755,187 | |||||||||
| 13,490 | Yahoo!, Inc. (a) | 344,535 | |||||||||
| 1,280,142 | |||||||||||
IT Services — 0.3% | |||||||||||
| 1,800 | Affiliated Computer Services, Inc., Class A (a) | 87,912 | |||||||||
| 2,400 | Automatic Data Processing, Inc. | 118,200 | |||||||||
| 900 | Computer Sciences Corp. (a) | 48,033 | |||||||||
| 1,450 | Infosys Technologies Ltd. ADR (India) (c) | 79,112 | |||||||||
| 333,257 | |||||||||||
Machinery — 1.0% | |||||||||||
| 1,200 | Caterpillar, Inc. | 73,596 | |||||||||
| 3,750 | Danaher Corp. | 271,650 | |||||||||
| 4,920 | Eaton Corp. | 369,689 | |||||||||
AS OF DECEMBER 31, 2006 (continued)
| SHARES | | SECURITY DESCRIPTION | | VALUE($) | |||||||
|---|---|---|---|---|---|---|---|---|---|---|---|
Long-Term Investments — Continued | |||||||||||
Machinery — Continued | |||||||||||
| 1,700 | Illinois Tool Works, Inc. | 78,523 | |||||||||
| 5,000 | Ingersoll-Rand Co., Ltd., Class A (Bermuda) | 195,650 | |||||||||
| 989,108 | |||||||||||
Media — 1.9% | |||||||||||
| 4,300 | CBS Corp., Class B | 134,074 | |||||||||
| 8,180 | Comcast Corp., Class A (a) | 346,259 | |||||||||
| 800 | DIRECTV Group, Inc. (The) (a) | 19,952 | |||||||||
| 4,900 | E.W. Scripps Co., Class A | 244,706 | |||||||||
| 700 | EchoStar Communications Corp., Class A (a) | 26,621 | |||||||||
| 5,000 | Gannett Co., Inc. | 302,300 | |||||||||
| 800 | New York Times Co., Class A (c) | 19,488 | |||||||||
| 20,280 | News Corp., Class A | 435,615 | |||||||||
| 700 | Viacom, Inc., Class B (a) | 28,721 | |||||||||
| 8,030 | Walt Disney Co. | 275,188 | |||||||||
| 1,832,924 | |||||||||||
Metals & Mining — 0.7% | |||||||||||
| 3,800 | Alcan, Inc. (Canada) | 185,212 | |||||||||
| 10,600 | Alcoa, Inc. | 318,106 | |||||||||
| 2,100 | United States Steel Corp. | 153,594 | |||||||||
| 656,912 | |||||||||||
Multi-Utilities — 0.9% | |||||||||||
| 8,400 | CMS Energy Corp. (a) | 140,280 | |||||||||
| 5,440 | DTE Energy Co. | 263,350 | |||||||||
| 700 | SCANA Corp. | 28,434 | |||||||||
| 18,740 | Xcel Energy, Inc. (c) | 432,145 | |||||||||
| 864,209 | |||||||||||
Multiline Retail — 1.5% | |||||||||||
| 600 | Family Dollar Stores, Inc. | 17,598 | |||||||||
| 5,070 | J.C. Penney Co., Inc. | 392,215 | |||||||||
| 7,210 | Kohl’s Corp. (a) | 493,381 | |||||||||
| 9,220 | Target Corp. | 526,001 | |||||||||
| 1,429,195 | |||||||||||
Oil, Gas & Consumable Fuels — 4.7% | |||||||||||
| 4,900 | Anadarko Petroleum Corp. | 213,248 | |||||||||
| 2,750 | Apache Corp. | 182,903 | |||||||||
| 100 | Chesapeake Energy Corp. (c) | 2,905 | |||||||||
| 2,800 | Chevron Corp. | 205,884 | |||||||||
| 11,000 | ConocoPhillips | 791,450 | |||||||||
| 4,550 | Devon Energy Corp. | 305,214 | |||||||||
| 29,330 | Exxon Mobil Corp. | 2,247,558 | |||||||||
| 3,400 | Marathon Oil Corp. | 314,500 | |||||||||
| 5,240 | Occidental Petroleum Corp. | 255,869 | |||||||||
| 500 | Valero Energy Corp. | 25,580 | |||||||||
| 1,900 | XTO Energy, Inc. | 89,395 | |||||||||
| 4,634,506 | |||||||||||
Paper & Forest Products — 0.1% | |||||||||||
| 1,600 | Weyerhaeuser Co. | 113,040 | |||||||||
Personal Products — 0.1% | |||||||||||
| 2,110 | Avon Products, Inc. | 69,714 | |||||||||
Pharmaceuticals — 4.2% | |||||||||||
| 18,680 | Abbott Laboratories | 909,903 | |||||||||
| 200 | Eli Lilly & Co. | 10,420 | |||||||||
| 3,000 | Johnson & Johnson | 198,060 | |||||||||
| 20,540 | Merck & Co., Inc. | 895,544 | |||||||||
| 7,300 | Pfizer, Inc. | 189,070 | |||||||||
| 32,070 | Schering-Plough Corp. | 758,135 | |||||||||
| 4,480 | Sepracor, Inc. (a) (c) | 275,878 | |||||||||
| 17,830 | Wyeth | 907,904 | |||||||||
| 4,144,914 | |||||||||||
Real Estate Investment Trusts (REITs) — 0.7% | |||||||||||
| 4,140 | Apartment Investment & Management Co. | 231,923 | |||||||||
| 1,000 | Boston Properties, Inc. | 111,880 | |||||||||
| 100 | Brandywine Realty Trust | 3,325 | |||||||||
| 2,200 | Global Signal, Inc. | 115,874 | |||||||||
| 1,700 | Hospitality Properties Trust (c) | 80,801 | |||||||||
| 2,500 | Host Hotels & Resorts, Inc. (c) | 61,375 | |||||||||
| 700 | Mack-Cali Realty Corp. | 35,700 | |||||||||
| 1,200 | ProLogis | 72,924 | |||||||||
| 713,802 | |||||||||||
Road & Rail — 1.1% | |||||||||||
| 300 | Burlington Northern Santa Fe Corp. | 22,143 | |||||||||
| 12,920 | CSX Corp. | 444,836 | |||||||||
| 11,380 | Norfolk Southern Corp. | 572,300 | |||||||||
| 1,039,279 | |||||||||||
Semiconductors & Semiconductor Equipment — 1.0% | |||||||||||
| 1,100 | Altera Corp. (a) | 21,648 | |||||||||
| 600 | Intel Corp. | 12,150 | |||||||||
| 600 | Intersil Corp., Class A | 14,352 | |||||||||
| 400 | KLA-Tencor Corp. | 19,900 | |||||||||
| 12,930 | Linear Technology Corp. | 392,037 | |||||||||
| 3,900 | LSI Logic Corp. (a) | 35,100 | |||||||||
| 3,090 | Marvell Technology Group Ltd. (Bermuda) (a) | 59,297 | |||||||||
| 100 | Maxim Integrated Products, Inc. | 3,062 | |||||||||
| 700 | PMC-Sierra, Inc. (a) (c) | 4,697 | |||||||||
| 200 | Texas Instruments, Inc. | 5,760 | |||||||||
| SHARES | | SECURITY DESCRIPTION | | VALUE($) | |||||||
|---|---|---|---|---|---|---|---|---|---|---|---|
Long-Term Investments — Continued | |||||||||||
Semiconductors & Semiconductor Equipment — Continued | |||||||||||
| 15,470 | Xilinx, Inc. | 368,341 | |||||||||
| 936,344 | |||||||||||
Software — 2.1% | |||||||||||
| 51,920 | Microsoft Corp. | 1,550,331 | |||||||||
| 26,980 | Oracle Corp. (a) | 462,437 | |||||||||
| 2,012,768 | |||||||||||
Specialty Retail — 0.9% | |||||||||||
| 2,575 | Abercrombie & Fitch Co. | 179,297 | |||||||||
| 2,390 | Advance Auto Parts, Inc. | 84,989 | |||||||||
| 600 | Best Buy Co., Inc. | 29,514 | |||||||||
| 3,500 | Circuit City Stores, Inc. | 66,430 | |||||||||
| 1,200 | Home Depot, Inc. | 48,192 | |||||||||
| 2,100 | Lowe’s Cos., Inc. | 65,415 | |||||||||
| 14,810 | Staples, Inc. | 395,427 | |||||||||
| 700 | TJX Cos., Inc. | 19,964 | |||||||||
| 889,228 | |||||||||||
Textiles, Apparel & Luxury Goods — 0.5% | |||||||||||
| 8,700 | Coach, Inc. (a) | 373,752 | |||||||||
| 1,500 | Nike, Inc., Class B | 148,545 | |||||||||
| 522,297 | |||||||||||
Thrifts & Mortgage Finance — 0.6% | |||||||||||
| 5,200 | Countrywide Financial Corp. | 220,740 | |||||||||
| 100 | Fannie Mae | 5,939 | |||||||||
| 200 | Freddie Mac | 13,580 | |||||||||
| 5,860 | MGIC Investment Corp. | 366,484 | |||||||||
| 200 | Washington Mutual, Inc. (c) | 9,098 | |||||||||
| 615,841 | |||||||||||
Tobacco — 1.5% | |||||||||||
| 16,660 | Altria Group, Inc. | 1,429,761 | |||||||||
Trading Companies & Distributors — 0.1% | |||||||||||
| 1,300 | WW Grainger, Inc. | 90,922 | |||||||||
Wireless Telecommunication Services — 0.5% | |||||||||||
| 24,680 | Sprint Nextel Corp. | 466,205 | |||||||||
| Total Common Stocks (Cost $51,276,019) | 59,420,890 | ||||||||||
| PRINCIPAL AMOUNT($) | | SECURITY DESCRIPTION | | VALUE($) | ||||||
|---|---|---|---|---|---|---|---|---|---|---|
Asset-Backed Securities — 1.2% | ||||||||||
| 225,000 | American Express Credit Account Master Trust, Series 2004-3, Class A, 4.35%, 12/15/11 | 221,565 | ||||||||
| Capital One Multi-Asset Execution Trust, | ||||||||||
| 25,000 | Series 2003-B5, 4.79%, 08/15/13 | 24,565 | ||||||||
| 100,000 | Series 2005-A2, Class A2, 4.05%, 02/15/11 | 98,579 | ||||||||
| 75,000 | Capital One Prime Auto Receivables Trust, Series 2006-2, Class A3, 4.98%, 09/15/10 | 74,792 | ||||||||
| 128,183 | Carmax Auto Owner Trust, Series 2005-1, Class A3, 4.13%, 05/15/09 | 127,466 | ||||||||
| 80,450 | CNH Equipment Trust, Series 2003-B, Class A4B, 3.38%, 02/15/11 | 79,477 | ||||||||
| 71,688 | CS First Boston Mortgage Securities Corp., Series 2002-HE4, Class AF, 5.51%, 08/25/32 | 71,413 | ||||||||
| 125,000 | Ford Credit Auto Owner Trust, Series 2004-A, Class A4, 3.54%, 11/15/08 | 123,542 | ||||||||
| 100,000 | Household Automotive Trust, Series 2005-1, Class A4, 4.35%, 06/18/12 | 98,364 | ||||||||
| 8,496 | Onyx Acceptance Grantor Trust, Series 2004-B, Class A3, 3.09%, 09/15/08 | 8,488 | ||||||||
| WFS Financial Owner Trust, | ||||||||||
| 155,273 | Series 2003-2, Class A4, 2.41%, 12/20/10 | 154,060 | ||||||||
| 88,155 | Series 2003-4, Class A4, 3.15%, 05/20/11 | 87,055 | ||||||||
| Total Asset-Backed Securities (Cost $1,182,591) | 1,169,366 | |||||||||
Commercial Mortgage-Backed Securities — 0.2% | ||||||||||
| 180,000 | Banc of America Commercial Mortgage, Inc., Series 2005-6, Class ASB, VAR, 5.18%, 09/10/47 (Cost $180,572) | 179,100 | ||||||||
Collateralized Mortgage Obligations — 11.3% | ||||||||||
Agency CMO — 10.5% | ||||||||||
| Federal Home Loan Mortgage Corp. | ||||||||||
| 22,040 | Series 85, Class C, 8.60%, 01/15/21 | 23,066 | ||||||||
| 106,516 | Series 168, Class G, 6.50%, 07/15/21 | 106,122 | ||||||||
| 13,603 | Series 189, Class D, 6.50%, 10/15/21 | 13,537 | ||||||||
| 24,919 | Series 1047, Class H, 6.00%, 02/15/21 | 24,871 | ||||||||
| 13,730 | Series 1062, Class H, 6.50%, 04/15/21 | 13,704 | ||||||||
| 13,038 | Series 1116, Class I, 5.50%, 08/15/21 | 13,013 | ||||||||
| 29,640 | Series 1120, Class L, 8.00%, 07/15/21 | 29,617 | ||||||||
| 24,428 | Series 1191, Class E, 7.00%, 01/15/22 (m) | 24,436 | ||||||||
| 6,840 | Series 1240, Class M, 6.50%, 02/15/22 | 6,838 | ||||||||
| 54,652 | Series 1254, Class N, 8.00%, 04/15/22 | 54,551 | ||||||||
| 5,436 | Series 1610, Class PM, 6.25%, 04/15/22 | 5,427 | ||||||||
| 250,000 | Series 1617, Class PM, 6.50%, 11/15/23 | 256,245 | ||||||||
| 36,916 | Series 1668, Class D, 6.50%, 02/15/14 | 37,565 | ||||||||
| 72,486 | Series 1708, Class E, 6.00%, 03/15/09 | 72,537 | ||||||||
| 115,183 | Series 1710, Class GH, 8.00%, 04/15/24 | 119,272 | ||||||||
AS OF DECEMBER 31, 2006 (continued)
| PRINCIPAL AMOUNT($) | | SECURITY DESCRIPTION | | VALUE($) | |||||||
|---|---|---|---|---|---|---|---|---|---|---|---|
Long-Term Investments — Continued | |||||||||||
Agency CMO — Continued | |||||||||||
| 178,000 | Series 1714, Class K, 7.00%, 04/15/24 | 183,168 | |||||||||
| 25,709 | Series 1753, Class D, 8.50%, 09/15/24 | 26,831 | |||||||||
| 13,719 | Series 1819, Class E, 6.00%, 02/15/11 | 13,743 | |||||||||
| 176,727 | Series 1843, Class Z, 7.00%, 04/15/26 | 181,975 | |||||||||
| 273,255 | Series 2115, Class PE, 6.00%, 01/15/14 (m) | 276,468 | |||||||||
| 14,456 | Series 2136, Class PE, 6.00%, 01/15/28 | 14,440 | |||||||||
| 94,105 | Series 2178, Class PB, 7.00%, 08/15/29 | 96,527 | |||||||||
| 162,808 | Series 2388, Class VD, 6.00%, 08/15/19 | 162,856 | |||||||||
| 131,826 | Series 2391, Class QR, 5.50%, 12/15/16 | 132,170 | |||||||||
| 347,011 | Series 2394, Class MC, 6.00%, 12/15/16 (m) | 351,690 | |||||||||
| 413,202 | Series 2405, Class JF, 6.00%, 01/15/17 (m) | 418,794 | |||||||||
| 177,637 | Series 2425, Class OB, 6.00%, 03/15/17 | 180,133 | |||||||||
| 5,525 | Series 2433, Class NG, 6.50%, 01/15/31 | 5,525 | |||||||||
| 200,000 | Series 2455, Class GK, 6.50%, 05/15/32 | 205,596 | |||||||||
| 358,070 | Series 2457, Class PE, 6.50%, 06/15/32 | 363,557 | |||||||||
| 376,800 | Series 2473, Class JZ, 6.50%, 07/15/32 | 385,923 | |||||||||
| 1,472 | Series 2501, Class AG, 5.00%, 01/15/16 | 1,470 | |||||||||
| 650,000 | Series 2522, Class GD, 5.50%, 11/15/17 (m) | 651,402 | |||||||||
| 206,384 | Series 2557, Class WJ, 5.00%, 07/15/14 | 205,285 | |||||||||
| 234,047 | Series 2636, Class Z, 4.50%, 06/15/18 | 219,912 | |||||||||
| 2,169 | Series 2643, Class KG, 4.00%, 05/15/18 | 2,165 | |||||||||
| 291,466 | Series 2651, Class VZ, 4.50%, 07/15/18 | 273,731 | |||||||||
| 250,000 | Series 2701, Class OD, 5.00%, 09/15/18 | 247,788 | |||||||||
| 137,123 | Series 2756, Class NA, 5.00%, 02/15/24 | 133,664 | |||||||||
| 200,000 | Series 2764, Class UC, 5.00%, 05/15/27 | 198,143 | |||||||||
| 150,000 | Series 2809, Class UB, 4.00%, 09/15/17 | 141,489 | |||||||||
| 400,000 | Series 3085, Class PR, 5.50%, 02/15/33 | 397,921 | |||||||||
| 210,825 | Federal Home Loan Mortgage Corp. Structured Pass-Through Securities, Series T-54, Class 2A, 6.50%, 02/25/43 | 214,875 | |||||||||
| Federal Home Loan Mortgage Corp. — Government National Mortgage Association, | |||||||||||
| 172,000 | Series 13, Class LL, 6.85%, 06/25/23 | 176,304 | |||||||||
| 213,166 | Series 31, Class Z, 8.00%, 04/25/24 | 227,369 | |||||||||
| Federal National Mortgage Association, | |||||||||||
| 81,069 | Series 1988-4, Class Z, 9.25%, 03/25/18 | 86,277 | |||||||||
| 15,026 | Series 1989-21, Class G, 10.45%, 04/25/19 | 16,187 | |||||||||
| 64,554 | Series 1989-37, Class G, 8.00%, 07/25/19 | 68,635 | |||||||||
| 12,153 | Series 1989-86, Class E, 8.75%, 11/25/19 | 13,022 | |||||||||
| 17,605 | Series 1990-30, Class E, 6.50%, 03/25/20 | 18,092 | |||||||||
| 28,847 | Series 1990-105, Class J, 6.50%, 09/25/20 | 29,614 | |||||||||
| 18,979 | Series 1991-129, Class G, 8.75%, 09/25/21 | 20,271 | |||||||||
| 1,433 | Series 1992-18, Class ZH, 7.50%, 03/25/07 | 1,431 | |||||||||
| 1,672 | Series 1992-151, Class H, 6.00%, 08/25/07 | 1,668 | |||||||||
| 60,591 | Series 1993-119, Class H, 6.50%, 07/25/23 | 62,064 | |||||||||
| 22,937 | Series 1993-135, Class PG, 6.25%, 07/25/08 | 22,885 | |||||||||
| 178,450 | Series 1993-140, Class J, 6.65%, 06/25/13 | 179,613 | |||||||||
| 19,679 | Series 1993-197, Class SC, IF, 8.30%, 10/25/08 | 20,096 | |||||||||
| 107,921 | Series 1993-225, Class UB, 6.50%, 12/25/23 | 110,861 | |||||||||
| 11,374 | Series 1994-22, Class C, 5.00%, 12/25/23 | 11,328 | |||||||||
| 252,000 | Series 1994-81, Class LL, 7.50%, 02/25/24 | 264,296 | |||||||||
| 686,065 | Series 1997-42, Class PG, 7.00%, 07/18/12 | 702,104 | |||||||||
| 6,363 | Series 1997-49, Class B, 10.00%, 06/17/27 | 7,017 | |||||||||
| 96,069 | Series 1998-66, Class B, 6.50%, 12/25/28 | 98,533 | |||||||||
| 50,182 | Series 2002-7, Class QM, 6.00%, 02/25/20 | 50,062 | |||||||||
| 250,000 | Series 2002-18, Class PC, 5.50%, 04/25/17 | 251,392 | |||||||||
| 125,058 | Series 2002-19, Class PE, 6.00%, 04/25/17 | 126,637 | |||||||||
| 300,000 | Series 2002-24, Class AJ, 6.00%, 04/25/17 | 304,945 | |||||||||
| 18,591 | Series 2002-41, Class VB, 6.00%, 10/25/20 | 18,550 | |||||||||
| 14,932 | Series 2002-56, Class VD, 6.00%, 04/25/20 | 14,903 | |||||||||
| 350,000 | Series 2003-47, Class PE, 5.75%, 06/25/33 | 346,670 | |||||||||
| 150,000 | Series 2003-55, Class CD, 5.00%, 06/25/23 | 143,553 | |||||||||
| 250,000 | Series 2003-83, Class PG, 5.00%, 06/25/23 | 242,462 | |||||||||
| 150,000 | Series 2003-86, Class PX, 4.50%, 02/25/17 | 145,746 | |||||||||
| 15,098 | Series G-29, Class O, 8.50%, 09/25/21 | 15,734 | |||||||||
| 11,637 | Government National Mortgage Association, Series 1995-4, Class CQ, 8.00%, 06/20/25 | 12,313 | |||||||||
| 10,298,676 | |||||||||||
Non-Agency CMO — 0.8% | |||||||||||
| 77,111 | Cendant Mortgage Corp., Series 2003-8, Class 1A8, 5.25%, 10/25/33 | 75,664 | |||||||||
| 143,592 | Countrywide Alternative Loan Trust, Series 2004-16CB, Class 2A2, 5.00%, 08/25/19 | 140,782 | |||||||||
| 52,854 | First Horizon Mortgage Pass-Through Securities, Series 2004-AR7, Class 2A1, FRN, 4.92%, 02/25/35 | 52,461 | |||||||||
| 54,409 | MASTR Asset Securitization Trust, Series 2003-4, Class 2A2, 5.00%, 05/25/18 | 53,899 | |||||||||
| 90,000 | Residential Accredit Loans, Inc., Series 2004-QS8, Class A12, 5.00%, 06/25/34 | 88,723 | |||||||||
| Wells Fargo Mortgage Backed Securities Trust, | |||||||||||
| 110,869 | Series 2004-7, Class 2A2, 5.00%, 07/25/19 | 108,513 | |||||||||
| 107,005 | Series 2004-EE, Class 3A1, FRN, 3.99%, 12/25/34 | 105,563 | |||||||||
| 175,000 | Series 2004-S, Class A5, FRN, 3.54%, 09/25/34 | 169,462 | |||||||||
| 795,067 | |||||||||||
| Total Collateralized Mortgage Obligations (Cost $11,159,389) | 11,093,743 | ||||||||||
| PRINCIPAL AMOUNT($) | | SECURITY DESCRIPTION | | VALUE($) | |||||||
|---|---|---|---|---|---|---|---|---|---|---|---|
Long-Term Investments — Continued | |||||||||||
Corporate Bonds — 9.2% | |||||||||||
Airlines — 0.1% | |||||||||||
| 70,000 | Continental Airlines, Inc., Series 1999-2, Class A2, 7.06%, 09/15/09 | 71,929 | |||||||||
Automobiles — 0.1% | |||||||||||
| 70,000 | DaimlerChrysler NA Holding Corp., 7.20%, 09/01/09 | 72,615 | |||||||||
Capital Markets — 1.3% | |||||||||||
| 75,000 | Bear Stearns Cos., Inc. (The), 5.70%, 11/15/14 | 76,135 | |||||||||
| 570,000 | Credit Suisse First Boston USA, Inc., 6.50%, 01/15/12 (c) | 599,030 | |||||||||
| 200,000 | Goldman Sachs Group LP, 7.20%, 03/01/07 (e) | 200,557 | |||||||||
| 200,000 | Goldman Sachs Group, Inc., 4.75%, 07/15/13 | 193,058 | |||||||||
| 100,000 | Lehman Brothers Holdings, Inc., 6.63%, 01/18/12 | 105,659 | |||||||||
| 100,000 | Morgan Stanley, 6.75%, 04/15/11 | 105,697 | |||||||||
| 1,280,136 | |||||||||||
Chemicals — 0.1% | |||||||||||
| 120,000 | Dow Capital BV (Netherlands), 8.50%, 06/08/10 | 130,999 | |||||||||
Commercial Banks — 1.3% | |||||||||||
| 100,000 | Bank of America Corp., 7.13%, 10/15/11 | 107,623 | |||||||||
| 100,000 | Branch Banking & Trust Co., 4.88%, 01/15/13 | 97,298 | |||||||||
| 150,000 | FleetBoston Financial Corp., 7.38%, 12/01/09 | 158,338 | |||||||||
| 100,000 | Marshall & Ilsley Corp., 4.38%, 08/01/09 | 97,805 | |||||||||
| 110,000 | National City Corp., 4.90%, 01/15/15 | 105,402 | |||||||||
| 125,000 | SunTrust Banks, Inc., 5.00%, 09/01/15 | 121,286 | |||||||||
| 25,000 | UnionBanCal Corp., 5.25%, 12/16/13 | 24,537 | |||||||||
| 300,000 | Wachovia Corp., 6.61%, 10/01/25 | 320,224 | |||||||||
| 125,000 | Wells Fargo & Co., 3.13%, 04/01/09 | 119,545 | |||||||||
| 160,000 | Wells Fargo Bank N.A., 7.55%, 06/21/10 | 171,486 | |||||||||
| 1,323,544 | |||||||||||
Commercial Services & Supplies — 0.1% | |||||||||||
| 75,000 | Pitney Bowes, Inc., 3.88%, 06/15/13 | 68,651 | |||||||||
Computers & Peripherals — 0.1% | |||||||||||
| 80,000 | International Business Machines Corp., 4.38%, 06/01/09 | 78,624 | |||||||||
Construction Materials — 0.1% | |||||||||||
| 60,000 | Hanson Australia Funding Ltd. (Australia), 5.25%, 03/15/13 | 58,517 | |||||||||
Consumer Finance — 0.9% | |||||||||||
| 75,000 | American Express Credit Corp., 3.00%, 05/16/08 | 72,792 | |||||||||
| American General Finance Corp., | |||||||||||
| 120,000 | Series H, 4.00%, 03/15/11 | 113,929 | |||||||||
| 65,000 | Series I, 4.63%, 05/15/09 | 63,974 | |||||||||
| 30,000 | Ford Motor Credit Co., 7.38%, 02/01/11 | 29,698 | |||||||||
| 350,000 | HSBC Finance Corp., 8.00%, 07/15/10 | 380,204 | |||||||||
| 50,000 | International Lease Finance Corp., 5.00%, 04/15/10 | 49,449 | |||||||||
| 150,000 | John Deere Capital Corp., 3.63%, 5/25/07, | 148,957 | |||||||||
| 859,003 | |||||||||||
Diversified Financial Services — 1.3% | |||||||||||
| 135,000 | Caterpillar Financial Services Corp., Series F, 4.50%, 09/01/08 | 133,290 | |||||||||
| 75,000 | CIT Group, Inc., 7.38%, 04/02/07 (c) | 75,357 | |||||||||
| 590,000 | Citigroup, Inc., 5.00%, 09/15/14 | 576,074 | |||||||||
| 400,000 | General Electric Capital Corp., 8.63%, 06/15/08 | 417,813 | |||||||||
| 75,000 | Textron Financial Corp., 4.60%, 05/03/10 | 73,498 | |||||||||
| 1,276,032 | |||||||||||
Diversified Telecommunication Services — 0.8% | |||||||||||
| 75,000 | BellSouth Corp., 6.00%, 10/15/11 | 76,948 | |||||||||
| 80,000 | British Telecommunications plc (United Kingdom), 8.63%, 12/15/10 | 89,281 | |||||||||
| 60,000 | Deutsche Telekom International Finance BV (Netherlands), 8.00%, 06/15/10 | 64,970 | |||||||||
| 30,000 | France Telecom S.A. (France), 7.75%, 03/01/11 | 32,678 | |||||||||
| 300,000 | Nynex Capital Funding Co., Series B, SUB, 8.23%, 10/15/09 | 318,461 | |||||||||
| 200,000 | Southwestern Bell Telephone, Series C, 5.98%, 10/22/07 | 200,711 | |||||||||
| 50,000 | Sprint Capital Corp., 7.63%, 01/30/11 | 53,535 | |||||||||
| 836,584 | |||||||||||
Electric Utilities — 0.2% | |||||||||||
| 50,000 | Carolina Power & Light Co., 5.13%, 09/15/13 | 49,155 | |||||||||
| 40,000 | CenterPoint Energy Houston Electric LLC, Series M2, 5.75%, 01/15/14 | 40,095 | |||||||||
| 100,000 | Exelon Corp., 6.75%, 05/01/11 | 104,452 | |||||||||
| 50,000 | PSEG Power LLC, 7.75%, 04/15/11 | 54,025 | |||||||||
| 247,727 | |||||||||||
Food & Staples Retailing — 0.1% | |||||||||||
| 50,000 | Kroger Co., 8.05%, 02/01/10 | 53,498 | |||||||||
| 100,000 | Wal-Mart Stores, Inc., 4.13%, 02/15/11 | 96,185 | |||||||||
| 149,683 | |||||||||||
Insurance — 0.4% | |||||||||||
| 50,000 | ACE INA Holdings, Inc., 5.88%, 06/15/14 | 50,960 | |||||||||
| 175,000 | Allstate Corp. (The), 6.13%, 02/15/12 (c) | 181,267 | |||||||||
| 100,000 | American International Group, Inc., 2.88%, 05/15/08 | 96,752 | |||||||||
AS OF DECEMBER 31, 2006 (continued)
| PRINCIPAL AMOUNT($) | | SECURITY DESCRIPTION | | VALUE($) | |||||||
|---|---|---|---|---|---|---|---|---|---|---|---|
Long-Term Investments — Continued | |||||||||||
Insurance — Continued | |||||||||||
| 75,000 | Protective Life Secured Trust, 4.00%, 04/01/11 | 71,387 | |||||||||
| 400,366 | |||||||||||
Media — 0.5% | |||||||||||
| 100,000 | Comcast Cable Communications, Inc., 6.88%, 06/15/09 | 103,445 | |||||||||
| 50,000 | Comcast Cable Communications Holdings, Inc., 8.38%, 03/15/13 | 56,953 | |||||||||
| 50,000 | COX Communications, Inc., 7.75%, 11/01/10 (c) | 53,774 | |||||||||
| 100,000 | Historic TW, Inc., 9.13%, 01/15/13 (c) | 116,499 | |||||||||
| 100,000 | News America, Inc., 6.75%, 01/09/38 | 106,344 | |||||||||
| 50,000 | Thomson Corp. (The) (Canada), 4.25%, 08/15/09 | 48,568 | |||||||||
| 485,583 | |||||||||||
Multi-Utilities — 0.3% | |||||||||||
| 100,000 | Dominion Resources, Inc., Series B, 6.25%, 06/30/12 | 103,730 | |||||||||
| 175,000 | Duke Energy Corp., 6.25%, 01/15/12 | 182,219 | |||||||||
| 285,949 | |||||||||||
Oil, Gas & Consumable Fuels — 0.4% | |||||||||||
| 100,000 | Conoco Funding Co. (Canada), 6.35%, 10/15/11 | 104,544 | |||||||||
| 200,000 | Occidental Petroleum Corp., 9.25%, 08/01/19 | 263,353 | |||||||||
| 367,897 | |||||||||||
Road & Rail — 0.7% | |||||||||||
| 150,000 | Norfolk Southern Corp., 7.05%, 05/01/37 | 172,676 | |||||||||
| 500,000 | Union Pacific Corp., 6.65%, 01/15/11 | 522,565 | |||||||||
| 695,241 | |||||||||||
Thrifts & Mortgage Finance — 0.3% | |||||||||||
| 100,000 | Countrywide Home Loans, Inc., Series L, 4.00%, 03/22/11 | 94,936 | |||||||||
| Washington Mutual, Inc., | |||||||||||
| 50,000 | 4.20%, 01/15/10 | 48,415 | |||||||||
| 125,000 | 4.63%, 04/01/14 | 117,019 | |||||||||
| 260,370 | |||||||||||
Wireless Telecommunication Services — 0.1% | |||||||||||
| 75,000 | New Cingular Wireless Services, Inc., 7.88%, 03/01/11 | 81,808 | |||||||||
| Total Corporate Bonds (Cost $8,887,046) | 9,031,258 | ||||||||||
Mortgage Pass-Through Securities — 1.9% | |||||||||||
| Federal Home Loan Mortgage Corp. Gold Pools, | |||||||||||
| 268,008 | 4.00%, 08/01/18 | 252,831 | |||||||||
| 22,344 | 6.00%, 03/01/13 | 22,679 | |||||||||
| 118,917 | 6.50%, 03/01/13 – 11/01/22 | 121,850 | |||||||||
| 106,176 | 7.00%, 06/01/13 – 03/01/16 | 108,997 | |||||||||
| 25,094 | 8.00%, 10/01/10 – 09/01/26 | 26,259 | |||||||||
| 22,827 | Federal Home Loan Mortgage Corp. Pools, 8.00%, 04/01/17 | 23,812 | |||||||||
| Federal National Mortgage Association Pools, | |||||||||||
| 190,048 | 5.50%, 12/01/33 | 188,111 | |||||||||
| 72,908 | 6.00%, 08/01/13 – 12/01/13 | 74,047 | |||||||||
| 355,835 | 6.19%, 09/01/08 | 357,766 | |||||||||
| 52,964 | 6.50%, 04/01/13 | 54,207 | |||||||||
| 57,263 | 7.00%, 06/01/13 | 58,932 | |||||||||
| 37,219 | 7.50%, 08/01/09 – 10/01/27 | 38,126 | |||||||||
| 95,332 | 8.00%, 09/01/08 – 05/01/17 | 99,908 | |||||||||
| 37,040 | 8.50%, 11/01/18 | 39,133 | |||||||||
| 16,209 | 9.00%, 12/01/17 | 17,319 | |||||||||
| Government National Mortgage Association Pools, | |||||||||||
| 64,696 | 6.50%, 09/15/13 | 66,281 | |||||||||
| 78,151 | 7.00%, 07/15/08 – 06/15/28 | 79,606 | |||||||||
| 13,618 | 7.50%, 05/15/26 – 01/20/27 | 14,198 | |||||||||
| 143,210 | 8.00%, 12/20/10 – 09/15/27 | 150,479 | |||||||||
| 101,799 | 8.50%, 10/15/11 – 12/15/22 | 108,210 | |||||||||
| Total Mortgage Pass-Through Securities (Cost $1,879,787) | 1,902,751 | ||||||||||
U.S. Government Agency Securities — 1.7% | |||||||||||
| 415,000 | Federal Home Loan Bank System, 5.89%, 03/30/09 | 422,317 | |||||||||
| Federal National Mortgage Association, | |||||||||||
| 585,000 | 5.38%, 11/15/11 | 596,173 | |||||||||
| 400,000 | 7.13%, 06/15/10 | 427,640 | |||||||||
| 150,000 | 7.25%, 01/15/10 | 159,584 | |||||||||
| Total U.S. Government Agency Securities (Cost $1,627,619) | 1,605,714 | ||||||||||
U.S. Treasury Obligations — 10.6% | |||||||||||
| 861,457 | U.S. Treasury Inflation Indexed Bonds, 3.88%, 01/15/09 | 885,147 | |||||||||
| U.S. Treasury Notes, | |||||||||||
| 900,000 | 2.25%, 02/15/07 (c) | 896,978 | |||||||||
| 600,000 | 3.63%, 04/30/07 (c) | 597,281 | |||||||||
| 1,250,000 | 4.25%, 11/15/13 (c) | 1,216,992 | |||||||||
| 125,000 | 4.75%, 03/31/11 | 125,210 | |||||||||
| 2,200,000 | 10.38%, 11/15/12 (c) | 2,297,797 | |||||||||
| U.S. Treasury STRIPS, | |||||||||||
| 3,500,000 | PO, 02/15/12 (c) | 2,764,349 | |||||||||
| PRINCIPAL AMOUNT($) | | SECURITY DESCRIPTION | | VALUE($) | |||||||
|---|---|---|---|---|---|---|---|---|---|---|---|
Long-Term Investments — Continued | |||||||||||
U.S. Treasury Obligations — Continued | |||||||||||
| 2,000,000 | PO, 02/15/15 (c) | 1,368,122 | |||||||||
| 300,000 | PO, 08/15/15 (c) | 200,308 | |||||||||
| Total U.S. Treasury Obligations (Cost $10,639,685) | 10,352,184 | ||||||||||
Foreign Government Securities — 0.0% (g) | |||||||||||
| 40,000 | Mexico Government International Bond (Mexico), 6.38%, 01/16/13 | ||||||||||
| Total Foreign Government Securities (Cost $40,301) | 42,060 | ||||||||||
Supranational — 0.5% | |||||||||||
| 475,000 | Inter-American Development Bank, 8.40%, 09/01/09 (Cost $493,767) | 513,574 | |||||||||
| Total Long-Term Investments (Cost $87,366,776) | 95,310,640 | ||||||||||
| SHARES | | SECURITY DESCRIPTION | | VALUE($) | |||||||
|---|---|---|---|---|---|---|---|---|---|---|---|
Short-Term Investment — 2.9% | |||||||||||
Investment Company — 2.9% | |||||||||||
| 2,866,548 | JPMorgan Liquid Assets Money Market Fund (b) (m) (Cost $2,866,548) | 2,866,548 | |||||||||
| PRINCIPAL AMOUNT($) | | SECURITY DESCRIPTION | | VALUE($) | |||||||
|---|---|---|---|---|---|---|---|---|---|---|---|
Investments of Cash Collateral for Securities on Loan — 12.6% | |||||||||||
Certificates of Deposit — 0.9% | |||||||||||
| 400,000 | Deutsche Bank, New York, FRN, 5.41%, 01/22/08 | 400,000 | |||||||||
| 499,869 | Societe Generale, New York, FRN, 5.34%, 06/20/07 | 499,869 | |||||||||
| 899,869 | |||||||||||
Corporate Notes — 3.7% | |||||||||||
| 400,000 | American Express Credit Corp., FRN, 5.36%, 01/15/08 | 400,000 | |||||||||
| 500,000 | Banque Federative Du Credit, FRN, 5.35%, 07/13/07 | 500,000 | |||||||||
| 600,045 | Beta Finance, Inc., FRN, 5.38%, 03/15/07 | 600,045 | |||||||||
| 650,000 | CDC Financial Production, Inc., FRN, 5.36%, 01/29/07 | 650,000 | |||||||||
| 500,000 | Citigroup Global Markets, Inc., FRN, 5.38%, 01/05/07 | 500,000 | |||||||||
| 499,970 | Macquarie Bank Ltd., FRN, 5.37%, 01/29/08 | 499,970 | |||||||||
| 500,000 | Unicredito Italiano Bank plc (Ireland), FRN, 5.36%, 01/29/08 | 500,000 | |||||||||
| 3,650,015 | |||||||||||
Repurchase Agreements — 8.0% | |||||||||||
| 2,180,536 | Banc of America Securities LLC, 5.32%, dated 12/29/06, due 01/02/07, repurchase price $2,181,825, collateralized by U.S. Government Agency Mortgages | 2,180,536 | |||||||||
| 1,650,000 | Bear Stearns Cos., Inc., 5.31%, dated 12/29/06, due 01/02/07, repurchase price $1,650,974, collateralized by U.S. Government Agency Mortgages | 1,650,000 | |||||||||
| 2,400,000 | HSBC Securities, Inc., 5.28%, dated 12/29/06, due 01/02/07, repurchase price $2,401,408, collateralized by U.S. Government Agency Mortgages | 2,400,000 | |||||||||
| 1,650,000 | Lehman Brothers, Inc., 5.31%, dated 12/29/06, due 01/02/07, repurchase price $1,650,974, collateralized by U.S. Government Agency Mortgages | 1,650,000 | |||||||||
| 7,880,536 | |||||||||||
| Total Investments of Cash Collateral for Securities on Loan (Cost $12,430,420) | 12,430,420 | ||||||||||
Total Investments — 112.5% (Cost $102,663,744) | 110,607,608 | ||||||||||
Liabilities in Excess of Other Assets — (12.5)% | (12,315,685 | ) | |||||||||
NET ASSETS — 100.0% | $ | 98,291,923 | |||||||||
AS OF DECEMBER 31, 2006 (continued)
| (a)— | Non-income producing security. |
| (b)— | Investment in affiliate. Money market fund registered under the Investment Company Act of 1940, as amended, and advised by JPMorgan Investment Advisors Inc. |
| (c)— | Security, or a portion of the security, has been delivered to a counterparty as part of a security lending transaction. |
| (e)— | All or a portion of this security is a 144A or private placement security and can only be sold to qualified institutional buyers. Unless otherwise indicated, these securities have been determined to be liquid under procedures established by the Board of Trustees. |
| (g)— | Amount rounds to less than 0.1%. |
| (m)— | All or a portion of this security is segregated for current or potential holdings of futures, swaps, options, TBA, when-issued securities, delayed delivery securities, and reverse repurchase agreements. |
| ADR— | American Depositary Receipt |
| CMO— | Collateralized Mortgage Obligation |
| FRN— | Floating Rate Note. The rate shown is the rate in effect as of December 31, 2006. |
| IF— | Inverse Floaters represent securities that pay interest at a rate that increases (decreases) with a decline (incline) in a specified index. The rate shown is the rate in effect as of December 31, 2006. The rate may be subject to a cap and floor. |
| PO— | Principal Only represents the right to receive the principal portion only on an underlying pool of mortgage loans. The market value of these securities is extremely volatile in response to changes in market interest rates. As prepayments on the underlying mortgages of these securities increase, the yield on these securities increases. |
| STRIPS— | Separate Trading of Registered Interest and Principal Securities. The STRIPS Program lets investors hold and trade individual interest and principal components of eligible notes and bonds as separate securities. |
| SUB— | Step-Up Bond. The rate shown is the rate in effect as of December 31, 2006. |
| VAR— | Variable rate note. The interest rate shown is the rate in effect at December 31, 2006. |
As of DecemberAS OF DECEMBER 31, 2006
| | Balanced Portfolio | |||||
|---|---|---|---|---|---|---|
ASSETS: | ||||||
| Investments in non-affiliates, at value | $ | 107,741,060 | ||||
| Investments in affiliates, at value | 2,866,548 | |||||
| Total investment securities, at value | 110,607,608 | |||||
| Cash | 7,255 | |||||
| Receivables: | ||||||
| Investment securities sold | 1,642,967 | |||||
| Portfolio shares sold | 4,688 | |||||
| Interest and dividends | 435,390 | |||||
| Prepaid expenses and other assets | 1,148 | |||||
| Total Assets | 112,699,056 | |||||
LIABILITIES: | ||||||
| Payables: | ||||||
| Investment securities purchased | 1,760,120 | |||||
| Collateral for securities lending program | 12,430,420 | |||||
| Portfolio shares redeemed | 119,395 | |||||
| Accrued liabilities: | ||||||
| Investment advisory fees | 34,679 | |||||
| Administration fees | 7,832 | |||||
| Other | 54,687 | |||||
| Total Liabilities | 14,407,133 | |||||
| Net Assets | $ | 98,291,923 | ||||
NET ASSETS: | ||||||
| Paid in capital | $ | 88,043,397 | ||||
| Accumulated undistributed (distributions in excess of) net investment income | 2,814,357 | |||||
| Accumulated net realized gains (losses) | (509,695 | ) | ||||
| Net unrealized appreciation (depreciation) | 7,943,864 | |||||
| Total Net Assets | $ | 98,291,923 | ||||
| Outstanding units of beneficial interest (shares) (unlimited amount authorized, no par value) | 6,081,846 | |||||
| Net asset value, offering and redemption price per share | $ | 16.16 | ||||
| Cost of investments | $ | 102,663,744 | ||||
| Market value of securities on loan | 12,163,211 | |||||
FOR THE YEAR ENDED DECEMBER 31, 2006
| | Balanced Portfolio | |||||
|---|---|---|---|---|---|---|
INVESTMENT INCOME: | ||||||
| Interest income | $ | 2,271,721 | ||||
| Dividend income | 1,297,271 | |||||
| Dividend income from affiliates (a) | 120,644 | |||||
| Income from securities lending (net) | 17,769 | |||||
| Foreign taxes withheld | (99 | ) | ||||
| Total Investment Income | 3,707,306 | |||||
EXPENSES: | ||||||
| Investment advisory fees | 686,026 | |||||
| Administration fees | 132,563 | |||||
| Custodian and accounting fees | 55,244 | |||||
| Professional fees | 57,467 | |||||
| Trustees’ and Officers’ fees | 1,540 | |||||
| Transfer agent fees | 5,477 | |||||
| Printing and mailing costs | 79,987 | |||||
| Interest expense | 41 | |||||
| Other | 12,743 | |||||
| Total expenses | 1,031,088 | |||||
| Less amounts waived | (148,708 | ) | ||||
| Less earnings credits | (390 | ) | ||||
| Net expenses | 881,990 | |||||
| Net Investment Income (Loss) | 2,825,316 | |||||
REALIZED/UNREALIZED GAINS (LOSSES): | ||||||
| Net realized gain (loss) on transactions from investments | 5,062,856 | |||||
| Change in net unrealized appreciation (depreciation) of investments | 3,365,998 | |||||
| Net realized/unrealized gains (losses) | 8,428,854 | |||||
| Change in net assets resulting from operations | $ | 11,254,170 | ||||
| (a) | Includes reimbursements of investment advisory, administration and shareholder servicing fees. See Fees and Other Transactions with Affiliates in the Notes to Financial Statements. |
FOR THE PERIODS INDICATED
| Balanced Portfolio | |||||||||||
|---|---|---|---|---|---|---|---|---|---|---|---|
| | Year Ended 12/31/2006 | | Year Ended 12/31/2005 | ||||||||
CHANGE IN NET ASSETS RESULTING FROM OPERATIONS: | |||||||||||
| Net investment income (loss) | $ | 2,825,316 | $ | 3,360,006 | |||||||
| Net realized gain (loss) | 5,062,856 | 1,615,962 | |||||||||
| Change in net unrealized appreciation (depreciation) | 3,365,998 | (1,691,782 | ) | ||||||||
| Change in net assets resulting from operations | 11,254,170 | 3,284,186 | |||||||||
DISTRIBUTIONS TO SHAREHOLDERS: | |||||||||||
| From net investment income | (3,384,873 | ) | (4,091,588 | ) | |||||||
CHANGE IN NET ASSETS FROM CAPITAL TRANSACTIONS: | |||||||||||
| Proceeds from shares issued | 1,516,307 | 3,263,258 | |||||||||
| Dividends reinvested | 3,384,873 | 4,091,588 | |||||||||
| Cost of shares redeemed | (45,905,927 | ) | (41,147,510 | ) | |||||||
| Change in net assets from capital transactions | (41,004,747 | ) | (33,792,664 | ) | |||||||
NET ASSETS: | |||||||||||
| Change in net assets | (33,135,450 | ) | (34,600,066 | ) | |||||||
| Beginning of period | 131,427,373 | 166,027,439 | |||||||||
| End of period | $ | 98,291,923 | $ | 131,427,373 | |||||||
| Accumulated undistributed (distributions in excess of) net investment income | $ | 2,814,357 | $ | 3,370,483 | |||||||
SHARE TRANSACTIONS: | |||||||||||
| Issued | 100,602 | 223,129 | |||||||||
| Reinvested | 227,020 | 286,125 | |||||||||
| Redeemed | (3,035,801 | ) | (2,802,658 | ) | |||||||
| Change in shares | (2,708,179 | ) | (2,293,404 | ) | |||||||
FOR THE PERIODS INDICATED
| | | | | Per share operating performance | | ||||||||||||||||||||||||||
|---|---|---|---|---|---|---|---|---|---|---|---|---|---|---|---|---|---|---|---|---|---|---|---|---|---|---|---|---|---|---|---|
| Investment operations | Distributions | ||||||||||||||||||||||||||||||
| | Net asset value, beginning of period | | Net investment income (loss) | | Net realized and unrealized gains (losses) on investments | | Total from investment operations | | Net investment income | | Net realized gains | | Total distributions | ||||||||||||||||||
Balanced Portfolio | |||||||||||||||||||||||||||||||
| Year Ended December 31, 2006 | $ | 14.95 | $ | 0.50 | $ | 1.13 | $ | 1.63 | $ | (0.42 | ) | $ | — | $ | (0.42 | ) | |||||||||||||||
| Year Ended December 31, 2005 | 14.98 | 0.40 | (0.04 | ) | 0.36 | (0.39 | ) | — | (0.39 | ) | |||||||||||||||||||||
| Year Ended December 31, 2004 | 14.49 | 0.36 | 0.45 | 0.81 | (0.32 | ) | — | (0.32 | ) | ||||||||||||||||||||||
| Year Ended December 31, 2003 | 12.77 | 0.32 | 1.80 | 2.12 | (0.40 | ) | — | (0.40 | ) | ||||||||||||||||||||||
| Year Ended December 31, 2002 | 14.48 | 0.40 | (2.09 | ) | (1.69 | ) | — | (b) | (0.02 | ) | (0.02 | ) | |||||||||||||||||||
| (a) | Includes adjustments in accordance with accounting principles generally accepted in the United States of America and as such, the net asset value for financial reporting purposes and the returns based upon those net asset values may differ from the net asset value and returns for shareholder transactions. |
| (b) | Amount less than $0.01. |
| | | Ratios/Supplemental data | | ||||||||||||||||||||||||
|---|---|---|---|---|---|---|---|---|---|---|---|---|---|---|---|---|---|---|---|---|---|---|---|---|---|---|---|
| Ratios to average net assets | |||||||||||||||||||||||||||
| Net asset value, end of period | | Total return (a) | | Net assets end of period (000’s) | | Net expenses | | Net investment income (loss) | | Expenses without waivers, reimbursements and earnings credits | | Portfolio turnover rate | |||||||||||||||
| $16.16 | 11.12 | % | $ | 98,292 | 0.78 | % | 2.51 | % | 0.91 | % | 45 | % | |||||||||||||||
| 14.95 | 2.50 | 131,427 | 0.87 | 2.27 | 0.92 | 41 | |||||||||||||||||||||
| 14.98 | 5.73 | 166,027 | 0.88 | 2.29 | 0.89 | 52 | |||||||||||||||||||||
| 14.49 | 17.20 | 179,240 | 0.88 | 2.37 | 0.89 | 36 | |||||||||||||||||||||
| 12.77 | (11.68 | ) | 154,802 | 0.88 | 2.77 | 0.89 | 29 | ||||||||||||||||||||
AS OF DECEMBER 31, 2006
| | Class Offered | |||||
|---|---|---|---|---|---|---|
| Balanced Portfolio | Class 1 | |||||
is required to pay the borrower a portion of such interest for the use of the cash collateral. For loans secured by U.S. government securities, the borrower pays a borrower fee to the lending agent on behalf of the Portfolio. The net income earned on the securities lending (after payment of rebates and the lending agent’s fee) is included in the Statement of Operations as Income from securities lending (net). Information on the investment of cash collateral is shown in the Schedule of Portfolio Investments.
| | Lending Agent Fees Paid | | Market Value of Collateral | | Market Value of Loaned Securities | |||||||||
|---|---|---|---|---|---|---|---|---|---|---|---|---|---|---|
| $ | 6,750 | $ | 12,430,420 | $ | 12,163,211 | |||||||||
AS OF DECEMBER 31, 2006 (continued)
| | Paid-in-capital | | Accumulated Undistributed/ (Overdistributed) Net Investment Income | | Accumulated Net Realized Gain (Loss) on Investments | |||||||||
|---|---|---|---|---|---|---|---|---|---|---|---|---|---|---|
| $ | (5,580 | ) | $ | 3,431 | $ | 2,149 | ||||||||
| | Purchases (excluding U.S. Government) | | Sales (excluding U.S. Government) | | Purchases of U.S. Government | | Sales of U.S. Government | |||||||||||
|---|---|---|---|---|---|---|---|---|---|---|---|---|---|---|---|---|---|---|
| $ | 47,267,931 | $ | 87,906,051 | $ | 2,087,150 | $ | 2,903,741 | |||||||||||
| | Aggregate Cost | | Gross Unrealized Appreciation | | Gross Unrealized Depreciation | | Net Unrealized Appreciation (Depreciation) | |||||||||||
|---|---|---|---|---|---|---|---|---|---|---|---|---|---|---|---|---|---|---|
| $ | 103,660,947 | $ | 8,069,265 | $ | 1,122,604 | $ | 6,946,661 | |||||||||||
| Total Distributions Paid From: | ||||||||||
|---|---|---|---|---|---|---|---|---|---|---|
| | Ordinary Income | | Total Distributions Paid | |||||||
| $ | 3,384,873 | $ | 3,384,873 | |||||||
AS OF DECEMBER 31, 2006 (continued)
| Total Distributions Paid From: | ||||||||||
|---|---|---|---|---|---|---|---|---|---|---|
| | Ordinary Income | | Total Distributions Paid | |||||||
| $ | 4,091,588 | $ | 4,091,588 | |||||||
| | Current Distributable Ordinary Income | | Current Distributable Long-Term Capital Gain or (Tax Basis Capital Loss Carryover) | | Unrealized Appreciation (Depreciation) | |||||||||
|---|---|---|---|---|---|---|---|---|---|---|---|---|---|---|
| $ | 2,816,653 | $ | 487,506 | $ | 6,946,661 | |||||||||
| • | 30%–60% medium- and large-cap U.S. equity securities |
| • | 25%–50% U.S. and foreign fixed income securities |
| • | 0%–30% foreign equity securities |
| • | 0%–20% small-cap U.S. equity securities |
Shareholders of JPMorgan Insurance Trust Balanced Portfolio:
New York, New York
February 15, 2007
(Unaudited)
| Name (Year of Birth); Positions With the Portfolio | | Principal Occupations During Past 5 Years | | Number of Portfolios in Fund Complex Overseen by Trustee (1) | | Other Directorships Held Outside Fund Complex | |||||||||
|---|---|---|---|---|---|---|---|---|---|---|---|---|---|---|---|
Independent Trustees | |||||||||||||||
| William J. Armstrong (1941); Trustee since 2005; Trustee of heritage JPMorgan Funds since 1987. | Retired; CFO and Consultant, EduNeering, Inc. (internet business education supplier) (2000–2001); Vice President and Treasurer, Ingersoll–Rand Company (manufacturer of industrial equipment) (1972–2000). | 131 | None. | ||||||||||||
| Roland R. Eppley, Jr. (1932); Trustee since 2005; Trustee of heritage JPMorgan Funds since 1989. | Retired; President and Chief Executive Officer, Eastern States Bankcard (1971–1988). | 131 | None. | ||||||||||||
| John F. Finn (1947); Trustee since 2005; Trustee of heritage One Group Mutual Funds since 1998. | President and Chief Executive Officer, Gardner, Inc. (wholesale distributor to outdoor power equipment industry) (1979–present). | 131 | Director, Cardinal Health, Inc (CAH) (1994–present); Chairman, The Columbus Association of the Performing Arts (CAPA) (2003–present). | ||||||||||||
| Dr. Matthew Goldstein (1941); Trustee since 2005; Trustee of heritage JPMorgan Funds since 2003. | Chancellor, City University of New York (1999–present); President, Adelphi University (New York) (1998–1999). | 131 | Director, Albert Einstein School of Medicine (1998–present); Director, New Plan Excel Realty Trust, Inc. (real estate investment trust) (2000–present); Director, Lincoln Center Institute for the Arts in Education (1999–present). | ||||||||||||
| Robert J. Higgins (1945); Trustee since 2005; Trustee of heritage JPMorgan Funds since 2002. | Retired; Director of Administration of the State of Rhode Island (2003–2004); President — Consumer Banking and Investment Services, Fleet Boston Financial (1971–2001). | 131 | None. | ||||||||||||
| Peter C. Marshall (1942); Trustee since 2005; Trustee of heritage One Group Mutual Funds since 1994. | Self-employed business consultant (2001–present); Senior Vice President, W.D. Hoard, Inc. (corporate parent of DCI Marketing, Inc.) (2000–2002); President, DCI Marketing, Inc. (1992–2000). | 131 | None. | ||||||||||||
| Marilyn McCoy (1948); Trustee since 2005; Trustee of heritage One Group Mutual Funds since 1999. | Vice President of Administration and Planning, Northwestern University (1985–present). | 131 | Trustee, Mather LifeWays (1994–present); Trustee, Carleton College (2003–present). | ||||||||||||
| William G. Morton, Jr. (1937); Trustee since 2005; Trustee of heritage JPMorgan Funds since 2003. | Retired; Chairman Emeritus (2001–2002), and Chairman and Chief Executive Officer, Boston Stock Exchange (1985–2001). | 131 | Director, Radio Shack Corporation (electronics) (1987–present); Director, The National Football Foundation and College Hall of Fame (1994–present); Trustee, Stratton Mountain School (2001–present). | ||||||||||||
| Name (Year of Birth); Positions With the Portfolio | | Principal Occupations During Past 5 Years | | Number of Portfolios in Fund Complex Overseen by Trustee (1) | | Other Directorships Held Outside Fund Complex | |||||||||
|---|---|---|---|---|---|---|---|---|---|---|---|---|---|---|---|
Independent Trustees (continued) | |||||||||||||||
| Robert A. Oden, Jr. (1946); Trustee since 2005; Trustee of heritage One Group Mutual Funds since 1997. | President, Carleton College (2002–present); President, Kenyon College (1995–2002). | 131 | Director, American University in Cairo. | ||||||||||||
| Fergus Reid, III (1932); Trustee (Chairman) since 2005; Trustee (Chairman) of heritage JPMorgan Funds since 1987. | Chairman, Lumelite Corporation (plastics manufacturing) (2003–present); Chairman and Chief Executive Officer, Lumelite Corporation (1985–2002). | 131 | Trustee, Morgan Stanley Funds (196 portfolios) (1995–present). | ||||||||||||
| Frederick W. Ruebeck (1939); Trustee since 2005; Trustee of heritage One Group Mutual Funds since 1994. | Advisor, Jerome P. Green & Associates, LLC (broker-dealer) (2000–present); Chief Investment Officer, Wabash College (2004–present); self-employed consultant (2000–present); Director of Investments, Eli Lilly and Company (1988–1999). | 131 | Trustee, Wabash College (1988–present); Chairman, Indianapolis Symphony Orchestra Foundation (1994–present). | ||||||||||||
| James J. Schonbachler (1943); Trustee since 2005; Trustee of heritage JPMorgan Funds since 2001. | Retired; Managing Director of Bankers Trust Company (financial services) (1968–1998). | 131 | None. | ||||||||||||
Interested Trustee | |||||||||||||||
| Leonard M. Spalding, Jr.* (1935); Trustee since 2005; Trustee of heritage JPMorgan Funds since 1998. | Retired; Chief Executive Officer, Chase Mutual Funds (investment company) (1989–1998); President and Chief Executive Officer, Vista Capital Management (investment management) (1990–1998); Chief Investment Executive, Chase Manhattan Private Bank (investment management) (1990–1998). | 131 | Director, Glenview Trust Company, LLC (2001–present); Trustee, St. Catherine College (1998–present); Trustee, Bellarmine University (2000–present); Director, Springfield-Washington County Economic Development Authority (1997–present); Trustee, Marion and Washington County, Kentucky Airport Board (1998–present); Trustee, Catholic Education Foundation (2005–present). | ||||||||||||
| (1) | A Fund Complex means two or more registered investment companies that hold themselves out to investors as related companies for purposes of investment and investor services or have a common investment adviser or have an investment adviser that is an affiliated person of the investment adviser of any of the other registered investment companies. The JPMorgan Funds Complex for which the Board of Trustees serves currently includes eight registered investment companies (131 funds). |
| * | Mr. Spalding is deemed to be an “interested person” due to his ownership of JPMorgan Chase stock. |
(Unaudited)
| Name (Year of Birth), Positions Held with the Trust | | Principal Occupations During Past 5 Years | ||||
|---|---|---|---|---|---|---|
| George C.W. Gatch (1962), President since 2005 | Managing Director, J.P. Morgan Investment Management Inc.; Director and President, JPMorgan Distribution Services, Inc. and JPMorgan Funds Management, Inc. since 2005. Mr. Gatch is CEO and President of the JPMorgan Funds. Mr. Gatch has been an employee of JPMorgan since 1986 and has held positions such as President and CEO of DKB Morgan, a Japanese mutual fund company, which was a joint venture between J.P. Morgan and Dai-Ichi Kangyo Bank, as well as positions in business management, marketing and sales. | |||||
| Robert L. Young (1963), Senior Vice President since 2005* | Director and Vice President, JPMorgan Distribution Services, Inc. and JPMorgan Funds Management, Inc.; Chief Operating Officer, JPMorgan Funds since 2005, and One Group Mutual Funds from 2001 until 2005. Mr. Young was Vice President and Treasurer, JPMorgan Funds Management, Inc. (formerly One Group Administrative Services) and Vice President and Treasurer, JPMorgan Distribution Services, Inc. (formerly One Group Dealer Services, Inc.) from 1999 to 2005. | |||||
| Patricia A. Maleski (1960), Vice President and Chief Administrative Officer since 2005 | Managing Director, JPMorgan Funds Management, Inc.; previously, Treasurer, JPMorgan Funds and Head of Funds Administration and Board Liaison. Ms. Maleski was Vice President of Finance for the Pierpont Group, Inc. from 1996–2001, an independent company owned by the Board of Directors/Trustees of the JPMorgan Funds, prior to joining JPMorgan Chase & Co. in 2001. | |||||
| Stephanie J. Dorsey (1969), Treasurer since 2005* | Vice President, JPMorgan Funds Management, Inc.; Director of Mutual Fund Administration, JPMorgan Funds Management, Inc. (formerly One Group Administrative Services), from 2004 to 2005; Ms. Dorsey worked for JPMorgan Chase & Co., (formerly Bank One Corporation) from 2003 to 2004; prior to joining Bank One Corporation, she was a Senior Manager specializing in Financial Services audits at PricewaterhouseCoopers LLP from 1992 through 2002. | |||||
| Stephen M. Ungerman (1953), Chief Compliance Officer since 2005 | Senior Vice President, JPMorgan Chase & Co.; Mr. Ungerman was head of Fund Administration — Pooled Vehicles from 2000 to 2004. Mr. Ungerman held a number of positions in Prudential Financial’s asset management business prior to 2000. | |||||
| Paul L. Gulinello (1950), AML Compliance Officer since 2005 | Vice President and Anti Money Laundering Compliance Officer for JPMorgan Asset Management Americas, additionally responsible for personal trading and compliance testing since 2004; Treasury Services Operating Risk Management and Compliance Executive supporting all JPMorgan Treasury Services business units from July 2000 to 2004. | |||||
| Stephen M. Benham (1959), Secretary since 2005 | Vice President and Assistant General Counsel, JPMorgan Chase & Co. since 2004; Vice President (Legal Advisory) of Merrill Lynch Investment Managers, L.P. from 2000 to 2004. | |||||
| Elizabeth A. Davin (1964), Assistant Secretary since 2005* | Vice President and Assistant General Counsel, JPMorgan Chase & Co. since 2005; Senior Counsel, JPMorgan Chase & Co. (formerly Bank One Corporation) from 2004 to 2005; Assistant General Counsel and Associate General Counsel and Vice President, Gartmore Global Investments, Inc. from 1999 to 2004. | |||||
| Jessica K. Ditullio (1962), Assistant Secretary since 2005* | Vice President and Assistant General Counsel, JPMorgan Chase & Co. since 2005; Ms. Ditullio has served as an attorney with various titles for JPMorgan Chase & Co. (formerly Bank One Corporation) since 1990. | |||||
| Nancy E. Fields (1949), Assistant Secretary since 2005* | Vice President, JPMorgan Funds Management, Inc. and JPMorgan Distribution Services, Inc.; From 1999 to 2005, Director, Mutual Fund Administration, JPMorgan Funds Management, Inc. (formerly One Group Administrative Services) and Senior Project Manager, Mutual Funds, JPMorgan Distribution Services, Inc. (formerly One Group Dealer Services, Inc.). | |||||
| Michael C. Raczynski (1975), Assistant Secretary since 2006 | Vice President and Assistant General Counsel, JPMorgan Chase & Co. since 2006; Associate, Stroock & Stroock & Lavan LLP from 2001 to 2006. | |||||
| Ellen W. O’Brien (1957), Assistant Secretary since 2005** | Assistant Vice President, JPMorgan Investor Services, Co., responsible for Blue Sky registration. Ms. O’Brien has served in this capacity since joining the firm in 1991. | |||||
| Name (Year of Birth), Positions Held with the Trust | | Principal Occupations During Past 5 Years | ||||
|---|---|---|---|---|---|---|
| Laura S. Melman (1966) Assistant Treasurer since 2006 | Vice President, JPMorgan Funds Management, Inc. since August, 2006, responsible for Taxation; Vice President of Structured Products at The Bank of New York Co., Inc. from 2001 to 2006. | |||||
| Arthur A. Jensen (1966), Assistant Treasurer since 2005* | Vice President, JPMorgan Funds Management, Inc. since April 2005; formerly, Vice President of Financial Services of BISYS Fund Services, Inc. from 2001 to 2005; Mr. Jensen was Section Manager at Northern Trust Company and Accounting Supervisor at Allstate Insurance Company prior to 2001. | |||||
| Jeffrey D. House (1972) Assistant Treasurer since 2006* | Vice President, JPMorgan Funds Management, Inc. since July 2006; formerly, Senior Manager of Financial Services at BISYS Fund Services, Inc. from 1995 to 2006. | |||||
| * | The contact address for the officer is 1111 Polaris Parkway, Columbus, OH 43271. |
| ** | The contact address for the officer is 73 Tremont Street, Floor 1, Boston MA 02108. |
(Unaudited)
December 31, 2006
| Class 1 | | Beginning Account Value, July 1, 2006 | | Ending Account Value, December 31, 2006 | | Expenses Paid During Period July 1, 2006 to December 31, 2006* | | Annualized Expense Ratio | ||||||||||
|---|---|---|---|---|---|---|---|---|---|---|---|---|---|---|---|---|---|---|
| Actual | $ | 1,000.00 | $ | 1,096.30 | $ | 4.12 | 0.78 | % | ||||||||||
| Hypothetical | 1,000.00 | 1,021.27 | 3.97 | 0.78 | ||||||||||||||
| * | Expenses are equal to the Portfolio’s annualized expense ratio, multiplied by the average account value over the period, multiplied by 184/365 (to reflect the one-half year period). |
(Unaudited)
by the Advisor
(Unaudited) (continued)
contractual services provided to the Funds, less expenses of providing such services. Expenses include direct and indirect costs and are calculated using an allocation methodology developed by the Advisor. The Trustees also recognized that it is difficult to make comparisons of profitability from fund investment advisory contracts because comparative information is not generally publicly available and is affected by numerous factors, including the structure of the particular Advisor, the types of funds it manages, its business mix, numerous assumptions regarding allocations and the fact that publicly-traded fund managers’ operating profits and net income are net of distribution and marketing expenses. Based on their review, the Trustees concluded that the profitability to the Advisor of each of the Investment Advisory Agreements was not unreasonable in light of the services and benefits provided to each Fund.
Compliance Officer
Universe Group. The Trustees considered the Advisor’s analysis of the Portfolio’s investment processes, portfolio construction and peer group and were satisfied with the actions taken. The Trustees requested the Portfolio’s Advisor to similarly review the Portfolio with members of the Equity subcommittee at each of their regular meetings over the course of the year.
(Unaudited)
© JPMorgan Chase & Co., 2007 All rights reserved. December 2006. | AN-JPMITBP-1206 |
This material must be preceded or accompanied by a current prospectus.
| President’s Letter | 1 | |||||
| Portfolio Commentary: | ||||||
| JPMorgan Insurance Trust Core Bond Portfolio | 2 | |||||
| Schedule of Portfolio Investments | 4 | |||||
| Financial Statements | 16 | |||||
| Financial Highlights | 20 | |||||
| Notes to Financial Statements | 22 | |||||
| Report of Independent Registered Public Accounting Firm | 27 | |||||
| Trustees | 28 | |||||
| Officers | 30 | |||||
| Schedule of Shareholder Expenses | 32 | |||||
| Board Approval of Investment Advisory Agreement | 33 | |||||
| Tax Letter | 36 |
| • | Rising inflationary pressures prompted Fed to begin rate increase cycle |
| • | Bond yields rose on inflation and interest rate concerns |
| • | Slowed home sales and manufacturing activity curbed economic growth |
| • | Fed paused rate hike cycle in the latter half of 2006, triggering a rally in the markets |
JANUARY 5, 2007 (Unaudited)
| “After growing by a meager 1.8% in the fourth quarter of 2005, the U.S. economy began 2006 with impressive strength.” | |||
| • | The two-year Treasury yield began the year at 4.40%, peaked at 5.28% on June 28, and ended 2006 at 4.81%. |
| • | The 10-year Treasury yield began the year at 4.39%, peaked at 5.25% on June 28, and ended the year at 4.70%. |
| • | The 30-year Treasury yield started the year at 4.54%, peaked at 5.31% on May 12, and ended 2006 at 4.81%. |
President
JPMorgan Funds
AS OF DECEMBER 31, 2006 (Unaudited)
| Portfolio Inception | May 1, 1997 | |||||
| Fiscal Year End | December 31 | |||||
| Net Assets as of 12/31/2006 | $252,155,649 | |||||
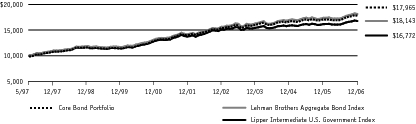
| Primary Benchmark | Lehman Brothers Aggregate Bond Index | |||||
| Average Credit Quality | AAA | |||||
| Duration | 4.55 Years | |||||
Q: | HOW DID THE PORTFOLIO PERFORM? |
A: | The JPMorgan Insurance Trust Core Bond Portfolio, which seeks to maximize total return by investing primarily in a diversified portfolio of intermediate- and long-term debt securities, returned 4.13% (Class 1 Shares) over the 12 months ended December 31, 2006, compared to the 4.33% return for the Lehman Brothers Aggregate Bond Index over the same period.* |
Q: | WHY DID THE PORTFOLIO PERFORM THIS WAY? |
A: | The Portfolio underperformed its benchmark, the Lehman Brothers Aggregate Bond Index for the 12-month period. Our underweight in the corporate sector and lower-rated credits detracted from performance, as corporate bonds continued to benefit from solid fundamentals, historically low default rates and robust foreign demand. Due to rising name-specific event risk and generally tight spreads, we have maintained a defensive credit posture. Our high-quality bias, however, was a drag on performance as lower-quality credit issues outperformed during the year. The BBB segment of the investment-grade universe posted a return of 155 basis points (bps) compared to 115 bps for the A segment and 113 bps for the AA segment. |
Q: | HOW WAS THE PORTFOLIO MANAGED? |
A: | We continued to focus on security selection as our primary strategy. We remained overweight in mortgage-backed securities (MBS) and underweight in agency debentures and corporate bonds. |
| Collateralized Mortgage Obligations | 50.1 | % | ||||
| U.S. Treasury Obligations | 15.8 | |||||
| Mortgage Pass-Through Securities | 11.5 | |||||
| Corporate Bonds | 10.9 | |||||
| Asset-Backed Securities | 1.5 | |||||
| Commercial Mortgage-Backed Securities | 1.2 | |||||
| Other (less than 1%) | 1.4 | |||||
| Short-Term Investments | 7.0 | |||||
| Investments of Cash Collateral for Securities on Loan | 9.1 |
| * | The advisor seeks to achieve the Portfolio’s objective. There can be no guarantee it will be achieved. |
| ** | Percentages indicated are based upon net assets as of December 31, 2006. The Portfolio’s composition is subject to change. |
| INCEPTION DATE OF CLASS | 1 YEAR | 5 YEAR | SINCE INCEPTION | |||||||||||||||
|---|---|---|---|---|---|---|---|---|---|---|---|---|---|---|---|---|---|---|
CLASS 1 SHARES | 5/01/97 | 4.13 | % | 4.87 | % | 6.25 | % | |||||||||||
CLASS 2 SHARES | 8/16/06 | 4.04 | 4.85 | 6.24 | ||||||||||||||
AS OF DECEMBER 31, 2006
| PRINCIPAL AMOUNT($) | | SECURITY DESCRIPTION | | VALUE($) | |||||||
|---|---|---|---|---|---|---|---|---|---|---|---|
Long-Term Investments — 92.4% | |||||||||||
Asset-Backed Securities — 1.5% | |||||||||||
| 150,000 | American Express Credit Account Master Trust, Series 2004-3, Class A, 4.35%, 12/15/11 | 147,710 | |||||||||
| AmeriCredit Automobile Receivables Trust, | |||||||||||
| 43,823 | Series 2003-BX, Class A4A, 2.72%, 01/06/10 | 43,427 | |||||||||
| 300,000 | Series 2006-BG, Class A3, 5.21%, 10/06/11 | 299,995 | |||||||||
| 400,000 | Series 2006-BG, Class A4, 5.21%, 09/06/13 | 400,491 | |||||||||
| Citibank Credit Card Issuance Trust, | |||||||||||
| 150,000 | Series 2002-A1, Class A1, 4.95%, 02/09/09 | 149,977 | |||||||||
| 450,000 | Series 2002-C2, Class C2, 6.95%, 02/18/14 | 478,670 | |||||||||
| 250,000 | Series 2005-B1, Class B1, 4.40%, 09/15/10 | 246,404 | |||||||||
| 132,743 | CNH Equipment Trust, Series 2003-B, Class A4B, 3.38%, 02/15/11 | 131,137 | |||||||||
| 44,498 | Conseco Finance, Series 2001-B, Class 1M1, 7.27%, 06/15/32 | 44,632 | |||||||||
| 539,968 | Countrywide Asset-Backed Certificates, Series 2004-AB2, Class A2, FRN, 5.62%, 05/25/36 | 540,970 | |||||||||
| 175,000 | Household Automotive Trust, Series 2005-1 Class A4, 4.35%, 06/18/12 | 172,137 | |||||||||
| MBNA Credit Card Master Note Trust, | |||||||||||
| 200,000 | Series 2002-C1, Class C1, 6.80%, 07/15/14 | 212,753 | |||||||||
| 75,000 | Series 2003-C1, Class C1, FRN, 7.05%, 06/15/12 | 78,177 | |||||||||
| MBNA Master Credit Card Trust, | |||||||||||
| 240,000 | Series 1999-J, Class C, 7.85%, 02/15/12 (e) | 256,568 | |||||||||
| 200,000 | Series 2000-D, Class C, 8.40%, 09/15/09 | 201,643 | |||||||||
| 3,709 | Residential Asset Mortgage Products, Inc., Series 2001-RS3, Class AI4, SUB, 6.79%, 10/25/31 | 3,695 | |||||||||
| 287,971 | WFS Financial Owner Trust, Series 2003-4, Class A4, 3.15%, 05/20/11 | 284,379 | |||||||||
| Total Asset-Backed Securities (Cost $3,660,477) | 3,692,765 | ||||||||||
Collateralized Mortgage Obligations — 50.1% | |||||||||||
Agency CMO — 31.5% | |||||||||||
| Federal Home Loan Mortgage Corp., | |||||||||||
| 24,077 | Series 11, Class D, 9.50%, 07/15/19 | 25,114 | |||||||||
| 13,539 | Series 22, Class C, 9.50%, 04/15/20 | 14,045 | |||||||||
| 3,902 | Series 47, Class F, 10.00%, 06/15/20 | 4,072 | |||||||||
| 2,485 | Series 99, Class Z, 9.50%, 01/15/21 | 2,607 | |||||||||
| 3,240 | Series 1065, Class J, 9.00%, 04/15/21 | 3,386 | |||||||||
| 422,527 | Series 1113, Class J, 8.50%, 06/15/21 | 422,224 | |||||||||
| 23,898 | Series 1250, Class J, 7.00%, 05/15/22 | 23,853 | |||||||||
| 41,735 | Series 1316, Class Z, 8.00%, 06/15/22 | 43,429 | |||||||||
| 72,625 | Series 1324, Class Z, 7.00%, 07/15/22 | 72,671 | |||||||||
| 47,306 | Series 1343, Class LA, 8.00%, 08/15/22 | 47,323 | |||||||||
| 55,135 | Series 1343, Class LB, 7.50%, 08/15/22 | 55,132 | |||||||||
| 44,232 | Series 1394, Class ID, IF, 9.57%, 10/15/22 | 46,368 | |||||||||
| 38,642 | Series 1395, Class G, 6.00%, 10/15/22 | 38,568 | |||||||||
| 26,241 | Series 1404, Class FA, 4.50%, 11/15/07 | 26,082 | |||||||||
| 1,588 | Series 1465, Class SA, IF, IO, 3.63%, 02/15/08 | 28 | |||||||||
| 28,254 | Series 1505, Class Q, 7.00%, 05/15/23 | 28,919 | |||||||||
| 54,228 | Series 1518, Class G, IF, 3.90%, 05/15/23 | 52,193 | |||||||||
| 57,618 | Series 1541, Class O, FRN, 3.79%, 07/15/23 | 56,375 | |||||||||
| 16,091 | Series 1561, Class TA, PO, 08/15/08 | 15,743 | |||||||||
| 69,882 | Series 1596, Class D, 6.50%, 10/15/13 | 70,800 | |||||||||
| 22,061 | Series 1607, Class SA, IF, 9.33%, 10/15/13 | 23,827 | |||||||||
| 49,861 | Series 1609, Class LG, IF, 5.69%, 11/15/23 | 50,224 | |||||||||
| 33,580 | Series 1625, Class SD, IF, 8.50%, 12/15/08 | 34,228 | |||||||||
| 700,000 | Series 1630, Class PK, 6.00%, 11/15/23 | 709,440 | |||||||||
| 500,000 | Series 1638, Class H, 6.50%, 12/15/23 | 517,862 | |||||||||
| 2,387 | Series 1671, Class QC, IF, 10.00%, 02/15/24 | 2,874 | |||||||||
| 9,174 | Series 1685, Class Z, 6.00%, 11/15/23 | 9,156 | |||||||||
| 7,605 | Series 1689, Class SD, IF, 9.24%, 10/15/23 | 7,753 | |||||||||
| 31,987 | Series 1700, Class GA, PO, 02/15/24 | 28,933 | |||||||||
| 2,100,000 | Series 1732, Class K, 6.50%, 05/15/24 | 2,154,422 | |||||||||
| 140,991 | Series 1798, Class F, 5.00%, 05/15/23 | 137,321 | |||||||||
| 306,847 | Series 1863, Class Z, 6.50%, 07/15/26 | 314,690 | |||||||||
| 4,027 | Series 1865, Class D, PO, 02/15/24 | 2,598 | |||||||||
| 60,550 | Series 1900, Class T, PO, 08/15/08 | 60,107 | |||||||||
| 7,194 | Series 1967, Class PC, PO, 10/15/08 | 7,141 | |||||||||
| 93,069 | Series 1981, Class Z, 6.00%, 05/15/27 | 93,685 | |||||||||
| 113,668 | Series 1987, Class PE, 7.50%, 09/15/27 | 115,899 | |||||||||
| 80,857 | Series 2025, Class PE, 6.30%, 01/15/13 | 81,595 | |||||||||
| 31,188 | Series 2033, Class SN, IF, IO, 11.92%, 03/15/24 | 11,236 | |||||||||
| 52,746 | Series 2038, Class PN, IO, 7.00%, 03/15/28 | 11,600 | |||||||||
| 140,561 | Series 2054, Class PV, 7.50%, 05/15/28 | 145,882 | |||||||||
| 114,992 | Series 2055, Class OE, 6.50%, 05/15/13 | 116,864 | |||||||||
| 240,901 | Series 2064, Class TE, 7.00%, 06/15/28 | 248,378 | |||||||||
| 195,037 | Series 2075, Class PH, 6.50%, 08/15/28 | 199,012 | |||||||||
| 167,220 | Series 2102, Class TU, 6.00%, 12/15/13 | 169,231 | |||||||||
| 353,347 | Series 2115, Class PE, 6.00%, 01/15/14 | 357,502 | |||||||||
| 56,233 | Series 2132, Class PD, 6.00%, 11/15/27 | 56,284 | |||||||||
| 39,334 | Series 2132, Class SB, IF, 7.37%, 03/15/29 | 41,252 | |||||||||
| 88,601 | Series 2134, Class PI, IO, 6.50%, 03/15/19 | 16,005 | |||||||||
| 21,924 | Series 2135, Class UK, IO, 6.50%, 03/15/14 | 3,144 | |||||||||
| 40,826 | Series 2143, Class CD, 6.00%, 02/15/28 | 40,862 | |||||||||
| 829,000 | Series 2172, Class QC, 7.00%, 07/15/29 | 869,283 | |||||||||
| 344,576 | Series 2182, Class ZB, 8.00%, 09/15/29 | 360,721 | |||||||||
| 65,108 | Series 2247, Class Z, 7.50%, 08/15/30 | 67,704 | |||||||||
| 24,827 | Series 2261, Class ZY, 7.50%, 10/15/30 | 25,136 | |||||||||
| PRINCIPAL AMOUNT($) | | SECURITY DESCRIPTION | | VALUE($) | |||||||
|---|---|---|---|---|---|---|---|---|---|---|---|
Long-Term Investments — Continued | |||||||||||
Agency CMO — Continued | |||||||||||
| 178,924 | Series 2283, Class K, 6.50%, 12/15/23 | 186,166 | |||||||||
| 6,372 | Series 2299, Class G, 7.00%, 05/15/14 | 6,360 | |||||||||
| 34,551 | Series 2306, Class K, PO, 05/15/24 | 28,156 | |||||||||
| 82,923 | Series 2306, Class SE, IF, IO, 5.99%, 05/15/24 | 11,842 | |||||||||
| 124,972 | Series 2325, Class PM, 7.00%, 06/15/31 | 130,924 | |||||||||
| 396,311 | Series 2344, Class QG, 6.00%, 08/15/16 | 401,329 | |||||||||
| 662,698 | Series 2344, Class ZD, 6.50%, 08/15/31 | 679,296 | |||||||||
| 109,574 | Series 2344, Class ZJ, 6.50%, 08/15/31 | 111,980 | |||||||||
| 76,449 | Series 2345, Class NE, 6.50%, 08/15/31 | 77,878 | |||||||||
| 677,711 | Series 2345, Class PQ, 6.50%, 08/15/16 | 692,512 | |||||||||
| 255,647 | Series 2355, Class BP, 6.00%, 09/15/16 | 258,966 | |||||||||
| 155,999 | Series 2359, Class ZB, 8.50%, 06/15/31 | 173,720 | |||||||||
| 47,710 | Series 2362, Class PD, 6.50%, 06/15/20 | 47,920 | |||||||||
| 2,773 | Series 2374, Class PV, 5.50%, 12/15/14 | 2,768 | |||||||||
| 3,306 | Series 2391, Class QE, 5.50%, 05/15/15 | 3,300 | |||||||||
| 439,421 | Series 2391, Class QR, 5.50%, 12/15/16 | 440,568 | |||||||||
| 487,847 | Series 2392, Class PV, 6.00%, 12/15/20 | 489,155 | |||||||||
| 347,011 | Series 2394, Class MC, 6.00%, 12/15/16 | 351,690 | |||||||||
| 146,419 | Series 2410, Class OE, 6.38%, 02/15/32 | 149,013 | |||||||||
| 208,024 | Series 2410, Class QS, IF, 5.59%, 02/15/32 | 206,940 | |||||||||
| 139,541 | Series 2410, Class QX, IF, IO, 3.30%, 02/15/32 | 12,952 | |||||||||
| 100,221 | Series 2412, Class SE, IF, 4.95%, 02/15/09 | 99,499 | |||||||||
| 100,000 | Series 2412, Class SP, IF, 5.40%, 02/15/32 | 97,498 | |||||||||
| 292,772 | Series 2423, Class MC, 7.00%, 03/15/32 | 302,037 | |||||||||
| 451,227 | Series 2423, Class MT, 7.00%, 03/15/32 | 465,504 | |||||||||
| 227,841 | Series 2435, Class CJ, 6.50%, 04/15/32 | 236,460 | |||||||||
| 470,000 | Series 2435, Class VH, 6.00%, 07/15/19 | 475,280 | |||||||||
| 195,130 | Series 2444, Class ES, IF, IO, 2.60%, 03/15/32 | 15,027 | |||||||||
| 130,087 | Series 2450, Class SW, IF, IO, 2.65%, 03/15/32 | 9,979 | |||||||||
| 121,604 | Series 2454, Class BG, 6.50%, 08/15/31 | 122,405 | |||||||||
| 300,000 | Series 2455, Class GK, 6.50%, 05/15/32 | 308,394 | |||||||||
| 261,817 | Series 2460, Class VZ, 6.00%, 11/15/29 | 263,635 | |||||||||
| 199,726 | Series 2484, Class LZ, 6.50%, 07/15/32 | 207,823 | |||||||||
| 676,702 | Series 2498, Class UD, 5.50%, 06/15/16 | 676,287 | |||||||||
| 790,000 | Series 2500, Class MC, 6.00%, 09/15/32 | 794,263 | |||||||||
| 242,351 | Series 2500, Class TD, 5.50%, 02/15/16 | 242,065 | |||||||||
| 150,000 | Series 2503, Class BH, 5.50%, 09/15/17 | 150,369 | |||||||||
| 186,106 | Series 2513, Class YO, PO, 02/15/32 | 161,813 | |||||||||
| 500,000 | Series 2515, Class DE, 4.00%, 03/15/32 | 467,852 | |||||||||
| 500,000 | Series 2535, Class BK, 5.50%, 12/15/22 | 499,548 | |||||||||
| 300,000 | Series 2543, Class YX, 6.00%, 12/15/32 | 302,953 | |||||||||
| 500,000 | Series 2544, Class HC, 6.00%, 12/15/32 | 504,889 | |||||||||
| 314,042 | Series 2565, Class MB, 6.00%, 05/15/30 | 316,775 | |||||||||
| 500,000 | Series 2575, Class ME, 6.00%, 02/15/33 | 504,071 | |||||||||
| 176,944 | Series 2586, Class WI, IO, 6.50%, 03/15/33 | 40,352 | |||||||||
| 206,919 | Series 2594, Class VA, 6.00%, 03/15/14 | 209,010 | |||||||||
| 400,000 | Series 2594, Class VQ, 6.00%, 08/15/20 | 403,259 | |||||||||
| 462,755 | Series 2597, Class DS, IF, IO, 2.20%, 02/15/33 | 29,715 | |||||||||
| 666,288 | Series 2599, Class DS, IF, IO, 1.65%, 02/15/33 | 35,301 | |||||||||
| 751,575 | Series 2610, Class DS, IF, IO, 1.75%, 03/15/33 | 44,360 | |||||||||
| 1,032,433 | Series 2611, Class SH, IF, IO, 2.30%, 10/15/21 | 65,247 | |||||||||
| 1,000,000 | Series 2611, Class UH, 4.50%, 05/15/18 | 942,447 | |||||||||
| 500,000 | Series 2617, Class GR, 4.50%, 05/15/18 | 472,391 | |||||||||
| 916,639 | Series 2626, Class NS, IF, IO, 1.20%, 06/15/23 | 50,566 | |||||||||
| 500,000 | Series 2628, Class WA, 4.00%, 07/15/28 | 473,552 | |||||||||
| 500,000 | Series 2631, Class LC, 4.50%, 06/15/18 | 472,973 | |||||||||
| 585,118 | Series 2636, Class Z, 4.50%, 06/15/18 | 549,780 | |||||||||
| 199,277 | Series 2638, Class DS, IF, 3.25%, 07/15/23 | 166,806 | |||||||||
| 49,006 | Series 2643, Class HI, IO, 4.50%, 12/15/16 | 4,767 | |||||||||
| 5,413 | Series 2643, Class KG, 4.00%, 05/15/18 | 5,402 | |||||||||
| 1,165,864 | Series 2651, Class VZ, 4.50%, 07/15/18 | 1,094,923 | |||||||||
| 97,142 | Series 2656, Class SH, IF, 5.55%, 02/15/25 | 94,151 | |||||||||
| 356,178 | Series 2668, Class SB, IF, 2.44%, 10/15/15 | 322,240 | |||||||||
| 500,000 | Series 2675, Class CK, 4.00%, 09/15/18 | 455,549 | |||||||||
| 231,574 | Series 2682, Class YS, IF, 0.98%, 10/15/33 | 152,775 | |||||||||
| 274,714 | Series 2684, Class TO, PO, 10/15/33 | 144,360 | |||||||||
| 228,000 | Series 2686, Class GB, 5.00%, 05/15/20 | 225,951 | |||||||||
| 184,441 | Series 2691, Class WS, IF, 0.98%, 10/15/33 | 125,834 | |||||||||
| 1,000,000 | Series 2695, Class DE, 4.00%, 01/15/17 | 947,145 | |||||||||
| 138,460 | Series 2705, Class SC, IF, 0.98%, 11/15/33 | 94,219 | |||||||||
| 211,357 | Series 2705, Class SD, IF, 2.12%, 11/15/33 | 155,335 | |||||||||
| 1,000,000 | Series 2716, Class UN, 4.50%, 12/15/23 | 931,098 | |||||||||
| 750,000 | Series 2727, Class BS, IF, 1.05%, 01/15/34 | 423,845 | |||||||||
| 16,130 | Series 2733, Class GF, FRN, 0.00%, 09/15/33 | 15,148 | |||||||||
| 500,000 | Series 2743, Class HD, 4.50%, 08/15/17 | 482,373 | |||||||||
| 209,330 | Series 2744, Class FE, FRN, 0.00%, 02/15/34 | 163,431 | |||||||||
| 500,000 | Series 2744, Class PD, 5.50%, 08/15/33 | 503,804 | |||||||||
| 144,668 | Series 2753, Class S, IF, 1.30%, 02/15/34 | 86,340 | |||||||||
| 219,295 | Series 2755, Class SA, IF, 3.50%, 05/15/30 | 206,648 | |||||||||
| 155,293 | Series 2766, Class SX, IF, 0.45%, 03/15/34 | 118,973 | |||||||||
| 59,746 | Series 2769, PO, 03/15/34 | 32,744 | |||||||||
| 476,978 | Series 2776, Class SK, IF, 1.05%, 04/15/34 | 328,280 | |||||||||
| 50,052 | Series 2778, Class BS, IF, 2.38%, 04/15/34 | 41,211 | |||||||||
| 268,198 | Series 2780, Class JG, 4.50%, 04/15/19 | 252,084 | |||||||||
| 702,000 | Series 2809, Class UB, 4.00%, 09/15/17 | 662,167 | |||||||||
| 135,306 | Series 2827, Class SQ, IF, 7.50%, 01/15/19 | 139,026 | |||||||||
| 44,589 | Series 2841, Class GO, PO, 08/15/34 | 40,135 | |||||||||
| 150,227 | Series 2846, PO, 08/15/34 | 104,166 | |||||||||
| 500,000 | Series 2899, Class KB, 4.50%, 03/15/19 | 470,300 | |||||||||
| 500,000 | Series 2931, Class QC, 4.50%, 01/15/19 | 480,027 | |||||||||
AS OF DECEMBER 31, 2006 (continued)
| PRINCIPAL AMOUNT($) | | SECURITY DESCRIPTION | | VALUE($) | |||||||
|---|---|---|---|---|---|---|---|---|---|---|---|
Long-Term Investments — Continued | |||||||||||
Agency CMO — Continued | |||||||||||
| 171,190 | Series 2958, Class KB, 5.50%, 04/15/35 | 171,005 | |||||||||
| 1,000,000 | Series 2971, Class GB, 5.00%, 11/15/16 | 993,021 | |||||||||
| 100,000 | Series 2975, Class KO, PO, 05/15/35 | 70,585 | |||||||||
| 146,894 | Series 2989, PO, 06/15/23 | 113,400 | |||||||||
| 300,000 | Series 3047, Class OD, 5.50%, 10/15/35 | 296,659 | |||||||||
| 1,000,000 | Series 3064, Class OB, 5.50%, 07/15/29 | 1,000,999 | |||||||||
| 327,071 | Series 3101, Class EA, 6.00%, 06/15/20 | 327,621 | |||||||||
| 285,249 | Series 3117, Class EO, PO, 02/15/36 | 217,566 | |||||||||
| Federal Home Loan Mortgage Corp. Structured Pass-Through Securities, | |||||||||||
| 40,481 | Series T-41, Class 3A, 7.50%, 07/25/32 | 41,900 | |||||||||
| 263,531 | Series T-54, Class 2A, 6.50%, 02/25/43 | 268,594 | |||||||||
| 121,251 | Series T-54, Class 3A, 7.00%, 02/25/43 | 124,720 | |||||||||
| 70,583 | Series T-58, Class A, PO, 09/25/43 | 59,856 | |||||||||
| 547,176 | Federal Home Loan Mortgage Corp.- Government National Mortgage Association, Series 8, Class ZA, 7.00%, 03/25/23 | 553,674 | |||||||||
| Federal National Mortgage Association, | |||||||||||
| 130,154 | Series 329, Class 1, PO, 01/01/33 | 98,952 | |||||||||
| 162,950 | Series 340, Class 1, PO, 09/01/33 | 118,779 | |||||||||
| 17,904 | Series 1989-83, Class H, 8.50%, 11/25/19 | 19,116 | |||||||||
| 4,017 | Series 1990-1, Class D, 8.80%, 01/25/20 | 4,310 | |||||||||
| 16,382 | Series 1990-10, Class L, 8.50%, 02/25/20 | 17,506 | |||||||||
| 3,863 | Series 1990-93, Class G, 5.50%, 08/25/20 | 3,836 | |||||||||
| 56 | Series 1990-140, Class K, HB, IO, 652.15%, 12/25/20 | 915 | |||||||||
| 6,545 | Series 1990-143, Class J, 8.75%, 12/25/20 | 7,025 | |||||||||
| 127,553 | Series 1992-101, Class J, 7.50%, 06/25/22 | 128,942 | |||||||||
| 45,201 | Series 1992-143, Class MA, 5.50%, 09/25/22 | 45,319 | |||||||||
| 38,975 | Series 1993-164, Class SA, IF, 9.11%, 09/25/08 | 39,911 | |||||||||
| 55,839 | Series 1993-164, Class SC, IF, 9.11%, 09/25/08 | 57,180 | |||||||||
| 10,194 | Series 1993-165, Class SD, IF, 5.63%, 09/25/23 | 10,089 | |||||||||
| 50,837 | Series 1993-165, Class SK, IF, 12.50%, 09/25/23 | 61,402 | |||||||||
| 63,910 | Series 1993-167, Class GA, 7.00%, 09/25/23 | 65,105 | |||||||||
| 22,158 | Series 1993-175, Class SA, IF, 12.18%, 09/25/08 | 23,185 | |||||||||
| 18,626 | Series 1993-190, Class S, IF, 6.73%, 10/25/08 | 18,744 | |||||||||
| 3,659 | Series 1993-196, Class FA, FRN, 5.25%, 10/25/08 | 3,645 | |||||||||
| 5,488 | Series 1993-196, Class SB, IF, 9.25%, 10/25/08 | 5,606 | |||||||||
| 483,195 | Series 1993-203, Class PL, 6.50%, 10/25/23 | 493,187 | |||||||||
| 22,398 | Series 1993-205, Class H, PO, 09/25/23 | 18,410 | |||||||||
| 276,720 | Series 1993-225, Class UB, 6.50%, 12/25/23 | 284,258 | |||||||||
| 8,336 | Series 1993-230, Class FA, FRN, 5.98%, 12/25/23 | 8,469 | |||||||||
| 85,304 | Series 1993-233, Class SB, IF, 7.87%, 12/25/08 | 86,832 | |||||||||
| 506,151 | Series 1993-250, Class Z, 7.00%, 12/25/23 | 519,728 | |||||||||
| 161,551 | Series 1993-257, Class C, PO, 06/25/23 | 138,955 | |||||||||
| 13,953 | Series 1994-13, Class SK, IF, 8.97%, 02/25/09 | 14,378 | |||||||||
| 28,133 | Series 1994-33, Class FA, FRN, 5.35%, 03/25/09 | 28,025 | |||||||||
| 69,327 | Series 1995-2, Class Z, 8.50%, 01/25/25 | 73,032 | |||||||||
| 83,206 | Series 1995-19, Class Z, 6.50%, 11/25/23 | 88,625 | |||||||||
| 8,651 | Series 1996-20, Class L, PO, 09/25/08 | 8,295 | |||||||||
| 7,819 | Series 1996-24, Class B, PO, 10/25/08 | 7,717 | |||||||||
| 16,680 | Series 1996-39, Class J, PO, 09/25/08 | 16,003 | |||||||||
| 19,218 | Series 1996-59, Class J, 6.50%, 08/25/22 | 19,733 | |||||||||
| 184,344 | Series 1996-59, Class K, 6.50%, 07/25/23 | 186,985 | |||||||||
| 694,349 | Series 1997-20, Class IB, IF, IO, 1.84%, 03/25/27 | 38,903 | |||||||||
| 56,148 | Series 1997-39, Class PD, 7.50%, 05/20/27 | 58,250 | |||||||||
| 135,364 | Series 1997-46, Class PL, 6.00%, 07/18/27 | 137,206 | |||||||||
| 361,625 | Series 1997-61, Class ZC, 7.00%, 02/25/23 | 376,181 | |||||||||
| 157,330 | Series 1998-36, Class ZB, 6.00%, 07/18/28 | 158,787 | |||||||||
| 172,670 | Series 1998-43, Class SA, IF, IO, 11.64%, 04/25/23 | 54,959 | |||||||||
| 26,713 | Series 2000-52, IO, 8.50%, 01/25/31 | 6,868 | |||||||||
| 100,649 | Series 2001-28, Class VB, 6.00%, 02/25/20 | 100,439 | |||||||||
| 336,628 | Series 2001-30, Class PM, 7.00%, 07/25/31 | 350,628 | |||||||||
| 323,800 | Series 2001-33, Class ID, IO, 6.00%, 07/25/31 | 71,889 | |||||||||
| 555,193 | Series 2001-36, Class DE, 7.00%, 08/25/31 | 570,050 | |||||||||
| 65,011 | Series 2001-44, Class PD, 7.00%, 09/25/31 | 67,325 | |||||||||
| 175,755 | Series 2001-50, Class VB, 6.50%, 12/25/16 | 175,856 | |||||||||
| 311,476 | Series 2001-52, Class XN, 6.50%, 11/25/15 | 319,481 | |||||||||
| 501,974 | Series 2001-61, Class Z, 7.00%, 11/25/31 | 523,091 | |||||||||
| 493,877 | Series 2001-69, Class PG, 6.00%, 12/25/16 | 500,140 | |||||||||
| 308,495 | Series 2001-71, Class QE, 6.00%, 12/25/16 | 312,406 | |||||||||
| 94,931 | Series 2001-78, Class VB, 6.00%, 12/25/15 | 94,627 | |||||||||
| 149,500 | Series 2001-80, Class PE, 6.00%, 07/25/29 | 150,574 | |||||||||
| 164,051 | Series 2002-1, Class HC, 6.50%, 02/25/22 | 167,788 | |||||||||
| 44,044 | Series 2002-1, Class SA, IF, 7.80%, 02/25/32 | 47,508 | |||||||||
| 500,000 | Series 2002-3, Class OG, 6.00%, 02/25/17 | 506,410 | |||||||||
| 62,126 | Series 2002-8, Class SR, IF, 4.95%, 03/25/09 | 61,571 | |||||||||
| 900,307 | Series 2002-13, Class SJ, IF, IO, 1.60%, 03/25/32 | 47,574 | |||||||||
| 800,000 | Series 2002-18, Class PC, 5.50%, 04/25/17 | 804,456 | |||||||||
| 470,452 | Series 2002-28, Class PK, 6.50%, 05/25/32 | 481,952 | |||||||||
| 1,000,000 | Series 2002-56, Class UC, 5.50%, 09/25/17 | 1,001,499 | |||||||||
| 628,447 | Series 2002-62, Class ZE, 5.50%, 11/25/17 | 629,261 | |||||||||
| 162,966 | Series 2002-73, Class S, IF, 2.88%, 11/25/09 | 157,778 | |||||||||
| PRINCIPAL AMOUNT($) | | SECURITY DESCRIPTION | | VALUE($) | |||||||
|---|---|---|---|---|---|---|---|---|---|---|---|
Long-Term Investments — Continued | |||||||||||
Agency CMO — Continued | |||||||||||
| 750,000 | Series 2002-74, Class LD, 5.00%, 01/25/16 | 741,365 | |||||||||
| 700,000 | Series 2002-74, Class PD, 5.00%, 11/25/15 | 692,257 | |||||||||
| 400,000 | Series 2002-74, Class VB, 6.00%, 11/25/31 | 402,873 | |||||||||
| 169,296 | Series 2002-77, Class S, IF, 4.67%, 12/25/32 | 161,685 | |||||||||
| 40,997 | Series 2002-91, Class UH, IO, 5.50%, 06/25/22 | 6,418 | |||||||||
| 433,844 | Series 2002-93, Class PD, 3.50%, 02/25/29 | 420,616 | |||||||||
| 500,000 | Series 2002-94, Class BK, 5.50%, 01/25/18 | 500,354 | |||||||||
| 121,572 | Series 2003-16, Class PI, IO, 5.00%, 11/25/12 | 2,018 | |||||||||
| 293,000 | Series 2003-22, Class UD, 4.00%, 04/25/33 | 241,809 | |||||||||
| 250,000 | Series 2003-41, Class PE, 5.50%, 05/25/23 | 251,141 | |||||||||
| 100,000 | Series 2003-47, Class PE, 5.75%, 06/25/33 | 99,049 | |||||||||
| 766,702 | Series 2003-52, Class PA, 6.50%, 06/25/35 | 792,538 | |||||||||
| 72,389 | Series 2003-64, Class SX, IF, 0.38%, 07/25/33 | 47,291 | |||||||||
| 252,208 | Series 2003-66, Class PA, 3.50%, 02/25/33 | 229,785 | |||||||||
| 647,059 | Series 2003-68, Class LC, 3.00%, 07/25/22 | 537,900 | |||||||||
| 676,390 | Series 2003-68, Class QP, 3.00%, 07/25/22 | 625,131 | |||||||||
| 139,298 | Series 2003-71, Class DS, IF, 0.33%, 08/25/33 | 89,947 | |||||||||
| 1,040,058 | Series 2003-73, Class GA, 3.50%, 05/25/31 | 973,804 | |||||||||
| 1,178,623 | Series 2003-80, Class SY, IF, IO, 2.30%, 06/25/23 | 93,271 | |||||||||
| 500,000 | Series 2003-83, Class PG, 5.00%, 06/25/23 | 484,924 | |||||||||
| 250,000 | Series 2003-106, Class US, IF, 1.05%, 11/25/23 | 164,699 | |||||||||
| 500,000 | Series 2003-106, Class WE, 4.50%, 11/25/22 | 469,521 | |||||||||
| 1,000,000 | Series 2003-113, Class PC, 4.00%, 03/25/15 | 970,902 | |||||||||
| 1,043,025 | Series 2003-116, Class SB, IF, IO, 2.25%, 11/25/33 | 74,862 | |||||||||
| 600,000 | Series 2003-117, Class JB, 3.50%, 06/25/33 | 533,489 | |||||||||
| 500,000 | Series 2003-128, Class KE, 4.50%, 01/25/14 | 488,233 | |||||||||
| 500,000 | Series 2003-128, Class NG, 4.00%, 01/25/19 | 452,110 | |||||||||
| 173,945 | Series 2003-130, Class SX, IF, 3.50%, 01/25/34 | 163,323 | |||||||||
| 256,341 | Series 2003-132, Class OA, PO, 08/25/33 | 195,592 | |||||||||
| 125,030 | Series 2003-91, Class SD, IF, 3.58%, 09/25/33 | 110,537 | |||||||||
| 700,000 | Series 2004-1, Class AC, 4.00%, 02/25/19 | 635,797 | |||||||||
| 387,549 | Series 2004-4, Class QM, IF, 3.50%, 06/25/33 | 361,986 | |||||||||
| 265,545 | Series 2004-10, Class SC, IF, 7.20%, 02/25/34 | 281,180 | |||||||||
| 164,907 | Series 2004-14, Class SD, IF, 1.05%, 03/25/34 | 110,839 | |||||||||
| 1,000,000 | Series 2004-21, Class AE, 4.00%, 04/25/19 | 900,283 | |||||||||
| 174,232 | Series 2004-21, Class CO, PO, 04/25/34 | 105,623 | |||||||||
| 179,328 | Series 2004-22, Class A, 4.00%, 04/25/19 | 167,953 | |||||||||
| 468,315 | Series 2004-36, Class SA, IF, 4.81%, 05/25/34 | 455,196 | |||||||||
| 100,619 | Series 2004-51, Class SY, IF, 3.54%, 07/25/34 | 93,644 | |||||||||
| 150,029 | Series 2004-61, Class SK, IF, 8.50%, 11/25/32 | 160,983 | |||||||||
| 200,000 | Series 2004-76, Class CL, 4.00%, 10/25/19 | 182,054 | |||||||||
| 1,000,000 | Series 2004-81, Class AC, 4.00%, 11/25/19 | 907,476 | |||||||||
| 226,413 | Series 2004-92, Class JO, PO, 12/25/34 | 190,304 | |||||||||
| 810,270 | Series 2005-28, Class JA, 5.00%, 04/25/35 | 765,084 | |||||||||
| 970,649 | Series 2005-40, Class YA, 5.00%, 09/25/20 | 961,396 | |||||||||
| 500,000 | Series 2005-47, Class AN, 5.00%, 12/25/16 | 495,331 | |||||||||
| 853,000 | Series 2005-68, Class BC, 5.25%, 06/25/35 | 829,924 | |||||||||
| 1,100,000 | Series 2005-68, Class PG, 5.50%, 08/25/35 | 1,099,375 | |||||||||
| 1,000,000 | Series 2005-84, Class XM, 5.75%, 10/25/35 | 1,009,325 | |||||||||
| 1,000,000 | Series 2005-109, Class PC, 6.00%, 12/25/35 | 1,019,653 | |||||||||
| 1,000,000 | Series 2005-110, Class GL, 5.50%, 12/25/35 | 969,865 | |||||||||
| 700,000 | Series 2005-110, Class MN, 5.50%, 06/25/35 | 695,870 | |||||||||
| 236,120 | Series 2006-22, Class AO, PO, 04/25/36 | 172,362 | |||||||||
| 566,058 | Series 2006-59, Class QO, PO, 01/25/33 | 441,476 | |||||||||
| 591,317 | Series 2006-110, Class PO, 11/25/36 | 417,959 | |||||||||
| 60,908 | Series G92-15, Class Z, 7.00%, 01/25/22 | 61,920 | |||||||||
| 8,447 | Series G92-42, Class Z, 7.00%, 07/25/22 | 8,781 | |||||||||
| 177,905 | Series G92-44, Class ZQ, 8.00%, 07/25/22 | 188,279 | |||||||||
| 100,514 | Series G92-54, Class ZQ, 7.50%, 09/25/22 | 105,622 | |||||||||
| 6,472 | Series G92-59, Class F, FRN, 5.05%, 10/25/22 | 6,396 | |||||||||
| 16,648 | Series G92-61, Class Z, 7.00%, 10/25/22 | 17,217 | |||||||||
| 172,274 | Series G92-66, Class KB, 7.00%, 12/25/22 | 178,790 | |||||||||
| 50,852 | Series G93-1, Class KA, 7.90%, 01/25/23 | 53,968 | |||||||||
| 52,411 | Series G93-17, Class SI, IF, 6.00%, 04/25/23 | 51,214 | |||||||||
| 66 | Series K, Class 2, HB, 256.68%, 11/01/08 | 176 | |||||||||
| Federal National Mortgage Association Whole Loan, | |||||||||||
| 188,550 | Series 2003-W1, Class 1A1, 6.50%, 12/25/42 | 191,810 | |||||||||
| 115,664 | Series 2003-W1, Class 2A, 7.50%, 12/25/42 | 120,242 | |||||||||
| 39,041 | Series 2003-W8, Class 1A3, 4.75%, 12/25/42 | 38,817 | |||||||||
| 193,673 | Series 2004-W2, Class 2A2, 7.00%, 02/25/44 | 200,442 | |||||||||
| Government National Mortgage Association, | |||||||||||
| 146,175 | Series 1994-3, Class PQ, 7.49%, 07/16/24 | 152,095 | |||||||||
| 500,000 | Series 1994-7, Class PQ, 6.50%, 10/16/24 | 517,994 | |||||||||
| 152,250 | Series 1996-16, Class E, 7.50%, 08/16/26 | 157,172 | |||||||||
| 148,728 | Series 1997-8, Class PN, 7.50%, 05/16/27 | 154,335 | |||||||||
| 172,651 | Series 1998-26, Class K, 7.50%, 09/17/25 | 179,983 | |||||||||
| 149,727 | Series 1999-41, Class Z, 8.00%, 11/16/29 | 156,457 | |||||||||
| 92,386 | Series 1999-44, Class PC, 7.50%, 12/20/29 | 96,502 | |||||||||
| 113,775 | Series 1999-44, Class ZG, 8.00%, 12/20/29 | 118,486 | |||||||||
| 80,157 | Series 2000-6, Class Z, 7.50%, 02/20/30 | 83,365 | |||||||||
| 134,800 | Series 2000-14, Class PD, 7.00%, 02/16/30 | 138,964 | |||||||||
| 457,920 | Series 2000-21, Class Z, 9.00%, 03/16/30 | 499,662 | |||||||||
| 66,284 | Series 2000-26, Class Z, 7.75%, 09/20/30 | 66,931 | |||||||||
| 9,382 | Series 2000-36, Class IK, IO, 9.00%, 11/16/30 | 2,148 | |||||||||
| 800,000 | Series 2000-36, Class PB, 7.50%, 11/16/30 | 835,333 | |||||||||
| 121,076 | Series 2000-37, Class B, 8.00%, 12/20/30 | 125,445 | |||||||||
| 31,707 | Series 2000-38, Class AH, 7.15%, 12/20/30 | 32,216 | |||||||||
AS OF DECEMBER 31, 2006 (continued)
| PRINCIPAL AMOUNT($) | | SECURITY DESCRIPTION | | VALUE($) | |||||||
|---|---|---|---|---|---|---|---|---|---|---|---|
Long-Term Investments — Continued | |||||||||||
Agency CMO — Continued | |||||||||||
| 78,359 | Series 2001-4, Class SJ, IF, IO, 2.80%, 01/19/30 | 298 | |||||||||
| 244,201 | Series 2001-36, Class S, IF, IO, 2.70%, 08/16/31 | 19,284 | |||||||||
| 200,000 | Series 2001-64, Class MQ, 6.50%, 12/20/31 | 204,782 | |||||||||
| 42,344 | Series 2002-24, Class SB, IF, 3.90%, 04/16/32 | 40,316 | |||||||||
| 229,162 | Series 2002-54, Class GB, 6.50%, 08/20/32 | 235,246 | |||||||||
| 22,273 | Series 2002-88, Class LI, IO, 5.50%, 11/20/28 | 200 | |||||||||
| 262,029 | Series 2003-4, Class NI, IO, 5.50%, 01/20/32 | 39,421 | |||||||||
| 27,440 | Series 2003-24, PO, 03/16/33 | 21,976 | |||||||||
| 653,207 | Series 2003-76, Class LS, IF, IO, 1.85%, 09/20/31 | 33,677 | |||||||||
| 827,673 | Series 2004-11, Class SW, IF, IO, 0.15%, 02/20/34 | 9,880 | |||||||||
| 102,821 | Series 2004-28, Class S, IF, 4.95%, 04/16/34 | 96,523 | |||||||||
| Vendee Mortgage Trust, | |||||||||||
| 147,219 | Series 1994-1, Class 1, VAR, 5.63%, 02/15/24 | 148,182 | |||||||||
| 368,684 | Series 1996-1, Class 1Z, 6.75%, 02/15/26 | 383,017 | |||||||||
| 204,184 | Series 1996-2, Class 1Z, 6.75%, 06/15/26 | 210,570 | |||||||||
| 767,000 | Series 1997-1, Class 2Z, 7.50%, 02/15/27 | 807,098 | |||||||||
| 208,588 | Series 1998-1, Class 2E, 7.00%, 09/15/27 | 214,343 | |||||||||
| 79,478,067 | |||||||||||
Non-Agency CMO — 18.6% | |||||||||||
| 500,000 | American Home Mortgage Investment Corp., Series 2005-3, Class 2A4, FRN, 4.85%, 09/25/35 | 486,983 | |||||||||
| Banc of America Funding Corp., | |||||||||||
| 247,575 | Series 2003-1, Class A, PO, 05/20/33 | 186,531 | |||||||||
| 495,667 | Series 2003-3, Class 1A33, 5.50%, 10/25/33 | 482,444 | |||||||||
| 156,282 | Series 2004-1, PO, 03/25/34 | 118,425 | |||||||||
| 1,000,000 | Series 2005-6, Class 2A7, 5.50%, 10/25/35 | 991,126 | |||||||||
| 238,360 | Series 2005-7, Class 30, PO, 11/25/35 | 170,298 | |||||||||
| 890,630 | Series 2005-E, Class 4A1, FRN, 4.11%, 03/20/35 | 877,552 | |||||||||
| Banc of America Mortgage Securities, Inc., | |||||||||||
| 135,754 | Series 2002-10, Class A, PO, 11/25/32 | 124,450 | |||||||||
| 72,927 | Series 2003-8 Class A, PO, 11/25/33 | 53,974 | |||||||||
| 79,244 | Series 2004-4, Class A, PO, 05/25/34 | 61,228 | |||||||||
| 460,919 | Series 2004-5, Class 2A2, 5.50%, 06/25/34 | 429,004 | |||||||||
| 250,000 | Series 2004-6, Class 2A5, PO, 07/25/34 | 109,999 | |||||||||
| 249,465 | Series 2004-6, Class A, PO, 07/25/34 | 169,029 | |||||||||
| 289,581 | Series 2004-7 Class 1A19, PO, 08/25/34 | 191,070 | |||||||||
| 200,000 | Series 2004-E, Class 2A5, FRN, 4.11%, 06/25/34 | 195,202 | |||||||||
| 663,242 | Series 2004-J, Class 3A1, FRN, 5.07%, 11/25/34 | 655,564 | |||||||||
| Bank of America Alternative Loan Trust, | |||||||||||
| 314,167 | Series 2004-5, Class 3A3, PO, 06/25/34 | 157,142 | |||||||||
| 155,356 | Series 2004-6, Class 15, PO, 07/25/19 | 121,093 | |||||||||
| Bear Stearns Adjustable Rate Mortgage Trust, | |||||||||||
| 447,829 | Series 2003-7, Class 3A, VAR, 4.95%, 10/25/33 | 444,736 | |||||||||
| 100,000 | Series 2004-4, Class A4, VAR, 3.52%, 06/25/34 | 97,893 | |||||||||
| 1,113,140 | Series 2006-1, Class 1A1, FRN, 4.63%, 02/25/36 | 1,093,680 | |||||||||
| Citicorp Mortgage Securities, Inc., | |||||||||||
| 1,593,715 | Series 2004-1, Class 3A1, 4.75%, 01/25/34 | 1,552,888 | |||||||||
| 774,463 | Series 2004-5, Class 2A5, 4.50%, 08/25/34 | 747,887 | |||||||||
| Citigroup Mortgage Loan Trust, Inc., | |||||||||||
| 99,628 | Series 2003-UP3, Class A3, 7.00%, 09/25/33 | 100,998 | |||||||||
| 107,895 | Series 2003-UST1, Class 1, PO, 12/25/18 | 84,979 | |||||||||
| 64,388 | Series 2003-UST1, Class 3, PO, 12/25/18 | 51,732 | |||||||||
| 234,227 | Series 2003-UST1, Class A1, 5.50%, 12/25/18 | 232,324 | |||||||||
| 500,681 | Series 2005-1, Class 2A1A, VAR, 4.70%, 04/25/35 | 502,173 | |||||||||
| Countrywide Alternative Loan Trust, | |||||||||||
| 412,310 | Series 2002-8, Class A4, 6.50%, 07/25/32 | 409,721 | |||||||||
| 115,003 | Series 2003-J1, PO, 10/25/33 | 86,555 | |||||||||
| 1,300,325 | Series 2004-2CB, Class 1A9, 5.75%, 03/25/34 | 1,269,918 | |||||||||
| 471,782 | Series 2005-5R, Class A1, 5.25%, 12/25/18 | 468,553 | |||||||||
| 2,818,495 | Series 2005-J1, Class 1A4, IF, IO, 0.00%, 02/25/35 | 18,319 | |||||||||
| 2,938,227 | Series 2005-22T1, Class A2, IF, IO, 0.00%, 06/25/35 | 19,919 | |||||||||
| 330,935 | Series 2005-26CB, Class A10, IF, 3.35%, 07/25/35 | 317,958 | |||||||||
| 1,181,600 | Series 2005-28CB, Class 1A4, 5.50%, 08/25/35 | 1,138,634 | |||||||||
| 600,000 | Series 2005-54CB, Class 1A11, 5.50%, 11/25/35 | 589,831 | |||||||||
| Countrywide Home Loan Mortgage Pass Through Trust, | |||||||||||
| 809,142 | Series 2003-26, Class 1A6, 3.50%, 08/25/33 | 715,124 | |||||||||
| 74,470 | Series 2003-34, Class A11, 5.25%, 09/25/33 | 74,072 | |||||||||
| 186,364 | Series 2003-44, Class A6, PO, 10/25/33 | 136,435 | |||||||||
| 272,805 | Series 2003-J7, Class 4A3, IF, 2.89%, 08/25/18 | 248,366 | |||||||||
| 284,438 | Series 2004-7, Class 2A1, FRN, 4.07%, 06/25/34 | 278,871 | |||||||||
| 188,703 | Series 2004-HYB1, Class 2A, VAR, 4.25%, 05/20/34 | 186,929 | |||||||||
| 225,629 | Series 2004-HYB3, Class 2A, VAR, 4.06%, 06/20/34 | 221,312 | |||||||||
| 131,230 | Series 2004-J8, PO, 11/25/19 | 100,251 | |||||||||
| PRINCIPAL AMOUNT($) | | SECURITY DESCRIPTION | | VALUE($) | |||||||
|---|---|---|---|---|---|---|---|---|---|---|---|
Long-Term Investments — Continued | |||||||||||
Non-Agency CMO — Continued | |||||||||||
| 887,347 | Series 2004-J8, Class 1A2, 4.75%, 11/25/19 | 865,088 | |||||||||
| 500,000 | Series 2005-16, Class A23, 5.50%, 09/25/35 | 492,828 | |||||||||
| 789,678 | Series 2005-22, Class 2A1, FRN, 5.28%, 11/25/35 | 785,337 | |||||||||
| 147,992 | Credit Suisse First Boston Mortgage Securities Corp., Series 2004-5, Class 5P, PO, 08/25/19 | 115,265 | |||||||||
| 273,105 | First Horizon Alternative Mortgage Securities, Series 2005-FA8, Class 1A19, 5.50%, 11/25/35 | 254,558 | |||||||||
| First Horizon Mortgage Pass-Through Securities, | |||||||||||
| 500,000 | Series 2003-3, Class 1A4, 3.90%, 05/25/33 | 475,716 | |||||||||
| 546,371 | Series 2004-AR1, Class 2A2, FRN, 5.01%, 04/25/35 | 538,739 | |||||||||
| 687,102 | Series 2004-AR7, Class 2A1, FRN, 4.92%, 02/25/35 | 681,986 | |||||||||
| 300,000 | Series 2004-AR7, Class 2A2, FRN, 4.92%, 02/25/35 | 297,365 | |||||||||
| 650,000 | GMAC Mortgage Corp. Loan Trust, Series 2005-AR3, Class 3A4, VAR, 4.86%, 06/19/35 | 657,437 | |||||||||
| GSR Mortgage Loan Trust, | |||||||||||
| 432,278 | Series 2004-6F, Class 1A2, 5.00%, 05/25/34 | 370,309 | |||||||||
| 1,000,000 | Series 2004-6F, Class 3A4, 6.50%, 05/25/34 | 1,019,406 | |||||||||
| 687,510 | Series 2004-10F, Class 2A1, 5.00%, 08/25/19 | 678,931 | |||||||||
| 54,985 | Series 2004-13F, Class 3A3, 6.00%, 11/25/34 | 54,602 | |||||||||
| MASTR Adjustable Rate Mortgages Trust, | |||||||||||
| 439,657 | Series 2004-13, Class 2A1, FRN, 3.82%, 04/21/34 | 429,946 | |||||||||
| 1,100,000 | Series 2004-13, Class 3A6, FRN, 3.79%, 11/21/34 | 1,064,602 | |||||||||
| MASTR Alternative Loans Trust, | |||||||||||
| 493,484 | Series 2003-9, Class 8A1, 6.00%, 01/25/34 | 495,564 | |||||||||
| 1,469,311 | Series 2004-4, Class 10A1, 5.00%, 05/25/24 | 1,436,958 | |||||||||
| 550,655 | Series 2004-6, Class 7A1, 6.00%, 07/25/34 | 550,483 | |||||||||
| 76,912 | Series 2004-7, Class 30, PO, 08/25/34 | 57,993 | |||||||||
| 618,826 | Series 2004-8, Class 6A1, 5.50%, 09/25/19 | 617,110 | |||||||||
| 785,392 | Series 2004-10, Class 1A1, 4.50%, 09/25/19 | 752,259 | �� | ||||||||
| MASTR Asset Securitization Trust, | |||||||||||
| 181,365 | Series 2003-4, Class 2A2, 5.00%, 05/25/18 | 179,664 | |||||||||
| 323,744 | Series 2003-12, Class 15, PO, 12/25/18 | 254,898 | |||||||||
| 355,142 | Series 2004-8, PO, 08/25/19 | 273,178 | |||||||||
| 658,215 | Series 2004-10, Class 15, PO, 10/25/19 | 513,088 | |||||||||
| 362,414 | Series 2004-92, Class JO, PO, 07/25/19 | 279,324 | |||||||||
| 1,105,639 | MASTR Resecuritization Trust, Series 2005-PO, Class 3, PO, 05/28/35 (e) | 768,938 | |||||||||
| 207,663 | MortgageIT Trust, Series 2005-1, Class 1A1, FRN, 5.67%, 02/25/35 | 208,414 | |||||||||
| 149,904 | Nomura Asset Acceptance Corp., Series 2004-R2, Class A1, VAR, 6.50%, 10/25/34 (e) | 152,540 | |||||||||
| Residential Accredit Loans, Inc., | |||||||||||
| 475,696 | Series 2002-QS8, Class A5, 6.25%, 06/25/17 | 474,169 | |||||||||
| 716,084 | Series 2003-QR19, Class CB4, 5.75%, 10/25/33 | 701,235 | |||||||||
| 94,779 | Series 2003-QS3, Class A2, IF, 4.73%, 02/25/18 | 89,886 | |||||||||
| 339,993 | Series 2003-QS3, Class A8, IF, IO, 2.25%, 02/25/18 | 24,084 | |||||||||
| 739,547 | Series 2003-QS9, Class A3, IF, IO, 2.20%, 05/25/18 | 57,012 | |||||||||
| 868,452 | Series 2003-QS14, Class A1, 5.00%, 07/25/18 | 848,912 | |||||||||
| 261,601 | Series 2003-QS18, Class A1, 5.00%, 09/25/18 | 255,878 | |||||||||
| 112,547 | Residential Asset Securitization Trust, Series 2003-A14, Class A1, 4.75%, 02/25/19 | 108,749 | |||||||||
| Residential Funding Mortgage Securities I, | |||||||||||
| 494,556 | Series 2003-S7, Class A17, 4.00%, 05/25/33 | 463,765 | |||||||||
| 352,441 | Series 2003-S11, Class A1, 2.50%, 06/25/18 | 337,976 | |||||||||
| 165,000 | Series 2003-S12, Class 4A5, 4.50%, 12/25/32 | 156,168 | |||||||||
| 566,807 | Series 2005-SA4, Class 1A1, VAR, 4.97%, 09/25/35 | 566,677 | |||||||||
| 38,718 | Salomon Brothers Mortgage Securities VII, Inc., Series 2003-UP2, Class 1, PO, 12/25/18 | 31,228 | |||||||||
| 400,000 | Structured Adjustable Rate Mortgage Loan Trust, Series 2004-6, Class 5A4, VAR, 4.98%, 06/25/34 | 383,549 | |||||||||
| Structured Asset Securities Corp., | |||||||||||
| 500,000 | Series 2003-8, Class 1A2, 5.00%, 04/25/18 | 489,950 | |||||||||
| 345,613 | Series 2004-20, Class 1A3, 5.25%, 11/25/34 | 335,363 | |||||||||
| Wamu Alternative Mortgage Pass-Through Certificates, | |||||||||||
| 3,865,667 | Series 2005-2, Class 1A4, IF, IO, 0.00%, 04/25/35 | 23,746 | |||||||||
| 1,242,758 | Series 2005-2, Class 2A3, IF, IO, 0.00%, 04/25/35 | 7,389 | |||||||||
| 800,000 | Series 2005-4, Class CB7, 5.50%, 06/25/35 | 781,637 | |||||||||
| 127,769 | Series 2005-4, Class DP, PO, 06/25/20 | 99,688 | |||||||||
| 390,704 | Series 2005-6, Class 2A4, 5.50%, 08/25/35 | 388,479 | |||||||||
| 299,301 | Washington Mutual MSC Mortgage Pass-Through Certificates, Series 2002-MS12, Class A, 6.50%, 05/25/32 | 299,717 | |||||||||
| Washington Mutual, Inc., | |||||||||||
| 160,400 | Series 2003-AR4, Class A6, VAR, 3.42%, 05/25/33 | 157,282 | |||||||||
| 103,166 | Series 2003-AR8, Class A, FRN, 4.03%, 08/25/33 | 101,973 | |||||||||
| 336,989 | Series 2003-S4, Class 3A, 5.50%, 06/25/33 | 334,278 | |||||||||
AS OF DECEMBER 31, 2006 (continued)
| PRINCIPAL AMOUNT($) | | SECURITY DESCRIPTION | | VALUE($) | |||||||
|---|---|---|---|---|---|---|---|---|---|---|---|
Long-Term Investments — Continued | |||||||||||
Non-Agency CMO — Continued | |||||||||||
| 452,456 | Series 2003-S8, Class A4, 4.50%, 09/25/18 | 433,750 | |||||||||
| 902,132 | Series 2003-S10, Class A5, 5.00%, 10/25/18 | 889,729 | |||||||||
| 69,395 | Series 2003-S10, Class A6, PO, 10/25/18 | 48,187 | |||||||||
| 146,498 | Series 2004-AR3, Class A2, VAR, 4.24%, 06/25/34 | 144,211 | |||||||||
| 905,378 | Series 2004-S3, Class 2A3, IF, 4.13%, 07/25/34 | 875,100 | |||||||||
| Wells Fargo Mortgage Backed Securities Trust, | |||||||||||
| 150,000 | Series 2003-8, Class A9, 4.50%, 08/25/18 | 142,265 | |||||||||
| 98,855 | Series 2003-11, Class 1A, PO, 10/25/18 | 77,164 | |||||||||
| 663,000 | Series 2003-11, Class 1A4, 4.75%, 10/25/18 | 647,287 | |||||||||
| 146,798 | Series 2003-17, Class 2A4, 5.50%, 01/25/34 | 144,227 | |||||||||
| 637,802 | Series 2003-K, Class 1A2, FRN, 4.49%, 11/25/33 | 612,898 | |||||||||
| 369,564 | Series 2004-7, Class 2A2, 5.00%, 07/25/19 | 361,711 | |||||||||
| 713,365 | Series 2004-EE, Class 3A1, FRN, 3.99%, 12/25/34 | 703,754 | |||||||||
| 827,264 | Series 2004-P, Class 2A1, FRN, 4.22%, 09/25/34 | 816,375 | |||||||||
| 600,000 | Series 2004-S, Class A5, FRN, 3.54%, 09/25/34 | 581,011 | |||||||||
| 394,899 | Series 2005-AR10, Class 2A4, FRN, 4.11%, 06/25/35 | 386,592 | |||||||||
| 361,375 | Series 2005-AR16, Class 2A1, VAR, 4.95%, 10/25/35 | 360,437 | |||||||||
| 46,837,186 | |||||||||||
| Total Collateralized Mortgage Obligations (Cost $128,578,644) | 126,315,253 | ||||||||||
Commercial Mortgage-Backed Securities — 1.2% | |||||||||||
| 550,000 | Banc of America Commercial Mortgage, Inc., Series 2005-6, Class ASB, VAR, 5.18%, 09/10/47 | 547,250 | |||||||||
| Bear Stearns Commercial Mortgage Securities, | |||||||||||
| 45,522 | Series 2000-WF1, Class A1, 7.64%, 02/15/32 | 46,355 | |||||||||
| 114,769 | Series 2004-T16, Class A2, 3.70%, 02/13/46 | 111,873 | |||||||||
| 250,000 | Series 2005-PWR9, Class AAB, 4.80%, 09/11/42 | 244,021 | |||||||||
| 360,000 | Series 2006-PW11, Class A4, VAR, 5.46%, 03/11/39 | 365,580 | |||||||||
| 250,000 | Series 2006-PW14, Class A1, 5.04%, 12/11/38 | 248,516 | |||||||||
| 190,101 | Citigroup Commercial Mortgage Trust, Series 2006-C4, Class A1, VAR, 5.72%, 03/15/49 | 192,530 | |||||||||
| 100,000 | DLJ Commercial Mortgage Corp., Series 1999-CG2, Class A1B, 7.30%, 06/10/32 | 103,846 | |||||||||
| 330,000 | Merrill Lynch Mortgage Trust, Series 2005-MCP1, Class ASB, VAR, 4.67%, 06/12/43 | 319,055 | |||||||||
| Morgan Stanley Capital I, | |||||||||||
| 250,000 | Series 2006-IQ12, Class A1, 5.26%, 12/15/43 | 249,834 | |||||||||
| 96,603 | Series 2006-T23, Class A1, 5.68%, 08/12/41 | 97,845 | |||||||||
| 450,000 | Wachovia Bank Commercial Mortgage Trust, Series 2004-C15, Class A2, 4.04%, 10/15/41 | 435,459 | |||||||||
| Total Commercial Mortgage-Backed Securities (Cost $3,004,296) | 2,962,164 | ||||||||||
Corporate Bonds — 10.9% | |||||||||||
Aerospace & Defense — 0.1% | |||||||||||
| 135,000 | Northrop Grumman Corp., 7.13%, 02/15/11 | 143,999 | |||||||||
| 66,371 | Systems 2001 AT LLC (Cayman Islands), 7.16%, 12/15/11 (e) | 68,609 | |||||||||
| 212,608 | |||||||||||
Airlines — 0.2% | |||||||||||
| 85,000 | American Airlines, Inc., Series 1999-1, 7.02%, 10/15/09 (c) | 88,507 | |||||||||
| United Airlines, Inc., | |||||||||||
| 206,693 | Series 2001-1, 6.07%, 03/01/13 | 207,726 | |||||||||
| 131,839 | Series 2001-1, 6.20%, 09/01/08 (c) | 132,663 | |||||||||
| 428,896 | |||||||||||
Automobiles — 0.1% | |||||||||||
| 350,000 | DaimlerChrysler NA Holding Corp., 7.20%, 09/01/09 | 363,075 | |||||||||
Capital Markets — 1.9% | |||||||||||
| 400,000 | Bear Stearns Co., Inc., (The), 3.25%, 03/25/09 | 383,742 | |||||||||
| Credit Suisse First Boston USA, Inc., | |||||||||||
| 50,000 | 4.88%, 01/15/15 | 48,486 | |||||||||
| 150,000 | 5.50%, 08/15/13 | 151,970 | |||||||||
| 500,000 | 6.13%, 11/15/11 | 517,726 | |||||||||
| Goldman Sachs Group, Inc., | |||||||||||
| 200,000 | 3.88%, 01/15/09 | 194,835 | |||||||||
| 375,000 | 4.75%, 07/15/13 | 361,984 | |||||||||
| 150,000 | 5.25%, 10/15/13 | 148,893 | |||||||||
| 400,000 | 6.88%, 01/15/11 | 423,429 | |||||||||
| Lehman Brothers Holdings, Inc., | |||||||||||
| 100,000 | 4.00%, 01/22/08 | 98,622 | |||||||||
| 175,000 | 6.63%, 01/18/12 (c) | 184,903 | |||||||||
| 100,000 | Series G, 4.80%, 03/13/14 | 96,263 | |||||||||
| Merrill Lynch & Co., Inc., | |||||||||||
| 100,000 | 4.79%, 08/04/10 | 98,639 | |||||||||
| 150,000 | 5.45%, 07/15/14 | 150,801 | |||||||||
| 200,000 | Series B, 3.70%, 04/21/08 | 195,689 | |||||||||
| 200,000 | Series C, 4.13%, 01/15/09 | 195,974 | |||||||||
| PRINCIPAL AMOUNT($) | | SECURITY DESCRIPTION | | VALUE($) | |||||||
|---|---|---|---|---|---|---|---|---|---|---|---|
Long-Term Investments — Continued | |||||||||||
Capital Markets — Continued | |||||||||||
| Morgan Stanley & Co., Inc., | |||||||||||
| 400,000 | 4.75%, 04/01/14 | 382,451 | |||||||||
| 300,000 | 6.60%, 04/01/12 | 316,824 | |||||||||
| 640,000 | 6.75%, 04/15/11 | 676,462 | |||||||||
| 150,000 | State Street Corp., 7.65%, 06/15/10 | 160,226 | |||||||||
| 4,787,919 | |||||||||||
Chemicals — 0.1% | |||||||||||
| 150,000 | Dow Chemical Co., (The), 6.13%, 02/01/11 | 154,199 | |||||||||
| 80,000 | Monsanto Co., 7.38%, 08/15/12 | 87,366 | |||||||||
| 241,565 | |||||||||||
Commercial Banks — 1.1% | |||||||||||
| 75,000 | Branch Banking & Trust Co., 4.88%, 01/15/13 | 72,973 | |||||||||
| 250,000 | Firstar Bank NA, 7.13%, 12/01/09 | 262,877 | |||||||||
| 50,000 | HSBC Holdings plc (United Kingdom), 7.35%, 11/27/32 | 58,966 | |||||||||
| 250,000 | Huntington National Bank, 8.00%, 04/01/10 | 268,998 | |||||||||
| 200,000 | Keycorp, Series G, 4.70%, 05/21/09 | 196,803 | |||||||||
| 75,000 | Popular North America, Inc., 4.25%, 04/01/08 | 73,893 | |||||||||
| 190,000 | Royal Bank of Canada (Canada), 3.88%, 05/04/09 | 184,636 | |||||||||
| 250,000 | Suntrust Bank, 6.38%, 04/01/11 | 259,966 | |||||||||
| 100,000 | US Bancorp, 7.50%, 06/01/26 | 119,180 | |||||||||
| 200,000 | US Bank NA, 6.50%, 02/01/08 | 201,774 | |||||||||
| 100,000 | Wachovia Bank NA, 7.80%, 08/18/10 | �� | 107,565 | ||||||||
| Wachovia Corp., | |||||||||||
| 240,000 | 3.50%, 08/15/08 (c) | 233,339 | |||||||||
| 150,000 | 3.63%, 02/17/09 | 145,237 | |||||||||
| 260,000 | Wells Fargo & Co., 3.13%, 04/01/09 | 248,654 | |||||||||
| 250,000 | Wells Fargo Bank NA, 7.55%, 06/21/10 | 267,948 | |||||||||
| 2,702,809 | |||||||||||
Communications Equipment — 0.0% (g) | |||||||||||
| 80,000 | Cisco Systems, Inc., 5.50%, 02/22/16 | 80,051 | |||||||||
Computers & Peripherals — 0.1% | |||||||||||
| International Business Machines Corp., | |||||||||||
| 150,000 | 5.39%, 01/22/09 | 150,287 | |||||||||
| 50,000 | 6.22%, 08/01/27 | 52,563 | |||||||||
| 202,850 | |||||||||||
Consumer Finance — 1.2% | |||||||||||
| 100,000 | American Express Credit Corp., 3.00%, 05/16/08 | 97,057 | |||||||||
| 265,000 | Ford Motor Credit Co., 7.38%, 10/28/09 | 265,564 | |||||||||
| HSBC Finance Corp., | |||||||||||
| 150,000 | 5.00%, 06/30/15 | 145,855 | |||||||||
| 150,000 | 5.25%, 01/15/14 | 148,586 | |||||||||
| 500,000 | 5.88%, 02/01/09 | 507,173 | |||||||||
| 200,000 | 6.40%, 06/17/08 | 203,065 | |||||||||
| 500,000 | 6.50%, 11/15/08 | 511,119 | |||||||||
| 200,000 | 7.88%, 03/01/07 | 200,748 | |||||||||
| International Lease Finance Corp., | |||||||||||
| 60,000 | 4.50%, 05/01/08 | 59,189 | |||||||||
| 40,000 | 5.88%, 05/01/13 | 40,843 | |||||||||
| 165,000 | 6.38%, 03/15/09 | 168,553 | |||||||||
| SLM Corp., | |||||||||||
| 300,000 | 4.00%, 01/15/10 | 289,363 | |||||||||
| 100,000 | Series A, 5.38%, 01/15/13 | 99,703 | |||||||||
| 100,000 | Toyota Motor Credit Corp., 2.88%, 08/01/08 | 96,362 | |||||||||
| 100,000 | Washington Mutual Financial Corp., 6.88%, 05/15/11 | 106,136 | |||||||||
| 2,939,316 | |||||||||||
Diversified Financial Services — 1.5% | |||||||||||
| Associates Corp. NA, | |||||||||||
| 200,000 | 8.15%, 08/01/09 | 213,868 | |||||||||
| 250,000 | 8.55%, 07/15/09 | 269,219 | |||||||||
| Bank of America Corp., | |||||||||||
| 200,000 | 3.88%, 01/15/08 | 196,983 | |||||||||
| 200,000 | 5.25%, 12/01/15 (c) | 197,037 | |||||||||
| 570,000 | 7.80%, 02/15/10 | 612,079 | |||||||||
| 100,000 | CIT Group, Inc., 7.75%, 04/02/12 | 110,251 | |||||||||
| Citigroup, Inc., | |||||||||||
| 150,000 | 4.70%, 05/29/15 (c) | 143,190 | |||||||||
| 300,000 | 5.63%, 08/27/12 | 304,341 | |||||||||
| General Electric Capital Corp., | |||||||||||
| 500,000 | 7.38%, 01/19/10 (c) | 529,977 | |||||||||
| 150,000 | Series A, 3.50%, 05/01/08 | 146,677 | |||||||||
| 175,000 | Series A, 4.25%, 01/15/08 | 173,408 | |||||||||
| 170,000 | Series A, 5.00%, 02/15/07 (c) | 169,929 | |||||||||
| 300,000 | Series A, 5.88%, 02/15/12 (c) | 308,494 | |||||||||
| 200,000 | Series A, 6.00%, 06/15/12 | 207,034 | |||||||||
| 200,000 | Series A, 6.75%, 03/15/32 | 229,056 | |||||||||
| 130,000 | Textron Financial Corp., 5.13%, 02/03/11 | 129,038 | |||||||||
| 3,940,581 | |||||||||||
Diversified Telecommunication Services — 0.9% | |||||||||||
| 100,000 | BellSouth Corp., 5.20%, 09/15/14 (c) | 97,592 | |||||||||
| 300,930 | BellSouth Telecommunications, 6.30%, 12/15/15 | 307,619 | |||||||||
| 100,000 | Bell Telephone Co., 8.35%, 12/15/30 | 115,372 | |||||||||
AS OF DECEMBER 31, 2006 (continued)
| PRINCIPAL AMOUNT($) | | SECURITY DESCRIPTION | | VALUE($) | |||||||
|---|---|---|---|---|---|---|---|---|---|---|---|
Long-Term Investments — Continued | |||||||||||
Diversified Telecommunication Services — Continued | |||||||||||
| 400,000 | British Telecommunications plc (United Kingdom), 8.63%, 12/15/10 | 446,404 | |||||||||
| 180,000 | France Telecom S.A. (France), 7.75%, 03/01/11 | 196,069 | |||||||||
| 150,000 | Nynex Capital Funding Co., Series B, SUB, 8.23%, 10/15/09 | 159,231 | |||||||||
| Sprint Capital Corp., | |||||||||||
| 100,000 | 8.38%, 03/15/12 | 111,138 | |||||||||
| 60,000 | 8.75%, 03/15/32 | 72,217 | |||||||||
| 115,000 | Telus Corp. (Canada), 8.00%, 06/01/11 | 125,757 | |||||||||
| 650,000 | Verizon Communications Corp., 7.25%, 12/01/10 | 692,871 | |||||||||
| 100,000 | Verizon Virginia, Inc., Series A, 4.63%, 03/15/13 | 93,910 | |||||||||
| 2,418,180 | |||||||||||
Electric Utilities — 0.5% | |||||||||||
| 100,000 | Carolina Power & Light Co., 5.13%, 09/15/13 | 98,310 | |||||||||
| 100,000 | CenterPoint Energy Houston Electric LLC, Series M2, 5.75%, 01/15/14 | 100,238 | |||||||||
| 70,000 | Commonwealth Edison Co., 6.95%, 07/15/18 (c) | 72,194 | |||||||||
| 150,000 | Exelon Generation Co. LLC, 6.95%, 06/15/11 | 158,020 | |||||||||
| 30,000 | Florida Power & Light Co., 5.95%, 10/01/33 | 30,832 | |||||||||
| 65,000 | PSEG Power LLC, 7.75%, 04/15/11 | 70,232 | |||||||||
| 675,000 | Virginia Electric & Power Co., Series A, 5.38%, 02/01/07 (c) | 675,050 | |||||||||
| 1,204,876 | |||||||||||
Food & Staples Retailing — 0.1% | |||||||||||
| 150,000 | Kroger Co. (The), 8.05%, 02/01/10 | 160,493 | |||||||||
Gas Utilities — 0.0% (g) | |||||||||||
| 80,000 | KeySpan Gas East Corp., 7.88%, 02/01/10 | 85,406 | |||||||||
| 50,000 | TransCanada Pipelines Ltd. (Canada), 4.00%, 06/15/13 | 46,082 | |||||||||
| 131,488 | |||||||||||
Independent Power Producers & Energy Traders — 0.1% | |||||||||||
| 165,000 | Constellation Energy Group, Inc., 6.35%, 04/01/07 | 165,207 | |||||||||
Industrial Conglomerates — 0.2% | |||||||||||
| 250,000 | General Electric Co., 5.00%, 02/01/13 | 247,225 | |||||||||
| 100,000 | Raychem Corp., 7.20%, 10/15/08 | 102,738 | |||||||||
| Tyco International Group S.A. (Luxembourg), | |||||||||||
| 200,000 | 6.38%, 10/15/11 (c) | 209,298 | |||||||||
| 50,000 | 6.75%, 02/15/11 | 52,720 | |||||||||
| 611,981 | |||||||||||
Insurance — 1.2% | |||||||||||
| 130,000 | American International Group, Inc., 4.25%, 05/15/13 | 121,897 | |||||||||
| ASIF Global Financing, | |||||||||||
| 250,000 | 3.90%, 10/22/08 (e) | 243,885 | |||||||||
| 300,000 | 4.90%, 01/17/13 (e) | 292,558 | |||||||||
| 200,000 | Jackson National Life Global Funding, 6.13%, 05/30/12 (e) | 206,453 | |||||||||
| John Hancock Global Funding II, | |||||||||||
| 100,000 | 3.50%, 01/30/09 (e) | 96,442 | |||||||||
| 100,000 | 7.90%, 07/02/10 (e) | 108,103 | |||||||||
| MassMutual Global Funding II, | |||||||||||
| 160,000 | 3.25%, 06/15/07 (e) | 158,519 | |||||||||
| 200,000 | 3.50%, 03/15/10 (e) | 190,361 | |||||||||
| 100,000 | Metropolitan Life Global Funding I, 5.20%, 09/18/13 (e) | 99,881 | |||||||||
| 150,000 | Monumental Global Funding II, 4.38%, 07/30/09 (e) | 146,752 | |||||||||
| 200,000 | Monumental Global Funding III, 5.20%, 01/30/07 (e) | 199,959 | |||||||||
| 100,000 | Nationwide Financial Services, 6.25%, 11/15/11 | 103,363 | |||||||||
| New York Life Global Funding, | |||||||||||
| 75,000 | 3.88%, 01/15/09 (e) | 72,984 | |||||||||
| 250,000 | 5.38%, 09/15/13 (e) | 250,849 | |||||||||
| 145,000 | Pacific Life Global Funding, 3.75%, 01/15/09 (e) | 141,059 | |||||||||
| 300,000 | Principal Life Global Funding I, 6.25%, 02/15/12 (e) | 312,482 | |||||||||
| Protective Life Secured Trust, | |||||||||||
| 85,000 | 4.00%, 10/07/09 | 82,251 | |||||||||
| 200,000 | 4.00%, 04/01/11 | 190,364 | |||||||||
| 3,018,162 | |||||||||||
Media — 0.5% | |||||||||||
| 125,000 | Comcast Cable Communications Holdings, Inc., 7.13%, 06/15/13 | 134,712 | |||||||||
| 150,000 | Comcast Corp., 5.50%, 03/15/11 (c) | 150,633 | |||||||||
| 100,000 | COX Communications, Inc., 7.75%, 11/01/10 | 107,548 | |||||||||
| 335,000 | TCI Communication, Inc., 9.80%, 02/01/12 | 395,031 | |||||||||
| Time Warner Cos, Inc., | |||||||||||
| 120,000 | 8.18%, 08/15/07 | 121,972 | |||||||||
| 100,000 | 9.15%, 02/01/23 | 123,709 | |||||||||
| 150,000 | Time Warner Entertainment Co. LP, 10.15%, 05/01/12 | 177,621 | |||||||||
| 1,211,226 | |||||||||||
| PRINCIPAL AMOUNT($) | | SECURITY DESCRIPTION | | VALUE($) | |||||||
|---|---|---|---|---|---|---|---|---|---|---|---|
Long-Term Investments — Continued | |||||||||||
Multi-Utilities — 0.2% | |||||||||||
| 130,000 | DTE Energy Co., Series A, 6.65%, 04/15/09 | 133,450 | |||||||||
| Duke Power Company LLC, | |||||||||||
| 125,000 | 4.20%, 10/01/08 (c) | 122,485 | |||||||||
| 150,000 | 5.63%, 11/30/12 | 152,708 | |||||||||
| 408,643 | |||||||||||
Oil, Gas & Consumable Fuels — 0.1% | |||||||||||
| 75,000 | ConocoPhillips Canada Funding Co. (Canada), 5.63%, 10/15/16 | 75,356 | |||||||||
| 125,000 | ConocoPhillips Co., 8.75%, 05/25/10 | 138,510 | |||||||||
| 213,866 | |||||||||||
Paper & Forest Products — 0.1% | |||||||||||
| International Paper Co., | |||||||||||
| 165,000 | 4.00%, 04/01/10 | 158,368 | |||||||||
| 55,000 | 4.25%, 01/15/09 | 53,824 | |||||||||
| 65,000 | Union Camp Corp., 6.50%, 11/15/07 | 65,318 | |||||||||
| 100,000 | Weyerhaeuser Co., 6.75%, 03/15/12 | 104,876 | |||||||||
| 382,386 | |||||||||||
Real Estate Management & Development — 0.1% | |||||||||||
| 165,000 | EOP Operating LP, 6.75%, 02/15/12 | 178,195 | |||||||||
| 30,000 | ERP Operating LP, 4.75%, 06/15/09 | 29,515 | |||||||||
| 207,710 | |||||||||||
Road & Rail — 0.1% | |||||||||||
| Burlington Northern Santa Fe Corp., | |||||||||||
| 60,000 | 6.13%, 03/15/09 | 60,948 | |||||||||
| 150,000 | 7.13%, 12/15/10 | 159,684 | |||||||||
| 220,632 | |||||||||||
Thrifts & Mortgage Finance — 0.4% | |||||||||||
| Countrywide Home Loans, Inc., | |||||||||||
| 50,000 | 3.25%, 05/21/08 | 48,608 | |||||||||
| 250,000 | Series L, 4.00%, 03/22/11 (c) | 237,339 | |||||||||
| 150,000 | MGIC Investment Corp., 6.00%, 03/15/07 | 150,119 | |||||||||
| 250,000 | Washington Mutual Bank FA, 5.65%, 08/15/14 | 250,346 | |||||||||
| 90,000 | Washington Mutual, Inc., 4.20%, 01/15/10 | 87,147 | |||||||||
| 300,000 | World Savings Bank FSB, 4.50%, 06/15/09 (c) | 294,442 | |||||||||
| 1,068,001 | |||||||||||
Wireless Telecommunication Services — 0.1% | |||||||||||
| New Cingular Wireless Services, Inc., | |||||||||||
| 50,000 | 7.50%, 05/01/07 | 50,303 | |||||||||
| 150,000 | 7.88%, 03/01/11 | 163,615 | |||||||||
| 213,918 | |||||||||||
| Total Corporate Bonds (Cost $27,126,496) | 27,536,439 | ||||||||||
Mortgage Pass-Through Securities — 11.5% | |||||||||||
| Federal Home Loan Mortgage Corp. Conventional Pools, | |||||||||||
| 24,226 | 10.00%, 01/01/20 | 26,642 | |||||||||
| 47,793 | 10.00%, 09/01/20 | 52,242 | |||||||||
| 7,991 | 12.00%, 07/01/19 | 8,811 | |||||||||
| 530,046 | ARM, 4.13%, 04/01/34 | 521,523 | |||||||||
| 344,746 | ARM, 4.65%, 03/01/35 | 342,235 | |||||||||
| Federal Home Loan Mortgage Corp. Gold Pools, | |||||||||||
| 2,095,942 | 4.00%, 05/01/14 – 09/01/35 | 1,977,795 | |||||||||
| 799,478 | 4.50%, 08/01/18 – 05/01/19 | 771,535 | |||||||||
| 330,672 | 5.50%, 10/01/33 | 327,509 | |||||||||
| 513,011 | 6.00%, 12/01/22 – 01/01/34 | 518,155 | |||||||||
| 1,321,647 | 6.50%, 10/01/17 – 11/01/34 | 1,352,226 | |||||||||
| 1,062,456 | 7.00%, 01/01/17 – 04/01/35 | 1,090,699 | |||||||||
| 32,734 | 7.50%, 09/01/10 | 33,106 | |||||||||
| 53,662 | 8.50%, 11/01/15 | 56,791 | |||||||||
| 5,662 | 9.00%, 06/01/10 | 5,914 | |||||||||
| Federal National Mortgage Association Pools, | |||||||||||
| 403,593 | 3.00%, 09/01/31 | 349,650 | |||||||||
| 742,779 | 3.50%, 09/01/18 – 06/01/19 | 682,141 | |||||||||
| 6,025,324 | 4.00%, 09/01/13 – 12/01/18 | 5,701,882 | |||||||||
| 2,999,855 | 4.50%, 11/01/14 – 02/01/35 | 2,875,825 | |||||||||
| 621,929 | 5.00%, 06/01/18 – 09/01/35 | 602,345 | |||||||||
| 3,287,722 | 5.50%, 04/01/33 – 01/01/34 | 3,254,208 | |||||||||
| 2,573,220 | 6.00%, 05/01/09 – 09/01/33 | 2,600,559 | |||||||||
| 1,479,523 | 6.50%, 03/01/19 – 10/01/35 | 1,513,258 | |||||||||
| 24,718 | 7.00%, 08/01/32 | 25,451 | |||||||||
| 455,767 | 8.00%, 11/01/12 – 11/01/28 | 479,829 | |||||||||
| 160,557 | 8.50%, 12/01/07 – 06/01/30 | 172,219 | |||||||||
| 142,210 | 9.00%, 04/01/25 | 153,440 | |||||||||
| 17,716 | 10.00%, 08/01/21 | 19,441 | |||||||||
| 619,009 | ARM, 3.89%, 07/01/33 | 611,122 | |||||||||
| 496,775 | ARM, 4.16%, 01/01/34 | 491,172 | |||||||||
| 324,562 | ARM, 4.20%, 10/01/34 | 320,780 | |||||||||
| 629,446 | ARM, 4.72%, 05/01/35 | 629,186 | |||||||||
| 1,041,724 | ARM, 4.85%, 01/01/35 | 1,035,983 | |||||||||
| 193,957 | ARM, 4.93%, 04/01/34 | 194,702 | |||||||||
| 19,929 | ARM, 5.64%, 03/01/29 | 20,082 | |||||||||
| 8,525 | ARM, 6.55%, 03/01/19 | 8,504 | |||||||||
| Government National Mortgage Association Pools, | |||||||||||
| 19,607 | 6.50%, 10/15/28 | 20,176 | |||||||||
| 40,692 | 7.00%, 06/15/33 | 42,368 | |||||||||
| 18,207 | 7.50%, 09/15/28 | 19,018 | |||||||||
AS OF DECEMBER 31, 2006 (continued)
| PRINCIPAL AMOUNT($) | | SECURITY DESCRIPTION | | VALUE($) | |||||||
|---|---|---|---|---|---|---|---|---|---|---|---|
Long-Term Investments — Continued | |||||||||||
Mortgage Pass-Through Securities — Continued | |||||||||||
| 142,896 | 8.00%, 01/15/16 – 05/15/28 | 150,925 | |||||||||
| 5,898 | 8.50%, 05/20/25 | 6,344 | |||||||||
| Total Mortgage Pass-Through Securities (Cost $29,426,129) | 29,065,793 | ||||||||||
U.S. Government Agency Securities — 0.9% | |||||||||||
| 2,157,829 | Federal Home Loan Bank System, 4.72%, 09/20/12 (Cost $2,153,222) | 2,106,412 | |||||||||
U.S. Treasury Obligations — 15.8% | |||||||||||
| U.S. Treasury Bonds, | |||||||||||
| 150,000 | 7.63%, 02/15/25 | 198,527 | |||||||||
| 1,350,000 | 11.75%, 11/15/14 (m) | 1,600,594 | |||||||||
| 686,315 | U.S. Treasury Inflation Indexed Bond, 3.63%, 04/15/28 (c) | 828,645 | |||||||||
| 123,065 | U.S. Treasury Inflation Indexed Note, 3.88%, 01/15/09 | 126,450 | |||||||||
| U.S. Treasury Notes, | |||||||||||
| 375,000 | 3.38%, 02/15/08 (c) | 368,452 | |||||||||
| 200,000 | 3.63%, 07/15/09 | 194,727 | |||||||||
| 500,000 | 4.63%, 10/31/11 (c) | 498,183 | |||||||||
| 1,500,000 | 5.00%, 07/31/08 | 1,502,461 | |||||||||
| 2,150,000 | 6.50%, 02/15/10 (m) | 2,258,592 | |||||||||
| U.S. Treasury Bonds Principal STRIPS, | |||||||||||
| 1,000,000 | 11/15/09 (c) | 875,209 | |||||||||
| 705,000 | 08/15/11 (c) | 570,566 | |||||||||
| 900,000 | 11/15/12 (c) | 685,906 | |||||||||
| 3,600,000 | 02/15/13 (c) | 2,715,325 | |||||||||
| 4,000,000 | 02/15/14 (m) | 2,873,188 | |||||||||
| 5,750,000 | 05/15/14 (m) | 4,079,579 | |||||||||
| 3,000,000 | 08/15/14 (m) | 2,103,846 | |||||||||
| 2,600,000 | 11/15/14 (m) | 1,799,465 | |||||||||
| 825,000 | 02/15/15 (m) | 564,350 | |||||||||
| 245,000 | 05/15/15 (c) | 165,512 | |||||||||
| 360,000 | 08/15/15 (c) | 240,370 | |||||||||
| 3,085,000 | 11/15/15 (c) | 2,030,566 | |||||||||
| 1,215,000 | 05/15/16 (c) | 780,376 | |||||||||
| 200,000 | 08/15/16 (c) | 126,711 | |||||||||
| 2,900,000 | 11/15/16 (c) | 1,813,895 | |||||||||
| 4,500,000 | 02/15/16 (m) | 2,924,617 | |||||||||
| 2,750,000 | 02/15/17 (c) | 1,701,436 | |||||||||
| 4,550,000 | 05/15/17 (c) | 2,773,480 | |||||||||
| 2,900,000 | 11/15/17 (c) | 1,718,714 | |||||||||
| 800,000 | 05/15/18 (c) | 462,858 | |||||||||
| 1,750,000 | 02/15/19 (c) | 970,853 | |||||||||
| 100,000 | 02/15/22 (c) | 47,387 | |||||||||
| 500,000 | 02/15/23 (c) | 225,520 | |||||||||
| Total U.S. Treasury Obligations (Cost $39,593,363) | 39,826,360 | ||||||||||
Municipal Bond — 0.1% | |||||||||||
| 250,000 | State of Illinois, Taxable Pension, GO, 5.10%, 06/01/33 (Cost $250,000) | 239,305 | |||||||||
Foreign Government Securities — 0.4% | |||||||||||
| Mexico Government International Bond (Mexico), | |||||||||||
| 150,000 | 4.63%, 10/08/08 | 148,125 | |||||||||
| 50,000 | 6.38%, 01/16/13 | 52,575 | |||||||||
| 100,000 | 6.63%, 03/03/15 | 107,250 | |||||||||
| 325,000 | Series A, 7.50%, 04/08/33 | 382,688 | |||||||||
| 400,000 | Province of Quebec (Canada), 5.75%, 02/15/09 | 405,484 | |||||||||
| Total Foreign Government Securities (Cost $1,018,862) | 1,096,122 | ||||||||||
Supranational — 0.0% (g) | |||||||||||
| 50,000 | Corp. Andina de Fomento, 5.20%, 05/21/13 (Cost $49,855) | 49,125 | |||||||||
| Total Long-Term Investments (Cost $234,861,344) | 232,889,738 | ||||||||||
| SHARES | | | | | |||||||
|---|---|---|---|---|---|---|---|---|---|---|---|
Short-Term Investment — 7.0% | |||||||||||
Investment Company — 7.0% | |||||||||||
| 17,576,415 | JPMorgan Liquid Assets Money Market Fund (b) (Cost $17,576,415) | 17,576,415 | |||||||||
| PRINCIPAL AMOUNT($) | | | | ($) | |||||||
|---|---|---|---|---|---|---|---|---|---|---|---|
Investments of Cash Collateral for Securities on Loan — 9.1% | |||||||||||
Certificates of Deposit — 0.8% | |||||||||||
| 1,000,000 | Deutsche Bank, New York, FRN, 5.41%, 01/22/08 | 1,000,000 | |||||||||
| 999,738 | Societe Generale, New York, FRN, 5.34%, 06/20/07 | 999,738 | |||||||||
| 1,999,738 | |||||||||||
| PRINCIPAL AMOUNT($) | | SECURITY DESCRIPTION | | VALUE ($) | ||||||
|---|---|---|---|---|---|---|---|---|---|---|
Corporate Notes — 1.8% | ||||||||||
| 750,000 | Banque Federative Du Credit, FRN, 5.35%, 07/13/07 | 750,000 | ||||||||
| Beta Finance Inc., FRN, | ||||||||||
| 100,000 | 5.37%, 01/15/08 | 100,000 | ||||||||
| 1,000,075 | 5.38%, 03/15/07 | 1,000,075 | ||||||||
| 1,000,000 | CDC Financial Production, Inc., FRN, 5.36%, 01/29/07 | 1,000,000 | ||||||||
| 749,955 | Macquarie Bank Ltd., FRN, 5.37%, 01/29/08 | 749,955 | ||||||||
| 1,000,000 | Unicredito Italiano Bank plc, FRN, 5.36%, 01/29/08 | 1,000,000 | ||||||||
| 4,600,030 | ||||||||||
Funding Agreement — 0.2% | ||||||||||
| 500,000 | Beneficial Life Insurance Co., FRN, 5.48%, 03/29/07 | 500,000 | ||||||||
Repurchase Agreement — 6.3% | ||||||||||
| 4,200,000 | Banc of America Securities LLC, 5.32%, dated 12/29/06, due 01/02/07, repurchase price $4,202,483, collateralized by U.S. Government Agency Mortgages | 4,200,000 | ||||||||
| 3,500,000 | Bear Stearns Cos., Inc., 5.31%, dated 12/29/06, due 01/02/07, repurchase price $3,502,065, collateralized by U.S. Government Agency Mortgages | 3,500,000 | ||||||||
| 4,200,000 | Lehman Brothers, Inc., 5.31%, dated 12/29/06, due 01/02/07, repurchase price $4,202,478, collateralized by U.S. Government Agency Mortgages | 4,200,000 | ||||||||
| 4,134,829 | UBS Securities LLC, 5.32%, dated 12/29/06, due 01/02/07, repurchase price $4,137,273, collateralized by U.S. Government Agency Mortgages | 4,134,829 | ||||||||
| 16,034,829 | ||||||||||
| Total Investments of Cash Collateral for Securities on Loan (Cost $23,134,597) | 23,134,597 | |||||||||
Total Investments — 108.5% (Cost $275,572,356) | 273,600,750 | |||||||||
Liabilities in Excess of Other Assets — (8.5)% | (21,445,101 | ) | ||||||||
NET ASSETS — 100.0% | $ | 252,155,649 | ||||||||
| (b) — | Investment in affiliate. Money market fund registered under the Investment Company Act of 1940, as amended, and advised by JPMorgan Investment Advisors Inc. |
| (c) — | Security, or a portion of the security, has been delivered to a counterparty as part of a security lending transaction. |
| (e) — | All or a portion of this security is a 144A or private placement security and can only be sold to qualified institutional buyers. Unless otherwise indicated, these securities have been determined to be liquid under procedures established by the Board of Trustees. |
| (g) — | Amount rounds to less than 0.1%. |
| (m) — | All or a portion of this security is segregated for current or potential holdings of futures, swaps, options, TBA, and when-issued securities, delayed delivery securities, and reverse repurchase agreements. |
| ARM — | Adjustable Rate Mortgage. |
| CMO — | Collateralized Mortgage Obligation. |
| FRN — | Floating Rate Note. The rate shown is the rate in effect as of December 31, 2006. |
| GO — | General Obligation. |
| HB — | High Coupon Bonds (a.k.a. “IOettes”) represent the right to receive interest payments on an underlying pool of mortgages with similar features as those associated with IO securities. Unlike IO’s the owner also has a right to receive a very small portion of principal. The high interest rates result from taking interest payments from other classes in the Real Estate Mortgage Investment Conduit (REMIC) trust and allocating them to the small principal of the HB class. |
| IF — | Inverse Floaters represent securities that pay interest at a rate that increases (decreases) with a decline (incline) in a specified index. The rate shown is the rate in effect as of December 31, 2006. The rate may be subject to a cap and floor. |
| IO — | Interest Only represents the right to receive the monthly interest payment on an underlying pool of mortgage loans. The face amount shown represents the par value on the underlying pool. The yields on these securities exceed yields on other mortgage-backed securities because their cash flow patterns are more volatile and there is a greater risk that the initial investment will not be fully recouped. These securities are subject to accelerated principal paydowns as a result of prepayment or refinancing of the underlying pool of mortgage instruments. As a result, interest income may be reduced considerably. |
| PO — | Principal Only represents the right to receive the principal portion only on an underlying pool of mortgage loans. The market value of these securities is extremely volatile in response to changes in market interest rates. As prepayments on the underlying mortgages of these securities increase, the yield on these securities increases. |
| STRIPS — | Separate Trading of Registered Interest and Principal Securities. The STRIPS Program lets investors hold and trade individual interest and principal components of eligible notes and bonds as separate securities. |
| SUB — | Step-Up Bond. The rate shown is the rate in effect as of December 31, 2006. |
| VAR — | Variable Rate Note. The interest rate shown is the rate in effect at December 31, 2006. |
AS OF DECEMBER 31, 2006
| | Core Bond Portfolio | |||||
|---|---|---|---|---|---|---|
ASSETS: | ||||||
| Investments in non-affiliates, at value | $ | 256,024,335 | ||||
| Investments in affiliates, at value | 17,576,415 | |||||
| Total investment securities, at value | 273,600,750 | |||||
| Cash | 11,757 | |||||
| Receivables: | ||||||
| Investment securities sold | 159,302 | |||||
| Portfolio shares sold | 672,567 | |||||
| Interest and dividends | 1,359,327 | |||||
| Prepaid expenses and other assets | 366 | |||||
| Total Assets | 275,804,069 | |||||
LIABILITIES: | ||||||
| Payables: | ||||||
| Collateral for securities lending program | 23,134,597 | |||||
| Portfolio shares redeemed | 370,268 | |||||
| Accrued liabilities: | ||||||
| Investment advisory fees | 79,482 | |||||
| Administration fees | 22,346 | |||||
| Distribution fees | 3 | |||||
| Other | 41,724 | |||||
| Total Liabilities | 23,648,420 | |||||
| Net Assets | $ | 252,155,649 | ||||
NET ASSETS: | ||||||
| Paid in capital | $ | 244,143,099 | ||||
| Accumulated undistributed (distributions in excess of) net investment income | 12,598,436 | |||||
| Accumulated net realized gains (losses) | (2,614,280 | ) | ||||
| Net unrealized appreciation (depreciation) | (1,971,606 | ) | ||||
| Total Net Assets | $ | 252,155,649 | ||||
| Net Assets: | ||||||
| Class 1 | $ | 252,140,181 | ||||
| Class 2 | 15,468 | |||||
| Total | $ | 252,155,649 | ||||
| Outstanding units of beneficial interest (shares) (unlimited amount authorized, no par value): | ||||||
| Class 1 | 22,322,848 | |||||
| Class 2 | 1,370 | |||||
| Net asset value, offering and redemption price per share: | ||||||
| Class 1 | $ | 11.30 | ||||
| Class 2 | 11.29 | |||||
| Cost of investments | $ | 275,572,356 | ||||
| Market value of securities on loan | 22,643,162 | |||||
For the YEAR Ended DECEMBER 31, 2006
| | Core Bond Portfolio | |||||
|---|---|---|---|---|---|---|
INVESTMENT INCOME: | ||||||
| Interest income | $ | 13,468,397 | ||||
| Dividend income from affiliates (a) | 960,182 | |||||
| Income from securities lending (net) | 28,383 | |||||
| Total investment income | 14,456,962 | |||||
EXPENSES: | ||||||
| Investment advisory fees | 1,340,051 | |||||
| Administration fees | 332,149 | |||||
| Distribution fees—Class 2 | 15 | |||||
| Custodian and accounting fees | 20,101 | |||||
| Professional fees | 67,320 | |||||
| Trustees’ and Officers’ fees | 4,147 | |||||
| Transfer agent fees | 11,870 | |||||
| Printing and mailing costs | 141,190 | |||||
| Other | 32,391 | |||||
| Total expenses | 1,949,234 | |||||
| Less amounts waived | (127,860 | ) | ||||
| Less earnings credits | (588 | ) | ||||
| Net expenses | 1,820,786 | |||||
| Net investment income (loss) | 12,636,176 | |||||
REALIZED/UNREALIZED GAINS (LOSSES): | ||||||
| Net realized gain (loss) on transactions from investments | (1,458,598 | ) | ||||
| Change in net unrealized appreciation (depreciation) of investments | (1,931,371 | ) | ||||
| Net realized/unrealized gains (losses) | (3,389,969 | ) | ||||
| Change in net assets resulting from operations | $ | 9,246,207 | ||||
| (a) | Includes reimbursements of investment advisory, administration fees and shareholder servicing fees. See Fees and Other Transactions with Affiliates in the Notes to Financial Statements. |
FOR THE PERIODS INDICATED
| Core Bond Portfolio | |||||||||||
|---|---|---|---|---|---|---|---|---|---|---|---|
| | Year Ended 12/31/2006 | | Year Ended 12/31/2005 | ||||||||
CHANGE IN NET ASSETS RESULTING FROM OPERATIONS: | |||||||||||
| Net investment income (loss) | $ | 12,636,176 | $ | 12,719,927 | |||||||
| Net realized gain (loss) | (1,458,598 | ) | (496,662 | ) | |||||||
| Change in net unrealized appreciation (depreciation) | (1,931,371 | ) | (5,583,304 | ) | |||||||
| Change in net assets resulting from operations | 9,246,207 | 6,639,961 | |||||||||
DISTRIBUTIONS TO SHAREHOLDERS: | |||||||||||
Class 1 | |||||||||||
| From net investment income | (12,776,052 | ) | (9,957,150 | ) | |||||||
CHANGE IN NET ASSETS FROM CAPITAL TRANSACTIONS: | |||||||||||
| Change in net assets from capital transactions | (71,653,539 | ) | 95,695,556 | ||||||||
NET ASSETS: | |||||||||||
| Change in net assets | (75,183,384 | ) | 92,378,367 | ||||||||
| Beginning of period | 327,339,033 | 234,960,666 | |||||||||
| End of period | $ | 252,155,649 | $ | 327,339,033 | |||||||
| Accumulated undistributed (distributions in excess of) net investment income | $ | 12,598,436 | $ | 12,738,872 | |||||||
CAPITAL TRANSACTIONS: | |||||||||||
Class 1 | |||||||||||
| Proceeds from shares issued | $ | 64,392,680 | $ | 119,235,411 | |||||||
| Dividends reinvested | 12,776,052 | 9,957,150 | |||||||||
| Cost of shares redeemed | (148,837,346 | ) | (33,497,005 | ) | |||||||
| Change in net assets from Class 1 capital transactions | $ | (71,668,614 | ) | $ | 95,695,556 | ||||||
Class 2 (a) | |||||||||||
| Proceeds from shares issued | $ | 15,075 | $ | — | |||||||
| Change in net assets from Class 2 capital transactions | $ | 15,075 | $ | — | |||||||
SHARE TRANSACTIONS: | |||||||||||
Class 1 | |||||||||||
| Issued | 5,824,077 | 10,620,278 | |||||||||
| Reinvested | 1,187,366 | 910,993 | |||||||||
| Redeemed | (13,769,215 | ) | (2,978,384 | ) | |||||||
| Change in Class 1 Shares | (6,757,772 | ) | 8,552,887 | ||||||||
Class 2 (a) | |||||||||||
| Issued | 1,370 | — | |||||||||
| Change in Class 2 Shares | 1,370 | — | |||||||||
| (a) | Commencement of offering class of shares effective August 16, 2006. |
FOR THE PERIODS INDICATED
| | | | | Per share operating performance | | ||||||||||||||||||||||||||
|---|---|---|---|---|---|---|---|---|---|---|---|---|---|---|---|---|---|---|---|---|---|---|---|---|---|---|---|---|---|---|---|
| Investment operations | Distributions | ||||||||||||||||||||||||||||||
| | Net asset value, beginning of period | | Net investment income (loss) | | Net realized and unrealized gains (losses) on investments | | Total from investment operations | | Net investment income | | Net realized gains | | Total distributions | ||||||||||||||||||
Class 1 | |||||||||||||||||||||||||||||||
| Year Ended December 31, 2006 | $ | 11.26 | $ | 0.54 | $ | (0.08 | ) | $ | 0.46 | $ | (0.42 | ) | $ | — | $ | (0.42 | ) | ||||||||||||||
| Year Ended December 31, 2005 | 11.45 | 0.40 | (0.14 | ) | 0.26 | (0.45 | ) | — | (0.45 | ) | |||||||||||||||||||||
| Year Ended December 31, 2004 | 11.58 | 0.46 | 0.01 | 0.47 | (0.60 | ) | — | (0.60 | ) | ||||||||||||||||||||||
| Year Ended December 31, 2003 | 11.83 | 0.59 | (0.15 | ) | 0.44 | (0.69 | ) | — | (0.69 | ) | |||||||||||||||||||||
| Year Ended December 31, 2002 | 10.80 | 0.70 | 0.37 | 1.07 | — | (e) | (0.04 | ) | (0.04 | ) | |||||||||||||||||||||
Class 2 | |||||||||||||||||||||||||||||||
| August 16, 2006(d) through December 31, 2006 | 11.00 | 0.18 | 0.11 | 0.29 | — | — | — | ||||||||||||||||||||||||
| (a) | Annualized for periods less than one year. |
| (b) | Not annualized for periods less than one year. |
| (c) | Includes adjustments in accordance with accounting principles generally accepted in the United States of America and as such, the net asset value for financial reporting purposes and the returns based upon those net asset values may differ from the net asset value and returns for shareholder transactions. |
| (d) | Commencement of offering of class of shares. |
| (e) | Amount less than $0.01. |
| | | Ratios/Supplemental data | | ||||||||||||||||||||||||
|---|---|---|---|---|---|---|---|---|---|---|---|---|---|---|---|---|---|---|---|---|---|---|---|---|---|---|---|
| Ratios to average net assets (a) | |||||||||||||||||||||||||||
| Net asset value, end of period | | Total return (b)(c) | | Net assets end of period (000’s) | | Net expenses | | Net investment income (loss) | | Expenses without waivers, reimbursements and earnings credits | | Portfolio turnover rate (b) | |||||||||||||||
| $11.30 | 4.23 | % | $ | 252,140 | 0.65 | % | 4.52 | % | 0.70 | % | 13 | % | |||||||||||||||
| 11.26 | 2.39 | 327,339 | 0.74 | 4.54 | 0.79 | 17 | |||||||||||||||||||||
| 11.45 | 4.13 | 234,961 | 0.75 | 4.79 | 0.79 | 15 | |||||||||||||||||||||
| 11.58 | 3.87 | 189,747 | 0.75 | 5.50 | 0.81 | 21 | |||||||||||||||||||||
| 11.83 | 9.99 | 167,767 | 0.75 | 6.38 | 0.81 | 26 | |||||||||||||||||||||
| 11.29 | 2.64 | 15 | 0.84 | 4.29 | 0.87 | 13 | |||||||||||||||||||||
AS OF DECEMBER 31, 2006
| | Classes Offered | |||||
|---|---|---|---|---|---|---|
| Core Bond Portfolio | Class 1 and Class 2 | |||||
calculated on an annualized basis and accrued daily, based upon the value of collateral received from borrowers for each loan of non-U.S. securities outstanding during a given month. For the year ended December 31, 2006, JPMCB voluntarily reduced its fees to: (i) 0.05% for each loan of U.S. securities and (ii) 0.10% for each loan of non-U.S. securities, respectively.
| | Lending Agent Fees Paid | | Market Value of Collateral | | Market Value of Loaned Securities | |||||||||
|---|---|---|---|---|---|---|---|---|---|---|---|---|---|---|
| $ | 9,598 | $ | 23,134,597 | $ | 22,643,162 | |||||||||
| | Paid-in-capital | | Accumulated Undistributed/ (Overdistributed) Net Investment Income | | Accumulated Net Realized Gain (Loss) on Investments | |||||||||
|---|---|---|---|---|---|---|---|---|---|---|---|---|---|---|
| $ | 560 | $ | (560 | ) | $ | — | ||||||||
AS OF DECEMBER 31, 2006 (continued)
date of effectiveness. Management continues to evaluate the application of the Interpretation to the Portfolio, and is not in a position at this time to estimate the significance of its impact, if any, on the Portfolio’s financial statements.
| | Class 1 | | Class 2 | |||||||
|---|---|---|---|---|---|---|---|---|---|---|
| 0.60 | %* | 0.85 | % | |||||||
| * | 0.73% prior to May 1, 2006 |
| | Purchases (excluding U.S. Government) | | Sales (excluding U.S. Government) | | Purchases of U.S. Government | | Sales of U.S. Government | |||||||||||
|---|---|---|---|---|---|---|---|---|---|---|---|---|---|---|---|---|---|---|
| $ | 11,368,080 | $ | 53,304,049 | $ | 23,045,106 | $ | 39,813,747 | |||||||||||
| | Aggregate Cost | | Gross Unrealized Appreciation | | Gross Unrealized Depreciation | | Net Unrealized Appreciation (Depreciation) | |||||||||||
|---|---|---|---|---|---|---|---|---|---|---|---|---|---|---|---|---|---|---|
| $ | 275,572,366 | $ | 2,536,054 | $ | 4,507,670 | $ | (1,971,616 | ) | ||||||||||
| Total Distributions Paid From: | |||||||||||
|---|---|---|---|---|---|---|---|---|---|---|---|
| | Ordinary Income | | Total Distributions Paid | | |||||||
| $ | 12,776,052 | $ | 12,776,052 | ||||||||
| Total Distributions Paid From: | |||||||||||
|---|---|---|---|---|---|---|---|---|---|---|---|
| | Ordinary Income | | Total Distributions Paid | | |||||||
| $ | 9,957,150 | $ | 9,957,150 | ||||||||
AS OF DECEMBER 31, 2006 (continued)
| | Current Distributable Ordinary Income | | Current Distributable Long-Term Capital Gain or (Tax Basis Capital Loss Carryover) | | Unrealized Appreciation (Depreciation) | |||||||||
|---|---|---|---|---|---|---|---|---|---|---|---|---|---|---|
| $ | 12,603,975 | $ | (2,614,270 | ) | $ | (1,971,616 | ) | |||||||
| Expires | ||||||||||||||||||
|---|---|---|---|---|---|---|---|---|---|---|---|---|---|---|---|---|---|---|
| | 2011 | | 2012 | | 2014 | Total | | |||||||||||
| $ | 399,943 | $ | 224,214 | $ | 1,990,113 | $2,614,270 | ||||||||||||
Shareholders of JPMorgan Insurance Trust Core Bond Portfolio:
New York, New York
February 15, 2007
(Unaudited)
| Name (Year of Birth); Positions With the Portfolio | | Principal Occupations During Past 5 Years | | Number of Portfolios in Fund Complex Overseen by Trustee (1) | | Other Directorships Held Outside Fund Complex | |||||||||
|---|---|---|---|---|---|---|---|---|---|---|---|---|---|---|---|
Independent Trustees | |||||||||||||||
| William J. Armstrong (1941); Trustee since 2005; Trustee of heritage JPMorgan Funds since 1987. | Retired; CFO and Consultant, EduNeering, Inc. (internet business education supplier) (2000–2001); Vice President and Treasurer, Ingersoll–Rand Company (manufacturer of industrial equipment) (1972–2000). | 131 | None. | ||||||||||||
| Roland R. Eppley, Jr. (1932); Trustee since 2005; Trustee of heritage JPMorgan Funds since 1989. | Retired; President and Chief Executive Officer, Eastern States Bankcard (1971–1988). | 131 | None. | ||||||||||||
| John F. Finn (1947); Trustee since 2005; Trustee of heritage One Group Mutual Funds since 1998. | President and Chief Executive Officer, Gardner, Inc. (wholesale distributor to outdoor power equipment industry) (1979–present). | 131 | Director, Cardinal Health, Inc (CAH) (1994–present); Chairman, The Columbus Association of the Performing Arts (CAPA) (2003–present). | ||||||||||||
| Dr. Matthew Goldstein (1941); Trustee since 2005; Trustee of heritage JPMorgan Funds since 2003. | Chancellor, City University of New York (1999–present); President, Adelphi University (New York) (1998–1999). | 131 | Director, Albert Einstein School of Medicine (1998–present); Director, New Plan Excel Realty Trust, Inc. (real estate investment trust) (2000–present); Director, Lincoln Center Institute for the Arts in Education (1999–present). | ||||||||||||
| Robert J. Higgins (1945); Trustee since 2005; Trustee of heritage JPMorgan Funds since 2002. | Retired; Director of Administration of the State of Rhode Island (2003–2004); President — Consumer Banking and Investment Services, Fleet Boston Financial (1971–2001). | 131 | None. | ||||||||||||
| Peter C. Marshall (1942); Trustee since 2005; Trustee of heritage One Group Mutual Funds since 1994. | Self-employed business consultant (2001–present); Senior Vice President, W.D. Hoard, Inc. (corporate parent of DCI Marketing, Inc.) (2000–2002); President, DCI Marketing, Inc. (1992–2000). | 131 | None. | ||||||||||||
| Marilyn McCoy (1948); Trustee since 2005; Trustee of heritage One Group Mutual Funds since 1999. | Vice President of Administration and Planning, Northwestern University (1985–present). | 131 | Trustee, Mather LifeWays (1994–present); Trustee, Carleton College (2003–present). | ||||||||||||
| William G. Morton, Jr. (1937); Trustee since 2005; Trustee of heritage JPMorgan Funds since 2003. | Retired; Chairman Emeritus (2001–2002), and Chairman and Chief Executive Officer, Boston Stock Exchange (1985–2001). | 131 | Director, Radio Shack Corporation (electronics) (1987–present); Director, The National Football Foundation and College Hall of Fame (1994–present); Trustee, Stratton Mountain School (2001–present). | ||||||||||||
| Name (Year of Birth); Positions With the Portfolio | | Principal Occupations During Past 5 Years | | Number of Portfolios in Fund Complex Overseen by Trustee (1) | | Other Directorships Held Outside Fund Complex | |||||||||
|---|---|---|---|---|---|---|---|---|---|---|---|---|---|---|---|
Independent Trustees (continued) | |||||||||||||||
| Robert A. Oden, Jr. (1946); Trustee since 2005; Trustee of heritage One Group Mutual Funds since 1997. | President, Carleton College (2002–present); President, Kenyon College (1995–2002). | 131 | Director, American University in Cairo. | ||||||||||||
| Fergus Reid, III (1932); Trustee (Chairman) since 2005; Trustee (Chairman) of heritage JPMorgan Funds since 1987. | Chairman, Lumelite Corporation (plastics manufacturing) (2003–present); Chairman and Chief Executive Officer, Lumelite Corporation (1985–2002). | 131 | Trustee, Morgan Stanley Funds (196 portfolios) (1995–present). | ||||||||||||
| Frederick W. Ruebeck (1939); Trustee since 2005; Trustee of heritage One Group Mutual Funds since 1994. | Advisor, Jerome P. Green & Associates, LLC (broker-dealer) (2000–present); Chief Investment Officer, Wabash College (2004–present); self-employed consultant (2000–present); Director of Investments, Eli Lilly and Company (1988–1999). | 131 | Trustee, Wabash College (1988–present); Chairman, Indianapolis Symphony Orchestra Foundation (1994–present). | ||||||||||||
| James J. Schonbachler (1943); Trustee since 2005; Trustee of heritage JPMorgan Funds since 2001. | Retired; Managing Director of Bankers Trust Company (financial services) (1968–1998). | 131 | None. | ||||||||||||
Interested Trustee | |||||||||||||||
| Leonard M. Spalding, Jr.* (1935); Trustee since 2005; Trustee of heritage JPMorgan Funds since 1998. | Retired; Chief Executive Officer, Chase Mutual Funds (investment company) (1989–1998); President and Chief Executive Officer, Vista Capital Management (investment management) (1990–1998); Chief Investment Executive, Chase Manhattan Private Bank (investment management) (1990–1998). | 131 | Director, Glenview Trust Company, LLC (2001–present); Trustee, St. Catherine College (1998–present); Trustee, Bellarmine University (2000–present); Director, Springfield-Washington County Economic Development Authority (1997–present); Trustee, Marion and Washington County, Kentucky Airport Board (1998–present); Trustee, Catholic Education Foundation (2005–present). | ||||||||||||
| (1) | A Fund Complex means two or more registered investment companies that hold themselves out to investors as related companies for purposes of investment and investor services or have a common investment adviser or have an investment adviser that is an affiliated person of the investment adviser of any of the other registered investment companies. The JPMorgan Funds Complex for which the Board of Trustees serves currently includes eight registered investment companies (131 funds). |
| * | Mr. Spalding is deemed to be an “interested person” due to his ownership of JPMorgan Chase stock. |
(Unaudited)
| Name (Year of Birth), Positions Held with the Trust | | Principal Occupations During Past 5 Years | ||||
|---|---|---|---|---|---|---|
| George C.W. Gatch (1962), President since 2005 | Managing Director, J.P. Morgan Investment Management Inc.; Director and President, JPMorgan Distribution Services, Inc. and JPMorgan Funds Management, Inc. since 2005. Mr. Gatch is CEO and President of the JPMorgan Funds. Mr. Gatch has been an employee of JPMorgan since 1986 and has held positions such as President and CEO of DKB Morgan, a Japanese mutual fund company, which was a joint venture between J.P. Morgan and Dai-Ichi Kangyo Bank, as well as positions in business management, marketing and sales. | |||||
| Robert L. Young (1963), Senior Vice President since 2005* | Director and Vice President, JPMorgan Distribution Services, Inc. and JPMorgan Funds Management, Inc.; Chief Operating Officer, JPMorgan Funds since 2005, and One Group Mutual Funds from 2001 until 2005. Mr. Young was Vice President and Treasurer, JPMorgan Funds Management, Inc. (formerly One Group Administrative Services) and Vice President and Treasurer, JPMorgan Distribution Services, Inc. (formerly One Group Dealer Services, Inc.) from 1999 to 2005. | |||||
| Patricia A. Maleski (1960), Vice President and Chief Administrative Officer since 2005 | Managing Director, JPMorgan Funds Management, Inc.; previously, Treasurer, JPMorgan Funds and Head of Funds Administration and Board Liaison. Ms. Maleski was Vice President of Finance for the Pierpont Group, Inc. from 1996–2001, an independent company owned by the Board of Directors/Trustees of the JPMorgan Funds, prior to joining JPMorgan Chase & Co. in 2001. | |||||
| Stephanie J. Dorsey (1969), Treasurer since 2005* | Vice President, JPMorgan Funds Management, Inc.; Director of Mutual Fund Administration, JPMorgan Funds Management, Inc. (formerly One Group Administrative Services), from 2004 to 2005; Ms. Dorsey worked for JPMorgan Chase & Co., (formerly Bank One Corporation) from 2003 to 2004; prior to joining Bank One Corporation, she was a Senior Manager specializing in Financial Services audits at PricewaterhouseCoopers LLP from 1992 through 2002. | |||||
| Stephen M. Ungerman (1953), Chief Compliance Officer since 2005 | Senior Vice President, JPMorgan Chase & Co.; Mr. Ungerman was head of Fund Administration — Pooled Vehicles from 2000 to 2004. Mr. Ungerman held a number of positions in Prudential Financial’s asset management business prior to 2000. | |||||
| Paul L. Gulinello (1950), AML Compliance Officer since 2005 | Vice President and Anti Money Laundering Compliance Officer for JPMorgan Asset Management Americas, additionally responsible for personal trading and compliance testing since 2004; Treasury Services Operating Risk Management and Compliance Executive supporting all JPMorgan Treasury Services business units from July 2000 to 2004. | |||||
| Stephen M. Benham (1959), Secretary since 2005 | Vice President and Assistant General Counsel, JPMorgan Chase & Co. since 2004; Vice President (Legal Advisory) of Merrill Lynch Investment Managers, L.P. from 2000 to 2004. | |||||
| Elizabeth A. Davin (1964), Assistant Secretary since 2005* | Vice President and Assistant General Counsel, JPMorgan Chase & Co. since 2005; Senior Counsel, JPMorgan Chase & Co. (formerly Bank One Corporation) from 2004 to 2005; Assistant General Counsel and Associate General Counsel and Vice President, Gartmore Global Investments, Inc. from 1999 to 2004. | |||||
| Jessica K. Ditullio (1962), Assistant Secretary since 2005* | Vice President and Assistant General Counsel, JPMorgan Chase & Co. since 2005; Ms. Ditullio has served as an attorney with various titles for JPMorgan Chase & Co. (formerly Bank One Corporation) since 1990. | |||||
| Nancy E. Fields (1949), Assistant Secretary since 2005* | Vice President, JPMorgan Funds Management, Inc. and JPMorgan Distribution Services, Inc.; From 1999 to 2005, Director, Mutual Fund Administration, JPMorgan Funds Management, Inc. (formerly One Group Administrative Services) and Senior Project Manager, Mutual Funds, JPMorgan Distribution Services, Inc. (formerly One Group Dealer Services, Inc.). | |||||
| Michael C. Raczynski (1975), Assistant Secretary since 2006 | Vice President and Assistant General Counsel, JPMorgan Chase & Co. since 2006; Associate, Stroock & Stroock & Lavan LLP from 2001 to 2006. | |||||
| Ellen W. O’Brien (1957), Assistant Secretary since 2005** | Assistant Vice President, JPMorgan Investor Services, Co., responsible for Blue Sky registration. Ms. O’Brien has served in this capacity since joining the firm in 1991. | |||||
| Name (Year of Birth), Positions Held with the Trust | | Principal Occupations During Past 5 Years | ||||
|---|---|---|---|---|---|---|
| Laura S. Melman (1966) Assistant Treasurer since 2006 | Vice President, JPMorgan Funds Management, Inc. since August, 2006, responsible for Taxation; Vice President of Structured Products at The Bank of New York Co., Inc. from 2001 to 2006. | |||||
| Arthur A. Jensen (1966), Assistant Treasurer since 2005* | Vice President, JPMorgan Funds Management, Inc. since April 2005; formerly, Vice President of Financial Services of BISYS Fund Services, Inc. from 2001 to 2005; Mr. Jensen was Section Manager at Northern Trust Company and Accounting Supervisor at Allstate Insurance Company prior to 2001. | |||||
| Jeffrey D. House (1972) Assistant Treasurer since 2006* | Vice President, JPMorgan Funds Management, Inc. since July 2006; formerly, Senior Manager of Financial Services at BISYS Fund Services, Inc. from 1995 to 2006. | |||||
| * | The contact address for the officer is 1111 Polaris Parkway, Columbus, OH 43271. |
| ** | The contact address for the officer is 73 Tremont Street, Floor 1, Boston MA 02108. |
(Unaudited)
December 31, 2006
| | Beginning Account Value, July 1, 2006 | | Ending Account Value, December 31, 2006 | | Expenses Paid During Period July 1, 2006 to December 31, 2006 | | Annualized Expense Ratio | |||||||||||
|---|---|---|---|---|---|---|---|---|---|---|---|---|---|---|---|---|---|---|
Class 1 | ||||||||||||||||||
| Actual* | $ | 1,000.00 | $ | 1,049.20 | $ | 3.05 | 0.59 | % | ||||||||||
| Hypothetical* | 1,000.00 | 1,022.23 | 3.01 | 0.59 | ||||||||||||||
Class 2 | ||||||||||||||||||
| Actual** | 1,000.00 | 1,026.40 | 3.22 | 0.84 | ||||||||||||||
| Hypothetical* | 1,000.00 | 1,020.97 | 4.28 | 0.84 | ||||||||||||||
| * | Expenses are equal to the Portfolio’s annualized expense ratio, multiplied by the average account value over the period, multiplied by 184/365 (to reflect the one-half year period). |
| ** | Expenses are equal to the Portfolio’s annualized expense ratio, multiplied by the average account value over the period, multiplied by 138/365 (to reflect the actual period). |
(Unaudited)
(Unaudited) (continued)
contractual services provided to the Funds, less expenses of providing such services. Expenses include direct and indirect costs and are calculated using an allocation methodology developed by the Advisor. The Trustees also recognized that it is difficult to make comparisons of profitability from fund investment advisory contracts because comparative information is not generally publicly available and is affected by numerous factors, including the structure of the particular Advisor, the types of funds it manages, its business mix, numerous assumptions regarding allocations and the fact that publicly-traded fund managers’ operating profits and net income are net of distribution and marketing expenses. Based on their review, the Trustees concluded that the profitability to the Advisor of each of the Investment Advisory Agreements was not unreasonable in light of the services and benefits provided to each Fund.
for the one, three and five year periods respectively and concluded that the performance was reasonable.
(Unaudited)
© JPMorgan Chase & Co., 2007 All rights reserved. December 2006. | AN-JPMITCBP-1206 |
This material must be preceded or accompanied by a current prospectus.
| President’s Letter | 1 | |||||
| Portfolio Commentary: | ||||||
| JPMorgan Insurance Trust Diversified Equity Portfolio | 2 | |||||
| Schedule of Portfolio Investments | 4 | |||||
| Financial Statements | 7 | |||||
| Financial Highlights | 10 | |||||
| Notes to Financial Statements | 12 | |||||
| Report of Independent Registered Public Accounting Firm | 17 | |||||
| Trustees | 18 | |||||
| Officers | 20 | |||||
| Schedule of Shareholder Expenses | 22 | |||||
| Board Approval of Investment Advisory Agreement | 23 | |||||
| Tax Letter | 26 | |||||
| Additional Shareholder Information | 27 |
| • | Fed’s tightening cycle gained traction in the economy |
| • | Markets buoyed by falling oil prices, solid corporate profits and a robust mergers-and-acquisitions environment |
| • | Home sales stabilized toward year-end but were offset somewhat by amount of unsold homes |
| • | Consumer spending likely to moderate as job gains decrease |
JANUARY 5, 2007 (Unaudited)
| “We expect economic growth to remain subdued over the next few quarters, keeping the pressure off inflation.” | ||
President
JPMorgan Funds
AS OF DECEMBER 31, 2006 (Unaudited)
| PORTFOLIO FACTS | | |||||
|---|---|---|---|---|---|---|
| Portfolio Inception | March 30, 1995 | |||||
| Fiscal Year End | December 31 | |||||
| Net Assets as of 12/31/2006 | $148,091,598 | |||||
| Primary Benchmark* | S&P 500 Index | |||||
Q: | HOW DID THE PORTFOLIO PERFORM? |
A: | The JPMorgan Insurance Trust Diversified Equity Portfolio, which seeks to provide high total return from a portfolio of selected equity securities, returned 16.15% (Class 1 Shares) for the 12 months ended December 31, 2006, compared to the 15.80% return for the S&P 500 Index over the same period.** |
Q: | WHY DID THE PORTFOLIO PERFORM THIS WAY? |
A: | The Portfolio outperformed its benchmark for the period due to stock selection in the software and services, retail and autos and transportation sectors. During the period, in the retail sector, an overweight position in Kohl’s Corp., the department store chain, contributed to returns. Its share price was buoyed by impressive growth in net income and an increase in gross margins. In addition, we believe that many of the tactical changes implemented by management are helping Kohl’s run its stores more efficiently. New brand and marketing initiatives provided a strong boost to the number of transactions, particularly in its home and men’s apparel departments, while inventory management approaches allowed stores to keep inventory down while adapting to consumer tastes. Another top contributor for the year was RenaissanceRe Holdings Ltd., the reinsurance company, in which we had an overweight. RenaissanceRe reported one of its strongest quarters in its history late in the period as it benefited from low catastrophe losses, positive reserve development and strong investment income growth. |
Q: | HOW WAS THE PORTFOLIO MANAGED? |
A: | Effective November 1, 2006, the Portfolio underwent several changes including a change to its portfolio management team. Although the Portfolio remains research-driven, the portfolio manager uses his input and insights to manage the Portfolio. |
| 1. | General Electric Co. | 4.3 | % | |||||||
| 2. | Exxon Mobil Corp. | 3.2 | ||||||||
| 3. | Citigroup, Inc. | 3.1 | ||||||||
| 4. | Microsoft Corp. | 3.0 | ||||||||
| 5. | Procter & Gamble Co. | 2.7 | ||||||||
| 6. | Altria Group, Inc. | 2.6 | ||||||||
| 7. | Johnson Controls, Inc. | 2.5 | ||||||||
| 8. | Staples, Inc. | 2.3 | ||||||||
| 9. | Bank of America Corp. | 2.2 | ||||||||
| 10. | Cisco Systems, Inc. | 2.0 | ||||||||
| Financials | 20.7 | % | ||||
| Information Technology | 17.2 | |||||
| Health Care | 10.9 | |||||
| Industrials | 10.6 | |||||
| Consumer Staples | 10.4 | |||||
| Consumer Discretionary | 10.1 | |||||
| Energy | 9.3 | |||||
| Telecommunication Services | 4.4 | |||||
| Utilities | 3.7 | |||||
| Materials | 2.9 | |||||
| Short-Term Investment | 0.3 | |||||
| Investments of Cash Collateral for Securities on Loan | 11.2 |
| * | The Portfolio’s benchmark changed to the S&P 500 Index, effective November 1, 2006. |
| ** | The portfolio team was modified and the investment objective and strategies changed on November 1, 2006. The advisor seeks to achieve the Portfolio’s objective. There can be no guarantee it will be achieved. |
| *** | Percentages indicated are based upon net assets as of December 31, 2006. The Portfolio’s composition is subject to change. |
| INCEPTION DATE OF CLASS | 1 YEAR | 5 YEAR | 10 YEAR | |||||||||||||||
|---|---|---|---|---|---|---|---|---|---|---|---|---|---|---|---|---|---|---|
CLASS 1 SHARES | 3/30/95 | 16.15 | % | 4.08 | % | 5.03 | % | |||||||||||
CLASS 2 SHARES | 8/16/06 | 16.01 | 4.05 | 5.02 | ||||||||||||||

AS OF DECEMBER 31, 2006
| SHARES | | SECURITY DESCRIPTION | | VALUE($) | |||||||
|---|---|---|---|---|---|---|---|---|---|---|---|
Long-Term Investments — 100.2% | |||||||||||
Common Stock — 100.2% | |||||||||||
Aerospace & Defense — 2.0% | |||||||||||
| 16,400 | Goodrich Corp. (c) | 747,020 | |||||||||
| 15,700 | Honeywell International, Inc. | 710,268 | |||||||||
| 24,970 | United Technologies Corp. | 1,561,124 | |||||||||
| 3,018,412 | |||||||||||
Auto Components — 2.5% | |||||||||||
| 43,200 | Johnson Controls, Inc. (c) | 3,711,744 | |||||||||
Beverages — 0.9% | |||||||||||
| 9,140 | Coca-Cola Co. (The) | 441,005 | |||||||||
| 14,200 | PepsiCo, Inc. (c) | 888,210 | |||||||||
| 1,329,215 | |||||||||||
Biotechnology — 2.2% | |||||||||||
| 41,008 | Amgen, Inc. (a) | 2,801,256 | |||||||||
| 12,900 | MedImmune, Inc. (a) (c) | 417,573 | |||||||||
| 3,218,829 | |||||||||||
Capital Markets — 4.1% | |||||||||||
| 18,400 | Bank of New York Co., Inc. (The) | 724,408 | |||||||||
| 4,000 | Franklin Resources, Inc. | 440,680 | |||||||||
| 28,832 | Morgan Stanley (c) | 2,347,790 | |||||||||
| 29,600 | State Street Corp. (c) | 1,996,224 | |||||||||
| 39,100 | TD AMERITRADE Holding Corp. (c) | 632,638 | |||||||||
| 6,141,740 | |||||||||||
Chemicals — 2.3% | |||||||||||
| 6,200 | Monsanto Co. | 325,686 | |||||||||
| 37,460 | Praxair, Inc. | 2,222,502 | |||||||||
| 17,400 | Rohm & Haas Co. | 889,488 | |||||||||
| 3,437,676 | |||||||||||
Commercial Banks — 4.4% | |||||||||||
| 6,200 | Marshall & Ilsley Corp. | 298,282 | |||||||||
| 13,100 | SunTrust Banks, Inc. | 1,106,295 | |||||||||
| 21,420 | U.S. Bancorp (c) | 775,190 | |||||||||
| 26,000 | Wachovia Corp. | 1,480,700 | |||||||||
| 80,316 | Wells Fargo & Co. | 2,856,037 | |||||||||
| 6,516,504 | |||||||||||
Commercial Services & Supplies — 0.2% | |||||||||||
| 7,500 | Waste Management, Inc. | 275,775 | |||||||||
Communications Equipment — 5.6% | |||||||||||
| 110,200 | Cisco Systems, Inc. (a) | 3,011,766 | |||||||||
| 100,200 | Corning, Inc. (a) (c) | 1,874,742 | |||||||||
| 18,000 | Juniper Networks, Inc. (a) (c) | 340,920 | |||||||||
| 79,000 | Motorola, Inc. | 1,624,240 | |||||||||
| 39,700 | QUALCOMM, Inc. | 1,500,263 | |||||||||
| 8,351,931 | |||||||||||
Computers & Peripherals — 3.6% | |||||||||||
| 9,610 | Apple Computer, Inc. (a) | 815,312 | |||||||||
| 21,900 | Dell, Inc. (a) (c) | 549,471 | |||||||||
| 44,100 | EMC Corp. (a) (c) | 582,120 | |||||||||
| 38,670 | Hewlett-Packard Co. | 1,592,817 | |||||||||
| 17,452 | International Business Machines Corp. | 1,695,462 | |||||||||
| 26,100 | Sun Microsystems, Inc. (a) | 141,462 | |||||||||
| 5,376,644 | |||||||||||
Consumer Finance — 0.6% | |||||||||||
| 13,800 | American Express Co. | 837,246 | |||||||||
Diversified Financial Services — 5.8% | |||||||||||
| 60,637 | Bank of America Corp. | 3,237,410 | |||||||||
| 12,920 | CIT Group, Inc. | 720,548 | |||||||||
| 81,834 | Citigroup, Inc. | 4,558,154 | |||||||||
| 8,516,112 | |||||||||||
Diversified Telecommunication Services — 3.6% | |||||||||||
| 45,038 | AT&T, Inc. (c) | 1,610,109 | |||||||||
| 13,000 | BellSouth Corp. | 612,430 | |||||||||
| 12,900 | Embarq Corp. | 678,024 | |||||||||
| 64,492 | Verizon Communications, Inc. | 2,401,682 | |||||||||
| 5,302,245 | |||||||||||
Electric Utilities — 2.8% | |||||||||||
| 45,400 | Duke Energy Corp. | 1,507,734 | |||||||||
| 37,200 | Edison International | 1,691,856 | |||||||||
| 28,900 | Northeast Utilities (c) | 813,824 | |||||||||
| 4,013,414 | |||||||||||
Energy Equipment & Services — 2.1% | |||||||||||
| 10,200 | Baker Hughes, Inc. | 761,532 | |||||||||
| 32,100 | Schlumberger Ltd. (c) | 2,027,436 | |||||||||
| 7,000 | Weatherford International Ltd. (a) (c) | 292,530 | |||||||||
| 3,081,498 | |||||||||||
Food & Staples Retailing — 3.2% | |||||||||||
| 9,700 | CVS Corp. (c) | 299,827 | |||||||||
| 7,300 | Safeway, Inc. (c) | 252,288 | |||||||||
| 47,200 | SUPERVALU, Inc. (c) | 1,687,400 | |||||||||
| 68,870 | SYSCO Corp. | 2,531,661 | |||||||||
| 4,771,176 | |||||||||||
Food Products — 0.6% | |||||||||||
| 7,700 | General Mills, Inc. | 443,520 | |||||||||
| 8,700 | Wm. Wrigley, Jr., Co. | 449,964 | |||||||||
| 893,484 | |||||||||||
Health Care Equipment & Supplies — 0.5% | |||||||||||
| 13,800 | Medtronic, Inc. (c) | 738,438 | |||||||||
| SHARES | | SECURITY DESCRIPTION | | VALUE($) | |||||||
|---|---|---|---|---|---|---|---|---|---|---|---|
Long-Term Investments — Continued | |||||||||||
Health Care Providers & Services — 1.4% | |||||||||||
| 13,020 | Aetna, Inc. | 562,203 | |||||||||
| 10,300 | Caremark Rx, Inc. (c) | 588,233 | |||||||||
| 7,700 | UnitedHealth Group, Inc. | 413,721 | |||||||||
| 7,020 | WellPoint, Inc. (a) | 552,404 | |||||||||
| 2,116,561 | |||||||||||
Hotels, Restaurants & Leisure — 1.1% | |||||||||||
| 26,400 | Hilton Hotels Corp. | 921,360 | |||||||||
| 11,500 | Starwood Hotels & Resorts Worldwide, Inc. (c) | 718,750 | |||||||||
| 1,640,110 | |||||||||||
Household Products — 2.7% | |||||||||||
| 61,507 | Procter & Gamble Co. | 3,953,055 | |||||||||
Industrial Conglomerates — 5.2% | |||||||||||
| 8,500 | 3M Co. | 662,405 | |||||||||
| 172,975 | General Electric Co. | 6,436,400 | |||||||||
| 21,300 | Tyco International Ltd. (Bermuda) | 647,520 | |||||||||
| 7,746,325 | |||||||||||
Insurance — 4.7% | |||||||||||
| 18,030 | AMBAC Financial Group, Inc. | 1,605,932 | |||||||||
| 290 | Berkshire Hathaway, Inc., Class B (a) (c) | 1,063,140 | |||||||||
| 15,300 | Genworth Financial, Inc. | 523,413 | |||||||||
| 16,470 | Hartford Financial Services Group, Inc. | 1,536,816 | |||||||||
| 36,220 | RenaissanceRe Holdings Ltd. (Bermuda) | 2,173,200 | |||||||||
| 6,902,501 | |||||||||||
Internet Software & Services — 1.8% | |||||||||||
| 7,300 | eBay, Inc. (a) | 219,511 | |||||||||
| 3,070 | Google, Inc., Class A (a) | 1,413,674 | |||||||||
| 42,100 | Yahoo!, Inc. (a) (c) | 1,075,234 | |||||||||
| 2,708,419 | |||||||||||
IT Services — 0.5% | |||||||||||
| 8,400 | Computer Sciences Corp. (a) | 448,308 | |||||||||
| 9,462 | Sabre Holdings Corp., Class A | 301,743 | |||||||||
| 750,051 | |||||||||||
Machinery — 1.3% | |||||||||||
| 7,395 | AGCO Corp. (a) (c) | 228,801 | |||||||||
| 6,100 | Danaher Corp. (c) | 441,884 | |||||||||
| 9,100 | Deere & Co. (c) | 865,137 | |||||||||
| 7,300 | Joy Global, Inc. (c) | 352,882 | |||||||||
| 1,888,704 | |||||||||||
Media — 3.3% | |||||||||||
| 18,580 | CBS Corp., Class B (c) | 579,325 | |||||||||
| 22,700 | Comcast Corp., Class A (a) | 960,891 | |||||||||
| 4,900 | Gannett Co., Inc. | 296,254 | |||||||||
| 68,260 | News Corp., Class A | 1,466,225 | |||||||||
| 21,900 | Time Warner, Inc. | 476,982 | |||||||||
| 11,280 | Viacom, Inc., Class B (a) | 462,818 | |||||||||
| 17,600 | Walt Disney Co. | 603,152 | |||||||||
| 4,845,647 | |||||||||||
Metals & Mining — 0.6% | |||||||||||
| 15,100 | Alcan, Inc. (Canada) | 735,974 | |||||||||
| 2,000 | United States Steel Corp. | 146,280 | |||||||||
| 882,254 | |||||||||||
Multi-Utilities — 0.9% | |||||||||||
| 13,000 | DTE Energy Co. (c) | 629,330 | |||||||||
| 32,600 | Xcel Energy, Inc. (c) | 751,756 | |||||||||
| 1,381,086 | |||||||||||
Multiline Retail — 0.6% | |||||||||||
| 12,380 | Kohl’s Corp. (a) (c) | 847,163 | |||||||||
Oil, Gas & Consumable Fuels — 7.2% | |||||||||||
| 28,400 | Apache Corp. | 1,888,884 | |||||||||
| 12,000 | Devon Energy Corp. | 804,960 | |||||||||
| 4,600 | EOG Resources, Inc. (c) | 287,270 | |||||||||
| 62,409 | Exxon Mobil Corp. | 4,782,402 | |||||||||
| 52,200 | Occidental Petroleum Corp. | 2,548,926 | |||||||||
| 8,900 | XTO Energy, Inc. (c) | 418,745 | |||||||||
| 10,731,187 | |||||||||||
Personal Products — 0.4% | |||||||||||
| 19,179 | Avon Products, Inc. (c) | 633,674 | |||||||||
Pharmaceuticals — 6.8% | |||||||||||
| 52,200 | Abbott Laboratories | 2,542,662 | |||||||||
| 4,600 | Eli Lilly & Co. | 239,660 | |||||||||
| 10,800 | Johnson & Johnson | 713,016 | |||||||||
| 39,700 | Merck & Co., Inc. | 1,730,920 | |||||||||
| 85,300 | Schering-Plough Corp. (c) | 2,016,492 | |||||||||
| 7,260 | Sepracor, Inc. (a) (c) | 447,071 | |||||||||
| 45,450 | Wyeth | 2,314,314 | |||||||||
| 10,004,135 | |||||||||||
Real Estate Investment Trusts (REITs) — 0.8% | |||||||||||
| 12,353 | Apartment Investment & Management Co. (c) | 692,015 | |||||||||
| 18,200 | Host Hotels & Resorts, Inc. (c) | 446,810 | |||||||||
| 1,138,825 | |||||||||||
Road & Rail — 1.9% | |||||||||||
| 9,900 | CSX Corp. (c) | 340,857 | |||||||||
| 48,900 | Norfolk Southern Corp. (c) | 2,459,181 | |||||||||
| 2,800,038 | |||||||||||
AS OF DECEMBER 31, 2006 (continued)
| SHARES | | SECURITY DESCRIPTION | | VALUE($) | |||||||
|---|---|---|---|---|---|---|---|---|---|---|---|
Long-Term Investments — Continued | |||||||||||
Semiconductors & Semiconductor Equipment — 2.2% | |||||||||||
| 25,400 | Altera Corp. (a) (c) | 499,872 | |||||||||
| 5,600 | KLA-Tencor Corp. (c) | 278,600 | |||||||||
| 53,300 | Linear Technology Corp. | 1,616,056 | |||||||||
| 36,100 | Xilinx, Inc. | 859,541 | |||||||||
| 3,254,069 | |||||||||||
Software — 3.5% | |||||||||||
| 148,205 | Microsoft Corp. | 4,425,401 | |||||||||
| 46,240 | Oracle Corp. (a) | 792,554 | |||||||||
| 5,217,955 | |||||||||||
Specialty Retail — 2.6% | |||||||||||
| 12,447 | Advance Auto Parts, Inc. | 442,615 | |||||||||
| 125,720 | Staples, Inc. | 3,356,724 | |||||||||
| 3,799,339 | |||||||||||
Thrifts & Mortgage Finance — 0.3% | |||||||||||
| 9,900 | Washington Mutual, Inc. | 450,351 | |||||||||
Tobacco — 2.6% | |||||||||||
| 45,658 | Altria Group, Inc. | 3,918,369 | |||||||||
Wireless Telecommunication Services — 0.8% | |||||||||||
| 13,400 | Crown Castle International Corp. (a) (c) | 432,820 | |||||||||
| 39,938 | Sprint Nextel Corp. (c) | 754,429 | |||||||||
| 1,187,249 | |||||||||||
| Total Common Stocks (Cost $134,269,845) | 148,329,150 | ||||||||||
Short-Term Investment — 0.3% | |||||||||||
Investment Company — 0.3% | |||||||||||
| 540,813 | JPMorgan Liquid Assets Money Market Fund (b) (m) (Cost $540,813) | 540,813 | |||||||||
| PRINCIPAL AMOUNT($) | | SECURITY DESCRIPTION | | VALUE ($) | |||||||
|---|---|---|---|---|---|---|---|---|---|---|---|
Investments of Cash Collateral for Securities on Loan — 11.2% | |||||||||||
Certificate of Deposit — 0.7% | |||||||||||
| 999,738 | Societe Generale, New York, FRN, 5.34%, 06/20/07 | 999,738 | |||||||||
Repurchase Agreements — 10.5% | |||||||||||
| 3,586,378 | Banc of America Securities LLC, 5.32%, dated 12/29/06, due 01/02/07, repurchase price $3,588,498, collateralized by U.S. Government Agency Mortgages | 3,586,378 | |||||||||
| 3,000,000 | Bear Stearns Cos., Inc., 5.31%, dated 12/29/06, due 01/02/07, repurchase price $3,001,770, collateralized by U.S. Government Agency Mortgages | 3,000,000 | |||||||||
| 3,000,000 | HSBC Securities, Inc., 5.28%, dated 12/29/06, due 01/02/07, repurchase price $3,001,760, collateralized by U.S. Government Agency Mortgages | 3,000,000 | |||||||||
| 3,000,000 | Lehman Brothers, Inc., 5.31%, dated 12/29/06, due 01/02/07, repurchase price $3,001,770, collateralized by U.S. Government Agency Mortgages | 3,000,000 | |||||||||
| 3,000,000 | UBS Securities LLC, 5.32%, dated 12/29/06, due 01/02/07, price $3,001,773, collateralized by U.S. Government Agency Mortgages | 3,000,000 | |||||||||
| 15,586,378 | |||||||||||
| Total Investments of Cash Collateral for Securities on Loan (Cost $16,586,116) | 16,586,116 | ||||||||||
Total Investments — 111.7% (Cost $151,396,774) | 165,456,079 | ||||||||||
Liabilities in Excess of Other Assets — (11.7)% | (17,364,481 | ) | |||||||||
NET ASSETS — 100.0% | $ | 148,091,598 | |||||||||
| (a) | — | Non-income producing security. |
| (b) | — | Investment in affiliate. Money market fund registered under the Investment Company Act of 1940, as amended, and advised by JPMorgan Investment Advisors Inc. |
| (c) | — | Security, or a portion of the security, has been delivered to a counterparty as part of a security lending transaction. |
| (m) | — | All or a portion of this security is segregated for current or potential holdings of futures, swaps, options, TBA, when-issued securities, delayed delivery securities, and reverse repurchase agreements. |
| FRN | — | Floating Rate Note. The rate shown is the rate in effect as of December 31, 2006. |
AS OF DECEMBER 31, 2006
| | Diversified Equity Portfolio | |||||
|---|---|---|---|---|---|---|
ASSETS: | ||||||
| Investments in non-affiliates, at value | $ | 164,915,266 | ||||
| Investments in affiliates, at value | 540,813 | |||||
| Total investment securities, at value | 165,456,079 | |||||
| Cash | 21,982 | |||||
| Receivables: | ||||||
| Portfolio shares sold | 37,951 | |||||
| Interest and dividends | 236,697 | |||||
| Total Assets | 165,752,709 | |||||
LIABILITIES: | ||||||
| Payables: | ||||||
| Investment securities purchased | 349,517 | |||||
| Collateral for securities lending program | 16,586,116 | |||||
| Portfolio shares redeemed | 599,208 | |||||
| Accrued liabilities: | ||||||
| Investment advisory fees | 67,149 | |||||
| Administration fees | 11,150 | |||||
| Custodian and accounting fees | 4,924 | |||||
| Distribution fees | 3 | |||||
| Trustees’ and Officers’ fees | 229 | |||||
| Other | 42,815 | |||||
| Total Liabilities | 17,661,111 | |||||
| Net Assets | $ | 148,091,598 | ||||
NET ASSETS: | ||||||
| Paid in capital | $ | 127,609,447 | ||||
| Accumulated undistributed (distributions in excess of) net investment income | 1,544,948 | |||||
| Accumulated net realized gains (losses) | 4,877,898 | |||||
| Net unrealized appreciation (depreciation) | 14,059,305 | |||||
| Total Net Assets | $ | 148,091,598 | ||||
| Net Assets: | ||||||
| Class 1 | $ | 148,074,863 | ||||
| Class 2 | 16,735 | |||||
| Total | $ | 148,091,598 | ||||
| Outstanding units of beneficial interest (shares) (unlimited amount authorized, no par value): | ||||||
| Class 1 | 8,410,977 | |||||
| Class 2 | 952 | |||||
| Net asset value, offering and redemption price per share: | ||||||
| Class 1 | $ | 17.60 | ||||
| Class 2 | 17.58 | |||||
| Cost of investments | $ | 151,396,774 | ||||
| Market value of securities on loan | 16,206,023 | |||||
FOR THE YEAR ENDED DECEMBER 31, 2006
| | Diversified Equity Portfolio | |||||
|---|---|---|---|---|---|---|
INVESTMENT INCOME: | ||||||
| Dividend income | $ | 2,730,603 | ||||
| Dividend income from affiliates (a) | 59,021 | |||||
| Income from securities lending (net) | 13,528 | |||||
| Foreign taxes withheld | (2,224 | ) | ||||
| Total investment income | 2,800,928 | |||||
EXPENSES: | ||||||
| Investment advisory fees | 907,920 | |||||
| Administration fees | 171,637 | |||||
| Distribution fees — Class 2 | 15 | |||||
| Custodian and accounting fees | 42,186 | |||||
| Professional fees | 55,061 | |||||
| Trustees’ and Officers’ fees | 2,208 | |||||
| Transfer agent fees | 2,364 | |||||
| Printing and mailing costs | 84,614 | |||||
| Other | 17,505 | |||||
| Total expenses | 1,283,510 | |||||
| Less amounts waived | (32,856 | ) | ||||
| Less earnings credits | (48 | ) | ||||
| Net expenses | 1,250,606 | |||||
| Net investment income (loss) | 1,550,322 | |||||
REALIZED/UNREALIZED GAINS (LOSSES): | ||||||
| Net realized gain (loss) on transactions from investments | 15,873,849 | |||||
| Change in net unrealized appreciation (depreciation) of investments | 4,700,047 | |||||
| Net realized/unrealized gains (losses) | 20,573,896 | |||||
| Change in net assets resulting from operations | $ | 22,124,218 | ||||
| (a) | Includes reimbursements of investment advisory, administration and shareholder servicing fees. See Fees and Other Transactions with Affiliates in the Notes to Financial Statements. |
FOR THE PERIODS INDICATED
| Diversified Equity Portfolio | |||||||||||
|---|---|---|---|---|---|---|---|---|---|---|---|
| | Year Ended 12/31/2006 | | Year Ended 12/31/2005 | ||||||||
CHANGE IN NET ASSETS RESULTING FROM OPERATIONS: | |||||||||||
| Net investment income (loss) | $ | 1,550,322 | $ | 1,258,430 | |||||||
| Net realized gain (loss) | 15,873,849 | 1,289,618 | |||||||||
| Change in net unrealized appreciation (depreciation) | 4,700,047 | 528,086 | |||||||||
| Change in net assets resulting from operations | 22,124,218 | 3,076,134 | |||||||||
DISTRIBUTIONS TO SHAREHOLDERS: | |||||||||||
Class 1 | |||||||||||
| From net investment income | (1,258,754 | ) | (1,655,906 | ) | |||||||
CAPITAL TRANSACTIONS: | |||||||||||
| Change in net assets from capital transactions | (23,906,621 | ) | (28,410,346 | ) | |||||||
NET ASSETS: | |||||||||||
| Change in net assets | (3,041,157 | ) | (26,990,118 | ) | |||||||
| Beginning of period | 151,132,755 | 178,122,873 | |||||||||
| End of period | $ | 148,091,598 | $ | 151,132,755 | |||||||
| Accumulated undistributed (distributions in excess of) net investment income | $ | 1,544,948 | $ | 1,254,721 | |||||||
CAPITAL TRANSACTIONS: | |||||||||||
Class 1 | |||||||||||
| Proceeds from shares issued | $ | 5,342,152 | $ | 10,861,692 | |||||||
| Dividends reinvested | 1,258,754 | 1,655,906 | |||||||||
| Cost of shares redeemed | (30,522,602 | ) | (40,927,944 | ) | |||||||
| Change in net assets from Class 1 capital transactions | $ | (23,921,696 | ) | $ | (28,410,346 | ) | |||||
Class 2 (a) | |||||||||||
| Proceeds from shares issued | $ | 15,075 | $ | — | |||||||
| Change in net assets from Class 2 capital transactions | $ | 15,075 | $ | — | |||||||
SHARE TRANSACTIONS: | |||||||||||
Class 1 | |||||||||||
| Issued | 335,901 | 737,627 | |||||||||
| Reinvested | 79,719 | 114,516 | |||||||||
| Redeemed | (1,897,498 | ) | (2,773,115 | ) | |||||||
| Change in Class 1 Shares | (1,481,878 | ) | (1,920,972 | ) | |||||||
Class 2 (a) | |||||||||||
| Issued | 952 | — | |||||||||
| Change in Class 2 Shares | 952 | — | |||||||||
| (a) | Commencement of offering class of shares effective August 16, 2006. |
FOR THE PERIODS INDICATED
| | | | | Per share operating performance | | |||||||||||||||||||||||||
|---|---|---|---|---|---|---|---|---|---|---|---|---|---|---|---|---|---|---|---|---|---|---|---|---|---|---|---|---|---|---|
| Investment operations | Distributions | |||||||||||||||||||||||||||||
| | Net asset value, beginning of period | | Net investment income (loss) | | Net realized and unrealized gains (losses) on investments | | Total from investment operations | | Net investment income | | Total distributions | | ||||||||||||||||||
Class 1 | ||||||||||||||||||||||||||||||
| Year Ended December 31, 2006 | $ | 15.28 | $ | 0.19 | $ | 2.26 | $ | 2.45 | $ | (0.13 | ) | $ | (0.13 | ) | ||||||||||||||||
| Year Ended December 31, 2005 | 15.08 | 0.13 | 0.21 | 0.34 | (0.14 | ) | (0.14 | ) | ||||||||||||||||||||||
| Year Ended December 31, 2004 | 14.19 | 0.14 | 0.85 | 0.99 | (0.10 | ) | (0.10 | ) | ||||||||||||||||||||||
| Year Ended December 31, 2003 | 11.35 | 0.10 | 2.82 | 2.92 | (0.08 | ) | (0.08 | ) | ||||||||||||||||||||||
| Year Ended December 31, 2002 | 14.89 | 0.08 | (3.62 | ) | (3.54 | ) | — | — | ||||||||||||||||||||||
Class 2 | ||||||||||||||||||||||||||||||
| August 16, 2006 (d) to December 31, 2006 | 15.84 | 0.05 | 1.69 | 1.74 | — | — | ||||||||||||||||||||||||
| (a) | Annualized for periods less than one year. |
| (b) | Not annualized for periods less than one year. |
| (c) | Includes adjustments in accordance with accounting principles generally accepted in the United States of America and as such, the net asset value for financial reporting purposes and the returns based upon those net asset values may differ from the net asset value and returns for shareholder transactions. |
| (d) | Commencement of offering of class of shares. |
| | | Ratios/Supplemental data | | ||||||||||||||||||||||||
|---|---|---|---|---|---|---|---|---|---|---|---|---|---|---|---|---|---|---|---|---|---|---|---|---|---|---|---|
| Ratios to average net assets (a) | |||||||||||||||||||||||||||
| Net asset value, end of period | | Total return (b)(c) | | Net assets end of period (000’s) | | Net expenses | | Net investment income (loss) | | Expenses without waivers, reimbursements and earnings credits | | Portfolio turnover rate (b) | |||||||||||||||
| $17.60 | 16.15 | % | $ | 148,075 | 0.85 | % | 1.05 | % | 0.87 | % | 129 | % | |||||||||||||||
| 15.28 | 2.33 | 151,133 | 0.94 | 0.78 | 0.95 | 74 | |||||||||||||||||||||
| 15.08 | 7.05 | 178,123 | 0.91 | 1.01 | 0.92 | 84 | |||||||||||||||||||||
| 14.19 | 25.93 | 161,287 | 0.91 | 0.85 | 0.93 | 32 | |||||||||||||||||||||
| 11.35 | (23.77 | ) | 116,329 | 0.92 | 0.68 | 0.93 | 18 | ||||||||||||||||||||
| 17.58 | 10.98 | 17 | 1.05 | 0.82 | 1.07 | 129 | |||||||||||||||||||||
AS OF DECEMBER 31, 2006
| | Classes Offered | |||||
|---|---|---|---|---|---|---|
| Diversified Equity Portfolio | Class 1 and Class 2 | |||||
During the term of the loan, the Portfolio receives payments from borrowers equivalent to the dividends and interest that would have been earned on securities lent while simultaneously seeking to earn income on the investment of cash collateral in accordance with investment guidelines contained in the Securities Lending Agreement. For loans secured by cash, the Portfolio retains the interest on cash collateral investments but is required to pay the borrower a portion of such interest for the use of the cash collateral. For loans secured by U.S. government securities, the borrower pays a borrower fee to the lending agent on behalf of the Portfolio. The net income earned on the securities lending (after payment of rebates and the lending agent’s fee) is included in the Statement of Operations as Income from securities lending (net). Information on the investment of cash collateral is shown in the Schedule of Portfolio Investments.
| | Lending Agent Fees Paid | | Market Value of Collateral | | Market Value of Loaned Securities | |||||||||
|---|---|---|---|---|---|---|---|---|---|---|---|---|---|---|
| $ | 4,640 | $ | 16,586,116 | $ | 16,206,023 | |||||||||
AS OF DECEMBER 31, 2006 (continued)
| | Paid-in-capital | | Accumulated Undistributed (Overdistributed) Net Investment Income | | Accumulated Net Realized Gain (Loss) on Investments | |||||||||
|---|---|---|---|---|---|---|---|---|---|---|---|---|---|---|
| $ | (1,424 | ) | $ | (1,341 | ) | $ | 2,765 | |||||||
credits earned by the Portfolio, based on uninvested cash balances held by the custodian. Such earnings credits are presented separately in the Statement of Operations.
| | Class 1 | | Class 2 | |||||||
|---|---|---|---|---|---|---|---|---|---|---|
| 0.80 | %* | 1.05 | % | |||||||
| * | 0.95% prior to May 1, 2006 |
| | Purchases (excluding U.S. Government) | | Sales (excluding U.S. Government) | |||||||
|---|---|---|---|---|---|---|---|---|---|---|
| $ | 188,944,236 | $ | 210,766,803 | |||||||
| | Aggregate Cost | | Gross Unrealized Appreciation | | Gross Unrealized Depreciation | | Net Unrealized Appreciation (Depreciation) | |||||||||||
|---|---|---|---|---|---|---|---|---|---|---|---|---|---|---|---|---|---|---|
| $ | 153,088,089 | $ | 13,090,617 | $ | 722,627 | $ | 12,367,990 | |||||||||||
AS OF DECEMBER 31, 2006 (continued)
| Total Distributions Paid From: | ||||||||||
|---|---|---|---|---|---|---|---|---|---|---|
| | Ordinary Income | | Total Distributions Paid | |||||||
| $ | 1,258,754 | $ | 1,258,754 | |||||||
| Total Distributions Paid From: | ||||||||||
|---|---|---|---|---|---|---|---|---|---|---|
| | Ordinary Income | | Total Distributions Paid | |||||||
| $ | 1,655,906 | $ | 1,655,906 | |||||||
| | Current Distributable Ordinary Income | | Current Distributable Long-Term Capital Gain or (Tax Basis Capital Loss Carryover) | | Unrealized Appreciation (Depreciation) | |||||||||
|---|---|---|---|---|---|---|---|---|---|---|---|---|---|---|
| $ | 2,990,445 | $ | 5,126,377 | $ | 12,367,990 | |||||||||
JPMorgan Insurance Trust Diversified Equity Portfolio:
New York, New York
February 15, 2007
(Unaudited)
| Name (Year of Birth); Positions With the Portfolio | | Principal Occupations During Past 5 Years | | Number of Portfolios in Fund Complex Overseen by Trustee (1) | | Other Directorships Held Outside Fund Complex | |||||||||
|---|---|---|---|---|---|---|---|---|---|---|---|---|---|---|---|
Independent Trustees | |||||||||||||||
| William J. Armstrong (1941); Trustee since 2005; Trustee of heritage JPMorgan Funds since 1987. | Retired; CFO and Consultant, EduNeering, Inc. (internet business education supplier) (2000–2001); Vice President and Treasurer, Ingersoll–Rand Company (manufacturer of industrial equipment) (1972–2000). | 131 | None. | ||||||||||||
| Roland R. Eppley, Jr. (1932); Trustee since 2005; Trustee of heritage JPMorgan Funds since 1989. | Retired; President and Chief Executive Officer, Eastern States Bankcard (1971–1988). | 131 | None. | ||||||||||||
| John F. Finn (1947); Trustee since 2005; Trustee of heritage One Group Mutual Funds since 1998. | President and Chief Executive Officer, Gardner, Inc. (wholesale distributor to outdoor power equipment industry) (1979–present). | 131 | Director, Cardinal Health, Inc (CAH) (1994–present); Chairman, The Columbus Association of the Performing Arts (CAPA) (2003–present). | ||||||||||||
| Dr. Matthew Goldstein (1941); Trustee since 2005; Trustee of heritage JPMorgan Funds since 2003. | Chancellor, City University of New York (1999–present); President, Adelphi University (New York) (1998–1999). | 131 | Director, Albert Einstein School of Medicine (1998–present); Director, New Plan Excel Realty Trust, Inc. (real estate investment trust) (2000–present); Director, Lincoln Center Institute for the Arts in Education (1999–present). | ||||||||||||
| Robert J. Higgins (1945); Trustee since 2005; Trustee of heritage JPMorgan Funds since 2002. | Retired; Director of Administration of the State of Rhode Island (2003–2004); President — Consumer Banking and Investment Services, Fleet Boston Financial (1971–2001). | 131 | None. | ||||||||||||
| Peter C. Marshall (1942); Trustee since 2005; Trustee of heritage One Group Mutual Funds since 1994. | Self-employed business consultant (2001–present); Senior Vice President, W.D. Hoard, Inc. (corporate parent of DCI Marketing, Inc.) (2000–2002); President, DCI Marketing, Inc. (1992–2000). | 131 | None. | ||||||||||||
| Marilyn McCoy (1948); Trustee since 2005; Trustee of heritage One Group Mutual Funds since 1999. | Vice President of Administration and Planning, Northwestern University (1985–present). | 131 | Trustee, Mather LifeWays (1994–present); Trustee, Carleton College (2003–present). | ||||||||||||
| William G. Morton, Jr. (1937); Trustee since 2005; Trustee of heritage JPMorgan Funds since 2003. | Retired; Chairman Emeritus (2001–2002), and Chairman and Chief Executive Officer, Boston Stock Exchange (1985–2001). | 131 | Director, Radio Shack Corporation (electronics) (1987–present); Director, The National Football Foundation and College Hall of Fame (1994–present); Trustee, Stratton Mountain School (2001–present). | ||||||||||||
| Name (Year of Birth); Positions With the Portfolio | | Principal Occupations During Past 5 Years | | Number of Portfolios in Fund Complex Overseen by Trustee (1) | | Other Directorships Held Outside Fund Complex | |||||||||
|---|---|---|---|---|---|---|---|---|---|---|---|---|---|---|---|
Independent Trustees (continued) | |||||||||||||||
| Robert A. Oden, Jr. (1946); Trustee since 2005; Trustee of heritage One Group Mutual Funds since 1997. | President, Carleton College (2002–present); President, Kenyon College (1995–2002). | 131 | Director, American University in Cairo. | ||||||||||||
| Fergus Reid, III (1932); Trustee (Chairman) since 2005; Trustee (Chairman) of heritage JPMorgan Funds since 1987. | Chairman, Lumelite Corporation (plastics manufacturing) (2003–present); Chairman and Chief Executive Officer, Lumelite Corporation (1985–2002). | 131 | Trustee, Morgan Stanley Funds (196 portfolios) (1995–present). | ||||||||||||
| Frederick W. Ruebeck (1939); Trustee since 2005; Trustee of heritage One Group Mutual Funds since 1994. | Advisor, Jerome P. Green & Associates, LLC (broker-dealer) (2000–present); Chief Investment Officer, Wabash College (2004–present); self-employed consultant (2000–present); Director of Investments, Eli Lilly and Company (1988–1999). | 131 | Trustee, Wabash College (1988–present); Chairman, Indianapolis Symphony Orchestra Foundation (1994–present). | ||||||||||||
| James J. Schonbachler (1943); Trustee since 2005; Trustee of heritage JPMorgan Funds since 2001. | Retired; Managing Director of Bankers Trust Company (financial services) (1968–1998). | 131 | None. | ||||||||||||
Interested Trustee | |||||||||||||||
| Leonard M. Spalding, Jr.* (1935); Trustee since 2005; Trustee of heritage JPMorgan Funds since 1998. | Retired; Chief Executive Officer, Chase Mutual Funds (investment company) (1989–1998); President and Chief Executive Officer, Vista Capital Management (investment management) (1990–1998); Chief Investment Executive, Chase Manhattan Private Bank (investment management) (1990–1998). | 131 | Director, Glenview Trust Company, LLC (2001–present); Trustee, St. Catherine College (1998–present); Trustee, Bellarmine University (2000–present); Director, Springfield-Washington County Economic Development Authority (1997–present); Trustee, Marion and Washington County, Kentucky Airport Board (1998–present); Trustee, Catholic Education Foundation (2005–present). | ||||||||||||
| (1) | A Fund Complex means two or more registered investment companies that hold themselves out to investors as related companies for purposes of investment and investor services or have a common investment adviser or have an investment adviser that is an affiliated person of the investment adviser of any of the other registered investment companies. The JPMorgan Funds Complex for which the Board of Trustees serves currently includes eight registered investment companies (131 funds). |
| * | Mr. Spalding is deemed to be an “interested person” due to his ownership of JPMorgan Chase stock. |
(Unaudited)
| Name (Year of Birth), Positions Held with the Trust | | Principal Occupations During Past 5 Years | ||||
|---|---|---|---|---|---|---|
| George C.W. Gatch (1962), President since 2005 | Managing Director, J.P. Morgan Investment Management Inc.; Director and President, JPMorgan Distribution Services, Inc. and JPMorgan Funds Management, Inc. since 2005. Mr. Gatch is CEO and President of the JPMorgan Funds. Mr. Gatch has been an employee of JPMorgan since 1986 and has held positions such as President and CEO of DKB Morgan, a Japanese mutual fund company, which was a joint venture between J.P. Morgan and Dai-Ichi Kangyo Bank, as well as positions in business management, marketing and sales. | |||||
| Robert L. Young (1963), Senior Vice President since 2005* | Director and Vice President, JPMorgan Distribution Services, Inc. and JPMorgan Funds Management, Inc.; Chief Operating Officer, JPMorgan Funds since 2005, and One Group Mutual Funds from 2001 until 2005. Mr. Young was Vice President and Treasurer, JPMorgan Funds Management, Inc. (formerly One Group Administrative Services) and Vice President and Treasurer, JPMorgan Distribution Services, Inc. (formerly One Group Dealer Services, Inc.) from 1999 to 2005. | |||||
| Patricia A. Maleski (1960), Vice President and Chief Administrative Officer since 2005 | Managing Director, JPMorgan Funds Management, Inc.; previously, Treasurer, JPMorgan Funds and Head of Funds Administration and Board Liaison. Ms. Maleski was Vice President of Finance for the Pierpont Group, Inc. from 1996–2001, an independent company owned by the Board of Directors/Trustees of the JPMorgan Funds, prior to joining JPMorgan Chase & Co. in 2001. | |||||
| Stephanie J. Dorsey (1969), Treasurer since 2005* | Vice President, JPMorgan Funds Management, Inc.; Director of Mutual Fund Administration, JPMorgan Funds Management, Inc. (formerly One Group Administrative Services), from 2004 to 2005; Ms. Dorsey worked for JPMorgan Chase & Co., (formerly Bank One Corporation) from 2003 to 2004; prior to joining Bank One Corporation, she was a Senior Manager specializing in Financial Services audits at PricewaterhouseCoopers LLP from 1992 through 2002. | |||||
| Stephen M. Ungerman (1953), Chief Compliance Officer since 2005 | Senior Vice President, JPMorgan Chase & Co.; Mr. Ungerman was head of Fund Administration — Pooled Vehicles from 2000 to 2004. Mr. Ungerman held a number of positions in Prudential Financial’s asset management business prior to 2000. | |||||
| Paul L. Gulinello (1950), AML Compliance Officer since 2005 | Vice President and Anti Money Laundering Compliance Officer for JPMorgan Asset Management Americas, additionally responsible for personal trading and compliance testing since 2004; Treasury Services Operating Risk Management and Compliance Executive supporting all JPMorgan Treasury Services business units from July 2000 to 2004. | |||||
| Stephen M. Benham (1959), Secretary since 2005 | Vice President and Assistant General Counsel, JPMorgan Chase & Co. since 2004; Vice President (Legal Advisory) of Merrill Lynch Investment Managers, L.P. from 2000 to 2004. | |||||
| Elizabeth A. Davin (1964), Assistant Secretary since 2005* | Vice President and Assistant General Counsel, JPMorgan Chase & Co. since 2005; Senior Counsel, JPMorgan Chase & Co. (formerly Bank One Corporation) from 2004 to 2005; Assistant General Counsel and Associate General Counsel and Vice President, Gartmore Global Investments, Inc. from 1999 to 2004. | |||||
| Jessica K. Ditullio (1962), Assistant Secretary since 2005* | Vice President and Assistant General Counsel, JPMorgan Chase & Co. since 2005; Ms. Ditullio has served as an attorney with various titles for JPMorgan Chase & Co. (formerly Bank One Corporation) since 1990. | |||||
| Nancy E. Fields (1949), Assistant Secretary since 2005* | Vice President, JPMorgan Funds Management, Inc. and JPMorgan Distribution Services, Inc.; From 1999 to 2005, Director, Mutual Fund Administration, JPMorgan Funds Management, Inc. (formerly One Group Administrative Services) and Senior Project Manager, Mutual Funds, JPMorgan Distribution Services, Inc. (formerly One Group Dealer Services, Inc.). | |||||
| Michael C. Raczynski (1975), Assistant Secretary since 2006 | Vice President and Assistant General Counsel, JPMorgan Chase & Co. since 2006; Associate, Stroock & Stroock & Lavan LLP from 2001 to 2006. | |||||
| Ellen W. O’Brien (1957), Assistant Secretary since 2005** | Assistant Vice President, JPMorgan Investor Services, Co., responsible for Blue Sky registration. Ms. O’Brien has served in this capacity since joining the firm in 1991. | |||||
| Name (Year of Birth), Positions Held with the Trust | | Principal Occupations During Past 5 Years | ||||
|---|---|---|---|---|---|---|
| Laura S. Melman (1966) Assistant Treasurer since 2006 | Vice President, JPMorgan Funds Management, Inc. since August, 2006, responsible for Taxation; Vice President of Structured Products at The Bank of New York Co., Inc. from 2001 to 2006. | |||||
| Arthur A. Jensen (1966), Assistant Treasurer since 2005* | Vice President, JPMorgan Funds Management, Inc. since April 2005; formerly, Vice President of Financial Services of BISYS Fund Services, Inc. from 2001 to 2005; Mr. Jensen was Section Manager at Northern Trust Company and Accounting Supervisor at Allstate Insurance Company prior to 2001. | |||||
| Jeffrey D. House (1972) Assistant Treasurer since 2006* | Vice President, JPMorgan Funds Management, Inc. since July 2006; formerly, Senior Manager of Financial Services at BISYS Fund Services, Inc. from 1995 to 2006. | |||||
| * | The contact address for the officer is 1111 Polaris Parkway, Columbus, OH 43271. |
| ** | The contact address for the officer is 73 Tremont Street, Floor 1, Boston MA 02108. |
(Unaudited)
December 31, 2006
| | Beginning Account Value, July 1, 2006 | | Ending Account Value, December 31, 2006 | | Expenses Paid During July 1, 2006 to December 31, 2006 | | Annualized Expense Ratio | |||||||||||
|---|---|---|---|---|---|---|---|---|---|---|---|---|---|---|---|---|---|---|
Class 1 | ||||||||||||||||||
| Actual* | $ | 1,000.00 | $ | 1,139.90 | $ | 4.31 | 0.80 | % | ||||||||||
| Hypothetical* | 1,000.00 | 1,021.17 | 4.08 | 0.80 | ||||||||||||||
Class 2 | ||||||||||||||||||
| Actual** | 1,000.00 | 1,109.80 | 4.19 | 1.05 | ||||||||||||||
| Hypothetical* | 1,000.00 | 1,019.91 | 5.35 | 1.05 | ||||||||||||||
| * | Expenses are equal to the Portfolio’s annualized expense ratio, multiplied by the average account value over the period, multiplied by 184/365 (to reflect the one-half year period). |
| ** | Expenses are equal to the Portfolio’s annualized expense ratio, multiplied by the average account value over the period, multiplied by 138/365 (to reflect the actual period). |
(Unaudited)
(Unaudited) (continued)
of providing such services. Expenses include direct and indirect costs and are calculated using an allocation methodology developed by the Advisor. The Trustees also recognized that it is difficult to make comparisons of profitability from fund investment advisory contracts because comparative information is not generally publicly available and is affected by numerous factors, including the structure of the particular Advisor, the types of funds it manages, its business mix, numerous assumptions regarding allocations and the fact that publicly-traded fund managers’ operating profits and net income are net of distribution and marketing expenses. Based on their review, the Trustees concluded that the profitability to the Advisor of each of the Investment Advisory Agreements was not unreasonable in light of the services and benefits provided to each Fund.
also noted changes to the investment objective and processes which were approved by Trustees and submitted for shareholder approval at an upcoming shareholder meeting. The Trustees requested the Portfolio’s Advisor to similarly review the Portfolio with members of the Equity subcommittee at each of their regular meetings over the course of the year.
(Unaudited)
(Unaudited)
| | Votes For | | Votes Against | | Abstentions | |||||||||
|---|---|---|---|---|---|---|---|---|---|---|---|---|---|---|
| 7,940,041.682 | 711,744.280 | 719,809.367 | ||||||||||||
© JPMorgan Chase & Co., 2007 All rights reserved. December 2006. | AN-JPMITDEP-1206 |
This material must be preceded or accompanied by a current prospectus.
| President’s Letter | 1 | |||||||||
| Portfolio Commentary: | ||||||||||
| JPMorgan Insurance Trust Diversified Mid Cap Growth Portfolio | 2 | |||||||||
| Schedule of Portfolio Investments | 4 | |||||||||
| Financial Statements | 7 | |||||||||
| Financial Highlights | 10 | |||||||||
| Notes to Financial Statements | 12 | |||||||||
| Report of Independent Registered Public Accounting Firm | 17 | |||||||||
| Trustees | 18 | |||||||||
| Officers | 20 | |||||||||
| Schedule of Shareholder Expenses | 22 | |||||||||
| Board Approval of Investment Advisory Agreement | 23 | |||||||||
| Tax Letter | 26 | |||||||||
| • | Fed’s tightening cycle gained traction in the economy |
| • | Markets buoyed by falling oil prices, solid corporate profits and a robust mergers-and-acquisitions environment |
| • | Home sales stabilized toward year-end but were offset somewhat by amount of unsold homes |
| • | Consumer spending likely to moderate as job gains decrease |
JANUARY 5, 2007 (Unaudited)
| “We expect economic growth to remain subdued over the next few quarters, keeping the pressure off inflation.” | |||
President
JPMorgan Funds
AS OF DECEMBER 31, 2006 (Unaudited)
| Portfolio Inception | August 1, 1994 | |||||
| Fiscal Year End | December 31 | |||||
| Net Assets as of 12/31/2006 | $164,971,739 | |||||
| Primary Benchmark | Russell Midcap Growth Index | |||||
Q: | HOW DID THE PORTFOLIO PERFORM? |
A: | The JPMorgan Insurance Trust Diversified Mid Cap Growth Portfolio, which seeks growth of capital and, secondarily, current income by investing primarily in equity securities, returned 11.39% (Class 1 Shares) over the 12 months ended December 31, 2006, compared to the 10.66% return for the Russell Midcap Growth Index over the same period.* |
Q: | WHY DID THE PORTFOLIO PERFORM THIS WAY? |
A: | The Portfolio outperformed its benchmark for the period due primarily to stock selection in the information technology, telecommunication service and industrial sectors. At the individual stock level, Alliance Data Systems Corp., a transaction, credit and marketing service provider, negotiated new business agreements with specialty retailers, including New York & Co. and Goody’s, to provide co-branded credit cards. In addition, the company announced strong quarterly results, solid organic growth and a $70 million acquisition of CPC Associates, which was well received by investors. Amphenol Corp., an electronic and fiber optic connector manufacturer, experienced strong results in all of its business segments, especially wireless handsets and broadband communication networks. NVIDIA Corp., a graphics chip manufacturer, posted solid performance, driven by strong demand for graphics processors (GPUs), desktops, laptops and handheld devices. |
| On the negative side, stock selection in the healthcare sector, and underweights in the materials and utility sectors hurt returns. In particular, Jabil Circuit Inc., a global leader in electronic manufacturing services (EMS), was negatively affected by operational issues, which investors feared would continue to detract from future earnings. Omnicare Inc., a nursing home pharmacy provider, restated first-quarter earnings to establish a litigation settlement reserve relating to three of the company’s generic drugs under scrutiny by the U.S. government and several states. In addition, the company filed a law suit against healthcare provider UnitedHealth Group Inc., alleging that UnitedHealth engaged in anti-competitive contract negotiations for Medicare prescription drug plans. PDL BioPharma Inc., a biotechnology company, lowered 2006 revenue expectations and raised its research-and-development (R&D) expense guidance. |
Q: | HOW WAS THE PORTFOLIO MANAGED? |
A: | We employ a bottom-up approach to stock selection, constructing portfolios based on company fundamentals, quantitative screening and proprietary fundamental analysis. We look for dominant franchises with predictable business models deemed capable of achieving sustained above-average growth. Potential investments are subjected to rigorous financial analysis and a disciplined approach to valuation. We seek to maintain sector diversification in the Portfolio by avoiding large allocations that are contingent on macroeconomic or sector trends. |
| 1. | Amphenol Corp., Class A | 2.0 | % | |||||||
| 2. | DaVita, Inc. | 1.9 | ||||||||
| 3. | Roper Industries, Inc. | 1.8 | ||||||||
| 4. | General Cable Corp. | 1.6 | ||||||||
| 5. | Lincare Holdings, Inc. | 1.6 | ||||||||
| 6. | NII Holdings, Inc. | 1.5 | ||||||||
| 7. | VeriFone Holdings, Inc. | 1.5 | ||||||||
| 8. | Harris Corp. | 1.3 | ||||||||
| 9. | GameStop Corp., Class A | 1.3 | ||||||||
| 10. | Time Warner Telecom, Inc., Class A | 1.3 | ||||||||
| Information Technology | 23.8 | % | ||||
| Consumer Discretionary | 19.5 | |||||
| Industrials | 15.6 | |||||
| Health Care | 15.0 | |||||
| Financials | 11.3 | |||||
| Energy | 6.3 | |||||
| Telecommunication Services | 5.6 | |||||
| Consumer Staples | 1.3 | |||||
| Utilities | 0.8 | |||||
| Short-Term Investment | 1.4 | |||||
| Investments of Cash Collateral for Securities on Loan | 20.0 |
| * | The advisor seeks to achieve the Portfolio’s objective. There can be no guarantee it will be achieved. |
| ** | Percentages indicated are based upon net assets as of December 31, 2006. The Portfolio’s composition is subject to change. |
| INCEPTION DATE OF CLASS | 1 YEAR | 5 YEAR | 10 YEAR | |||||||||||||||
|---|---|---|---|---|---|---|---|---|---|---|---|---|---|---|---|---|---|---|
CLASS 1 SHARES | 8/01/94 | 11.39 | % | 7.19 | % | 11.70 | % | |||||||||||
CLASS 2 SHARES | 8/16/06 | 11.28 | 7.17 | 11.69 | ||||||||||||||
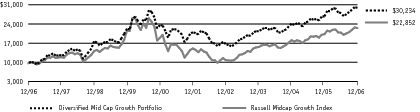
AS OF DECEMBER 31, 2006
| SHARES | | SECURITY DESCRIPTION | | VALUE ($) | |||||||
|---|---|---|---|---|---|---|---|---|---|---|---|
Long-Term Investments — 99.2% | |||||||||||
Common Stocks — 99.2% | |||||||||||
Aerospace & Defense — 2.3% | |||||||||||
| 24,850 | Precision Castparts Corp. | 1,945,258 | |||||||||
| 28,650 | Rockwell Collins, Inc. | 1,813,259 | |||||||||
| 3,758,517 | |||||||||||
Airlines — 1.5% | |||||||||||
| 20,200 | Continental Airlines, Inc., Class B (a) (c) | 833,250 | |||||||||
| 66,150 | Skywest, Inc. (c) | 1,687,487 | |||||||||
| 2,520,737 | |||||||||||
Biotechnology — 1.6% | |||||||||||
| 30,950 | Celgene Corp. (a) | 1,780,554 | |||||||||
| 22,900 | Vertex Pharmaceuticals, Inc. (a) (c) | 856,918 | |||||||||
| 2,637,472 | |||||||||||
Capital Markets — 4.5% | |||||||||||
| 16,050 | Affiliated Managers Group, Inc. (a) (c) | 1,687,336 | |||||||||
| 45,900 | E*Trade Financial Corp. (a) | 1,029,078 | |||||||||
| 26,650 | Investment Technology Group, Inc. (a) | 1,142,752 | |||||||||
| 34,837 | Lazard Ltd., Class A (Bermuda) | 1,649,184 | |||||||||
| 44,800 | T. Rowe Price Group, Inc. | 1,960,896 | |||||||||
| 7,469,246 | |||||||||||
Commercial Banks — 0.9% | |||||||||||
| 17,400 | Zions Bancorporation | 1,434,456 | |||||||||
Commercial Services & Supplies — 6.1% | |||||||||||
| 48,600 | Brady Corp., Class A (c) | 1,811,808 | |||||||||
| 14,300 | Corporate Executive Board Co. | 1,254,110 | |||||||||
| 43,600 | Corrections Corp. of America (a) | 1,972,028 | |||||||||
| 87,400 | Steelcase, Inc. (c) | 1,587,184 | |||||||||
| 26,600 | Stericycle, Inc. (a) (c) | 2,008,300 | |||||||||
| 33,600 | Waste Connections, Inc. (a) (c) | 1,396,080 | |||||||||
| 10,029,510 | |||||||||||
Communications Equipment — 1.3% | |||||||||||
| 46,800 | Harris Corp. | 2,146,248 | |||||||||
Computers & Peripherals — 4.0% | |||||||||||
| 41,200 | NCR Corp. (a) | 1,761,712 | |||||||||
| 45,100 | Network Appliance, Inc. (a) | 1,771,528 | |||||||||
| 65,000 | Seagate Technology (Cayman Islands) | 1,722,500 | |||||||||
| 256,500 | Sun Microsystems, Inc. (a) | 1,390,230 | |||||||||
| 6,645,970 | |||||||||||
Diversified Consumer Services — 1.8% | |||||||||||
| 19,700 | ITT Educational Services, Inc. (a) | 1,307,489 | |||||||||
| 31,000 | Weight Watchers International, Inc. | 1,628,430 | |||||||||
| 2,935,919 | |||||||||||
Diversified Financial Services — 2.3% | |||||||||||
| 7,600 | CBOT Holdings, Inc., Class A (a) | 1,151,172 | |||||||||
| 27,200 | CIT Group, Inc. | 1,516,944 | |||||||||
| 24,600 | International Securities Exchange Holdings, Inc. | 1,151,034 | |||||||||
| 3,819,150 | |||||||||||
Diversified Telecommunication Services — 2.1% | |||||||||||
| 41,300 | NeuStar, Inc., Class A (a) | 1,339,772 | |||||||||
| 105,900 | Time Warner Telecom, Inc., Class A (a) | 2,110,587 | |||||||||
| 3,450,359 | |||||||||||
Electrical Equipment — 3.4% | |||||||||||
| 60,800 | General Cable Corp. (a) | 2,657,568 | |||||||||
| 57,850 | Roper Industries, Inc. | 2,906,384 | |||||||||
| 5,563,952 | |||||||||||
Electronic Equipment & Instruments — 2.9% | |||||||||||
| 52,150 | Amphenol Corp., Class A | 3,237,472 | |||||||||
| 78,912 | Ingram Micro, Inc. (a) | 1,610,594 | |||||||||
| 4,848,066 | |||||||||||
Energy Equipment & Services — 3.3% | |||||||||||
| 33,250 | BJ Services Co. | 974,890 | |||||||||
| 18,500 | FMC Technologies, Inc. (a) | 1,140,155 | |||||||||
| 17,000 | National Oilwell Varco, Inc. (a) | 1,040,060 | |||||||||
| 13,400 | Noble Corp. | 1,020,410 | |||||||||
| 32,100 | Oceaneering International, Inc. (a) | 1,274,370 | |||||||||
| 5,449,885 | |||||||||||
Food & Staples Retailing — 0.9% | |||||||||||
| 42,500 | Safeway, Inc. | 1,468,800 | |||||||||
Gas Utilities — 0.8% | |||||||||||
| 15,200 | Questar Corp. | 1,262,360 | |||||||||
Health Care Equipment & Supplies — 2.8% | |||||||||||
| 21,200 | Advanced Medical Optics, Inc. (a) (c) | 746,240 | |||||||||
| 20,300 | Hologic, Inc. (a) (c) | 959,784 | |||||||||
| 14,700 | Idexx Laboratories, Inc. (a) | 1,165,710 | |||||||||
| 35,600 | Mentor Corp. (c) | 1,739,772 | |||||||||
| 4,611,506 | |||||||||||
Health Care Providers & Services — 5.2% | |||||||||||
| 56,500 | DaVita, Inc. (a) | 3,213,720 | |||||||||
| 66,200 | Lincare Holdings, Inc. (a) | 2,637,408 | |||||||||
| 22,600 | Medco Health Solutions, Inc. (a) | 1,207,744 | |||||||||
| 46,400 | VCA Antech, Inc. (a) (c) | 1,493,616 | |||||||||
| 8,552,488 | |||||||||||
Health Care Technology — 1.0% | |||||||||||
| 36,600 | Cerner Corp. (a) | 1,665,300 | |||||||||
| SHARES | | SECURITY DESCRIPTION | | VALUE ($) | |||||||
|---|---|---|---|---|---|---|---|---|---|---|---|
Long-Term Investments — Continued | |||||||||||
Hotels, Restaurants & Leisure — 4.4% | |||||||||||
| 67,000 | Burger King Holdings, Inc. (a) (c) | 1,413,700 | |||||||||
| 18,100 | Chipotle Mexican Grill, Inc., Class A (a) (c) | 1,031,700 | |||||||||
| 37,900 | International Game Technology | 1,750,980 | |||||||||
| 58,900 | Scientific Games Corp., Class A (a) (c) | 1,780,547 | |||||||||
| 43,100 | Tim Hortons, Inc. (Canada) | 1,248,176 | |||||||||
| 7,225,103 | |||||||||||
Household Durables — 0.7% | |||||||||||
| 21,300 | Garmin Ltd. (Cayman Islands) (c) | 1,185,558 | |||||||||
Insurance — 3.6% | |||||||||||
| 15,000 | Everest Re Group Ltd. (Barbados) | 1,471,650 | |||||||||
| 27,100 | Hanover Insurance Group, Inc. (The) | 1,322,480 | |||||||||
| 52,200 | OneBeacon Insurance Group Ltd. (a) | 1,461,600 | |||||||||
| 58,100 | Security Capital Assurance Ltd. (Bermuda) | 1,616,923 | |||||||||
| 5,872,653 | |||||||||||
Internet & Catalog Retail — 1.4% | |||||||||||
| 40,300 | Coldwater Creek, Inc. (a) (c) | 988,156 | |||||||||
| 30,700 | Priceline.com, Inc. (a) (c) | 1,338,827 | |||||||||
| 2,326,983 | |||||||||||
Internet Software & Services — 1.2% | |||||||||||
| 16,400 | Akamai Technologies, Inc. (a) | 871,168 | |||||||||
| 20,100 | Digital River, Inc. (a) (c) | 1,121,379 | |||||||||
| 1,992,547 | |||||||||||
IT Services — 4.2% | |||||||||||
| 32,150 | Alliance Data Systems Corp. (a) | 2,008,410 | |||||||||
| 41,279 | CheckFree Corp. (a) (c) | 1,657,765 | |||||||||
| 10,900 | Cognizant Technology Solutions Corp., Class A (a) | 841,044 | |||||||||
| 70,100 | VeriFone Holdings, Inc. (a) (c) | 2,481,540 | |||||||||
| 6,988,759 | |||||||||||
Leisure Equipment & Products — 0.9% | |||||||||||
| 39,300 | Pool Corp. (c) | 1,539,381 | |||||||||
Life Sciences Tools & Services — 1.1% | |||||||||||
| 31,000 | Covance, Inc. (a) | 1,826,210 | |||||||||
Machinery — 0.6% | |||||||||||
| 13,400 | Parker-Hannifin Corp. | 1,030,192 | |||||||||
Marine — 0.9% | |||||||||||
| 23,600 | American Commercial Lines, Inc. (a) (c) | 1,546,036 | |||||||||
Office Electronics — 0.7% | |||||||||||
| 34,300 | Zebra Technologies Corp., Class A (a) | 1,193,297 | |||||||||
Oil, Gas & Consumable Fuels — 3.0% | |||||||||||
| 19,100 | Apache Corp. | 1,270,341 | |||||||||
| 38,100 | Forest Oil Corp. (a) | 1,245,108 | |||||||||
| 32,050 | Southwestern Energy Co. (a) | 1,123,352 | |||||||||
| 26,600 | XTO Energy, Inc. | 1,251,530 | |||||||||
| 4,890,331 | |||||||||||
Personal Products — 0.4% | |||||||||||
| 18,846 | Bare Escentuals, Inc. (a) | 585,545 | |||||||||
Pharmaceuticals — 3.3% | |||||||||||
| 43,750 | Adams Respiratory Therapeutics, Inc. (a) (c) | 1,785,437 | |||||||||
| 15,200 | Allergan, Inc. | 1,820,048 | |||||||||
| 28,600 | Shire plc ADR (United Kingdom) (c) | 1,766,336 | |||||||||
| 5,371,821 | |||||||||||
Semiconductors & Semiconductor Equipment — 4.0% | |||||||||||
| 34,400 | Broadcom Corp., Class A (a) | 1,111,464 | |||||||||
| 33,050 | KLA-Tencor Corp. | 1,644,237 | |||||||||
| 32,300 | MEMC Electronic Materials, Inc. (a) | 1,264,222 | |||||||||
| 36,715 | Microchip Technology, Inc. | 1,200,581 | |||||||||
| 39,100 | NVIDIA Corp. (a) | 1,447,091 | |||||||||
| 6,667,595 | |||||||||||
Software — 5.5% | |||||||||||
| 77,700 | Activision, Inc. (a) | 1,339,548 | |||||||||
| 32,450 | Adobe Systems, Inc. (a) | 1,334,344 | |||||||||
| 42,350 | Amdocs Ltd. (United Kingdom) (a) | 1,641,062 | |||||||||
| 100,800 | BEA Systems, Inc. (a) | 1,268,064 | |||||||||
| 44,500 | Citrix Systems, Inc. (a) | 1,203,725 | |||||||||
| 24,100 | Salesforce.com, Inc. (a) | 878,445 | |||||||||
| 56,500 | Sybase, Inc. (a) | 1,395,550 | |||||||||
| 9,060,738 | |||||||||||
Specialty Retail — 7.4% | |||||||||||
| 68,500 | Circuit City Stores, Inc. | 1,300,130 | |||||||||
| 38,500 | GameStop Corp., Class A (a) (c) | 2,121,735 | |||||||||
| 54,800 | Office Depot, Inc. (a) | 2,091,716 | |||||||||
| 57,300 | PetSmart, Inc. | 1,653,678 | |||||||||
| 51,300 | Tiffany & Co. | 2,013,012 | |||||||||
| 61,000 | TJX Cos., Inc. | 1,739,720 | |||||||||
| 51,700 | United Auto Group, Inc. (c) | 1,218,569 | |||||||||
| 12,138,560 | |||||||||||
Textiles, Apparel & Luxury Goods — 2.9% | |||||||||||
| 33,000 | Coach, Inc. (a) | 1,417,680 | |||||||||
| 45,400 | Jones Apparel Group, Inc. | 1,517,722 | |||||||||
| 23,250 | Polo Ralph Lauren Corp. | 1,805,595 | |||||||||
| 4,740,997 | |||||||||||
Trading Companies & Distributors — 0.8% | |||||||||||
| 32,200 | GATX Corp. (c) | 1,395,226 | |||||||||
AS OF DECEMBER 31, 2006 (continued)
| SHARES | | SECURITY DESCRIPTION | | VALUE ($) | |||||||
|---|---|---|---|---|---|---|---|---|---|---|---|
Long-Term Investments — Continued | |||||||||||
Wireless Telecommunication Services — 3.5% | |||||||||||
| 36,900 | American Tower Corp., Class A (a) | 1,375,632 | |||||||||
| 38,550 | NII Holdings, Inc. (a) (c) | 2,484,162 | |||||||||
| 32,700 | Rogers Communications, Inc. (Canada), Class B (a) | 1,948,920 | |||||||||
| 5,808,714 | |||||||||||
| Total Common Stocks (Cost $147,482,587) | 163,656,187 | ||||||||||
Short-Term Investment — 1.4% | |||||||||||
Investment Company — 1.4% | |||||||||||
| 2,264,290 | JPMorgan Liquid Assets Money Market Fund (b) (m) (Cost $2,264,290) | 2,264,290 | |||||||||
| PRINCIPAL AMOUNT($) | | SECURITY DESCRIPTION | | VALUE ($) | |||||||
|---|---|---|---|---|---|---|---|---|---|---|---|
Investments of Cash Collateral for Securities on Loan — 20.0% | |||||||||||
Certificates of Deposit — 1.6% | |||||||||||
| 1,400,000 | Deutsche Bank New York, FRN, 5.41%, 01/22/08 | 1,400,000 | |||||||||
| 1,299,659 | Societe Generale, New York, FRN, 5.34%, 06/20/07 | 1,299,659 | |||||||||
| 2,699,659 | |||||||||||
Corporate Notes — 5.8% | |||||||||||
| 1,500,000 | American Express Credit Corp., FRN, 5.36%, 01/15/08 | 1,500,000 | |||||||||
| 750,000 | Banque Federative Du Credit, FRN, 5.35%, 07/13/07 | 750,000 | |||||||||
| 1,500,112 | Beta Finance, Inc., FRN, 5.38%, 03/15/07 | 1,500,112 | |||||||||
| 1,600,000 | CDC Financial Production, Inc., FRN, 5.36%, 01/29/07 | 1,600,000 | |||||||||
| 1,200,000 | Citigroup Global Markets, Inc., FRN, 5.38%, 01/05/07 | 1,200,000 | |||||||||
| 486,577 | MBIA Global Funding LLC, FRN, 5.45%, 01/26/07 | 486,577 | |||||||||
| 1,000,000 | Morgan Stanley, FRN, 5.49%, 01/29/08 | 1,000,000 | |||||||||
| 1,500,000 | Unicredito Italiano Bank plc, FRN, 5.36%, 01/29/08 | 1,500,000 | |||||||||
| 9,536,689 | |||||||||||
Repurchase Agreements — 12.6% | |||||||||||
| 6,764,369 | Banc of America Securities LLC, 5.32%, dated 12/29/06, due 01/02/07, repurchase price $6,768,367, collateralized by U.S. Government Agency Mortgages | 6,764,369 | |||||||||
| 6,250,000 | Bear Stearns, 5.31%, dated 12/29/06, due 01/02/07, repurchase price $6,253,688, collateralized by U.S. Government Agency Mortgages | 6,250,000 | |||||||||
| 5,000,000 | Lehman Brothers, Inc., 5.31%, dated 12/29/06, due 01/02/07, repurchase price $5,002,950, collateralized by U.S. Government Agency Mortgages | 5,000,000 | |||||||||
| 2,719,010 | UBS Securities LLC, 5.32%, dated 12/29/06, due 01/02/07, repurchase price $2,720,616, collateralized by U.S. Government Agency Mortgages | 2,719,010 | |||||||||
| 20,733,379 | |||||||||||
| Total Investments of Cash Collateral for Securities on Loan (Cost $32,969,727) | 32,969,727 | ||||||||||
Total Investments — 120.6% (Cost $182,716,604) | 198,890,204 | ||||||||||
Liabilities in Excess of Other Assets — (20.6)% | (33,918,465 | ) | |||||||||
NET ASSETS — 100.0% | $ | 164,971,739 | |||||||||
| (a) | — | Non-income producing security. |
| (b) | — | Investment in affiliate. Money market fund registered under the Investment Company Act of 1940, as amended, and advised by JPMorgan Investment Advisors Inc. |
| (c) | — | Security, or a portion of the security, has been delivered to a counterparty as part of a security lending transaction. |
| (m) | — | All or a portion of this security is segregated for current or potential holdings of futures, swaps, options, TBA, when-issued securities, delayed delivery securities, and reverse repurchase agreements. |
| ADR | — | American Depositary Receipt. |
| FRN | — | Floating Rate Note. The rate shown is the rate in effect as of December 31, 2006. |
AS OF DECEMBER 31, 2006
| | Diversified Mid Cap Growth Portfolio | |||||
|---|---|---|---|---|---|---|
ASSETS: | ||||||
| Investments in non-affiliates, at value | $ | 175,892,535 | ||||
| Investments in affiliates, at value | 2,264,290 | |||||
| Repurchase agreements, at value | 20,733,379 | |||||
| Total investment securities, at value | 198,890,204 | |||||
| Cash | 7,949 | |||||
| Receivables: | ||||||
| Investment securities sold | 29,626 | |||||
| Portfolio shares sold | 34,032 | |||||
| Interest and dividends | 65,190 | |||||
| Total Assets | 199,027,001 | |||||
LIABILITIES: | ||||||
| Payables: | ||||||
| Investment securities purchased | 806,606 | |||||
| Collateral for securities lending program | 32,969,727 | |||||
| Portfolio shares redeemed | 108,700 | |||||
| Accrued liabilities: | ||||||
| Investment advisory fees | 87,143 | |||||
| Administration fees | 13,892 | |||||
| Custodian and accounting fees | 7,857 | |||||
| Distribution fees | 3 | |||||
| Trustees’ and Officers’ fees | 9 | |||||
| Other | 61,325 | |||||
| Total Liabilities | 34,055,262 | |||||
| Net Assets | $ | 164,971,739 | ||||
NET ASSETS: | ||||||
| Paid in capital | $ | 121,860,814 | ||||
| Accumulated undistributed (distributions in excess of) net investment income | (3,255 | ) | ||||
| Accumulated net realized gains (losses) | 26,940,580 | |||||
| Net unrealized appreciation (depreciation) | 16,173,600 | |||||
| Total Net Assets | $ | 164,971,739 | ||||
| Net Assets: | ||||||
| Class 1 | $ | 164,955,491 | ||||
| Class 2 | 16,248 | |||||
| Total | $ | 164,971,739 | ||||
| Outstanding units of beneficial interest (shares) (unlimited amount authorized, no par value): | ||||||
| Class 1 | 7,757,380 | |||||
| Class 2 | 765 | |||||
| Net asset value, offering and redemption price per share: | ||||||
| Class 1 | $ | 21.26 | ||||
| Class 2 | 21.24 | |||||
| Cost of investments | $ | 182,716,604 | ||||
| Market value of securities on loan | 32,228,508 | |||||
FOR THE YEAR ENDED DECEMBER 31, 2006
| | Diversified Mid Cap Growth Portfolio | |||||
|---|---|---|---|---|---|---|
INVESTMENT INCOME: | ||||||
| Dividend income | $ | 1,213,326 | ||||
| Dividend income from affiliates (a) | 120,267 | |||||
| Income from securities lending (net) | 154,586 | |||||
| Foreign taxes withheld | (1,339 | ) | ||||
| Total investment income | 1,486,840 | |||||
EXPENSES: | ||||||
| Investment advisory fees | 1,153,616 | |||||
| Administration fees | 207,641 | |||||
| Distribution fees — Class 2 | 15 | |||||
| Custodian and accounting fees | 33,460 | |||||
| Professional fees | 55,481 | |||||
| Trustees’ and Officers’ fees | 2,824 | |||||
| Transfer agent fees | 59,425 | |||||
| Printing and mailing costs | 105,989 | |||||
| Other | 18,757 | |||||
| Total expenses | 1,637,208 | |||||
| Less amounts waived | (29,369 | ) | ||||
| Less earnings credits | (284 | ) | ||||
| Net expenses | 1,607,555 | |||||
| Net investment income (loss) | (120,715 | ) | ||||
REALIZED/UNREALIZED GAINS (LOSSES): | ||||||
| Net realized gain (loss) on transactions from investments | 27,439,721 | |||||
| Change in net unrealized appreciation (depreciation) of investments | (8,286,579 | ) | ||||
| Net realized/unrealized gains (losses) | 19,153,142 | |||||
| Change in net assets resulting from operations | $ | 19,032,427 | ||||
| (a) | Includes reimbursements of investment advisory, administration and shareholder servicing fees. See Fees and Other Transactions with Affiliates in the Notes to Financial Statements. |
FOR THE PERIODS INDICATED
| Diversified Mid Cap Growth Portfolio | |||||||||||
|---|---|---|---|---|---|---|---|---|---|---|---|
| | Year Ended 12/31/2006 | | Year Ended 12/31/2005 | ||||||||
CHANGE IN NET ASSETS RESULTING FROM OPERATIONS: | |||||||||||
| Net investment income (loss) | $ | (120,715 | ) | $ | (677,416 | ) | |||||
| Net realized gain (loss) | 27,439,721 | 34,053,459 | |||||||||
| Change in net unrealized appreciation (depreciation) | (8,286,579 | ) | (13,975,622 | ) | |||||||
| Change in net assets resulting from operations | 19,032,427 | 19,400,421 | |||||||||
DISTRIBUTIONS TO SHAREHOLDERS: | |||||||||||
Class 1 | |||||||||||
| From net realized gains | (5,397,317 | ) | — | ||||||||
CAPITAL TRANSACTIONS: | |||||||||||
| Change in net assets from capital transactions | (33,137,300 | ) | (31,768,944 | ) | |||||||
NET ASSETS: | |||||||||||
| Change in net assets | (19,502,190 | ) | (12,368,523 | ) | |||||||
| Beginning of period | 184,473,929 | 196,842,452 | |||||||||
| End of period | $ | 164,971,739 | $ | 184,473,929 | |||||||
| Accumulated undistributed (distributions in excess of) net investment income | $ | (3,255 | ) | $ | (7,097 | ) | |||||
CAPITAL TRANSACTIONS: | |||||||||||
Class 1 | |||||||||||
| Proceeds from shares issued | $ | 11,536,714 | $ | 13,158,822 | |||||||
| Dividends reinvested | 5,397,317 | — | |||||||||
| Cost of shares redeemed | (50,086,406 | ) | (44,927,766 | ) | |||||||
| Change in net assets from Class 1 capital transactions | $ | (33,152,375 | ) | $ | (31,768,944 | ) | |||||
Class 2 (a) | |||||||||||
| Proceeds from shares issued | $ | 15,075 | $ | — | |||||||
| Change in net assets from Class 2 capital transactions | $ | 15,075 | $ | — | |||||||
SHARE TRANSACTIONS: | |||||||||||
Class 1 | |||||||||||
| Issued | 565,124 | 727,008 | |||||||||
| Reinvested | 256,161 | — | |||||||||
| Redeemed | (2,463,347 | ) | (2,464,580 | ) | |||||||
| Change in Class 1 Shares | (1,642,062 | ) | (1,737,572 | ) | |||||||
Class 2 (a) | |||||||||||
| Issued | 765 | — | |||||||||
| Change in Class 2 Shares | 765 | — | |||||||||
FOR THE PERIODS INDICATED
| Per share operating performance | | ||||||||||||||||||||||||||
|---|---|---|---|---|---|---|---|---|---|---|---|---|---|---|---|---|---|---|---|---|---|---|---|---|---|---|---|
| Investment operations | | Distributions | |||||||||||||||||||||||||
| | Net asset value, beginning of period | | Net investment income (loss) | | Net realized and unrealized gains (losses) on investments | | Total from investment operations | | Net realized gains | | Total distributions | ||||||||||||||||
Class 1 | |||||||||||||||||||||||||||
| Year Ended December 31, 2006 | $ | 19.63 | $ | (0.02 | ) | $ | 2.25 | $ | 2.23 | $ | (0.60 | ) | $ | (0.60 | ) | ||||||||||||
| Year Ended December 31, 2005 | 17.67 | (0.07 | ) | 2.03 | 1.96 | — | — | ||||||||||||||||||||
| Year Ended December 31, 2004 | 15.69 | (0.06 | ) | 2.04 | 1.98 | — | — | ||||||||||||||||||||
| Year Ended December 31, 2003 | 12.34 | (0.04 | ) | 3.39 | 3.35 | — | — | ||||||||||||||||||||
| Year Ended December 31, 2002 | 15.45 | (0.05 | ) | (3.06 | ) | (3.11 | ) | — | — | ||||||||||||||||||
Class 2 | |||||||||||||||||||||||||||
| August 16, 2006 (d) through December 31, 2006 | 19.71 | (0.05 | ) | 1.58 | 1.53 | — | — | ||||||||||||||||||||
| (a) | Annualized for periods less than one year. |
| (b) | Not annualized for periods less than one year. |
| (c) | Includes adjustments in accordance with accounting principles generally accepted in the United States of America and as such, the net asset value for financial reporting purposes and the returns based upon those net asset values may differ from the net asset value and returns for shareholder transactions. |
| (d) | Commencement of offering of class of shares |
| | Ratios/Supplemental data | | ||||||||||||||||||||||||
|---|---|---|---|---|---|---|---|---|---|---|---|---|---|---|---|---|---|---|---|---|---|---|---|---|---|---|
| Ratios to average net assets (a) | ||||||||||||||||||||||||||
| Net asset value, end of period | | Total return (b)(c) | | Net assets end of period (000’s) | | Net expenses | | Net investment income (loss) | | Expenses without waivers, reimbursements and earnings credits | | Portfolio turnover rate (b) | ||||||||||||||
| $21.26 | 11.39 | % | $ | 164,955 | 0.91 | % | (0.07 | )% | 0.92 | % | 115 | % | ||||||||||||||
| 19.63 | 11.09 | 184,474 | 0.88 | (0.36 | ) | 0.88 | 113 | |||||||||||||||||||
| 17.67 | 12.62 | 196,842 | 0.85 | (0.35 | ) | 0.86 | 74 | |||||||||||||||||||
| 15.69 | 27.15 | 195,606 | 0.84 | (0.27 | ) | 0.86 | 69 | |||||||||||||||||||
| 12.34 | (20.13 | ) | 144,108 | 0.83 | (0.37 | ) | 0.85 | 76 | ||||||||||||||||||
| 21.24 | 7.76 | 16 | 1.15 | (0.60 | ) | 1.19 | 115 | |||||||||||||||||||
AS OF DECEMBER 31, 2006
| | Classes Offered | | |||||
|---|---|---|---|---|---|---|---|
| Diversified Mid Cap Growth Portfolio | Class 1 and Class 2 | ||||||
During the term of the loan, the Portfolio receives payments from borrowers equivalent to the dividends and interest that would have been earned on securities lent while simultaneously seeking to earn income on the investment of cash collateral in accordance with investment guidelines contained in the Securities Lending Agreement. For loans secured by cash, the Portfolio retains the interest on cash collateral investments but is required to pay the borrower a portion of such interest for the use of the cash collateral. For loans secured by U.S. government securities, the borrower pays a borrower fee to the lending agent on behalf of the Portfolio. The net income earned on the securities lending (after payment of rebates and the lending agent’s fee) is included in the Statement of Operations as Income from securities lending (net). Information on the investment of cash collateral is shown in the Schedule of Portfolio Investments.
| | Lending Agent Fees Paid | | Market Value of Collateral | | Market Value of Loaned Securities | |||||||||
|---|---|---|---|---|---|---|---|---|---|---|---|---|---|---|
| $ | 12,835 | $ | 32,969,727 | $ | 32,228,508 | |||||||||
AS OF DECEMBER 31, 2006 (continued)
| | Paid-in-capital | | Accumulated Undistributed/ (Overdistributed) Net Investment Income | | Accumulated Net Realized Gain (Loss) on Investments | |||||||||
|---|---|---|---|---|---|---|---|---|---|---|---|---|---|---|
| $ | (3,973 | ) | $ | 124,557 | $ | (120,584 | ) | |||||||
| | Class 1 | | Class 2 | |||||||
|---|---|---|---|---|---|---|---|---|---|---|
| 0.90 | %* | 1.15 | % | |||||||
| * | 0.98% prior to May 1, 2006 |
| | Purchases (excluding U.S. Government) | | Sales (excluding U.S. Government) | |||||||
|---|---|---|---|---|---|---|---|---|---|---|
| $ | 200,683,162 | $ | 239,899,986 | |||||||
| | Aggregate Cost | | Gross Unrealized Appreciation | | Gross Unrealized Depreciation | | Net Unrealized Appreciation (Depreciation) | |||||||||||
|---|---|---|---|---|---|---|---|---|---|---|---|---|---|---|---|---|---|---|
| $ | 183,141,229 | $ | 17,767,365 | $ | 2,018,390 | $ | 15,748,975 | |||||||||||
AS OF DECEMBER 31, 2006 (continued)
| Total Distributions Paid From: | |||||||||||
|---|---|---|---|---|---|---|---|---|---|---|---|
| | Net Long-Term Capital gains | | Total Distributions Paid | | |||||||
| $ | 5,397,317 | $ | 5,397,317 | ||||||||
| | Current Distributable Ordinary Income | | Current Distributable Long-Term Capital Gain or (Tax Basis Capital Loss Carryover) | | Unrealized Appreciation (Depreciation) | |||||||||
|---|---|---|---|---|---|---|---|---|---|---|---|---|---|---|
| $ | 3,919,783 | $ | 23,445,425 | $ | 15,748,975 | |||||||||
JPMorgan Insurance Trust Diversified Mid Cap Growth Portfolio:
New York, New York
February 15, 2007
(Unaudited)
| Name (Year of Birth); Positions With the Portfolio | | Principal Occupations During Past 5 Years | | Number of Portfolios in Fund Complex Overseen by Trustee (1) | | Other Directorships Held Outside Fund Complex | |||||||||
|---|---|---|---|---|---|---|---|---|---|---|---|---|---|---|---|
Independent Trustees | |||||||||||||||
| William J. Armstrong (1941); Trustee since 2005; Trustee of heritage JPMorgan Funds since 1987. | Retired; CFO and Consultant, EduNeering, Inc. (internet business education supplier) (2000–2001); Vice President and Treasurer, Ingersoll–Rand Company (manufacturer of industrial equipment) (1972–2000). | 131 | None. | ||||||||||||
| Roland R. Eppley, Jr. (1932); Trustee since 2005; Trustee of heritage JPMorgan Funds since 1989. | Retired; President and Chief Executive Officer, Eastern States Bankcard (1971–1988). | 131 | None. | ||||||||||||
| John F. Finn (1947); Trustee since 2005; Trustee of heritage One Group Mutual Funds since 1998. | President and Chief Executive Officer, Gardner, Inc. (wholesale distributor to outdoor power equipment industry) (1979–present). | 131 | Director, Cardinal Health, Inc (CAH) (1994–present); Chairman, The Columbus Association of the Performing Arts (CAPA) (2003–present). | ||||||||||||
| Dr. Matthew Goldstein (1941); Trustee since 2005; Trustee of heritage JPMorgan Funds since 2003. | Chancellor, City University of New York (1999–present); President, Adelphi University (New York) (1998–1999). | 131 | Director, Albert Einstein School of Medicine (1998–present); Director, New Plan Excel Realty Trust, Inc. (real estate investment trust) (2000–present); Director, Lincoln Center Institute for the Arts in Education (1999–present). | ||||||||||||
| Robert J. Higgins (1945); Trustee since 2005; Trustee of heritage JPMorgan Funds since 2002. | Retired; Director of Administration of the State of Rhode Island (2003–2004); President — Consumer Banking and Investment Services, Fleet Boston Financial (1971–2001). | 131 | None. | ||||||||||||
| Peter C. Marshall (1942); Trustee since 2005; Trustee of heritage One Group Mutual Funds since 1994. | Self-employed business consultant (2001–present); Senior Vice President, W.D. Hoard, Inc. (corporate parent of DCI Marketing, Inc.) (2000–2002); President, DCI Marketing, Inc. (1992–2000). | 131 | None. | ||||||||||||
| Marilyn McCoy (1948); Trustee since 2005; Trustee of heritage One Group Mutual Funds since 1999. | Vice President of Administration and Planning, Northwestern University (1985–present). | 131 | Trustee, Mather LifeWays (1994–present); Trustee, Carleton College (2003–present). | ||||||||||||
| William G. Morton, Jr. (1937); Trustee since 2005; Trustee of heritage JPMorgan Funds since 2003. | Retired; Chairman Emeritus (2001–2002), and Chairman and Chief Executive Officer, Boston Stock Exchange (1985–2001). | 131 | Director, Radio Shack Corporation (electronics) (1987–present); Director, The National Football Foundation and College Hall of Fame (1994–present); Trustee, Stratton Mountain School (2001–present). | ||||||||||||
| Name (Year of Birth); Positions With the Portfolio | | Principal Occupations During Past 5 Years | | Number of Portfolios in Fund Complex Overseen by Trustee (1) | | Other Directorships Held Outside Fund Complex | |||||||||
|---|---|---|---|---|---|---|---|---|---|---|---|---|---|---|---|
Independent Trustees (continued) | |||||||||||||||
| Robert A. Oden, Jr. (1946); Trustee since 2005; Trustee of heritage One Group Mutual Funds since 1997. | President, Carleton College (2002–present); President, Kenyon College (1995–2002). | 131 | Director, American University in Cairo. | ||||||||||||
| Fergus Reid, III (1932); Trustee (Chairman) since 2005; Trustee (Chairman) of heritage JPMorgan Funds since 1987. | Chairman, Lumelite Corporation (plastics manufacturing) (2003–present); Chairman and Chief Executive Officer, Lumelite Corporation (1985–2002). | 131 | Trustee, Morgan Stanley Funds (196 portfolios) (1995–present). | ||||||||||||
| Frederick W. Ruebeck (1939); Trustee since 2005; Trustee of heritage One Group Mutual Funds since 1994. | Advisor, Jerome P. Green & Associates, LLC (broker-dealer) (2000–present); Chief Investment Officer, Wabash College (2004–present); self-employed consultant (2000–present); Director of Investments, Eli Lilly and Company (1988–1999). | 131 | Trustee, Wabash College (1988–present); Chairman, Indianapolis Symphony Orchestra Foundation (1994–present). | ||||||||||||
| James J. Schonbachler (1943); Trustee since 2005; Trustee of heritage JPMorgan Funds since 2001. | Retired; Managing Director of Bankers Trust Company (financial services) (1968–1998). | 131 | None. | ||||||||||||
Interested Trustee | |||||||||||||||
| Leonard M. Spalding, Jr.* (1935); Trustee since 2005; Trustee of heritage JPMorgan Funds since 1998. | Retired; Chief Executive Officer, Chase Mutual Funds (investment company) (1989–1998); President and Chief Executive Officer, Vista Capital Management (investment management) (1990–1998); Chief Investment Executive, Chase Manhattan Private Bank (investment management) (1990–1998). | 131 | Director, Glenview Trust Company, LLC (2001–present); Trustee, St. Catherine College (1998–present); Trustee, Bellarmine University (2000–present); Director, Springfield-Washington County Economic Development Authority (1997–present); Trustee, Marion and Washington County, Kentucky Airport Board (1998–present); Trustee, Catholic Education Foundation (2005–present). | ||||||||||||
| (1) | A Fund Complex means two or more registered investment companies that hold themselves out to investors as related companies for purposes of investment and investor services or have a common investment adviser or have an investment adviser that is an affiliated person of the investment adviser of any of the other registered investment companies. The JPMorgan Funds Complex for which the Board of Trustees serves currently includes eight registered investment companies (131 funds). |
| * | Mr. Spalding is deemed to be an “interested person” due to his ownership of JPMorgan Chase stock. |
(Unaudited)
| Name (Year of Birth), Positions Held with the Trust | | Principal Occupations During Past 5 Years | ||||
|---|---|---|---|---|---|---|
| George C.W. Gatch (1962), President since 2005 | Managing Director, J.P. Morgan Investment Management Inc.; Director and President, JPMorgan Distribution Services, Inc. and JPMorgan Funds Management, Inc. since 2005. Mr. Gatch is CEO and President of the JPMorgan Funds. Mr. Gatch has been an employee of JPMorgan since 1986 and has held positions such as President and CEO of DKB Morgan, a Japanese mutual fund company, which was a joint venture between J.P. Morgan and Dai-Ichi Kangyo Bank, as well as positions in business management, marketing and sales. | |||||
| Robert L. Young (1963), Senior Vice President since 2005* | Director and Vice President, JPMorgan Distribution Services, Inc. and JPMorgan Funds Management, Inc.; Chief Operating Officer, JPMorgan Funds since 2005, and One Group Mutual Funds from 2001 until 2005. Mr. Young was Vice President and Treasurer, JPMorgan Funds Management, Inc. (formerly One Group Administrative Services) and Vice President and Treasurer, JPMorgan Distribution Services, Inc. (formerly One Group Dealer Services, Inc.) from 1999 to 2005. | |||||
| Patricia A. Maleski (1960), Vice President and Chief Administrative Officer since 2005 | Managing Director, JPMorgan Funds Management, Inc.; previously, Treasurer, JPMorgan Funds and Head of Funds Administration and Board Liaison. Ms. Maleski was Vice President of Finance for the Pierpont Group, Inc. from 1996–2001, an independent company owned by the Board of Directors/Trustees of the JPMorgan Funds, prior to joining JPMorgan Chase & Co. in 2001. | |||||
| Stephanie J. Dorsey (1969), Treasurer since 2005* | Vice President, JPMorgan Funds Management, Inc.; Director of Mutual Fund Administration, JPMorgan Funds Management, Inc. (formerly One Group Administrative Services), from 2004 to 2005; Ms. Dorsey worked for JPMorgan Chase & Co., (formerly Bank One Corporation) from 2003 to 2004; prior to joining Bank One Corporation, she was a Senior Manager specializing in Financial Services audits at PricewaterhouseCoopers LLP from 1992 through 2002. | |||||
| Stephen M. Ungerman (1953), Chief Compliance Officer since 2005 | Senior Vice President, JPMorgan Chase & Co.; Mr. Ungerman was head of Fund Administration — Pooled Vehicles from 2000 to 2004. Mr. Ungerman held a number of positions in Prudential Financial’s asset management business prior to 2000. | |||||
| Paul L. Gulinello (1950), AML Compliance Officer since 2005 | Vice President and Anti Money Laundering Compliance Officer for JPMorgan Asset Management Americas, additionally responsible for personal trading and compliance testing since 2004; Treasury Services Operating Risk Management and Compliance Executive supporting all JPMorgan Treasury Services business units from July 2000 to 2004. | |||||
| Stephen M. Benham (1959), Secretary since 2005 | Vice President and Assistant General Counsel, JPMorgan Chase & Co. since 2004; Vice President (Legal Advisory) of Merrill Lynch Investment Managers, L.P. from 2000 to 2004. | |||||
| Elizabeth A. Davin (1964), Assistant Secretary since 2005* | Vice President and Assistant General Counsel, JPMorgan Chase & Co. since 2005; Senior Counsel, JPMorgan Chase & Co. (formerly Bank One Corporation) from 2004 to 2005; Assistant General Counsel and Associate General Counsel and Vice President, Gartmore Global Investments, Inc. from 1999 to 2004. | |||||
| Jessica K. Ditullio (1962), Assistant Secretary since 2005* | Vice President and Assistant General Counsel, JPMorgan Chase & Co. since 2005; Ms. Ditullio has served as an attorney with various titles for JPMorgan Chase & Co. (formerly Bank One Corporation) since 1990. | |||||
| Nancy E. Fields (1949), Assistant Secretary since 2005* | Vice President, JPMorgan Funds Management, Inc. and JPMorgan Distribution Services, Inc.; From 1999 to 2005, Director, Mutual Fund Administration, JPMorgan Funds Management, Inc. (formerly One Group Administrative Services) and Senior Project Manager, Mutual Funds, JPMorgan Distribution Services, Inc. (formerly One Group Dealer Services, Inc.). | |||||
| Michael C. Raczynski (1975), Assistant Secretary since 2006 | Vice President and Assistant General Counsel, JPMorgan Chase & Co. since 2006; Associate, Stroock & Stroock & Lavan LLP from 2001 to 2006. | |||||
| Ellen W. O’Brien (1957), Assistant Secretary since 2005** | Assistant Vice President, JPMorgan Investor Services, Co., responsible for Blue Sky registration. Ms. O’Brien has served in this capacity since joining the firm in 1991. | |||||
| Name (Year of Birth), Positions Held with the Trust | | Principal Occupations During Past 5 Years | ||||
|---|---|---|---|---|---|---|
| Laura S. Melman (1966) Assistant Treasurer since 2006 | Vice President, JPMorgan Funds Management, Inc. since August, 2006, responsible for Taxation; Vice President of Structured Products at The Bank of New York Co., Inc. from 2001 to 2006. | |||||
| Arthur A. Jensen (1966), Assistant Treasurer since 2005* | Vice President, JPMorgan Funds Management, Inc. since April 2005; formerly, Vice President of Financial Services of BISYS Fund Services, Inc. from 2001 to 2005; Mr. Jensen was Section Manager at Northern Trust Company and Accounting Supervisor at Allstate Insurance Company prior to 2001. | |||||
| Jeffrey D. House (1972) Assistant Treasurer since 2006* | Vice President, JPMorgan Funds Management, Inc. since July 2006; formerly, Senior Manager of Financial Services at BISYS Fund Services, Inc. from 1995 to 2006. | |||||
| * | The contact address for the officer is 1111 Polaris Parkway, Columbus, OH 43271. |
| ** | The contact address for the officer is 73 Tremont Street, Floor 1, Boston MA 02108. |
(Unaudited)
December 31, 2006
| | Beginning Account Value, July 1, 2006 | | Ending Account Value, December 31, 2006 | | Expenses Paid During July 1, 2006 to December 31, 2006 | | Annualized Expense Ratio | |||||||||||
|---|---|---|---|---|---|---|---|---|---|---|---|---|---|---|---|---|---|---|
Class 1 | ||||||||||||||||||
| Actual* | $ | 1,000.00 | $ | 1,065.70 | $ | 4.69 | 0.90 | % | ||||||||||
| Hypothetical* | 1,000.00 | 1,020.67 | 4.58 | 0.90 | ||||||||||||||
Class 2 | ||||||||||||||||||
| Actual** | 1,000.00 | 1,077.60 | 4.52 | 1.15 | ||||||||||||||
| Hypothetical* | 1,000.00 | 1,019.41 | 5.85 | 1.15 | ||||||||||||||
| * | Expenses are equal to the Portfolio’s annualized expense ratio, multiplied by the average account value over the period, multiplied by 184/365 (to reflect the one-half year period). |
| ** | Expenses are equal to the Portfolio’s annualized expense ratio, multiplied by the average account value over the period, multiplied by 138/365 (to reflect the actual period). |
(Unaudited)
(Unaudited) (continued)
providing such services. Expenses include direct and indirect costs and are calculated using an allocation methodology developed by the Advisor. The Trustees also recognized that it is difficult to make comparisons of profitability from fund investment advisory contracts because comparative information is not generally publicly available and is affected by numerous factors, including the structure of the particular Advisor, the types of funds it manages, its business mix, numerous assumptions regarding allocations and the fact that publicly-traded fund managers’ operating profits and net income are net of distribution and marketing expenses. Based on their review, the Trustees concluded that the profitability to the Advisor of each of the Investment Advisory Agreements was not unreasonable in light of the services and benefits provided to each Fund.
(Unaudited)
© JPMorgan Chase & Co., 2007 All rights reserved. December 2006. | AN-JPMITDMCGP-1206 |
NOT FDIC INSURED • NO BANK GUARANTEE • MAY LOSE VALUE
This material must be preceded or accompanied by a current prospectus.
| President’s Letter | 1 | |||||
| Portfolio Commentary: | ||||||
| JPMorgan Insurance Trust Diversified Mid Cap Value Portfolio | 2 | |||||
| Schedule of Portfolio Investments | 4 | |||||
| Financial Statements | 7 | |||||
| Financial Highlights | 10 | |||||
| Notes to Financial Statements | 12 | |||||
| Report of Independent Registered Public Accounting Firm | 17 | |||||
| Trustees | 18 | |||||
| Officers | 20 | |||||
| Schedule of Shareholder Expenses | 22 | |||||
| Board Approval of Investment Advisory Agreement | 23 | |||||
| Tax Letter | 26 |
| • | Fed’s tightening cycle gained traction in the economy |
| • | Markets buoyed by falling oil prices, solid corporate profits and a robust mergers-and-acquisitions environment |
| • | Home sales stabilized toward year-end but were offset somewhat by amount of unsold homes |
| • | Consumer spending likely to moderate as job gains decrease |
JANUARY 5, 2007 (Unaudited)
| “We expect economic growth to remain subdued over the next few quarters, keeping the pressure off inflation.” | ||
President
JPMorgan Funds
AS OF DECEMBER 31, 2006 (Unaudited)
| Portfolio Inception | May 1, 1997 | |||||
| Fiscal Year End | December 31 | |||||
| Net Assets as of 12/31/2006 | $81,561,296 | |||||
| Primary Benchmark | Russell Midcap Value Index | |||||
Q: | HOW DID THE PORTFOLIO PERFORM? |
A: | The JPMorgan Insurance Trust Diversified Mid Cap Value Portfolio, which seeks capital appreciation with the secondary goal of achieving current income by investing primarily in equity securities, returned 16.72% (Class 1 Shares) over the 12 months ended December 31, 2006, compared to the 20.22% return for the Russell Midcap Value Index over the same period.* |
Q: | WHY DID THE PORTFOLIO PERFORM THIS WAY? |
A: | The Portfolio underperformed its benchmark for the period due primarily to stock selection in the consumer staples, healthcare and industrial sectors. At the individual stock level, shares of Omnicare Inc., a geriatric pharmaceutical services company, came under pressure as several events, such as legal disputes with regulators and an ongoing lawsuit against UnitedHealthcare, lowered investor sentiment toward the stock. Despite these negative developments, the company is the largest institutional pharmacy provider with a significant low-cost advantage relative to its competitors. CA Inc., a corporate software firm, failed to file its annual report with regulators by the deadline and announced that it may need to restate previously reported results from stock-option grants going back to fiscal year 1997. Furthermore, the company may have understated its subscription revenue in years prior to fiscal year 2006. Shares of Coventry Health Care Inc., a managed healthcare provider, were negatively impacted by poor performance in its sector throughout the year due to profitability concerns, given increased competition and fears that a Democratic-controlled Congress would push for Medicare reforms that would cut further into profits. In addition, the company announced 2007 guidance that fell short of its previously stated long-term growth rate. |
Q: | HOW WAS THE PORTFOLIO MANAGED? |
A: | We employ a bottom-up approach to stock selection, constructing portfolios based on company fundamentals, quantitative screening and proprietary fundamental analysis. We look for undervalued companies that have the potential to grow intrinsic value per share. The research process is designed in an effort to find companies with predictable and durable business models deemed capable of achieving sustainable growth. Potential investments are subjected to rigorous financial analysis and a disciplined approach to valuation. |
| 1. | V.F. Corp. | 1.9 | % | |||||||
| 2. | Assurant, Inc. | 1.5 | ||||||||
| 3. | Old Republic International Corp. | 1.4 | ||||||||
| 4. | iStar Financial, Inc. | 1.3 | ||||||||
| 5. | AutoZone, Inc. | 1.3 | ||||||||
| 6. | Coventry Health Care, Inc. | 1.3 | ||||||||
| 7. | Kinder Morgan, Inc. | 1.2 | ||||||||
| 8. | Fortune Brands, Inc. | 1.2 | ||||||||
| 9. | Constellation Brands, Inc., Class A | 1.2 | ||||||||
| 10. | Vulcan Materials Co. | 1.2 | ||||||||
| Financials | 29.4 | % | ||||
| Consumer Discretionary | 21.0 | |||||
| Utilities | 10.6 | |||||
| Consumer Staples | 8.0 | |||||
| Industrials | 7.3 | |||||
| Materials | 6.3 | |||||
| Energy | 5.5 | |||||
| Health Care | 4.4 | |||||
| Information Technology | 4.3 | |||||
| Telecommunication Services | 2.2 | |||||
| Short-Term Investment | 1.5 | |||||
| Investments of Cash Collateral for Securities on Loan | 6.5 |
| * | The advisor seeks to achieve the Portfolio’s objective. There can be no guarantee it will be achieved. |
| ** | Percentages indicated are based upon net assets as of December 31, 2006. The Portfolio’s composition is subject to change. |
| INCEPTION DATE | 1 YEAR | 5 YEAR | SINCE INCEPTION | |||||||||||||||
|---|---|---|---|---|---|---|---|---|---|---|---|---|---|---|---|---|---|---|
DIVERSIFIED MID CAP VALUE PORTFOLIO | 5/1/97 | 16.72 | % | 11.33 | % | 10.14 | % | |||||||||||
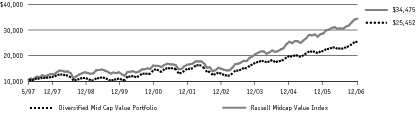
AS OF DECEMBER 31, 2006
| SHARES | | SECURITY DESCRIPTION | | VALUE($) | |||||||
|---|---|---|---|---|---|---|---|---|---|---|---|
Long-Term Investments — 99.0% | |||||||||||
Common Stocks — 99.0% | |||||||||||
Aerospace & Defense — 1.2% | |||||||||||
| 6,900 | Alliant Techsystems, Inc. (a) (c) | 539,511 | |||||||||
| 5,000 | L-3 Communications Holdings, Inc. | 408,900 | |||||||||
| 948,411 | |||||||||||
Beverages — 1.8% | |||||||||||
| 7,600 | Brown-Forman Corp., Class B | 503,424 | |||||||||
| 34,300 | Constellation Brands, Inc., Class A (a) | 995,386 | |||||||||
| 1,498,810 | |||||||||||
Building Products — 0.6% | |||||||||||
| 11,200 | American Standard Cos., Inc. | 513,520 | |||||||||
Capital Markets — 3.3% | |||||||||||
| 3,000 | Bear Stearns Cos., Inc. (The) | 488,340 | |||||||||
| 28,200 | E*Trade Financial Corp. (a) | 632,244 | |||||||||
| 6,700 | Legg Mason, Inc. | 636,835 | |||||||||
| 9,200 | Mellon Financial Corp. | 387,780 | |||||||||
| 9,200 | Northern Trust Corp. | 558,348 | |||||||||
| 2,703,547 | |||||||||||
Chemicals — 3.1% | |||||||||||
| 10,147 | Albemarle Corp. | 728,555 | |||||||||
| 12,000 | Lubrizol Corp. | 601,560 | |||||||||
| 6,500 | PPG Industries, Inc. | 417,365 | |||||||||
| 9,800 | Sigma-Aldrich Corp. | 761,656 | |||||||||
| 2,509,136 | |||||||||||
Commercial Banks — 5.9% | |||||||||||
| 15,000 | Compass Bancshares, Inc. | 894,750 | |||||||||
| 12,200 | Cullen/Frost Bankers, Inc. | 681,004 | |||||||||
| 5,300 | M&T Bank Corp. | 647,448 | |||||||||
| 10,800 | Mercantile Bankshares Corp. | 505,332 | |||||||||
| 21,900 | Synovus Financial Corp. | 675,177 | |||||||||
| 18,000 | TCF Financial Corp. | 493,560 | |||||||||
| 11,300 | Zions Bancorporation | 931,572 | |||||||||
| 4,828,843 | |||||||||||
Commercial Services & Supplies — 0.5% | |||||||||||
| 10,400 | Republic Services, Inc. | 422,968 | |||||||||
Computers & Peripherals — 1.0% | |||||||||||
| 19,700 | NCR Corp. (a) | 842,372 | |||||||||
Construction Materials — 1.7% | |||||||||||
| 8,450 | Florida Rock Industries, Inc. | 363,772 | |||||||||
| 11,000 | Vulcan Materials Co. | 988,570 | |||||||||
| 1,352,342 | |||||||||||
Containers & Packaging — 1.5% | |||||||||||
| 18,100 | Ball Corp. | 789,160 | |||||||||
| 9,700 | Temple-Inland, Inc. | 446,491 | |||||||||
| 1,235,651 | |||||||||||
Distributors — 0.8% | |||||||||||
| 13,600 | Genuine Parts Co. | 645,048 | |||||||||
Diversified Consumer Services — 0.3% | |||||||||||
| 8,600 | Sotheby’s Holdings, Inc., Class A (c) | 266,772 | |||||||||
Diversified Telecommunication Services — 1.7% | |||||||||||
| 19,100 | CenturyTel, Inc. | 833,906 | |||||||||
| 41,169 | Windstream Corp. | 585,423 | |||||||||
| 1,419,329 | |||||||||||
Electric Utilities — 4.1% | |||||||||||
| 20,500 | American Electric Power Co., Inc. | 872,890 | |||||||||
| 11,900 | Edison International | 541,212 | |||||||||
| 8,700 | FirstEnergy Corp. | 524,610 | |||||||||
| 18,500 | PPL Corp. | 663,040 | |||||||||
| 28,200 | Westar Energy, Inc. (c) | 732,072 | |||||||||
| 3,333,824 | |||||||||||
Electrical Equipment — 0.8% | |||||||||||
| 19,950 | Ametek, Inc. | 635,208 | |||||||||
Electronic Equipment & Instruments — 1.8% | |||||||||||
| 7,700 | Amphenol Corp., Class A | 478,016 | |||||||||
| 22,600 | Arrow Electronics, Inc. (a) | 713,030 | |||||||||
| 11,700 | Jabil Circuit, Inc. | 287,235 | |||||||||
| 1,478,281 | |||||||||||
Energy Equipment & Services — 0.7% | |||||||||||
| 7,100 | Complete Production Services, Inc. (a) | 150,520 | |||||||||
| 8,500 | Unit Corp. (a) | 411,825 | |||||||||
| 562,345 | |||||||||||
Food & Staples Retailing — 2.1% | |||||||||||
| 10,100 | BJ’s Wholesale Club, Inc. (a) | 314,211 | |||||||||
| 16,900 | Safeway, Inc. | 584,064 | |||||||||
| 22,800 | SUPERVALU, Inc. | 815,100 | |||||||||
| 1,713,375 | |||||||||||
Food Products — 2.3% | |||||||||||
| 17,500 | Dean Foods Co. (a) | 739,900 | |||||||||
| 38,500 | Del Monte Foods Co. | 424,655 | |||||||||
| 13,800 | Hershey Co. (The) | 687,240 | |||||||||
| 1,851,795 | |||||||||||
Gas Utilities — 2.7% | |||||||||||
| 11,500 | Energen Corp. | 539,810 | |||||||||
| 13,500 | ONEOK, Inc. | 582,120 | |||||||||
| 6,000 | Questar Corp. | 498,300 | |||||||||
| 21,400 | UGI Corp. | 583,792 | |||||||||
| 2,204,022 | |||||||||||
Health Care Providers & Services — 3.9% | |||||||||||
| 13,000 | Community Health Systems, Inc. (a) | 474,760 | |||||||||
| 21,100 | Coventry Health Care, Inc. (a) | 1,056,055 | |||||||||
| 8,200 | DaVita, Inc. (a) | 466,416 | |||||||||
| 5,353 | Henry Schein, Inc. (a) | 262,190 | |||||||||
| SHARES | | SECURITY DESCRIPTION | | VALUE($) | |||||||
|---|---|---|---|---|---|---|---|---|---|---|---|
Long-Term Investments — Continued | |||||||||||
Health Care Providers & Services — Continued | |||||||||||
| 13,300 | Omnicare, Inc. | 513,779 | |||||||||
| 7,700 | Quest Diagnostics, Inc. | 408,100 | |||||||||
| 3,181,300 | |||||||||||
Hotels, Restaurants & Leisure — 4.1% | |||||||||||
| 28,500 | Applebee’s International, Inc. (c) | 703,095 | |||||||||
| 25,000 | Hilton Hotels Corp. | 872,500 | |||||||||
| 10,100 | Marriott International, Inc., Class A | 481,972 | |||||||||
| 19,400 | OSI Restaurant Partners, Inc. | 760,480 | |||||||||
| 6,600 | Vail Resorts, Inc. (a) (c) | 295,812 | |||||||||
| 4,300 | Yum! Brands, Inc. | 252,840 | |||||||||
| 3,366,699 | |||||||||||
Household Durables — 2.4% | |||||||||||
| 4,600 | Centex Corp. | 258,842 | |||||||||
| 11,800 | Fortune Brands, Inc. | 1,007,602 | |||||||||
| 11,300 | Jarden Corp. (a) | 393,127 | |||||||||
| 5,400 | Lennar Corp., Class A | 283,284 | |||||||||
| 1,942,855 | |||||||||||
Household Products — 1.1% | |||||||||||
| 13,600 | Clorox Co. | 872,440 | |||||||||
Industrial Conglomerates — 1.1% | |||||||||||
| 6,900 | Carlisle Cos., Inc. | 541,650 | |||||||||
| 13,400 | Walter Industries, Inc. | 362,470 | |||||||||
| 904,120 | |||||||||||
Insurance — 8.8% | |||||||||||
| 22,000 | Assurant, Inc. | 1,215,500 | |||||||||
| 13,680 | Cincinnati Financial Corp. | 619,841 | |||||||||
| 4,400 | Everest Re Group Ltd. (Barbados) | 431,684 | |||||||||
| 16,313 | Fidelity National Financial, Inc., Class A | 389,555 | |||||||||
| 12,000 | Hanover Insurance Group, Inc. (The) | 585,600 | |||||||||
| 12,100 | IPC Holdings Ltd. (Bermuda) | 380,545 | |||||||||
| 49,312 | Old Republic International Corp. | 1,147,983 | |||||||||
| 10,900 | OneBeacon Insurance Group Ltd. (a) | 305,200 | |||||||||
| 7,600 | Principal Financial Group, Inc. | 446,120 | |||||||||
| 7,800 | ProAssurance Corp. (a) | 389,376 | |||||||||
| 12,300 | Protective Life Corp. | 584,250 | |||||||||
| 5,200 | Safeco Corp. | 325,260 | |||||||||
| 11,300 | W.R. Berkley Corp. | 389,963 | |||||||||
| 7,210,877 | |||||||||||
Internet & Catalog Retail — 0.6% | |||||||||||
| 21,000 | Liberty Media Holding Corp. – Interactive, Class A (a) | 452,970 | |||||||||
IT Services — 0.7% | |||||||||||
| 5,300 | Affiliated Computer Services, Inc., Class A (a) (c) | 258,852 | |||||||||
| 8,322 | Fidelity National Information Services, Inc. | 333,629 | |||||||||
| 592,481 | |||||||||||
Machinery — 2.4% | |||||||||||
| 12,100 | Crane Co. | 443,344 | |||||||||
| 10,500 | Dover Corp. | 514,710 | |||||||||
| 4,000 | Harsco Corp. | 304,400 | |||||||||
| 6,600 | Kennametal, Inc. | 388,410 | |||||||||
| 19,103 | Mueller Water Products, Inc. Class B (a) | 284,635 | |||||||||
| 1,935,499 | |||||||||||
Media — 3.7% | |||||||||||
| 10,200 | Cablevision Systems Corp., Class A | 290,496 | |||||||||
| 21,500 | Clear Channel Communications, Inc. | 764,110 | |||||||||
| 13,400 | Clear Channel Outdoor Holdings, Inc., Class A (a) | 373,994 | |||||||||
| 20,900 | Interactive Data Corp. | 502,436 | |||||||||
| 11,694 | McClatchy Co., Class A (c) | 506,350 | |||||||||
| 26,600 | Regal Entertainment Group, Class A | 567,112 | |||||||||
| 3,004,498 | |||||||||||
Multi-Utilities — 3.8% | |||||||||||
| 21,800 | Energy East Corp. | 540,640 | |||||||||
| 22,530 | MDU Resources Group, Inc. (c) | 577,669 | |||||||||
| 16,900 | NSTAR (c) | 580,684 | |||||||||
| 16,300 | PG&E Corp. | 771,479 | |||||||||
| 16,300 | SCANA Corp. | 662,106 | |||||||||
| 3,132,578 | |||||||||||
Multiline Retail — 0.5% | |||||||||||
| 10,538 | Federated Department Stores, Inc. | 401,814 | |||||||||
Office Electronics — 0.8% | |||||||||||
| 37,800 | Xerox Corp. (a) | 640,710 | |||||||||
Oil, Gas & Consumable Fuels — 4.8% | |||||||||||
| 10,800 | Consol Energy, Inc. | 347,004 | |||||||||
| 9,924 | Devon Energy Corp. | 665,702 | |||||||||
| 8,400 | Energy Transfer Equity LP | 263,760 | |||||||||
| 11,600 | Helix Energy Solutions Group, Inc. (a) (c) | 363,892 | |||||||||
| 9,600 | Kinder Morgan, Inc. | 1,015,200 | |||||||||
| 12,400 | Newfield Exploration Co. (a) | 569,780 | |||||||||
| 26,900 | Williams Cos., Inc. | 702,628 | |||||||||
| 3,927,966 | |||||||||||
Personal Products — 0.7% | |||||||||||
| 13,200 | Estee Lauder Cos., Inc. (The), Class A | 538,824 | |||||||||
Pharmaceuticals — 0.5% | |||||||||||
| 31,200 | Warner Chilcott Ltd., Class A (Bermuda) (a) | 431,184 | |||||||||
Real Estate Investment Trusts (REITs) — 8.3% | |||||||||||
| 4,100 | AMB Property Corp. | 240,301 | |||||||||
| 1,900 | AvalonBay Communities, Inc. | 247,095 | |||||||||
| 3,600 | Boston Properties, Inc. | 402,768 | |||||||||
| 19,000 | Cousins Properties, Inc. | 670,130 | |||||||||
| 10,800 | Douglas Emmett, Inc. (m) | 287,172 | |||||||||
| 13,500 | Host Hotels & Resorts, Inc. | 331,425 | |||||||||
AS OF DECEMBER 31, 2006 (continued)
| SHARES | | SECURITY DESCRIPTION | | VALUE($) | |||||||
|---|---|---|---|---|---|---|---|---|---|---|---|
Long-Term Investments — Continued | |||||||||||
Real Estate Investment Trusts (REITs) — Continued | |||||||||||
| 22,600 | iStar Financial, Inc. | 1,080,732 | |||||||||
| 9,900 | Kimco Realty Corp. | 445,005 | |||||||||
| 5,320 | Liberty Property Trust (c) | 261,425 | |||||||||
| 8,400 | Plum Creek Timber Co., Inc. | 334,740 | |||||||||
| 8,700 | PS Business Parks, Inc. | 615,177 | |||||||||
| 17,800 | Rayonier, Inc., | 730,690 | |||||||||
| 15,100 | Sunstone Hotel Investors, Inc. (c) | 403,623 | |||||||||
| 8,857 | United Dominion Realty Trust, Inc. (c) | 281,564 | |||||||||
| 3,400 | Vornado Realty Trust | 413,100 | |||||||||
| 6,744,947 | |||||||||||
Real Estate Management & Development — 1.6% | |||||||||||
| 19,700 | Brookfield Properties Co. | 774,801 | |||||||||
| 8,600 | Forest City Enterprises, Inc., Class A (c) | 502,240 | |||||||||
| 1,277,041 | |||||||||||
Road & Rail — 0.7% | |||||||||||
| 11,900 | Norfolk Southern Corp. | 598,451 | |||||||||
Specialty Retail — 5.8% | |||||||||||
| 3,800 | Abercrombie & Fitch Co. | 264,594 | |||||||||
| 23,779 | AutoNation, Inc. (a) | 506,968 | |||||||||
| 9,300 | AutoZone, Inc. (a) | 1,074,708 | |||||||||
| 7,600 | Bed Bath & Beyond, Inc. (a) | 289,560 | |||||||||
| 31,800 | Limited Brands, Inc. | 920,292 | |||||||||
| 22,900 | Tiffany & Co. | 898,596 | |||||||||
| 28,900 | TJX Cos., Inc. | 824,228 | |||||||||
| 4,778,946 | |||||||||||
Textiles, Apparel & Luxury Goods — 2.8% | |||||||||||
| 12,700 | Columbia Sportswear Co. (c) | 707,390 | |||||||||
| 19,000 | V.F. Corp. | 1,559,520 | |||||||||
| 2,266,910 | |||||||||||
Thrifts & Mortgage Finance — 1.5% | |||||||||||
| 41,500 | Hudson City Bancorp, Inc. | 576,020 | |||||||||
| 9,800 | MGIC Investment Corp. | 612,892 | |||||||||
| 1,188,912 | |||||||||||
Wireless Telecommunication Services — 0.5% | |||||||||||
| 7,600 | Telephone & Data Systems, Inc. | 376,960 | |||||||||
| Total Common Stocks (Cost $70,744,308) | 80,734,581 | ||||||||||
Short-Term Investment — 1.5% | |||||||||||
Investment Company — 1.5% | |||||||||||
| 1,214,969 | JPMorgan Liquid Assets Money Market Fund (b) (Cost $1,214,969) | 1,214,969 | |||||||||
| PRINCIPAL AMOUNT($) | | SECURITY DESCRIPTION | | VALUE($) | |||||||
|---|---|---|---|---|---|---|---|---|---|---|---|
Investments of Cash Collateral for Securities on Loan — 6.5% | |||||||||||
Certificate of Deposit — 1.2% | |||||||||||
| 999,738 | Societe Generale, New York, FRN, 5.34%, 06/20/07 | 999,738 | |||||||||
Corporate Notes — 4.4% | |||||||||||
| 1,000,000 | American Express Credit Corp., FRN, 5.36%, 01/15/08 | 1,000,000 | |||||||||
| 1,400,104 | Beta Finance, Inc., FRN, 5.38%, 03/15/07 | 1,400,104 | |||||||||
| 148,567 | MBIA Global Funding LLC, FRN, 5.45%, 01/26/07 | 148,567 | |||||||||
| 1,000,000 | Unicredito Italiano Bank plc, FRN, 5.36%, 01/29/08 | 1,000,000 | |||||||||
| 3,548,671 | |||||||||||
Repurchase Agreements — 0.9% | |||||||||||
| 500,011 | Banc of America Securities LLC, 5.32%, dated 12/29/06, due 01/02/07, repurchase price $500,307, collateralized by U.S. Government Agency Mortgages | 500,011 | |||||||||
| 215,517 | Lehman Brothers Inc, 5.31%, dated 12/29/06, due 01/02/07, repurchase price $215,644, collateralized by U.S. Government Agency Mortgages | 215,517 | |||||||||
| 715,528 | |||||||||||
| Total Investments of Cash Collateral for Securities on Loan (Cost $5,263,937) | 5,263,937 | ||||||||||
Total Investments — 107.0% (Cost $77,223,214) | 87,213,487 | ||||||||||
Other Liabilities in Excess of Assets — (7.0)% | (5,652,191 | ) | |||||||||
NET ASSETS — 100.0% | $ | 81,561,296 | |||||||||
| (a) — | Non-income producing security. |
| (b) — | Investment in affiliate. Money market fund registered under the Investment Company Act of 1940, as amended, and advised by JPMorgan Investment Advisors Inc. |
| (c) — | Security, or a portion of the security, has been delivered to a counterparty as part of a security lending transaction. |
| (m) — | All or a portion of this security is segregated for current or potential holdings of futures, swaps, options, TBA, when-issued securities, delayed delivery securities, and reverse repurchase agreements. |
| FRN — | Floating Rate Note. The rate shown is the rate in effect as of December 31, 2006. |
AS OF DECEMBER 31, 2006
| | Diversified Mid Cap Value Portfolio | |||||
|---|---|---|---|---|---|---|
ASSETS: | ||||||
| Investments in non-affiliates, at value | $ | 85,998,518 | ||||
| Investments in affiliates, at value | 1,214,969 | |||||
| Total investment securities, at value | 87,213,487 | |||||
| Cash | 3,278 | |||||
| Receivables: | ||||||
| Portfolio shares sold | 4,168 | |||||
| Interest and dividends | 143,758 | |||||
| Total Assets | 87,364,691 | |||||
LIABILITIES: | ||||||
| Payables: | ||||||
| Collateral for securities lending program | 5,263,937 | |||||
| Portfolio shares redeemed | 432,573 | |||||
| Accrued liabilities: | ||||||
| Investment advisory fees | 42,928 | |||||
| Administration fees | 6,460 | |||||
| Custodian and accounting fees | 6,997 | |||||
| Trustees’ and Officers’ fees | 1,535 | |||||
| Other | 48,965 | |||||
| Total Liabilities | 5,803,395 | |||||
| Net Assets | $ | 81,561,296 | ||||
NET ASSETS: | ||||||
| Paid in capital | $ | 40,229,146 | ||||
| Accumulated undistributed (distributions in excess of) net investment income | 1,268,704 | |||||
| Accumulated net realized gains (losses) | 30,073,173 | |||||
| Net unrealized appreciation (depreciation) | 9,990,273 | |||||
| Total Net Assets | $ | 81,561,296 | ||||
| Outstanding units of beneficial interest (shares) (unlimited amount authorized, no par value) | 4,905,545 | |||||
| Net asset value, offering and redemption price per share | $ | 16.63 | ||||
| Cost of investments | $ | 77,223,214 | ||||
| Market value of securities on loan | 5,142,008 | |||||
FOR THE YEAR ENDED DECEMBER 31, 2006
| | Diversified Mid Cap Value Portfolio | |||||
|---|---|---|---|---|---|---|
INVESTMENT INCOME: | ||||||
| Dividend income | $ | 2,373,933 | ||||
| Dividend income from affiliates (a) | 189,672 | |||||
| Income from securities lending (net) | 89,055 | |||||
| Foreign taxes withheld | (2,930 | ) | ||||
| Total investment income | 2,649,730 | |||||
EXPENSES: | ||||||
| Investment advisory fees | 1,004,809 | |||||
| Administration fees | 179,995 | |||||
| Custodian and accounting fees | 38,635 | |||||
| Interest expense | 428 | |||||
| Professional fees | 59,226 | |||||
| Trustees’ and Officers’ fees | 3,945 | |||||
| Printing and mailing costs | 94,210 | |||||
| Transfer agent fees | 10,813 | |||||
| Other | 23,083 | |||||
| Total expenses | 1,415,144 | |||||
| Less amounts waived | (82,186 | ) | ||||
| Less earnings credits | (662 | ) | ||||
| Net expenses | 1,332,296 | |||||
| Net investment income (loss) | 1,317,434 | |||||
REALIZED/UNREALIZED GAINS (LOSSES): | ||||||
| Net realized gain (loss) on transactions from investments | 30,214,814 | |||||
| Change in net unrealized appreciation (depreciation) of investments | (7,777,329 | ) | ||||
| Net realized/unrealized gains (losses) | 22,437,485 | |||||
| Change in net assets resulting from operations | $ | 23,754,919 | ||||
| (a) | Includes reimbursement of investment advisory, administration and shareholder servicing fees. See Fees and Other Transactions with Affiliates in the Notes to Financial Statements. |
FOR THE PERIODS INDICATED
| Diversified Mid Cap Value Portfolio | |||||||||||
|---|---|---|---|---|---|---|---|---|---|---|---|
| | Year Ended 12/31/2006 | | Year Ended 12/31/2005 | ||||||||
CHANGE IN NET ASSETS RESULTING FROM OPERATIONS: | |||||||||||
| Net investment income (loss) | $ | 1,317,434 | $ | 1,834,618 | |||||||
| Net realized gain (loss) | 30,214,814 | 23,526,137 | |||||||||
| Change in net unrealized appreciation (depreciation) | (7,777,329 | ) | (7,944,269 | ) | |||||||
| Change in net assets resulting from operations | 23,754,919 | 17,416,486 | |||||||||
DISTRIBUTIONS TO SHAREHOLDERS: | |||||||||||
| From net investment income | (1,830,573 | ) | (960,163 | ) | |||||||
| From net realized gains | (23,354,076 | ) | (11,103,619 | ) | |||||||
| Total distributions to shareholders | (25,184,649 | ) | (12,063,782 | ) | |||||||
CHANGE IN NET ASSETS FROM CAPITAL TRANSACTIONS: | |||||||||||
| Proceeds from shares issued | 30,251,933 | 90,608,851 | |||||||||
| Dividends reinvested | 25,184,649 | 12,063,782 | |||||||||
| Cost of shares redeemed | (186,962,795 | ) | (31,679,459 | ) | |||||||
| Change in net assets from capital transactions | (131,526,213 | ) | 70,993,174 | ||||||||
NET ASSETS: | |||||||||||
| Change in net assets | (132,955,943 | ) | 76,345,878 | ||||||||
| Beginning of period | 214,517,239 | 138,171,361 | |||||||||
| End of period | $ | 81,561,296 | $ | 214,517,239 | |||||||
| Accumulated undistributed (distributions in excess of) net investment income | $ | 1,268,704 | $ | 1,827,913 | |||||||
SHARE TRANSACTIONS: | |||||||||||
| Issued | 1,893,161 | 5,987,243 | |||||||||
| Reinvested | 1,663,451 | 825,720 | |||||||||
| Redeemed | (12,139,215 | ) | (2,057,526 | ) | |||||||
| Change in shares | (8,582,603 | ) | 4,755,437 | ||||||||
FOR THE PERIODS INDICATED
| | | | | Per share operating performance | | ||||||||||||||||||||||||||
|---|---|---|---|---|---|---|---|---|---|---|---|---|---|---|---|---|---|---|---|---|---|---|---|---|---|---|---|---|---|---|---|
| Investment operations | Distributions | ||||||||||||||||||||||||||||||
| | Net asset value, beginning of period | | Net investment income (loss) | | Net realized and unrealized gains (losses) on investments | | Total from investment operations | | Net investment income | | Net realized gains | | Total distributions | ||||||||||||||||||
Diversified Mid Cap Value Portfolio | |||||||||||||||||||||||||||||||
| Year Ended December 31, 2006 | $ | 15.90 | $ | 0.26 | $ | 2.23 | $ | 2.49 | $ | (0.13 | ) | $ | (1.63 | ) | $ | (1.76 | ) | ||||||||||||||
| Year Ended December 31, 2005 | 15.82 | 0.14 | 1.29 | 1.43 | (0.11 | ) | (1.24 | ) | (1.35 | ) | |||||||||||||||||||||
| Year Ended December 31, 2004 | 13.78 | 0.11 | 2.00 | 2.11 | (0.07 | ) | — | (0.07 | ) | ||||||||||||||||||||||
| Year Ended December 31, 2003 | 10.45 | 0.07 | 3.33 | 3.40 | (0.07 | ) | — | (0.07 | ) | ||||||||||||||||||||||
| Year Ended December 31, 2002 | 12.68 | 0.07 | (1.55 | ) | (1.48 | ) | — | (0.75 | ) | (0.75 | ) | ||||||||||||||||||||
| (a) | Includes adjustments in accordance with accounting principles generally accepted in the United States of America and as such, the net asset value for financial reporting purposes and the returns based upon those net asset values may differ from the net asset value and returns for shareholder transactions. |
| | Ratios/Supplemental data | ||||||||||||||||||||||||||
|---|---|---|---|---|---|---|---|---|---|---|---|---|---|---|---|---|---|---|---|---|---|---|---|---|---|---|---|
| Ratios to average net assets | |||||||||||||||||||||||||||
| Net asset value, end of period | | Total return (a) | | Net assets end of period (000’s) | | Net expenses | | Net investment income (loss) | | Expenses without waivers, reimbursements and earnings credits | | Portfolio turnover rate | |||||||||||||||
| $16.63 | 16.72 | % | $ | 81,561 | 0.93 | % | 0.91 | % | 0.98 | % | 51 | % | |||||||||||||||
| 15.90 | 9.75 | 214,517 | 0.94 | 1.05 | 0.94 | 55 | |||||||||||||||||||||
| 15.82 | 15.40 | 138,171 | 0.92 | 0.81 | 0.93 | 75 | |||||||||||||||||||||
| 13.78 | 32.75 | 112,372 | 0.93 | 0.65 | 0.97 | 54 | |||||||||||||||||||||
| 10.45 | (12.85 | ) | 76,913 | 0.95 | 0.61 | 0.98 | 106 | ||||||||||||||||||||
AS OF DECEMBER 31, 2006
| | Class Offered | |||||
|---|---|---|---|---|---|---|
| Diversified Mid Cap Value Portfolio | Class 1 | |||||
contained in the Securities Lending Agreement. For loans secured by cash, the Portfolio retains the interest on cash collateral investments but is required to pay the borrower a portion of such interest for the use of the cash collateral. For loans secured by U.S. government securities, the borrower pays a borrower fee to the lending agent on behalf of the Portfolio. The net income earned on the securities lending (after payment of rebates and the lending agent’s fee) is included in the Statement of Operations as Income from securities lending (net). Information on the investment of cash collateral is shown in the Schedule of Portfolio Investments.
| | Lending Agent Fees Paid | | Market Value of Collateral | | Market Value of Loaned Securities | |||||||||
|---|---|---|---|---|---|---|---|---|---|---|---|---|---|---|
| $ | 8,394 | $ | 5,263,937 | $ | 5,142,008 | |||||||||
| | Paid-in-capital | | Accumulated Undistributed/ (Overdistributed) Net Investment Income | | Accumulated Net Realized Gain (Loss) on Investments | |||||||||
|---|---|---|---|---|---|---|---|---|---|---|---|---|---|---|
| $ | 46,271 | $ | (46,070 | ) | $ | (201 | ) | |||||||
AS OF DECEMBER 31, 2006 (continued)
| | Purchases (excluding U.S. Government) | | Sales (excluding U.S. Government) | |||||||
|---|---|---|---|---|---|---|---|---|---|---|
| $ | 73,471,215 | $ | 220,154,667 | |||||||
| | Aggregate Cost | | Gross Unrealized Appreciation | | Gross Unrealized Depreciation | | Net Unrealized Appreciation (Depreciation) | |||||||||||
|---|---|---|---|---|---|---|---|---|---|---|---|---|---|---|---|---|---|---|
| $ | 77,378,684 | $ | 10,562,393 | $ | 727,590 | $ | 9,834,803 | |||||||||||
| Total Distributions Paid From: | ||||||||||||||
|---|---|---|---|---|---|---|---|---|---|---|---|---|---|---|
| | Ordinary Income | | Net Long-Term Capital Gains | | Total Distributions Paid | |||||||||
| $ | 7,108,137 | $ | 18,076,512 | $ | 25,184,649 | |||||||||
| Total Distributions Paid From: | ||||||||||||||
|---|---|---|---|---|---|---|---|---|---|---|---|---|---|---|
| | Ordinary Income | | Net Long-Term Capital Gains | | Total Distributions Paid | |||||||||
| $ | 960,163 | $ | 11,103,619 | $ | 12,063,782 | |||||||||
AS OF DECEMBER 31, 2006 (continued)
| | Current Distributable Ordinary Income | | Distributable Long-Term Capital Gain or (Tax Basis Capital Loss Carryover) | | Unrealized Appreciation (Depreciation) | |||||||||
|---|---|---|---|---|---|---|---|---|---|---|---|---|---|---|
| $ | 10,847,595 | $ | 20,653,367 | $ | 9,834,803 | |||||||||
JPMorgan Insurance Trust Diversified Mid Cap Value Portfolio:
New York, New York
February 15, 2007
(Unaudited)
| Name (Year of Birth); Positions With the Portfolio | | Principal Occupations During Past 5 Years | | Number of Portfolios in Fund Complex Overseen by Trustee (1) | | Other Directorships Held Outside Fund Complex | |||||||||
|---|---|---|---|---|---|---|---|---|---|---|---|---|---|---|---|
Independent Trustees | |||||||||||||||
| William J. Armstrong (1941); Trustee since 2005; Trustee of heritage JPMorgan Funds since 1987. | Retired; CFO and Consultant, EduNeering, Inc. (internet business education supplier) (2000–2001); Vice President and Treasurer, Ingersoll–Rand Company (manufacturer of industrial equipment) (1972–2000). | 131 | None. | ||||||||||||
| Roland R. Eppley, Jr. (1932); Trustee since 2005; Trustee of heritage JPMorgan Funds since 1989. | Retired; President and Chief Executive Officer, Eastern States Bankcard (1971–1988). | 131 | None. | ||||||||||||
| John F. Finn (1947); Trustee since 2005; Trustee of heritage One Group Mutual Funds since 1998. | President and Chief Executive Officer, Gardner, Inc. (wholesale distributor to outdoor power equipment industry) (1979–present). | 131 | Director, Cardinal Health, Inc (CAH) (1994–present); Chairman, The Columbus Association of the Performing Arts (CAPA) (2003–present). | ||||||||||||
| Dr. Matthew Goldstein (1941); Trustee since 2005; Trustee of heritage JPMorgan Funds since 2003. | Chancellor, City University of New York (1999–present); President, Adelphi University (New York) (1998–1999). | 131 | Director, Albert Einstein School of Medicine (1998–present); Director, New Plan Excel Realty Trust, Inc. (real estate investment trust) (2000–present); Director, Lincoln Center Institute for the Arts in Education (1999–present). | ||||||||||||
| Robert J. Higgins (1945); Trustee since 2005; Trustee of heritage JPMorgan Funds since 2002. | Retired; Director of Administration of the State of Rhode Island (2003–2004); President — Consumer Banking and Investment Services, Fleet Boston Financial (1971–2001). | 131 | None. | ||||||||||||
| Peter C. Marshall (1942); Trustee since 2005; Trustee of heritage One Group Mutual Funds since 1994. | Self-employed business consultant (2001–present); Senior Vice President, W.D. Hoard, Inc. (corporate parent of DCI Marketing, Inc.) (2000–2002); President, DCI Marketing, Inc. (1992–2000). | 131 | None. | ||||||||||||
| Marilyn McCoy (1948); Trustee since 2005; Trustee of heritage One Group Mutual Funds since 1999. | Vice President of Administration and Planning, Northwestern University (1985–present). | 131 | Trustee, Mather LifeWays (1994–present); Trustee, Carleton College (2003–present). | ||||||||||||
| William G. Morton, Jr. (1937); Trustee since 2005; Trustee of heritage JPMorgan Funds since 2003. | Retired; Chairman Emeritus (2001–2002), and Chairman and Chief Executive Officer, Boston Stock Exchange (1985–2001). | 131 | Director, Radio Shack Corporation (electronics) (1987–present); Director, The National Football Foundation and College Hall of Fame (1994–present); Trustee, Stratton Mountain School (2001–present). | ||||||||||||
| Name (Year of Birth); Positions With the Portfolio | | Principal Occupations During Past 5 Years | | Number of Portfolios in Fund Complex Overseen by Trustee (1) | | Other Directorships Held Outside Fund Complex | |||||||||
|---|---|---|---|---|---|---|---|---|---|---|---|---|---|---|---|
Independent Trustees (continued) | |||||||||||||||
| Robert A. Oden, Jr. (1946); Trustee since 2005; Trustee of heritage One Group Mutual Funds since 1997. | President, Carleton College (2002–present); President, Kenyon College (1995–2002). | 131 | Director, American University in Cairo. | ||||||||||||
| Fergus Reid, III (1932); Trustee (Chairman) since 2005; Trustee (Chairman) of heritage JPMorgan Funds since 1987. | Chairman, Lumelite Corporation (plastics manufacturing) (2003–present); Chairman and Chief Executive Officer, Lumelite Corporation (1985–2002). | 131 | Trustee, Morgan Stanley Funds (196 portfolios) (1995–present). | ||||||||||||
| Frederick W. Ruebeck (1939); Trustee since 2005; Trustee of heritage One Group Mutual Funds since 1994. | Advisor, Jerome P. Green & Associates, LLC (broker-dealer) (2000–present); Chief Investment Officer, Wabash College (2004–present); self-employed consultant (2000–present); Director of Investments, Eli Lilly and Company (1988–1999). | 131 | Trustee, Wabash College (1988–present); Chairman, Indianapolis Symphony Orchestra Foundation (1994–present). | ||||||||||||
| James J. Schonbachler (1943); Trustee since 2005; Trustee of heritage JPMorgan Funds since 2001. | Retired; Managing Director of Bankers Trust Company (financial services) (1968–1998). | 131 | None. | ||||||||||||
Interested Trustee | |||||||||||||||
| Leonard M. Spalding, Jr.* (1935); Trustee since 2005; Trustee of heritage JPMorgan Funds since 1998. | Retired; Chief Executive Officer, Chase Mutual Funds (investment company) (1989–1998); President and Chief Executive Officer, Vista Capital Management (investment management) (1990–1998); Chief Investment Executive, Chase Manhattan Private Bank (investment management) (1990–1998). | 131 | Director, Glenview Trust Company, LLC (2001–present); Trustee, St. Catherine College (1998–present); Trustee, Bellarmine University (2000–present); Director, Springfield-Washington County Economic Development Authority (1997–present); Trustee, Marion and Washington County, Kentucky Airport Board (1998–present); Trustee, Catholic Education Foundation (2005–present). | ||||||||||||
| (1) | A Fund Complex means two or more registered investment companies that hold themselves out to investors as related companies for purposes of investment and investor services or have a common investment adviser or have an investment adviser that is an affiliated person of the investment adviser of any of the other registered investment companies. The JPMorgan Funds Complex for which the Board of Trustees serves currently includes eight registered investment companies (131 funds). |
| * | Mr. Spalding is deemed to be an “interested person” due to his ownership of JPMorgan Chase stock. |
(Unaudited)
| Name (Year of Birth), Positions Held with the Trust | | Principal Occupations During Past 5 Years | ||||
|---|---|---|---|---|---|---|
| George C.W. Gatch (1962), President since 2005 | Managing Director, J.P. Morgan Investment Management Inc.; Director and President, JPMorgan Distribution Services, Inc. and JPMorgan Funds Management, Inc. since 2005. Mr. Gatch is CEO and President of the JPMorgan Funds. Mr. Gatch has been an employee of JPMorgan since 1986 and has held positions such as President and CEO of DKB Morgan, a Japanese mutual fund company, which was a joint venture between J.P. Morgan and Dai-Ichi Kangyo Bank, as well as positions in business management, marketing and sales. | |||||
| Robert L. Young (1963), Senior Vice President since 2005* | Director and Vice President, JPMorgan Distribution Services, Inc. and JPMorgan Funds Management, Inc.; Chief Operating Officer, JPMorgan Funds since 2005, and One Group Mutual Funds from 2001 until 2005. Mr. Young was Vice President and Treasurer, JPMorgan Funds Management, Inc. (formerly One Group Administrative Services) and Vice President and Treasurer, JPMorgan Distribution Services, Inc. (formerly One Group Dealer Services, Inc.) from 1999 to 2005. | |||||
| Patricia A. Maleski (1960), Vice President and Chief Administrative Officer since 2005 | Managing Director, JPMorgan Funds Management, Inc.; previously, Treasurer, JPMorgan Funds and Head of Funds Administration and Board Liaison. Ms. Maleski was Vice President of Finance for the Pierpont Group, Inc. from 1996–2001, an independent company owned by the Board of Directors/Trustees of the JPMorgan Funds, prior to joining JPMorgan Chase & Co. in 2001. | |||||
| Stephanie J. Dorsey (1969), Treasurer since 2005* | Vice President, JPMorgan Funds Management, Inc.; Director of Mutual Fund Administration, JPMorgan Funds Management, Inc. (formerly One Group Administrative Services), from 2004 to 2005; Ms. Dorsey worked for JPMorgan Chase & Co., (formerly Bank One Corporation) from 2003 to 2004; prior to joining Bank One Corporation, she was a Senior Manager specializing in Financial Services audits at PricewaterhouseCoopers LLP from 1992 through 2002. | |||||
| Stephen M. Ungerman (1953), Chief Compliance Officer since 2005 | Senior Vice President, JPMorgan Chase & Co.; Mr. Ungerman was head of Fund Administration — Pooled Vehicles from 2000 to 2004. Mr. Ungerman held a number of positions in Prudential Financial’s asset management business prior to 2000. | |||||
| Paul L. Gulinello (1950), AML Compliance Officer since 2005 | Vice President and Anti Money Laundering Compliance Officer for JPMorgan Asset Management Americas, additionally responsible for personal trading and compliance testing since 2004; Treasury Services Operating Risk Management and Compliance Executive supporting all JPMorgan Treasury Services business units from July 2000 to 2004. | |||||
| Stephen M. Benham (1959), Secretary since 2005 | Vice President and Assistant General Counsel, JPMorgan Chase & Co. since 2004; Vice President (Legal Advisory) of Merrill Lynch Investment Managers, L.P. from 2000 to 2004. | |||||
| Elizabeth A. Davin (1964), Assistant Secretary since 2005* | Vice President and Assistant General Counsel, JPMorgan Chase & Co. since 2005; Senior Counsel, JPMorgan Chase & Co. (formerly Bank One Corporation) from 2004 to 2005; Assistant General Counsel and Associate General Counsel and Vice President, Gartmore Global Investments, Inc. from 1999 to 2004. | |||||
| Jessica K. Ditullio (1962), Assistant Secretary since 2005* | Vice President and Assistant General Counsel, JPMorgan Chase & Co. since 2005; Ms. Ditullio has served as an attorney with various titles for JPMorgan Chase & Co. (formerly Bank One Corporation) since 1990. | |||||
| Nancy E. Fields (1949), Assistant Secretary since 2005* | Vice President, JPMorgan Funds Management, Inc. and JPMorgan Distribution Services, Inc.; From 1999 to 2005, Director, Mutual Fund Administration, JPMorgan Funds Management, Inc. (formerly One Group Administrative Services) and Senior Project Manager, Mutual Funds, JPMorgan Distribution Services, Inc. (formerly One Group Dealer Services, Inc.). | |||||
| Michael C. Raczynski (1975), Assistant Secretary since 2006 | Vice President and Assistant General Counsel, JPMorgan Chase & Co. since 2006; Associate, Stroock & Stroock & Lavan LLP from 2001 to 2006. | |||||
| Ellen W. O’Brien (1957), Assistant Secretary since 2005** | Assistant Vice President, JPMorgan Investor Services, Co., responsible for Blue Sky registration. Ms. O’Brien has served in this capacity since joining the firm in 1991. | |||||
| Name (Year of Birth), Positions Held with the Trust | | Principal Occupations During Past 5 Years | ||||
|---|---|---|---|---|---|---|
| Laura S. Melman (1966) Assistant Treasurer since 2006 | Vice President, JPMorgan Funds Management, Inc. since August, 2006, responsible for Taxation; Vice President of Structured Products at The Bank of New York Co., Inc. from 2001 to 2006. | |||||
| Arthur A. Jensen (1966), Assistant Treasurer since 2005* | Vice President, JPMorgan Funds Management, Inc. since April 2005; formerly, Vice President of Financial Services of BISYS Fund Services, Inc. from 2001 to 2005; Mr. Jensen was Section Manager at Northern Trust Company and Accounting Supervisor at Allstate Insurance Company prior to 2001. | |||||
| Jeffrey D. House (1972) Assistant Treasurer since 2006* | Vice President, JPMorgan Funds Management, Inc. since July 2006; formerly, Senior Manager of Financial Services at BISYS Fund Services, Inc. from 1995 to 2006. | |||||
| * | The contact address for the officer is 1111 Polaris Parkway, Columbus, OH 43271. |
| ** | The contact address for the officer is 73 Tremont Street, Floor 1, Boston MA 02108. |
(Unaudited)
December 31, 2006
| | Beginning Account Value, July 1, 2006 | | Ending Account Value, December 31, 2006 | | Expenses Paid During July 1 to December 31, 2006* | | Annualized Expense Ratio | |||||||||||
|---|---|---|---|---|---|---|---|---|---|---|---|---|---|---|---|---|---|---|
| Actual | $ | 1,000.00 | $ | 1,112.40 | $ | 4.79 | 0.90 | % | ||||||||||
| Hypothetical | 1,000.00 | 1,020.67 | 4.58 | 0.90 | ||||||||||||||
| * | Expenses are equal to the Portfolio’s annualized expense ratio, multiplied by the average account value over the period, multiplied by 184/365 (to reflect the one-half year period). |
(Unaudited)
(Unaudited) (continued)
contractual services provided to the Funds, less expenses of providing such services. Expenses include direct and indirect costs and are calculated using an allocation methodology developed by the Advisor. The Trustees also recognized that it is difficult to make comparisons of profitability from fund investment advisory contracts because comparative information is not generally publicly available and is affected by numerous factors, including the structure of the particular Advisor, the types of funds it manages, its business mix, numerous assumptions regarding allocations and the fact that publicly-traded fund managers’ operating profits and net income are net of distribution and marketing expenses. Based on their review, the Trustees concluded that the profitability to the Advisor of each of the Investment Advisory Agreements was not unreasonable in light of the services and benefits provided to each Fund.
respectively. The Trustees also noted that the Advisor had made a change to the Portfolio’s portfolio management team during the last twelve months. The Trustees discussed the performance of the Portfolio with the Advisor and were satisfied with the actions being taken.
(Unaudited)
© JPMorgan Chase & Co., 2007 All rights reserved. December 2006. | AN-JPMITDMCVP-1206 |
This material must be preceded or accompanied by a current prospectus.
| President’s Letter | 1 | |||||
| Portfolio Commentary: | ||||||
| JPMorgan Insurance Trust Equity Index Portfolio | 2 | |||||
| Schedule of Portfolio Investments | 4 | |||||
| Financial Statements | 13 | |||||
| Financial Highlights | 16 | |||||
| Notes to Financial Statements | 18 | |||||
| Report of Independent Registered Public Accounting Firm | 23 | |||||
| Trustees | 24 | |||||
| Officers | 26 | |||||
| Schedule of Shareholder Expenses | 28 | |||||
| Board Approval of Investment Advisory Agreement | 29 | |||||
| Tax Letter | 32 |
| • | Fed’s tightening cycle gained traction in the economy |
| • | Markets buoyed by falling oil prices, solid corporate profits and a robust mergers-and-acquisitions environment |
| • | Home sales stabilized toward year-end but were offset somewhat by amount of unsold homes |
| • | Consumer spending likely to moderate as job gains decrease |
JANUARY 5, 2007 (Unaudited)
| “We expect economic growth to remain subdued over the next few quarters, keeping the pressure off inflation.” |
President
JPMorgan Funds
AS OF DECEMBER 31, 2006 (Unaudited)
| PORTFOLIO FACTS | | |||||
|---|---|---|---|---|---|---|
| Portfolio Inception | May 1, 1998 | |||||
| Fiscal Year End | December 31 | |||||
| Net Assets as of 12/31/06 | $144,097,371 | |||||
| Primary Benchmark | S&P 500 Index | |||||
Q: | HOW DID THE PORTFOLIO PERFORM? |
A: | The JPMorgan Insurance Trust Equity Index Portfolio, which seeks investment results that correspond to the aggregate price and dividend performance of securities in the S&P 500 Index, returned 15.42% (Class 1 Shares) over the 12 months ended December 31, 2006, compared to the 15.80% return for the S&P 500 Index over the same period.* |
Q: | WHY DID THE PORTFOLIO PERFORM THIS WAY? |
A: | During the 12-month period, U.S. equity markets posted strong returns, with the S&P 500 Index returning 15.80% for the year. Positive corporate earnings, a hold on raising rates by the Federal Reserve, nearly flat oil prices for the year and mergers-and-acquisition activity propelled the market higher. At the sector level, all sectors produced positive returns within the S&P 500 for the year. Among the largest contributors to performance were the telecommunication services and energy sectors, both with returns of over 20%. Among the largest detractors from performance were the healthcare and information technology sectors, with positive returns in the middle single-digit range. |
Q: | HOW WAS THE PORTFOLIO MANAGED? |
A: | The Portfolio as always was managed in strict conformity with its full replication index strategy, which holds the same stocks in the same proportions as those found in the benchmark. The Portfolio is nearly always 100% invested. This is accomplished by using exchange-traded funds and index futures contracts at the margin to invest and divest daily cash flows. The transaction costs associated with implementing the strategy are minimized to lessen their impact on performance. Securities lending is employed, allowing for additional income generation. Regardless of the market outlook, the Portfolio’s strategy does not change, continuing to follow the full replication index strategy with extremely limited active risk compared to the benchmark. |
| Exxon Mobil Corp. | 3.5 | % | ||||
| General Electric Co. | 3.0 | |||||
| Citigroup, Inc. | 2.1 | |||||
| Microsoft Corp. | 2.0 | |||||
| Bank of America Corp. | 1.9 | |||||
| Procter & Gamble Co. | 1.6 | |||||
| Johnson & Johnson | 1.5 | |||||
| Pfizer, Inc. | 1.5 | |||||
| American International Group, Inc. | 1.5 | |||||
| Altria Group, Inc. | 1.4 |
| Financials | 22.1 | % | ||||
| Information Technology | 15.0 | |||||
| Health Care | 11.9 | |||||
| Consumer Discretionary | 10.7 | |||||
| Industrials | 10.7 | |||||
| Energy | 9.7 | |||||
| Consumer Staples | 9.2 | |||||
| Telecommunication Services | 3.5 | |||||
| Utilities | 3.5 | |||||
| Materials | 3.0 | |||||
| Investment Company | 0.1 | |||||
| Short-Term Investments | 0.7 | |||||
| Investments of Cash Collateral for Securities on Loan | 4.8 |
| * | The advisor seeks to achieve the Portfolio’s objective. There can be no guarantee it will be achieved. |
| ** | Percentages indicated are based upon net assets as of December 31, 2006. The Portfolio’s composition is subject to change. |
| INCEPTION DATE | 1 YEAR | 5 YEAR | SINCE INCEPTION | |||||||||||||||
|---|---|---|---|---|---|---|---|---|---|---|---|---|---|---|---|---|---|---|
EQUITY INDEX PORTFOLIO | 5/01/98 | 15.42 | % | 5.71 | % | 3.97 | % | |||||||||||
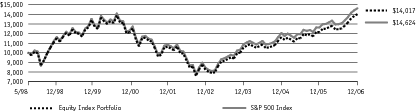
AS OF DECEMBER 31, 2006
| SHARES | | SECURITY DESCRIPTION | | VALUE($) | |||||||
|---|---|---|---|---|---|---|---|---|---|---|---|
Long-Term Investments — 99.4% (m) | |||||||||||
Common Stocks — 99.3% | |||||||||||
Aerospace & Defense — 2.4% | |||||||||||
| 8,897 | Boeing Co. | 790,410 | |||||||||
| 4,549 | General Dynamics Corp. | 338,218 | |||||||||
| 1,397 | Goodrich Corp. | 63,633 | |||||||||
| 9,181 | Honeywell International, Inc. | 415,349 | |||||||||
| 1,402 | L-3 Communications Holdings, Inc. | 114,656 | |||||||||
| 4,002 | Lockheed Martin Corp. | 368,464 | |||||||||
| 3,879 | Northrop Grumman Corp. | 262,608 | |||||||||
| 5,003 | Raytheon Co. (c) | 264,158 | |||||||||
| 1,884 | Rockwell Collins, Inc. | 119,238 | |||||||||
| 11,290 | United Technologies Corp. | 705,851 | |||||||||
| 3,442,585 | |||||||||||
Air Freight & Logistics — 0.9% | |||||||||||
| 3,448 | FedEx Corp. | 374,522 | |||||||||
| 12,074 | United Parcel Service, Inc., Class B | 905,308 | |||||||||
| 1,279,830 | |||||||||||
Airlines — 0.1% | |||||||||||
| 8,902 | Southwest Airlines Co. | 136,379 | |||||||||
Auto Components — 0.2% | |||||||||||
| 1,992 | Goodyear Tire & Rubber Co. (The) (a) (c) | 41,812 | |||||||||
| 2,197 | Johnson Controls, Inc. | 188,766 | |||||||||
| 230,578 | |||||||||||
Automobiles — 0.4% | |||||||||||
| 21,238 | Ford Motor Co. (c) | 159,497 | |||||||||
| 6,356 | General Motors Corp. (c) | 195,256 | |||||||||
| 2,921 | Harley-Davidson, Inc. (c) | 205,843 | |||||||||
| 560,596 | |||||||||||
Beverages — 2.0% | |||||||||||
| 8,645 | Anheuser-Busch Cos., Inc. | 425,334 | |||||||||
| 882 | Brown-Forman Corp., Class B (c) | 58,424 | |||||||||
| 22,931 | Coca-Cola Co. (The) | 1,106,421 | |||||||||
| 3,112 | Coca-Cola Enterprises, Inc. | 63,547 | |||||||||
| 2,360 | Constellation Brands, Inc., Class A (a) (c) | 68,487 | |||||||||
| 517 | �� | Molson Coors Brewing Co., Class B | 39,519 | ||||||||
| 1,538 | Pepsi Bottling Group, Inc. | 47,539 | |||||||||
| 18,463 | PepsiCo, Inc. | 1,154,861 | |||||||||
| 2,964,132 | |||||||||||
Biotechnology — 1.3% | |||||||||||
| 13,117 | Amgen, Inc. (a) | 896,022 | |||||||||
| 3,794 | Biogen Idec, Inc. (a) | 186,627 | |||||||||
| 4,184 | Celgene Corp. (a) | 240,706 | |||||||||
| 2,954 | Genzyme Corp. (a) | 181,907 | |||||||||
| 5,169 | Gilead Sciences, Inc. (a) | 335,623 | |||||||||
| 2,686 | MedImmune, Inc. (a) | 86,946 | |||||||||
| 1,927,831 | |||||||||||
Building Products — 0.1% | |||||||||||
| 1,956 | American Standard Cos., Inc. | 89,683 | |||||||||
| 4,436 | Masco Corp. | 132,503 | |||||||||
| 222,186 | |||||||||||
Capital Markets — 3.8% | |||||||||||
| 2,723 | Ameriprise Financial, Inc. | 148,404 | |||||||||
| 8,593 | Bank of New York Co., Inc. (The) | 338,306 | |||||||||
| 1,320 | Bear Stearns Cos., Inc. (The) | 214,870 | |||||||||
| 11,503 | Charles Schwab Corp. (The) | 222,468 | |||||||||
| 4,796 | E*Trade Financial Corp. (a) | 107,526 | |||||||||
| 1,016 | Federated Investors, Inc., Class B (c) | 34,320 | |||||||||
| 1,872 | Franklin Resources, Inc. | 206,238 | |||||||||
| 4,792 | Goldman Sachs Group, Inc. | 955,285 | |||||||||
| 2,231 | Janus Capital Group, Inc. | 48,167 | |||||||||
| 1,475 | Legg Mason, Inc. | 140,199 | |||||||||
| 5,966 | Lehman Brothers Holdings, Inc. | 466,064 | |||||||||
| 4,626 | Mellon Financial Corp. | 194,986 | |||||||||
| 9,936 | Merrill Lynch & Co., Inc. | 925,042 | |||||||||
| 11,909 | Morgan Stanley | 969,750 | |||||||||
| 2,103 | Northern Trust Corp. | 127,631 | |||||||||
| 3,732 | State Street Corp. | 251,686 | |||||||||
| 2,960 | T. Rowe Price Group, Inc. | 129,559 | |||||||||
| 5,480,501 | |||||||||||
Chemicals — 1.5% | |||||||||||
| 2,477 | Air Products & Chemicals, Inc. | 174,084 | |||||||||
| 647 | Ashland, Inc. | 44,759 | |||||||||
| 10,741 | Dow Chemical Co. (The) | 428,996 | |||||||||
| 10,343 | E.I. du Pont de Nemours & Co. | 503,808 | |||||||||
| 920 | Eastman Chemical Co. | 54,565 | |||||||||
| 2,001 | Ecolab, Inc. | 90,445 | |||||||||
| 1,275 | Hercules, Inc. (a) | 24,620 | |||||||||
| 883 | International Flavors & Fragrances, Inc. (c) | 43,408 | |||||||||
| 6,104 | Monsanto Co. | 320,643 | |||||||||
| 1,857 | PPG Industries, Inc. | 119,238 | |||||||||
| 3,629 | Praxair, Inc. | 215,309 | |||||||||
| 1,603 | Rohm & Haas Co. (c) | 81,945 | |||||||||
| 748 | Sigma-Aldrich Corp. (c) | 58,135 | |||||||||
| 2,159,955 | |||||||||||
Commercial Banks — 4.1% | |||||||||||
| 6,077 | BB&T Corp. (c) | 266,963 | |||||||||
| 1,787 | Comerica, Inc. | 104,861 | |||||||||
| 2,103 | Commerce Bancorp, Inc. (c) | 74,173 | |||||||||
| SHARES | | SECURITY DESCRIPTION | | VALUE($) | |||||||
|---|---|---|---|---|---|---|---|---|---|---|---|
Long-Term Investments — Continued | |||||||||||
Commercial Banks — Continued | |||||||||||
| 1,456 | Compass Bancshares, Inc. (c) | 86,850 | |||||||||
| 6,275 | Fifth Third Bancorp (c) | 256,836 | |||||||||
| 1,396 | First Horizon National Corp. (c) | 58,325 | |||||||||
| 2,667 | Huntington Bancshares, Inc. | 63,341 | |||||||||
| 4,514 | Keycorp | 171,667 | |||||||||
| 875 | M&T Bank Corp. (c) | 106,890 | |||||||||
| 2,868 | Marshall & Ilsley Corp. | 137,979 | |||||||||
| 7,101 | National City Corp. | 259,613 | |||||||||
| 3,299 | PNC Financial Services Group, Inc. | 244,258 | |||||||||
| 8,195 | Regions Financial Corp. | 306,493 | |||||||||
| 3,988 | SunTrust Banks, Inc. | 336,787 | |||||||||
| 3,651 | Synovus Financial Corp. | 112,560 | |||||||||
| 19,772 | U.S. Bancorp | 715,549 | |||||||||
| 21,429 | Wachovia Corp. | 1,220,381 | |||||||||
| 37,960 | Wells Fargo & Co. | 1,349,858 | |||||||||
| 1,198 | Zions Bancorporation | 98,763 | |||||||||
| 5,972,147 | |||||||||||
Commercial Services & Supplies — 0.5% | |||||||||||
| 2,854 | Allied Waste Industries, Inc. (a) (c) | 35,076 | |||||||||
| 1,060 | Avery Dennison Corp. | 72,006 | |||||||||
| 1,533 | Cintas Corp. | 60,875 | |||||||||
| 1,409 | Equifax, Inc. | 57,205 | |||||||||
| 1,440 | Monster Worldwide, Inc. (a) | 67,161 | |||||||||
| 2,493 | Pitney Bowes, Inc. | 115,152 | |||||||||
| 2,433 | R.R. Donnelley & Sons Co. | 86,469 | |||||||||
| 1,885 | Robert Half International, Inc. | 69,971 | |||||||||
| 6,022 | Waste Management, Inc. | 221,429 | |||||||||
| 785,344 | |||||||||||
Communications Equipment — 2.7% | |||||||||||
| 1,316 | ADC Telecommunications, Inc. (a) (c) | 19,121 | |||||||||
| 5,107 | Avaya, Inc. (a) | 71,396 | |||||||||
| 945 | Ciena Corp. (a) (c) | 26,186 | |||||||||
| 68,299 | Cisco Systems, Inc. (a) | 1,866,612 | |||||||||
| 2,269 | Comverse Technology, Inc. (a) | 47,899 | |||||||||
| 17,589 | Corning, Inc. (a) | 329,090 | |||||||||
| 2,370 | JDS Uniphase Corp. (a) (c) | 39,484 | |||||||||
| 6,358 | Juniper Networks, Inc. (a) | 120,421 | |||||||||
| 27,193 | Motorola, Inc. | 559,088 | |||||||||
| 18,582 | QUALCOMM, Inc. | 702,214 | |||||||||
| 4,971 | Tellabs, Inc. (a) | 51,002 | |||||||||
| 3,832,513 | |||||||||||
Computers & Peripherals — 3.7% | |||||||||||
| 9,559 | Apple Computer, Inc. (a) | 810,985 | |||||||||
| 25,544 | Dell, Inc. (a) | 640,899 | |||||||||
| 24,771 | EMC Corp. (a) | 326,977 | |||||||||
| 30,799 | Hewlett-Packard Co. | 1,268,611 | |||||||||
| 16,944 | International Business Machines Corp. | 1,646,110 | |||||||||
| 1,103 | Lexmark International, Inc., Class A (a) | 80,740 | |||||||||
| 2,006 | NCR Corp. (a) | 85,776 | |||||||||
| 4,199 | Network Appliance, Inc. (a) | 164,937 | |||||||||
| 1,774 | QLogic Corp. (a) | 38,886 | |||||||||
| 2,524 | SanDisk Corp. (a) | 108,608 | |||||||||
| 39,577 | Sun Microsystems, Inc. (a) | 214,507 | |||||||||
| 5,387,036 | |||||||||||
Construction & Engineering — 0.1% | |||||||||||
| 985 | Fluor Corp. | 80,425 | |||||||||
Construction Materials — 0.1% | |||||||||||
| 1,064 | Vulcan Materials Co. (c) | 95,622 | |||||||||
Consumer Finance — 1.0% | |||||||||||
| 13,555 | American Express Co. | 822,382 | |||||||||
| 4,588 | Capital One Financial Corp. | 352,450 | |||||||||
| 4,596 | SLM Corp. | 224,147 | |||||||||
| 1,398,979 | |||||||||||
Containers & Packaging — 0.2% | |||||||||||
| 1,169 | Ball Corp. | 50,968 | |||||||||
| 1,177 | Bemis Co. | 39,995 | |||||||||
| 1,497 | Pactiv Corp. (a) | 53,428 | |||||||||
| 911 | Sealed Air Corp. | 59,142 | |||||||||
| 1,207 | Temple-Inland, Inc. | 55,558 | |||||||||
| 259,091 | |||||||||||
Distributors — 0.1% | |||||||||||
| 1,922 | Genuine Parts Co. | 91,160 | |||||||||
Diversified Consumer Services — 0.1% | |||||||||||
| 1,570 | Apollo Group, Inc., Class A (a) | 61,183 | |||||||||
| 3,622 | H&R Block, Inc. | 83,451 | |||||||||
| 144,634 | |||||||||||
Diversified Financial Services — 5.7% | |||||||||||
| 50,503 | Bank of America Corp. | 2,696,355 | |||||||||
| 394 | Chicago Mercantile Exchange Holdings, Inc. Class A | 200,842 | |||||||||
| 2,226 | CIT Group, Inc. | 124,144 | |||||||||
| 55,262 | Citigroup, Inc. | 3,078,093 | |||||||||
| 39,006 | JPMorgan Chase & Co. (q) | 1,883,990 | |||||||||
| 2,649 | Moody’s Corp. (c) | 182,940 | |||||||||
| 8,166,364 | |||||||||||
Diversified Telecommunication Services — 2.9% | |||||||||||
| 43,222 | AT&T, Inc. | 1,545,186 | |||||||||
| 20,508 | BellSouth Corp. | 966,132 | |||||||||
| 1,297 | CenturyTel, Inc. | 56,627 | |||||||||
AS OF DECEMBER 31, 2006 (continued)
| SHARES | | SECURITY DESCRIPTION | | VALUE($) | |||||||
|---|---|---|---|---|---|---|---|---|---|---|---|
Long-Term Investments — Continued | |||||||||||
Diversified Telecommunication Services — Continued | |||||||||||
| 3,617 | Citizens Communications Co. | 51,976 | |||||||||
| 1,678 | Embarq Corp. | 88,196 | |||||||||
| 18,081 | Qwest Communications International, Inc. (a) (c) | 151,338 | |||||||||
| 32,830 | Verizon Communications, Inc. | 1,222,589 | |||||||||
| 5,357 | Windstream Corp. | 76,177 | |||||||||
| 4,158,221 | |||||||||||
Electric Utilities — 1.9% | |||||||||||
| 1,858 | Allegheny Energy, Inc. (a) | 85,301 | |||||||||
| 4,446 | American Electric Power Co., Inc. | 189,311 | |||||||||
| 14,118 | Duke Energy Corp. | 468,859 | |||||||||
| 3,659 | Edison International | 166,411 | |||||||||
| 2,329 | Entergy Corp. | 215,013 | |||||||||
| 7,540 | Exelon Corp. | 466,651 | |||||||||
| 3,590 | FirstEnergy Corp. | 216,477 | |||||||||
| 4,542 | FPL Group, Inc. (c) | 247,176 | |||||||||
| 1,121 | Pinnacle West Capital Corp. (c) | 56,823 | |||||||||
| 4,289 | PPL Corp. | 153,718 | |||||||||
| 2,859 | Progress Energy, Inc. | 140,320 | |||||||||
| 8,347 | Southern Co. (The) | 307,670 | |||||||||
| 2,713,730 | |||||||||||
Electrical Equipment — 0.5% | |||||||||||
| 1,895 | American Power Conversion Corp. | 57,968 | |||||||||
| 1,025 | Cooper Industries Ltd., Class A | 92,691 | |||||||||
| 9,029 | Emerson Electric Co. | 398,089 | |||||||||
| 1,916 | Rockwell Automation, Inc. | 117,029 | |||||||||
| 665,777 | |||||||||||
Electronic Equipment & Instruments — 0.3% | |||||||||||
| 4,591 | Agilent Technologies, Inc. (a) | 159,996 | |||||||||
| 2,075 | Jabil Circuit, Inc. | 50,941 | |||||||||
| 1,592 | Molex, Inc. (c) | 50,355 | |||||||||
| 5,990 | Sanmina-SCI Corp. (a) | 20,666 | |||||||||
| 10,278 | Solectron Corp. (a) | 33,095 | |||||||||
| 2,861 | Symbol Technologies, Inc. | 42,743 | |||||||||
| 934 | Tektronix, Inc. | 27,245 | |||||||||
| 385,041 | |||||||||||
Energy Equipment & Services — 1.7% | |||||||||||
| 3,613 | Baker Hughes, Inc. | 269,747 | |||||||||
| 3,301 | BJ Services Co. | 96,785 | |||||||||
| 11,309 | Halliburton Co. | 351,144 | |||||||||
| 3,373 | Nabors Industries Ltd. (Bermuda) (a) | 100,448 | |||||||||
| 1,967 | National Oilwell Varco, Inc. (a) | 120,341 | |||||||||
| 1,525 | Noble Corp. (Cayman Islands) | 116,129 | |||||||||
| 1,238 | Rowan Cos., Inc. | 41,102 | |||||||||
| 13,250 | Schlumberger Ltd. (Netherlands) | 836,870 | |||||||||
| 2,245 | Smith International, Inc. | 92,202 | |||||||||
| 3,287 | Transocean, Inc. (Cayman Islands) (a) | 265,885 | |||||||||
| 3,821 | Weatherford International Ltd. (Bermuda) (a) | 159,680 | |||||||||
| 2,450,333 | |||||||||||
Food & Staples Retailing — 2.2% | |||||||||||
| 5,156 | Costco Wholesale Corp. | 272,598 | |||||||||
| 9,260 | CVS Corp. | 286,226 | |||||||||
| 8,073 | Kroger Co. (The) | 186,244 | |||||||||
| 4,981 | Safeway, Inc. | 172,143 | |||||||||
| 2,317 | SUPERVALU, Inc. | 82,833 | |||||||||
| 6,948 | SYSCO Corp. | 255,408 | |||||||||
| 27,655 | Wal-Mart Stores, Inc. | 1,277,108 | |||||||||
| 11,282 | Walgreen Co. | 517,731 | |||||||||
| 1,605 | Whole Foods Market, Inc. (c) | 75,323 | |||||||||
| 3,125,614 | |||||||||||
Food Products — 1.1% | |||||||||||
| 7,389 | Archer-Daniels-Midland Co. | 236,152 | |||||||||
| 2,453 | Campbell Soup Co. (c) | 95,397 | |||||||||
| 5,728 | ConAgra Foods, Inc. | 154,656 | |||||||||
| 1,499 | Dean Foods Co. (a) | 63,378 | |||||||||
| 3,862 | General Mills, Inc. | 222,451 | |||||||||
| 1,957 | Hershey Co. (The) | 97,459 | |||||||||
| 3,709 | H.J. Heinz Co. | 166,942 | |||||||||
| 2,817 | Kellogg Co. | 141,019 | |||||||||
| 1,480 | McCormick & Co., Inc. (Non-Voting) (c) | 57,069 | |||||||||
| 8,403 | Sara Lee Corp. | 143,103 | |||||||||
| 2,827 | Tyson Foods, Inc., Class A (c) | 46,504 | |||||||||
| 2,466 | Wm. Wrigley, Jr., Co. (c) | 127,542 | |||||||||
| 1,551,672 | |||||||||||
Gas Utilities — 0.1% | |||||||||||
| 502 | Nicor, Inc. (c) | 23,494 | |||||||||
| 429 | Peoples Energy Corp. | 19,120 | |||||||||
| 960 | Questar Corp. | 79,728 | |||||||||
| 122,342 | |||||||||||
Health Care Equipment & Supplies — 1.6% | |||||||||||
| 600 | Bausch & Lomb, Inc. | 31,236 | |||||||||
| 7,353 | Baxter International, Inc. | 341,106 | |||||||||
| 2,769 | Becton, Dickinson & Co. | 194,245 | |||||||||
| 2,748 | Biomet, Inc. | 113,410 | |||||||||
| 13,260 | Boston Scientific Corp. (a) | 227,807 | |||||||||
| 1,157 | CR Bard, Inc. | 95,996 | |||||||||
| 1,751 | Hospira, Inc. (a) | 58,799 | |||||||||
| 12,945 | Medtronic, Inc. | 692,687 | |||||||||
| 3,972 | St. Jude Medical, Inc. (a) | 145,216 | |||||||||
| SHARES | | SECURITY DESCRIPTION | | VALUE($) | |||||||
|---|---|---|---|---|---|---|---|---|---|---|---|
Long-Term Investments — Continued | |||||||||||
Health Care Equipment & Supplies — Continued | |||||||||||
| 3,339 | Stryker Corp. | 184,012 | |||||||||
| 2,685 | Zimmer Holdings, Inc. (a) | 210,450 | |||||||||
| 2,294,964 | |||||||||||
Health Care Providers & Services — 2.4% | |||||||||||
| 5,873 | Aetna, Inc. | 253,596 | |||||||||
| 2,165 | AmerisourceBergen Corp. | 97,339 | |||||||||
| 4,552 | Cardinal Health, Inc. | 293,285 | |||||||||
| 4,796 | Caremark Rx, Inc. | 273,900 | |||||||||
| 1,148 | Cigna Corp. | 151,042 | |||||||||
| 1,786 | Coventry Health Care, Inc. (a) | 89,389 | |||||||||
| 1,525 | Express Scripts, Inc. (a) | 109,190 | |||||||||
| 2,701 | Health Management Associates, Inc., Class A (c) | 57,018 | |||||||||
| 1,865 | Humana, Inc. (a) | 103,153 | |||||||||
| 1,406 | Laboratory Corp. of America Holdings (a) | 103,299 | |||||||||
| 829 | Manor Care, Inc. (c) | 38,897 | |||||||||
| 3,330 | McKesson Corp. | 168,831 | |||||||||
| 3,296 | Medco Health Solutions, Inc. (a) | 176,138 | |||||||||
| 1,562 | Patterson Cos., Inc. (a) | 55,467 | |||||||||
| 1,801 | Quest Diagnostics, Inc. (c) | 95,453 | |||||||||
| 5,296 | Tenet Healthcare Corp. (a) (c) | 36,913 | |||||||||
| 15,144 | UnitedHealth Group, Inc. | 813,687 | |||||||||
| 6,967 | WellPoint, Inc. (a) | 548,233 | |||||||||
| 3,464,830 | |||||||||||
Health Care Technology — 0.0% (g) | |||||||||||
| 2,237 | IMS Health, Inc. | 61,473 | |||||||||
Hotels, Restaurants & Leisure — 1.6% | |||||||||||
| 5,004 | Carnival Corp. | 245,446 | |||||||||
| 1,645 | Darden Restaurants, Inc. | 66,080 | |||||||||
| 2,090 | Harrah’s Entertainment, Inc. | 172,885 | |||||||||
| 4,344 | Hilton Hotels Corp. | 151,605 | |||||||||
| 3,814 | International Game Technology | 176,207 | |||||||||
| 3,784 | Marriott International, Inc., Class A | 180,572 | |||||||||
| 13,905 | McDonald’s Corp. | 616,409 | |||||||||
| 8,499 | Starbucks Corp. (a) | 301,034 | |||||||||
| 2,386 | Starwood Hotels & Resorts Worldwide, Inc. (c) | 149,125 | |||||||||
| 1,075 | Wendy’s International, Inc. | 35,572 | |||||||||
| 2,234 | Wyndham Worldwide Corp. (a) | 71,533 | |||||||||
| 2,984 | Yum! Brands, Inc. | 175,459 | |||||||||
| 2,341,927 | |||||||||||
Household Durables — 0.6% | |||||||||||
| 762 | Black & Decker Corp. | 60,937 | |||||||||
| 1,329 | Centex Corp. | 74,783 | |||||||||
| 3,098 | D.R ..Horton, Inc. | 82,066 | |||||||||
| 1,697 | Fortune Brands, Inc. | 144,907 | |||||||||
| 734 | Harman International Industries, Inc. | 73,334 | |||||||||
| 882 | KB Home (c) | 45,229 | |||||||||
| 2,016 | Leggett & Platt, Inc. (c) | 48,182 | |||||||||
| 1,551 | Lennar Corp., Class A | 81,365 | |||||||||
| 3,111 | Newell Rubbermaid, Inc. | 90,063 | |||||||||
| 2,372 | Pulte Homes, Inc. (c) | 78,561 | |||||||||
| 656 | Snap-On, Inc. | 31,252 | |||||||||
| 909 | Stanley Works (The) (c) | 45,714 | |||||||||
| 878 | Whirlpool Corp. (c) | 72,892 | |||||||||
| 929,285 | |||||||||||
Household Products — 2.2% | |||||||||||
| 1,705 | Clorox Co. | 109,376 | |||||||||
| 5,781 | Colgate-Palmolive Co. | 377,152 | |||||||||
| 5,148 | Kimberly-Clark Corp. | 349,807 | |||||||||
| 35,630 | Procter & Gamble Co. | 2,289,940 | |||||||||
| 3,126,275 | |||||||||||
Independent Power Producers & Energy Traders — 0.4% | |||||||||||
| 7,466 | AES Corp. (The) (a) | 164,551 | |||||||||
| 2,019 | Constellation Energy Group, Inc. | 139,048 | |||||||||
| 4,255 | Dynegy, Inc., Class A (a) | 30,806 | |||||||||
| 5,165 | TXU Corp. | 279,995 | |||||||||
| 614,400 | |||||||||||
Industrial Conglomerates — 4.0% | |||||||||||
| 8,286 | 3M Co. | 645,728 | |||||||||
| 115,920 | General Electric Co. | 4,313,383 | |||||||||
| 1,413 | Textron, Inc. | 132,497 | |||||||||
| 22,367 | Tyco International Ltd. (Bermuda) | 679,957 | |||||||||
| 5,771,565 | |||||||||||
Insurance — 4.8% | |||||||||||
| 3,659 | ACE Ltd. (Bermuda) | 221,626 | |||||||||
| 5,562 | Aflac, Inc. | 255,852 | |||||||||
| 7,030 | Allstate Corp. (The) | 457,723 | |||||||||
| 1,190 | AMBAC Financial Group, Inc. | 105,993 | |||||||||
| 29,230 | American International Group, Inc. | 2,094,622 | |||||||||
| 3,486 | AON Corp. | 123,195 | |||||||||
| 4,628 | Chubb Corp. | 244,868 | |||||||||
| 1,942 | Cincinnati Financial Corp. | 87,992 | |||||||||
| 4,987 | Genworth Financial, Inc. | 170,605 | |||||||||
| 3,559 | Hartford Financial Services Group, Inc. | 332,090 | |||||||||
| 3,227 | Lincoln National Corp. | 214,273 | |||||||||
| 5,137 | Loews Corp. | 213,031 | |||||||||
| 6,196 | Marsh & McLennan Cos., Inc. | 189,969 | |||||||||
| 1,511 | MBIA, Inc. (c) | 110,394 | |||||||||
| 8,546 | MetLife, Inc. | 504,299 | |||||||||
| 3,027 | Principal Financial Group, Inc. | 177,685 | |||||||||
AS OF DECEMBER 31, 2006 (continued)
| SHARES | | SECURITY DESCRIPTION | | VALUE($) | |||||||
|---|---|---|---|---|---|---|---|---|---|---|---|
Long-Term Investments — Continued | |||||||||||
Insurance — Continued | |||||||||||
| 8,567 | Progressive Corp. (The) | 207,493 | |||||||||
| 5,369 | Prudential Financial, Inc. | 460,982 | |||||||||
| 1,189 | Safeco Corp. | 74,372 | |||||||||
| 7,757 | St. Paul Travelers Cos., Inc. (The) | 416,473 | |||||||||
| 1,108 | Torchmark Corp. | 70,646 | |||||||||
| 3,847 | UnumProvident Corp. | 79,941 | |||||||||
| 2,027 | XL Capital Ltd., Class A (Bermuda) | 145,985 | |||||||||
| 6,960,109 | |||||||||||
Internet & Catalog Retail — 0.2% | |||||||||||
| 3,480 | Amazon.com, Inc. (a) | 137,321 | |||||||||
| 2,507 | IAC/InterActive Corp. (a) (c) | 93,160 | |||||||||
| 230,481 | |||||||||||
Internet Software & Services — 1.3% | |||||||||||
| 13,019 | eBay, Inc. (a) | 391,481 | |||||||||
| 2,408 | Google, Inc., Class A (a) | 1,108,836 | |||||||||
| 2,751 | VeriSign, Inc. (a) | 66,162 | |||||||||
| 13,771 | Yahoo!, Inc. (a) | 351,711 | |||||||||
| 1,918,190 | |||||||||||
IT Services — 1.1% | |||||||||||
| 1,331 | Affiliated Computer Services, Inc., Class A (a) (c) | 65,006 | |||||||||
| 6,199 | Automatic Data Processing, Inc. | 305,301 | |||||||||
| 1,591 | Cognizant Technology Solutions Corp., Class A (a) | 122,761 | |||||||||
| 1,925 | Computer Sciences Corp. (a) | 102,737 | |||||||||
| 1,552 | Convergys Corp. (a) | 36,907 | |||||||||
| 5,810 | Electronic Data Systems Corp. | 160,065 | |||||||||
| 1,822 | Fidelity National Information Services, Inc. | 73,044 | |||||||||
| 8,610 | First Data Corp. | 219,727 | |||||||||
| 1,949 | Fiserv, Inc. (a) | 102,167 | |||||||||
| 3,805 | Paychex, Inc. | 150,450 | |||||||||
| 1,483 | Sabre Holdings Corp., Class A | 47,293 | |||||||||
| 3,871 | Unisys Corp. (a) (c) | 30,349 | |||||||||
| 8,617 | Western Union Co. (The) | 193,193 | |||||||||
| 1,609,000 | |||||||||||
Leisure Equipment & Products — 0.2% | |||||||||||
| 1,037 | Brunswick Corp. (c) | 33,080 | |||||||||
| 3,228 | Eastman Kodak Co. (c) | 83,282 | |||||||||
| 1,790 | Hasbro, Inc. | 48,778 | |||||||||
| 4,284 | Mattel, Inc. | 97,076 | |||||||||
| 262,216 | |||||||||||
Life Sciences Tools & Services — 0.3% | |||||||||||
| 2,060 | Applera Corp.- Applied Biosystems Group | 75,581 | |||||||||
| 601 | Millipore Corp. (a) (c) | 40,027 | |||||||||
| 1,388 | PerkinElmer, Inc. | 30,855 | |||||||||
| 4,588 | Thermo Fisher Scientific, Inc. (a) | 207,790 | |||||||||
| 1,143 | Waters Corp. (a) | 55,973 | |||||||||
| 410,226 | |||||||||||
Machinery — 1.4% | |||||||||||
| 7,320 | Caterpillar, Inc. | 448,936 | |||||||||
| 587 | Cummins, Inc. (c) | 69,372 | |||||||||
| 2,662 | Danaher Corp. (c) | 192,835 | |||||||||
| 2,600 | Deere & Co. | 247,182 | |||||||||
| 2,291 | Dover Corp. | 112,305 | |||||||||
| 1,678 | Eaton Corp. | 126,085 | |||||||||
| 4,712 | Illinois Tool Works, Inc. | 217,647 | |||||||||
| 3,448 | Ingersoll-Rand Co., Ltd., Class A (Bermuda) | 134,920 | |||||||||
| 2,072 | ITT Corp. | 117,731 | |||||||||
| 2,793 | PACCAR, Inc. (c) | 181,266 | |||||||||
| 1,381 | Pall Corp. | 47,714 | |||||||||
| 1,330 | Parker-Hannifin Corp. | 102,250 | |||||||||
| 1,144 | Terex Corp. (a) | 73,879 | |||||||||
| 2,072,122 | |||||||||||
Media — 3.7% | |||||||||||
| 8,787 | CBS Corp., Class B | 273,979 | |||||||||
| 5,555 | Clear Channel Communications, Inc. | 197,425 | |||||||||
| 23,405 | Comcast Corp., Class A (a) | 990,734 | |||||||||
| 8,664 | DirecTV Group, Inc. (The) (a) | 216,080 | |||||||||
| 726 | Dow Jones & Co., Inc. (c) | 27,588 | |||||||||
| 937 | E.W. Scripps Co., Class A | 46,794 | |||||||||
| 2,636 | Gannett Co., Inc. | 159,373 | |||||||||
| 4,966 | Interpublic Group of Cos., Inc. (a) (c) | 60,784 | |||||||||
| 3,983 | McGraw-Hill Cos., Inc. (The) | 270,924 | |||||||||
| 439 | Meredith Corp. | 24,738 | |||||||||
| 1,618 | New York Times Co., Class A (c) | 39,414 | |||||||||
| 26,322 | News Corp., Class A | 565,396 | |||||||||
| 1,919 | Omnicom Group, Inc. | 200,612 | |||||||||
| 44,900 | Time Warner, Inc. | 977,922 | |||||||||
| 2,139 | Tribune Co. | 65,838 | |||||||||
| 2,836 | Univision Communications, Inc., Class A (a) | 100,451 | |||||||||
| 7,867 | Viacom, Inc., Class B (a) | 322,783 | |||||||||
| 23,267 | Walt Disney Co. | 797,360 | |||||||||
| 5,338,195 | |||||||||||
Metals & Mining — 0.9% | |||||||||||
| 9,751 | Alcoa, Inc. | 292,628 | |||||||||
| 1,127 | Allegheny Technologies, Inc. | 102,196 | |||||||||
| 2,211 | Freeport-McMoRan Copper & Gold, Inc., Class B | 123,219 | |||||||||
| 5,060 | Newmont Mining Corp. | 228,459 | |||||||||
| 3,400 | Nucor Corp. | 185,844 | |||||||||
| SHARES | | SECURITY DESCRIPTION | | VALUE($) | |||||||
|---|---|---|---|---|---|---|---|---|---|---|---|
Long-Term Investments — Continued | |||||||||||
Metals & Mining — Continued | |||||||||||
| 2,290 | Phelps Dodge Corp. | 274,159 | |||||||||
| 1,335 | United States Steel Corp. | 97,642 | |||||||||
| 1,304,147 | |||||||||||
Multi-Utilities — 1.1% | |||||||||||
| 2,313 | Ameren Corp. (c) | 124,277 | |||||||||
| 3,518 | CenterPoint Energy, Inc. (c) | 58,328 | |||||||||
| 2,497 | CMS Energy Corp. (a) | 41,700 | |||||||||
| 2,885 | Consolidated Edison, Inc. (c) | 138,682 | |||||||||
| 3,975 | Dominion Resources, Inc. | 333,264 | |||||||||
| 1,999 | DTE Energy Co. (c) | 96,772 | |||||||||
| 1,967 | KeySpan Corp. | 81,001 | |||||||||
| 3,065 | NiSource, Inc. (c) | 73,867 | |||||||||
| 3,917 | PG&E Corp. | 185,392 | |||||||||
| 2,835 | Public Service Enterprise Group, Inc. | 188,187 | |||||||||
| 2,947 | Sempra Energy | 165,150 | |||||||||
| 2,351 | TECO Energy, Inc. | 40,508 | |||||||||
| 4,575 | Xcel Energy, Inc. (c) | 105,499 | |||||||||
| 1,632,627 | |||||||||||
Multiline Retail — 1.2% | |||||||||||
| 1,227 | Big Lots, Inc. (a) (c) | 28,123 | |||||||||
| 684 | Dillards, Inc., Class A (c) | 23,919 | |||||||||
| 3,508 | Dollar General Corp. (c) | 56,338 | |||||||||
| 1,702 | Family Dollar Stores, Inc. | 49,920 | |||||||||
| 5,912 | Federated Department Stores, Inc. | 225,425 | |||||||||
| 2,524 | J.C. Penney Co., Inc. | 195,257 | |||||||||
| 3,676 | Kohl’s Corp. (a) | 251,549 | |||||||||
| 2,571 | Nordstrom, Inc. | 126,853 | |||||||||
| 938 | Sears Holdings Corp. (a) | 157,518 | |||||||||
| 9,657 | Target Corp. | 550,932 | |||||||||
| 1,665,834 | |||||||||||
Office Electronics — 0.1% | |||||||||||
| 10,859 | Xerox Corp. (a) | 184,060 | |||||||||
Oil, Gas & Consumable Fuels — 8.0% | |||||||||||
| 5,168 | Anadarko Petroleum Corp. | 224,911 | |||||||||
| 3,703 | Apache Corp. | 246,287 | |||||||||
| 4,675 | Chesapeake Energy Corp. (c) | 135,809 | |||||||||
| 24,516 | Chevron Corp. | 1,802,661 | |||||||||
| 18,502 | ConocoPhillips | 1,331,219 | |||||||||
| 2,053 | Consol Energy, Inc. | 65,963 | |||||||||
| 4,967 | Devon Energy Corp. | 333,186 | |||||||||
| 7,931 | El Paso Corp. | 121,186 | |||||||||
| 2,736 | EOG Resources, Inc. | 170,863 | |||||||||
| 65,597 | Exxon Mobil Corp. | 5,026,698 | |||||||||
| 3,038 | Hess Corp. | 150,594 | |||||||||
| 1,204 | Kinder Morgan, Inc. | 127,323 | |||||||||
| 3,955 | Marathon Oil Corp. | 365,838 | |||||||||
| 2,100 | Murphy Oil Corp. | 106,785 | |||||||||
| 9,686 | Occidental Petroleum Corp. | 472,967 | |||||||||
| 2,966 | Peabody Energy Corp. | 119,856 | |||||||||
| 1,378 | Sunoco, Inc. | 85,932 | |||||||||
| 6,800 | Valero Energy Corp. | 347,888 | |||||||||
| 6,700 | Williams Cos., Inc. | 175,004 | |||||||||
| 4,113 | XTO Energy, Inc. (c) | 193,517 | |||||||||
| �� | 11,604,487 | ||||||||||
Paper & Forest Products — 0.3% | |||||||||||
| 5,115 | International Paper Co. (c) | 174,422 | |||||||||
| 2,036 | MeadWestvaco Corp. (c) | 61,202 | |||||||||
| 2,663 | Weyerhaeuser Co. | 188,141 | |||||||||
| 423,765 | |||||||||||
Personal Products — 0.1% | |||||||||||
| 5,002 | Avon Products, Inc. | 165,266 | |||||||||
| 1,433 | Estee Lauder Cos., Inc., (The), Class A | 58,495 | |||||||||
| 223,761 | |||||||||||
Pharmaceuticals — 6.3% | |||||||||||
| 17,259 | Abbott Laboratories | 840,686 | |||||||||
| 1,725 | Allergan, Inc. | 206,552 | |||||||||
| 1,192 | Barr Pharmaceuticals, Inc. (a) | 59,743 | |||||||||
| 22,114 | Bristol-Myers Squibb Co. | 582,040 | |||||||||
| 11,066 | Eli Lilly & Co. | 576,539 | |||||||||
| 3,560 | Forest Laboratories, Inc. (a) | 180,136 | |||||||||
| 32,612 | Johnson & Johnson | 2,153,044 | |||||||||
| 2,732 | King Pharmaceuticals, Inc. (a) | 43,493 | |||||||||
| 24,409 | Merck & Co., Inc. | 1,064,232 | |||||||||
| 2,382 | Mylan Laboratories, Inc. | 47,545 | |||||||||
| 81,089 | Pfizer, Inc. | 2,100,205 | |||||||||
| 16,668 | Schering-Plough Corp. | 394,032 | |||||||||
| 1,146 | Watson Pharmaceuticals, Inc. (a) | 29,830 | |||||||||
| 15,139 | Wyeth | 770,878 | |||||||||
| 9,048,955 | |||||||||||
Real Estate Investment Trusts (REITs) — 1.1% | |||||||||||
| 1,086 | Apartment Investment & Management Co. | 60,838 | |||||||||
| 2,454 | Archstone-Smith Trust (c) | 142,847 | |||||||||
| 1,312 | Boston Properties, Inc. | 146,787 | |||||||||
| 3,950 | Equity Office Properties Trust | 190,271 | |||||||||
| 3,280 | Equity Residential (c) | 166,460 | |||||||||
| 2,536 | Kimco Realty Corp. (c) | 113,993 | |||||||||
| 1,992 | Plum Creek Timber Co., Inc. (c) | 79,381 | |||||||||
| 2,783 | ProLogis | 169,123 | |||||||||
| 1,374 | Public Storage, Inc. | 133,965 | |||||||||
AS OF DECEMBER 31, 2006 (continued)
| SHARES | | SECURITY DESCRIPTION | | VALUE($) | |||||||
|---|---|---|---|---|---|---|---|---|---|---|---|
Long-Term Investments — Continued | |||||||||||
Real Estate Investment Trusts (REITs) — Continued | |||||||||||
| 2,485 | Simon Property Group, Inc. | 251,706 | |||||||||
| 1,449 | Vornado Realty Trust | 176,053 | |||||||||
| 1,631,424 | |||||||||||
Real Estate Management & Development — 0.1% | |||||||||||
| 2,074 | CB Richard Ellis Group, Inc., Class A (a) | 68,857 | |||||||||
| 2,407 | Realogy Corp. (a) | 72,980 | |||||||||
| 141,837 | |||||||||||
Road & Rail — 0.7% | |||||||||||
| 4,046 | Burlington Northern Santa Fe Corp. | 298,635 | |||||||||
| 4,896 | CSX Corp. | 168,569 | |||||||||
| 4,464 | Norfolk Southern Corp. | 224,495 | |||||||||
| 688 | Ryder System, Inc. (c) | 35,129 | |||||||||
| 3,031 | Union Pacific Corp. | 278,913 | |||||||||
| 1,005,741 | |||||||||||
Semiconductors & Semiconductor Equipment — 2.4% | |||||||||||
| 6,166 | Advanced Micro Devices, Inc. (a) | 125,478 | |||||||||
| 4,066 | Altera Corp. (a) | 80,019 | |||||||||
| 3,847 | Analog Devices, Inc. | 126,451 | |||||||||
| 15,614 | Applied Materials, Inc. | 288,078 | |||||||||
| 5,268 | Broadcom Corp., Class A (a) | 170,209 | |||||||||
| 64,837 | Intel Corp. | 1,312,949 | |||||||||
| 2,237 | KLA-Tencor Corp. | 111,291 | |||||||||
| 3,365 | Linear Technology Corp. | 102,027 | |||||||||
| 4,505 | LSI Logic Corp. (a) | 40,545 | |||||||||
| 3,602 | Maxim Integrated Products, Inc. | 110,293 | |||||||||
| 8,478 | Micron Technology, Inc. (a) | 118,353 | |||||||||
| 3,247 | National Semiconductor Corp. | 73,707 | |||||||||
| 1,388 | Novellus Systems, Inc. (a) | 47,775 | |||||||||
| 3,997 | NVIDIA Corp. (a) | 147,929 | |||||||||
| 2,360 | PMC-Sierra, Inc. (a) (c) | 15,836 | |||||||||
| 2,140 | Teradyne, Inc. (a) | 32,014 | |||||||||
| 16,688 | Texas Instruments, Inc. | 480,615 | |||||||||
| 3,783 | Xilinx, Inc. | 90,073 | |||||||||
| 3,473,642 | |||||||||||
Software — 3.4% | |||||||||||
| 6,555 | Adobe Systems, Inc. (a) | 269,542 | |||||||||
| 2,601 | Autodesk, Inc. (a) | 105,236 | |||||||||
| 2,304 | BMC Software, Inc. (a) | 74,189 | |||||||||
| 4,615 | CA, Inc. (c) | 104,530 | |||||||||
| 2,034 | Citrix Systems, Inc. (a) | 55,020 | |||||||||
| 3,967 | Compuware Corp. (a) | 33,045 | |||||||||
| 3,466 | Electronic Arts, Inc. (a) | 174,548 | |||||||||
| 3,916 | Intuit, Inc. (a) | 119,477 | |||||||||
| 97,286 | Microsoft Corp. | 2,904,960 | |||||||||
| 3,806 | Novell, Inc. (a) | 23,597 | |||||||||
| 44,996 | Oracle Corp. (a) | 771,231 | |||||||||
| 10,547 | Symantec Corp. (a) | 219,905 | |||||||||
| 4,855,280 | |||||||||||
Specialty Retail — 2.0% | |||||||||||
| 1,683 | AutoNation, Inc. (a) (c) | 35,881 | |||||||||
| 571 | AutoZone, Inc. (a) | 65,985 | |||||||||
| 3,179 | Bed Bath & Beyond, Inc. (a) | 121,120 | |||||||||
| 4,543 | Best Buy Co., Inc. | 223,470 | |||||||||
| 1,589 | Circuit City Stores, Inc. (c) | 30,159 | |||||||||
| 5,930 | Gap, Inc. (The) | 115,635 | |||||||||
| 22,958 | Home Depot, Inc. | 921,993 | |||||||||
| 3,845 | Limited Brands, Inc. | 111,274 | |||||||||
| 17,124 | Lowe’s Cos., Inc. | 533,413 | |||||||||
| 3,133 | Office Depot, Inc. (a) | 119,587 | |||||||||
| 834 | OfficeMax, Inc. | 41,408 | |||||||||
| 1,524 | RadioShack Corp. (c) | 25,573 | |||||||||
| 1,258 | Sherwin-Williams Co. (The) | 79,984 | |||||||||
| 8,132 | Staples, Inc. | 217,124 | |||||||||
| 1,524 | Tiffany & Co. | 59,802 | |||||||||
| 5,111 | TJX Cos., Inc. | 145,766 | |||||||||
| 2,848,174 | |||||||||||
Textiles, Apparel & Luxury Goods — 0.4% | |||||||||||
| 4,128 | Coach, Inc. (a) | 177,339 | |||||||||
| 1,244 | Jones Apparel Group, Inc. | 41,587 | |||||||||
| 1,154 | Liz Claiborne, Inc. | 50,153 | |||||||||
| 2,115 | Nike, Inc., Class B | 209,448 | |||||||||
| 1,001 | V.F. Corp. | 82,162 | |||||||||
| 560,689 | |||||||||||
Thrifts & Mortgage Finance — 1.5% | |||||||||||
| 6,979 | Countrywide Financial Corp. | 296,258 | |||||||||
| 10,964 | Fannie Mae | 651,152 | |||||||||
| 7,791 | Freddie Mac | 529,009 | |||||||||
| 937 | MGIC Investment Corp. | 58,600 | |||||||||
| 4,038 | Sovereign Bancorp, Inc. | 102,525 | |||||||||
| 10,636 | Washington Mutual, Inc. | 483,832 | |||||||||
| 2,121,376 | |||||||||||
Tobacco — 1.6% | |||||||||||
| 23,568 | Altria Group, Inc. | 2,022,606 | |||||||||
| 1,928 | Reynolds American, Inc. (c) | 126,226 | |||||||||
| 1,809 | UST, Inc. (c) | 105,284 | |||||||||
| 2,254,116 | |||||||||||
Trading Companies & Distributors — 0.0% (g) | |||||||||||
| 825 | WW Grainger, Inc. | 57,700 | |||||||||
| SHARES | | SECURITY DESCRIPTION | | VALUE($) | |||||||
|---|---|---|---|---|---|---|---|---|---|---|---|
Long-Term Investments — Continued | |||||||||||
Wireless Telecommunication Services — 0.6% | |||||||||||
| 4,205 | Alltel Corp. | 254,319 | |||||||||
| 32,561 | Sprint Nextel Corp. | 615,077 | |||||||||
| 869,396 | |||||||||||
| Total Common Stocks (Cost $121,993,654) | 143,102,887 | ||||||||||
Investment Company — 0.1% | |||||||||||
| 1,240 | SPDR Trust Series 1 (c) (Cost $176,555) | 175,696 | |||||||||
| Total Long-Term Investments (Cost $122,170,209) | 143,278,583 | ||||||||||
Short-Term Investments — 0.7% | |||||||||||
Investment Company — 0.7% | |||||||||||
| 947,909 | JPMorgan Liquid Assets Money Market Fund (b) (m) | 947,909 | |||||||||
| PRINCIPAL AMOUNT($) | | | | ||||||||
|---|---|---|---|---|---|---|---|---|---|---|---|
U.S. Treasury Bills — 0.0% (g) | |||||||||||
| 50,000 | U.S. Treasury Bills, 4.87%, 03/08/07 (k) (m) (n) | 49,569 | |||||||||
| Total Short-Term Investments (Cost $997,468) | 997,478 | ||||||||||
Investments of Cash Collateral for Securities on Loan — 4.8% | |||||||||||
Certificates of Deposit — 0.6% | |||||||||||
| 250,333 | Credit Industriel et Commercial, London, 5.34%, 01/24/07 | 250,333 | |||||||||
| 599,843 | Societe Generale, New York, FRN, 5.34%, 06/20/07 | 599,843 | |||||||||
| 850,176 | |||||||||||
Corporate Notes — 0.9% | |||||||||||
| 500,000 | American Express Credit Corp., FRN, 5.36%, 01/15/08 | 500,000 | |||||||||
| 200,000 | Banque Federative Du Credit, FRN, 5.35%, 07/13/07 | 200,000 | |||||||||
| 500,037 | Beta Finance, Inc., FRN, 5.38%, 03/15/07 | 500,037 | |||||||||
| 56,327 | MBIA Global Funding LLC, FRN, 5.45%, 01/26/07 | 56,327 | |||||||||
| 1,256,364 | |||||||||||
| PRINCIPAL AMOUNT($) | | SECURITY DESCRIPTION | | VALUE($) | ||||||
|---|---|---|---|---|---|---|---|---|---|---|
Repurchase Agreements — 3.3% | ||||||||||
| 1,360,787 | Banc of America Securities LLC, 5.32%, dated 12/29/06, due 01/02/07, repurchase price $1,361,591, collateralized by U.S. Government Agency Mortgages | 1,360,787 | ||||||||
| 1,350,000 | Bear Stearns Cos., Inc., 5.31%, dated 12/29/06, due 01/02/07, repurchase price $1,350,797, collateralized by U.S. Government Agency Mortgages | 1,350,000 | ||||||||
| 772,208 | Lehman Brothers, Inc., 5.31%, dated 12/29/06, due 01/02/07 repurchase price $772,664, collateralized by U.S. Government Agency Mortgages | 772,208 | ||||||||
| 1,350,000 | UBS Securities LLC, 5.32%, dated 12/29/06, due 01/02/07, repurchase price $1,350,798, collateralized by U.S. Government Agency Mortgages | 1,350,000 | ||||||||
| 4,832,995 | ||||||||||
| Total Investments of Cash Collateral for Securities on Loan (Cost $6,939,535) | 6,939,535 | |||||||||
Total Investments — 104.9% (Cost $130,107,212) | 151,215,596 | |||||||||
Liabilities in Excess of Other Assets — (4.9)% | (7,118,225 | ) | ||||||||
NET ASSETS — 100.0% | $ | 144,097,371 | ||||||||
AS OF DECEMBER 31, 2006 (continued)
| NUMBER OF CONTRACTS | | DESCRIPTION | | EXPIRATION DATE | | NOTIONAL VALUE AT 12/31/06 (USD) | | UNREALIZED APPRECIATION (DEPRECIATION) (USD) | ||||||||||
|---|---|---|---|---|---|---|---|---|---|---|---|---|---|---|---|---|---|---|
| 13 | Long Futures Outstanding E-Mini S&P 500 Index | March, 2007 | $ | 928,525 | $ | (2,778 | ) | |||||||||||
| (a) | — Non-income producing security. |
| (b) | — Investment in affiliate. Money market fund registered under the Investment Company Act of 1940, as amended, and advised by JPMorgan Investment Advisors Inc. |
| (c) | — Security, or a portion of the security, has been delivered to a counterparty as part of a security lending transaction. |
| (g) | — Amount rounds to less than 0.1%. |
| (k) | — Security is fully or partially segregated with the broker as collateral for futures or with brokers as initial margin for futures contracts. |
| (m) | — All or a portion of this security is segregated for current or potential holdings of futures, swaps, options, TBA, when-issued securities, delayed delivery securities, and reverse repurchase agreements. |
| (n) | — The rate shown is the effective yield at the date of purchase. |
| (q) | — Investment in affiliate. This security is included in an index in which the Portfolio, as an index fund, invests. |
| FRN | — Floating Rate Note. The rate shown is the rate in effect as of December 31, 2006. |
| SPDR — | Standard & Poor’s Depositary Receipt |
AS OF DECEMBER 31, 2006
| | Equity Index Portfolio | |||||
|---|---|---|---|---|---|---|
ASSETS: | ||||||
| Investments in non-affiliates, at value | $ | 148,383,697 | ||||
| Investments in affiliates, at value | 2,831,899 | |||||
| Total investment securities, at value | 151,215,596 | |||||
| Cash | 3,684 | |||||
| Receivables: | ||||||
| Investment securities sold | 88,663 | |||||
| Portfolio shares sold | 119,722 | |||||
| Interest and dividends | 200,152 | |||||
| Total Assets | 151,627,817 | |||||
LIABILITIES: | ||||||
| Payables: | ||||||
| Investment securities purchased | 143,893 | |||||
| Collateral for securities lending program | 6,939,535 | |||||
| Portfolio shares redeemed | 360,719 | |||||
| Variation margin on futures contracts | 3,445 | |||||
| Accrued liabilities: | ||||||
| Investment advisory fees | 11,135 | |||||
| Administration fees | 13,134 | |||||
| Custodian and accounting fees | 11,385 | |||||
| Trustees’ and Officers’ fees | 64 | |||||
| Other | 47,136 | |||||
| Total Liabilities | 7,530,446 | |||||
| Net Assets: | $ | 144,097,371 | ||||
NET ASSETS: | ||||||
| Paid in capital | $ | 127,524,809 | ||||
| Accumulated undistributed (distributions in excess of) net investment income | 2,106,671 | |||||
| Accumulated net realized gains (losses) | (6,639,715 | ) | ||||
| Net unrealized appreciation (depreciation) | 21,105,606 | |||||
| Total Net Assets | $ | 144,097,371 | ||||
| Outstanding units of beneficial interest (shares) (unlimited amount authorized, no par value) | 11,595,462 | |||||
| Net asset value, offering and redemption price per share | $ | 12.43 | ||||
| Cost of investments | $ | 130,107,212 | ||||
| Market value of securities on loan | 6,782,786 | |||||
For the Year Ended DECEMBER 31, 2006
| | Equity Index Portfolio | |||||
|---|---|---|---|---|---|---|
INVESTMENT INCOME: | ||||||
| Dividend income | $ | 2,574,838 | ||||
| Dividend income from affiliates (a) | 85,006 | |||||
| Interest income | 4,332 | |||||
| Income from securities lending (net) | 14,810 | |||||
| Total investment income | 2,678,986 | |||||
EXPENSES: | ||||||
| Investment advisory fees | 367,713 | |||||
| Administration fees | 156,779 | |||||
| Custodian and accounting fees | 82,417 | |||||
| Interest expense | 16 | |||||
| Professional fees | 56,421 | |||||
| Trustees’ and Officers’ fees | 2,197 | |||||
| Printing and mailing costs | 93,061 | |||||
| Transfer agent fees | 6,775 | |||||
| Other | 16,143 | |||||
| Total expenses | 781,522 | |||||
| Less amounts waived | (224,930 | ) | ||||
| Less earnings credits | (205 | ) | ||||
| Net expenses | 556,387 | |||||
| Net investment income (loss) | 2,122,599 | |||||
REALIZED/UNREALIZED GAINS (LOSSES): | ||||||
| Net realized gain (loss) on transactions from: | ||||||
| Investments in non-affiliates | (704,803 | ) | ||||
| Investments in affiliates | (10,230 | ) | ||||
| Futures | 25,418 | |||||
| Net realized gain (loss) | (689,615 | ) | ||||
| Change in net unrealized appreciation (depreciation) of: | ||||||
| Investments | 18,388,688 | |||||
| Futures | 9,435 | |||||
| Change in net unrealized appreciation (depreciation) | 18,398,123 | |||||
| Net realized/unrealized gains (losses) | 17,708,508 | |||||
| Change in net assets resulting from operations | $ | 19,831,107 | ||||
| (a) | Includes reimbursement of investment advisory, administration and shareholder servicing fees. See Fees and Other Transactions with Affiliates in the Notes to Financial Statements. |
FOR THE PERIODS INDICATED
| Equity Index Portfolio | |||||||||||
|---|---|---|---|---|---|---|---|---|---|---|---|
| | Year Ended 12/31/2006 | | Year Ended 12/31/2005 | ||||||||
CHANGE IN NET ASSETS RESULTING FROM OPERATIONS: | |||||||||||
| Net investment income (loss) | $ | 2,122,599 | $ | 1,915,232 | |||||||
| Net realized gain (loss) | (689,615 | ) | (350,695 | ) | |||||||
| Change in net unrealized appreciation (depreciation) | 18,398,123 | 4,414,651 | |||||||||
| Change in net assets resulting from operations | 19,831,107 | 5,979,188 | |||||||||
DISTRIBUTIONS TO SHAREHOLDERS: | |||||||||||
| From net investment income | (1,915,411 | ) | (1,958,403 | ) | |||||||
CHANGE IN NET ASSETS FROM CAPITAL TRANSACTIONS: | |||||||||||
| Proceeds from shares issued | 12,563,313 | 18,903,292 | |||||||||
| Dividends reinvested | 1,915,411 | 1,958,403 | |||||||||
| Cost of shares redeemed | (25,225,710 | ) | (25,151,037 | ) | |||||||
| Change in net assets from capital transactions | (10,746,986 | ) | (4,289,342 | ) | |||||||
NET ASSETS: | |||||||||||
| Change in net assets | 7,168,710 | (268,557 | ) | ||||||||
| Beginning of period | 136,928,661 | 137,197,218 | |||||||||
| End of period | $ | 144,097,371 | $ | 136,928,661 | |||||||
| Accumulated undistributed (distributions in excess of) net investment income | $ | 2,106,671 | $ | 1,912,321 | |||||||
SHARE TRANSACTIONS: | |||||||||||
| Issued | 1,104,904 | 1,803,028 | |||||||||
| Reinvested | 170,107 | 191,625 | |||||||||
| Redeemed | (2,213,906 | ) | (2,390,262 | ) | |||||||
| Change in shares | (938,895 | ) | (395,609 | ) | |||||||
FOR THE PERIODS INDICATED
Class 1
| | | | Per share operating performance | | |||||||||||||||||||||||
|---|---|---|---|---|---|---|---|---|---|---|---|---|---|---|---|---|---|---|---|---|---|---|---|---|---|---|---|
| Investment operations | | Distributions | | ||||||||||||||||||||||||
| | Net asset value, beginning of period | | Net investment income (loss) | | Net realized and unrealized gains (losses) on investments | | Total from investment operations | | Net investment income | | Total distributions | ||||||||||||||||
Equity Index Portfolio | |||||||||||||||||||||||||||
| Year Ended December 31, 2006 | $ | 10.92 | $ | 0.19 | $ | 1.48 | $ | 1.67 | $ | (0.16 | ) | $ | (0.16 | ) | |||||||||||||
| Year Ended December 31, 2005 | 10.61 | 0.15 | 0.31 | 0.46 | (0.15 | ) | (0.15 | ) | |||||||||||||||||||
| Year Ended December 31, 2004 | 9.72 | 0.15 | 0.85 | 1.00 | (0.11 | ) | (0.11 | ) | |||||||||||||||||||
| Year Ended December 31, 2003 | 7.69 | 0.11 | 2.01 | 2.12 | (0.09 | ) | (0.09 | ) | |||||||||||||||||||
| Year Ended December 31, 2002 | 9.92 | 0.09 | (2.32 | ) | (2.23 | ) | — | — | |||||||||||||||||||
| (a) | Includes adjustments in accordance with accounting principles generally accepted in the United States of America and as such, the net asset value for financial reporting purposes and the returns based upon those net asset values may differ from the net asset value and returns for shareholder transactions. |
| | | Ratios/Supplemental data | | ||||||||||||||||||||||||
|---|---|---|---|---|---|---|---|---|---|---|---|---|---|---|---|---|---|---|---|---|---|---|---|---|---|---|---|
| Ratios to average net assets | |||||||||||||||||||||||||||
| Net asset value, end of period | | Total return (a) | | Net assets end of period (000’s) | | Net expenses | | Net investment income (loss) | | Expenses without waivers, reimbursements and earnings credits | | Portfolio turnover rate | |||||||||||||||
| $12.43 | 15.42 | % | $ | 144,097 | 0.40 | % | 1.54 | % | 0.57 | % | 7 | % | |||||||||||||||
| 10.92 | 4.46 | 136,929 | 0.46 | 1.41 | 0.51 | 12 | |||||||||||||||||||||
| 10.61 | 10.34 | 137,197 | 0.50 | 1.53 | 0.51 | 14 | |||||||||||||||||||||
| 9.72 | 27.98 | 126,733 | 0.50 | 1.32 | 0.51 | 1 | |||||||||||||||||||||
| 7.69 | (22.48 | ) | 89,012 | 0.50 | 1.15 | 0.51 | 5 | ||||||||||||||||||||
AS OF DECEMBER 31, 2006
| | Class Offered | |||||
|---|---|---|---|---|---|---|
| Equity Index Portfolio | Class 1 | |||||
| | Lending Agent Fees Paid | | Market Value of Collateral | | Market Value of Loaned Securities | |||||||||
|---|---|---|---|---|---|---|---|---|---|---|---|---|---|---|
| $ | 4,323 | $ | 6,939,535 | $ | 6,782,786 | |||||||||
AS OF DECEMBER 31, 2006 (continued)
| | Paid-in-capital | | Accumulated Undistributed/ (Overdistributed) Net Investment Income | | Accumulated Net Realized Gain (Loss) on Investments | |||||||||
|---|---|---|---|---|---|---|---|---|---|---|---|---|---|---|
| $ | (778 | ) | $ | (12,838 | ) | $ | 13,616 | |||||||
| | Purchases (excluding U.S. Government) | | Sales (excluding U.S. Government) | |||||||
|---|---|---|---|---|---|---|---|---|---|---|
| $ | 9,779,614 | $ | 20,257,827 | |||||||
| | Aggregate Cost | | Gross Unrealized Appreciation | | Gross Unrealized Depreciation | | Net Unrealized Appreciation (Depreciation) | |||||||||||
|---|---|---|---|---|---|---|---|---|---|---|---|---|---|---|---|---|---|---|
| $ | 131,404,927 | $ | 36,003,095 | $ | 16,192,426 | $ | 19,810,669 | |||||||||||
| Total Distributions Paid From: | ||||||||||
|---|---|---|---|---|---|---|---|---|---|---|
| | Ordinary Income | | Total Distributions Paid | |||||||
| $ | 1,915,411 | $ | 1,915,411 | |||||||
AS OF DECEMBER 31, 2006 (continued)
| Total Distributions Paid From: | ||||||||||
|---|---|---|---|---|---|---|---|---|---|---|
| | Ordinary Income | | Total Distributions Paid | |||||||
| $ | 1,958,403 | $ | 1,958,403 | |||||||
| | Current Distributable Ordinary Income | | Current Distributable Long-Term Capital Gain or (Tax Basis Capital Loss Carryover) | | Unrealized Appreciation (Depreciation) | |||||||||
|---|---|---|---|---|---|---|---|---|---|---|---|---|---|---|
| $ | 2,109,083 | $ | (4,863,375 | ) | $ | 19,810,669 | ||||||||
| Expires | ||||||||||||||||||
|---|---|---|---|---|---|---|---|---|---|---|---|---|---|---|---|---|---|---|
| | 2009 | | 2010 | | 2014 | Total | | |||||||||||
| $ | 521,344 | $ | 4,041,792 | $ | 300,239 | $4,863,375 | ||||||||||||
JPMorgan Insurance Trust and Shareholders of JPMorgan Insurance Trust Equity Index Portfolio:
New York, New York
February 15, 2007
(Unaudited)
| Name (Year of Birth); Positions With the Portfolio | | Principal Occupations During Past 5 Years | | Number of Portfolios in Fund Complex Overseen by Trustee (1) | | Other Directorships Held Outside Fund Complex | |||||||||
|---|---|---|---|---|---|---|---|---|---|---|---|---|---|---|---|
Independent Trustees | |||||||||||||||
| William J. Armstrong (1941); Trustee since 2005; Trustee of heritage JPMorgan Funds since 1987. | Retired; CFO and Consultant, EduNeering, Inc. (internet business education supplier) (2000–2001); Vice President and Treasurer, Ingersoll–Rand Company (manufacturer of industrial equipment) (1972–2000). | 131 | None. | ||||||||||||
| Roland R. Eppley, Jr. (1932); Trustee since 2005; Trustee of heritage JPMorgan Funds since 1989. | Retired; President and Chief Executive Officer, Eastern States Bankcard (1971–1988). | 131 | None. | ||||||||||||
| John F. Finn (1947); Trustee since 2005; Trustee of heritage One Group Mutual Funds since 1998. | President and Chief Executive Officer, Gardner, Inc. (wholesale distributor to outdoor power equipment industry) (1979–present). | 131 | Director, Cardinal Health, Inc (CAH) (1994–present); Chairman, The Columbus Association of the Performing Arts (CAPA) (2003–present). | ||||||||||||
| Dr. Matthew Goldstein (1941); Trustee since 2005; Trustee of heritage JPMorgan Funds since 2003. | Chancellor, City University of New York (1999–present); President, Adelphi University (New York) (1998–1999). | 131 | Director, Albert Einstein School of Medicine (1998–present); Director, New Plan Excel Realty Trust, Inc. (real estate investment trust) (2000–present); Director, Lincoln Center Institute for the Arts in Education (1999–present). | ||||||||||||
| Robert J. Higgins (1945); Trustee since 2005; Trustee of heritage JPMorgan Funds since 2002. | Retired; Director of Administration of the State of Rhode Island (2003–2004); President — Consumer Banking and Investment Services, Fleet Boston Financial (1971–2001). | 131 | None. | ||||||||||||
| Peter C. Marshall (1942); Trustee since 2005; Trustee of heritage One Group Mutual Funds since 1994. | Self-employed business consultant (2001–present); Senior Vice President, W.D. Hoard, Inc. (corporate parent of DCI Marketing, Inc.) (2000–2002); President, DCI Marketing, Inc. (1992–2000). | 131 | None. | ||||||||||||
| Marilyn McCoy (1948); Trustee since 2005; Trustee of heritage One Group Mutual Funds since 1999. | Vice President of Administration and Planning, Northwestern University (1985–present). | 131 | Trustee, Mather LifeWays (1994–present); Trustee, Carleton College (2003–present). | ||||||||||||
| William G. Morton, Jr. (1937); Trustee since 2005; Trustee of heritage JPMorgan Funds since 2003. | Retired; Chairman Emeritus (2001–2002), and Chairman and Chief Executive Officer, Boston Stock Exchange (1985–2001). | 131 | Director, Radio Shack Corporation (electronics) (1987–present); Director, The National Football Foundation and College Hall of Fame (1994–present); Trustee, Stratton Mountain School (2001–present). | ||||||||||||
| Name (Year of Birth); Positions With the Portfolio | | Principal Occupations During Past 5 Years | | Number of Portfolios in Fund Complex Overseen by Trustee (1) | | Other Directorships Held Outside Fund Complex | |||||||||
|---|---|---|---|---|---|---|---|---|---|---|---|---|---|---|---|
Independent Trustees (continued) | |||||||||||||||
| Robert A. Oden, Jr. (1946); Trustee since 2005; Trustee of heritage One Group Mutual Funds since 1997. | President, Carleton College (2002–present); President, Kenyon College (1995–2002). | 131 | Director, American University in Cairo. | ||||||||||||
| Fergus Reid, III (1932); Trustee (Chairman) since 2005; Trustee (Chairman) of heritage JPMorgan Funds since 1987. | Chairman, Lumelite Corporation (plastics manufacturing) (2003–present); Chairman and Chief Executive Officer, Lumelite Corporation (1985–2002). | 131 | Trustee, Morgan Stanley Funds (196 portfolios) (1995–present). | ||||||||||||
| Frederick W. Ruebeck (1939); Trustee since 2005; Trustee of heritage One Group Mutual Funds since 1994. | Advisor, Jerome P. Green & Associates, LLC (broker-dealer) (2000–present); Chief Investment Officer, Wabash College (2004–present); self-employed consultant (2000–present); Director of Investments, Eli Lilly and Company (1988–1999). | 131 | Trustee, Wabash College (1988–present); Chairman, Indianapolis Symphony Orchestra Foundation (1994–present). | ||||||||||||
| James J. Schonbachler (1943); Trustee since 2005; Trustee of heritage JPMorgan Funds since 2001. | Retired; Managing Director of Bankers Trust Company (financial services) (1968–1998). | 131 | None. | ||||||||||||
Interested Trustee | |||||||||||||||
| Leonard M. Spalding, Jr.* (1935); Trustee since 2005; Trustee of heritage JPMorgan Funds since 1998. | Retired; Chief Executive Officer, Chase Mutual Funds (investment company) (1989–1998); President and Chief Executive Officer, Vista Capital Management (investment management) (1990–1998); Chief Investment Executive, Chase Manhattan Private Bank (investment management) (1990–1998). | 131 | Director, Glenview Trust Company, LLC (2001–present); Trustee, St. Catherine College (1998–present); Trustee, Bellarmine University (2000–present); Director, Springfield-Washington County Economic Development Authority (1997–present); Trustee, Marion and Washington County, Kentucky Airport Board (1998–present); Trustee, Catholic Education Foundation (2005–present). | ||||||||||||
| (1) | A Fund Complex means two or more registered investment companies that hold themselves out to investors as related companies for purposes of investment and investor services or have a common investment adviser or have an investment adviser that is an affiliated person of the investment adviser of any of the other registered investment companies. The JPMorgan Funds Complex for which the Board of Trustees serves currently includes eight registered investment companies (131 funds). |
| * | Mr. Spalding is deemed to be an “interested person” due to his ownership of JPMorgan Chase stock. |
(Unaudited)
| Name (Year of Birth), Positions Held with the Trust | | Principal Occupations During Past 5 Years | ||||
|---|---|---|---|---|---|---|
| George C.W. Gatch (1962), President since 2005 | Managing Director, J.P. Morgan Investment Management Inc.; Director and President, JPMorgan Distribution Services, Inc. and JPMorgan Funds Management, Inc. since 2005. Mr. Gatch is CEO and President of the JPMorgan Funds. Mr. Gatch has been an employee of JPMorgan since 1986 and has held positions such as President and CEO of DKB Morgan, a Japanese mutual fund company, which was a joint venture between J.P. Morgan and Dai-Ichi Kangyo Bank, as well as positions in business management, marketing and sales. | |||||
| Robert L. Young (1963), Senior Vice President since 2005* | Director and Vice President, JPMorgan Distribution Services, Inc. and JPMorgan Funds Management, Inc.; Chief Operating Officer, JPMorgan Funds since 2005, and One Group Mutual Funds from 2001 until 2005. Mr. Young was Vice President and Treasurer, JPMorgan Funds Management, Inc. (formerly One Group Administrative Services) and Vice President and Treasurer, JPMorgan Distribution Services, Inc. (formerly One Group Dealer Services, Inc.) from 1999 to 2005. | |||||
| Patricia A. Maleski (1960), Vice President and Chief Administrative Officer since 2005 | Managing Director, JPMorgan Funds Management, Inc.; previously, Treasurer, JPMorgan Funds and Head of Funds Administration and Board Liaison. Ms. Maleski was Vice President of Finance for the Pierpont Group, Inc. from 1996–2001, an independent company owned by the Board of Directors/Trustees of the JPMorgan Funds, prior to joining JPMorgan Chase & Co. in 2001. | |||||
| Stephanie J. Dorsey (1969), Treasurer since 2005* | Vice President, JPMorgan Funds Management, Inc.; Director of Mutual Fund Administration, JPMorgan Funds Management, Inc. (formerly One Group Administrative Services), from 2004 to 2005; Ms. Dorsey worked for JPMorgan Chase & Co., (formerly Bank One Corporation) from 2003 to 2004; prior to joining Bank One Corporation, she was a Senior Manager specializing in Financial Services audits at PricewaterhouseCoopers LLP from 1992 through 2002. | |||||
| Stephen M. Ungerman (1953), Chief Compliance Officer since 2005 | Senior Vice President, JPMorgan Chase & Co.; Mr. Ungerman was head of Fund Administration — Pooled Vehicles from 2000 to 2004. Mr. Ungerman held a number of positions in Prudential Financial’s asset management business prior to 2000. | |||||
| Paul L. Gulinello (1950), AML Compliance Officer since 2005 | Vice President and Anti Money Laundering Compliance Officer for JPMorgan Asset Management Americas, additionally responsible for personal trading and compliance testing since 2004; Treasury Services Operating Risk Management and Compliance Executive supporting all JPMorgan Treasury Services business units from July 2000 to 2004. | |||||
| Stephen M. Benham (1959), Secretary since 2005 | Vice President and Assistant General Counsel, JPMorgan Chase & Co. since 2004; Vice President (Legal Advisory) of Merrill Lynch Investment Managers, L.P. from 2000 to 2004. | |||||
| Elizabeth A. Davin (1964), Assistant Secretary since 2005* | Vice President and Assistant General Counsel, JPMorgan Chase & Co. since 2005; Senior Counsel, JPMorgan Chase & Co. (formerly Bank One Corporation) from 2004 to 2005; Assistant General Counsel and Associate General Counsel and Vice President, Gartmore Global Investments, Inc. from 1999 to 2004. | |||||
| Jessica K. Ditullio (1962), Assistant Secretary since 2005* | Vice President and Assistant General Counsel, JPMorgan Chase & Co. since 2005; Ms. Ditullio has served as an attorney with various titles for JPMorgan Chase & Co. (formerly Bank One Corporation) since 1990. | |||||
| Nancy E. Fields (1949), Assistant Secretary since 2005* | Vice President, JPMorgan Funds Management, Inc. and JPMorgan Distribution Services, Inc.; From 1999 to 2005, Director, Mutual Fund Administration, JPMorgan Funds Management, Inc. (formerly One Group Administrative Services) and Senior Project Manager, Mutual Funds, JPMorgan Distribution Services, Inc. (formerly One Group Dealer Services, Inc.). | |||||
| Michael C. Raczynski (1975), Assistant Secretary since 2006 | Vice President and Assistant General Counsel, JPMorgan Chase & Co. since 2006; Associate, Stroock & Stroock & Lavan LLP from 2001 to 2006. | |||||
| Ellen W. O’Brien (1957), Assistant Secretary since 2005** | Assistant Vice President, JPMorgan Investor Services, Co., responsible for Blue Sky registration. Ms. O’Brien has served in this capacity since joining the firm in 1991. | |||||
| Name (Year of Birth), Positions Held with the Trust | | Principal Occupations During Past 5 Years | ||||
|---|---|---|---|---|---|---|
| Laura S. Melman (1966) Assistant Treasurer since 2006 | Vice President, JPMorgan Funds Management, Inc. since August, 2006, responsible for Taxation; Vice President of Structured Products at The Bank of New York Co., Inc. from 2001 to 2006. | |||||
| Arthur A. Jensen (1966), Assistant Treasurer since 2005* | Vice President, JPMorgan Funds Management, Inc. since April 2005; formerly, Vice President of Financial Services of BISYS Fund Services, Inc. from 2001 to 2005; Mr. Jensen was Section Manager at Northern Trust Company and Accounting Supervisor at Allstate Insurance Company prior to 2001. | |||||
| Jeffrey D. House (1972) Assistant Treasurer since 2006* | Vice President, JPMorgan Funds Management, Inc. since July 2006; formerly, Senior Manager of Financial Services at BISYS Fund Services, Inc. from 1995 to 2006. | |||||
| * | The contact address for the officer is 1111 Polaris Parkway, Columbus, OH 43271. |
| ** | The contact address for the officer is 73 Tremont Street, Floor 1, Boston MA 02108. |
(Unaudited)
December 31, 2006
| Class 1 | | Beginning Account Value, July 1, 2006 | | Ending Account Value, December 31, 2006 | | Expenses Paid During Period July 1, 2006 to December 31, 2006* | | Annualized Expense Ratio | ||||||||||
|---|---|---|---|---|---|---|---|---|---|---|---|---|---|---|---|---|---|---|
| Actual | $ | 1,000.00 | $ | 1,125.90 | $ | 2.14 | 0.40 | % | ||||||||||
| Hypothetical | 1,000.00 | 1,023.19 | 2.04 | 0.40 | ||||||||||||||
| * | Expenses are equal to the Fund’s annualized expense ratio, multiplied by the average account value over the period, multiplied by 184/365 (to reflect the one-half year period). |
(Unaudited)
(Unaudited) (continued)
contractual services provided to the Funds, less expenses of providing such services. Expenses include direct and indirect costs and are calculated using an allocation methodology developed by the Advisor. The Trustees also recognized that it is difficult to make comparisons of profitability from fund investment advisory contracts because comparative information is not generally publicly available and is affected by numerous factors, including the structure of the particular Advisor, the types of funds it manages, its business mix, numerous assumptions regarding allocations and the fact that publicly-traded fund managers’ operating profits and net income are net of distribution and marketing expenses. Based on their review, the Trustees concluded that the profitability to the Advisor of each of the Investment Advisory Agreements was not unreasonable in light of the services and benefits provided to each Fund.
the Advisor’s analysis of the Portfolio’s investment processes, portfolio construction and peer group and were satisfied with the actions taken. The Trustees requested the Portfolio’s Advisor to similarly review the Portfolio with members of the Equity subcommittee at each of their regular meetings over the course of the year.
(Unaudited)
© JPMorgan Chase & Co., 2007 All rights reserved. December 2006. | AN-JPMITEIP-1206 |
This material must be preceded or accompanied by a current prospectus.
| President’s Letter | 1 | |||||
| Portfolio Commentary: | ||||||
| JPMorgan Insurance Trust Government Bond Portfolio | 2 | |||||
| Schedule of Portfolio Investments | 4 | |||||
| Financial Statements | 7 | |||||
| Financial Highlights | 10 | |||||
| Notes to Financial Statements | �� | 12 | ||||
| Report of Independent Registered Public Accounting Firm | 17 | |||||
| Trustees | 18 | |||||
| Officers | 20 | |||||
| Schedule of Shareholder Expenses | 22 | |||||
| Board Approval of Investment Advisory Agreement | 23 | |||||
| Tax Letter | 26 |
| • | Rising inflationary pressures prompted Fed to begin rate increase cycle |
| • | Bond yields rose on inflation and interest rate concerns |
| • | Slowed home sales and manufacturing activity curbed economic growth |
| • | Fed paused rate hike cycle in the latter half of 2006, triggering a rally in the markets |
JANUARY 5, 2007 (Unaudited)
| “After growing by a meager 1.8% in the fourth quarter of 2005, the U.S. economy began 2006 with impressive strength ” | ||
| • | The two-year Treasury yield began the year at 4.40%, peaked at 5.28% on June 28, and ended 2006 at 4.81%. |
| • | The 10-year Treasury yield began the year at 4.39%, peaked at 5.25% on June 28, and ended the year at 4.70%. |
| • | The 30-year Treasury yield started the year at 4.54%, peaked at 5.31% on May 12, and ended 2006 at 4.81%. |
President
JPMorgan Funds
AS OF DECEMBER 31, 2006 (Unaudited)
| Portfolio Inception | August 1, 1994 | |||||
| Fiscal Year End | December 31 | |||||
| Net Asset as of 12/31/2006 | $167,571,149 | |||||
| Primary Benchmark | Lehman Brothers Government Bond Index | |||||
| Average Credit Quality | AAA | |||||
| Duration | 5.24 Years | |||||
Q: | HOW DID THE PORTFOLIO PERFORM? |
A: | The JPMorgan Insurance Trust Government Bond Portfolio, which seeks a high level of current income with liquidity and safety of principal, returned 3.47% (Class 1 Shares) during the 12 months ended December 31, 2006, compared to the 3.48% return for the Lehman Brothers Government Bond Index for the same period.* |
Q: | WHY DID THE PORTFOLIO PERFORM THIS WAY? |
A: | Yields increased across the Treasury yield curve during the 12-month period. The yield curve remained inverted, with short-term rates remaining higher than longer-term rates. With a year-end yield of 4.81%, the 30-year Treasury was lower than the two-year Treasury. In addition, yields were higher than they had been at the end of 2005; for example, the yield on the two-year Treasury ended the year at 4.82%, compared to 4.41% at the end of 2005, while the yield for the 10-year Treasury ended the year at 4.70%, compared to 4.39% at the end of 2005. The Portfolio performed in line with its benchmark during the period. Our duration and yield-curve positioning were positive contributors to performance. For most of the year, we kept the Portfolio’s duration (sensitivity to interest rate changes) within a range of 5.00 years to 5.25 years, which is in line with our stated objective. By year end, we had positioned the duration to 5.41 years, which is within the average range for the Government Bond Portfolio. In terms of yield-curve positioning, our focus on mortgages resulted in an overweight relative to the index in the three- to 10-year range of the yield curve. Additionally, the Portfolio’s overweight to the mortgage sector contributed positively to performance. On the negative side, the Portfolio’s position in treasury inflation protected securities (TIPS) detracted from performance. During the 12-month period, inflation pressures eased, and the relative attractiveness of this segment of the government bond market subsided. Overall, the underweight to U.S. Treasury securities was a negative influence on performance. |
Q: | HOW WAS THE PORTFOLIO MANAGED? |
A: | We continued to focus on security selection as our primary strategy, looking for attractively valued securities that fit our “buy-and-hold” approach. Our specific security selections in all sectors of the government bond market contributed positively to the Portfolio’s 12 month return. We continued to overweight mortgages in general and well-structured collateralized mortgage obligations (CMOs) in particular. We also underweighted agency securities and Treasury notes and overweighted Treasury STRIPS. |
| Collateralized Mortgage Obligations | 47.4 | % | ||||
| U.S. Treasury Obligations | 24.9 | |||||
| U.S. Government Agencies | 12.8 | |||||
| Mortgage Pass-Through Securities | 12.6 | |||||
| Short-Term Investment | 1.7 | |||||
| Investments of Cash Collateral for Securities on Loan | 13.5 |
| * | The advisor seeks to achieve the Portfolio’s objective. There can be no guarantee it will be achieved. |
| ** | Percentages indicated are based upon net assets as of December 31, 2006. The Portfolio’s composition is subject to change. |
| INCEPTION DATE | 1 YEAR | 5 YEAR | 10 YEAR | |||||||||||||||
|---|---|---|---|---|---|---|---|---|---|---|---|---|---|---|---|---|---|---|
GOVERNMENT BOND PORTFOLIO | 8/1/1994 | 3.47 | % | 5.14 | % | 5.99 | % | |||||||||||
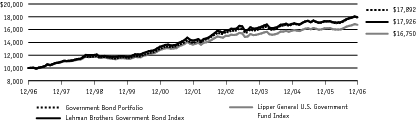
AS OF DECEMBER 31, 2006
| PRINCIPAL AMOUNT($) | | SECURITY DESCRIPTION | | VALUE($) | |||||||
|---|---|---|---|---|---|---|---|---|---|---|---|
Long-Term Investments — 97.7% | |||||||||||
Collateralized Mortgage Obligations — 47.4% | |||||||||||
| Federal Home Loan Mortgage Corp., | |||||||||||
| 220,540 | Series 1343, Class LA, 8.00%, 08/15/22 | 220,620 | |||||||||
| 48,272 | Series 1561, Class TA, PO, 08/15/08 | 47,229 | |||||||||
| 399,959 | Series 1577, Class PV, 6.50%, 09/15/23 | 411,896 | |||||||||
| 1,136,366 | Series 1584, Class L, 6.50%, 09/15/23 | 1,162,526 | |||||||||
| 40,505 | Series 1604, Class MB, IF, VAR, 6.54%, 11/15/08 | 40,794 | |||||||||
| 83,950 | Series 1625, Class SC, IF, VAR, 6.72%, 12/15/08 | 84,723 | |||||||||
| 896,553 | Series 1633, Class Z, 6.50%, 12/15/23 | 920,610 | |||||||||
| 201,000 | Series 1694, Class PK, 6.50%, 03/15/24 | 208,593 | |||||||||
| 61,168 | Series 1985, Class PL, 6.50%, 10/17/26 (m) | 61,180 | |||||||||
| 486,918 | Series 1999, Class PU, 7.00%, 10/15/27 | 501,579 | |||||||||
| 847,285 | Series 2031, Class PG, 7.00%, 02/15/28 (m) | 882,544 | |||||||||
| 714,030 | Series 2035, Class PC, 6.95%, 03/15/28 | 737,572 | |||||||||
| 750,000 | Series 2095, Class PE, 6.00%, 11/15/28 | 758,695 | |||||||||
| 112,466 | Series 2132, Class PD, 6.00%, 11/15/27 | 112,568 | |||||||||
| 255,075 | Series 2178, Class PB, 7.00%, 08/15/29 | 261,639 | |||||||||
| 339,599 | Series 2259, Class ZC, 7.35%, 10/15/30 | 361,787 | |||||||||
| 705,949 | Series 2345, Class PQ, 6.50%, 08/15/16 | 721,367 | |||||||||
| 506,940 | Series 2366, Class VG, 6.00%, 06/15/11 | 507,525 | |||||||||
| 974,934 | Series 2367, Class ME, 6.50%, 10/15/31 | 994,493 | |||||||||
| 92,441 | Series 2390, Class DO, PO, 12/15/31 | 75,259 | |||||||||
| 883,000 | Series 2527, Class BP, 5.00%, 11/15/17 | 863,493 | |||||||||
| 5,000,000 | Series 2543, Class YX, 6.00%, 12/15/32 (m) | 5,049,220 | |||||||||
| 3,230,000 | Series 2578, Class PG, 5.00%, 02/15/18 | 3,116,617 | |||||||||
| 2,000,000 | Series 2626, Class KA, 3.00%, 03/15/30 | 1,862,228 | |||||||||
| 650,000 | Series 2631, Class TE, 4.50%, 02/15/28 | 625,429 | |||||||||
| 699,405 | Series 2647, Class A, 3.25%, 04/15/32 | 642,963 | |||||||||
| 2,914,660 | Series 2651, Class VZ, 4.50%, 07/15/18 | 2,737,307 | |||||||||
| 2,438,000 | Series 2656, Class BG, 5.00%, 10/15/32 | 2,370,552 | |||||||||
| 410,000 | Series 2682, Class LC, 4.50%, 07/15/32 | 387,255 | |||||||||
| 2,500,000 | Series 2684, Class PD, 5.00%, 03/15/29 | 2,461,733 | |||||||||
| 1,250,000 | Series 2749, Class TD, 5.00%, 06/15/21 | 1,223,812 | |||||||||
| 650,000 | Series 2773, Class TB, 4.00%, 04/15/19 | 582,339 | |||||||||
| 625,000 | Series 2827, Class DG, 4.50%, 07/15/19 | 584,506 | |||||||||
| 1,200,000 | Series 2827, Class TC, 5.00%, 10/15/28 | 1,187,524 | |||||||||
| 869,700 | Series 2927, Class GA, 5.50%, 10/15/34 | 871,644 | |||||||||
| 1,250,000 | Series 2929, Class PC, 5.00%, 01/15/28 | 1,233,722 | |||||||||
| 891,340 | Series 3085, Class VS, VAR, 7.32%, 12/15/35 | 972,139 | |||||||||
| Federal Home Loan Mortgage Corp. Structured Pass-Through Securities, | |||||||||||
| 790,592 | Series T-54, Class 2A, 6.50%, 02/25/43 | 805,783 | |||||||||
| 476,053 | Series T-56, Class A, PO, 05/25/43 | 399,297 | |||||||||
| Federal National Mortgage Association, | |||||||||||
| 30,903 | Series 1988-16, Class B, 9.50%, 06/25/18 | 33,483 | |||||||||
| 138,329 | Series 1993-146, Class E, PO, 05/25/23 | 113,836 | |||||||||
| 245,000 | Series 1993-155, Class PJ, 7.00%, 09/25/23 | 256,738 | |||||||||
| 49,196 | Series 1993-197, Class SC, IF, 8.30%, 10/25/08 | 50,240 | |||||||||
| 22,398 | Series 1993-205, Class H, PO, 09/25/23 | 18,410 | |||||||||
| 138,409 | Series 1993-221, Class SG, IF, VAR, 3.56%, 12/25/08 | 136,751 | |||||||||
| 1,858,140 | Series 1993-223, Class PZ, 6.50%, 12/25/23 | 1,946,635 | |||||||||
| 708,612 | Series 1993-250, Class Z, 7.00%, 12/25/23 | 727,619 | |||||||||
| 62,047 | Series 1994-12, Class C, 6.25%, 01/25/09 | 61,879 | |||||||||
| 13,953 | Series 1994-13, Class SM, IF, VAR, 9.82%, 02/25/09 | 14,467 | |||||||||
| 341,785 | Series 1994-28, Class K, 6.50%, 08/25/23 | 342,703 | |||||||||
| 1,110,886 | Series 1994-37, Class L, 6.50%, 03/25/24 | 1,140,955 | |||||||||
| 6,388,638 | Series 1994-72, Class K, 6.00%, 04/25/24 | 6,492,752 | |||||||||
| 23,012 | Series 1994-76, Class H, 5.00%, 02/25/24 | 22,873 | |||||||||
| 206,390 | Series 1998-46, Class GZ, 6.50%, 08/18/28 | 212,716 | |||||||||
| 522,039 | Series 1998-58, Class PC, 6.50%, 10/25/28 | 536,115 | |||||||||
| 1,058,388 | Series 1999-39, Class JH, IO, 6.50%, 08/25/29 | 226,280 | |||||||||
| 473,508 | Series 2001-4, Class PC, 7.00%, 03/25/21 | 490,709 | |||||||||
| 1,618,999 | Series 2001-33, Class ID, IO, 6.00%, 07/25/31 | 359,445 | |||||||||
| 460,489 | Series 2002-2, Class UC, 6.00%, 02/25/17 | 463,155 | |||||||||
| 2,000,000 | Series 2002-18, Class PC, 5.50%, 04/25/17 | 2,011,139 | |||||||||
| 2,000,000 | Series 2003-35, Class MD, 5.00%, 11/25/16 | 1,974,183 | |||||||||
| 1,250,000 | Series 2003-70, Class BE, 3.50%, 12/25/25 | 1,200,088 | |||||||||
| 3,600,000 | Series 2003-81, Class MC, 5.00%, 12/25/32 | 3,497,704 | |||||||||
| 600,000 | Series 2003-82, Class VB, 5.50%, 08/25/33 | 595,564 | |||||||||
| 2,901,667 | Series 2003-128, Class DY, 4.50%, 01/25/24 | 2,696,118 | |||||||||
| 1,850,000 | Series 2004-2, Class OE, 5.00%, 05/25/23 | 1,785,477 | |||||||||
| 1,441,661 | Series 2004-75, Class VK, 4.50%, 09/25/22 | 1,365,276 | |||||||||
| 86,236 | Series G92-44, Class ZQ, 8.00%, 07/25/22 | 91,264 | |||||||||
| 36,424 | Series G92-66, Class KA, 6.00%, 12/25/22 | 36,980 | |||||||||
| Federal National Mortgage Association Whole Loan, | |||||||||||
| 841,045 | Series 1999-W4, Class A9, 6.25%, 02/25/29 | 850,301 | |||||||||
| 1,403,230 | Series 2002-W7, Class A4, 6.00%, 06/25/29 | 1,411,594 | |||||||||
| 754,198 | Series 2003-W1, Class 1A1, 6.50%, 12/25/42 | 767,240 | |||||||||
| 696,366 | Series 2005-W1, Class 1A2, 6.50%, 10/25/44 | 706,855 | |||||||||
| Government National Mortgage Association, | |||||||||||
| 383,665 | Series 1998-22, Class PD, 6.50%, 09/20/28 | 392,256 | |||||||||
| 122,796 | Series 1999-17, Class L, 6.00%, 05/20/29 | 123,999 | |||||||||
| 482,557 | Series 2001-6, Class PM, 6.50%, 06/16/30 | 484,140 | |||||||||
| 2,500,000 | Series 2001-10, Class PE, 6.50%, 03/16/31 (m) | 2,592,229 | |||||||||
| 1,000,000 | Series 2001-64, Class PB, 6.50%, 12/20/31 | 1,027,706 | |||||||||
| PRINCIPAL AMOUNT($) | | SECURITY DESCRIPTION | | VALUE($) | |||||||
|---|---|---|---|---|---|---|---|---|---|---|---|
Long-Term Investments — Continued | |||||||||||
Collateralized Mortgage Obligations — Continued | |||||||||||
| 6,989,579 | Series 2003-59, Class XA, IO, VAR, 0.94%, 06/16/34 | 612,105 | |||||||||
| 2,759,774 | Series 2003-75, Class BE, 6.00%, 04/16/28 | 2,801,369 | |||||||||
| 1,665,357 | Series 2004-62, Class VA, 5.50%, 07/20/15 | 1,670,562 | |||||||||
| Total Collateralized Mortgage Obligations (Cost $79,942,955) | 79,392,672 | ||||||||||
Mortgage Pass-Through Securities — 12.6% | |||||||||||
| Federal Home Loan Mortgage Corp. Gold Pools, | |||||||||||
| 412,564 | 5.00%, 12/01/13 – 04/01/14 | 407,786 | |||||||||
| 149,977 | 5.50%, 03/01/14 | 150,516 | |||||||||
| 294,503 | 6.00%, 04/01/14 – 02/01/32 | 297,956 | |||||||||
| 1,807,980 | 6.50%, 06/01/14 – 04/01/32 | 1,850,688 | |||||||||
| 34,901 | 7.00%, 02/01/11 | 35,790 | |||||||||
| 68,741 | 7.50%, 09/01/10 | 69,523 | |||||||||
| 21,799 | 8.50%, 12/01/09 – 07/01/28 | 23,269 | |||||||||
| Federal Home Loan Mortgage Corp. Conventional Pools, | |||||||||||
| 226,240 | ARM, 6.87%, 01/01/27 | 230,803 | |||||||||
| 70,682 | ARM, 6.94%, 04/01/30 | 72,547 | |||||||||
| 36,260 | 9.00%, 12/01/09 | 36,211 | |||||||||
| Federal National Mortgage Association Various Pools, | |||||||||||
| 4,097,448 | 5.00%, 11/01/13 – 11/01/33 | 3,985,397 | |||||||||
| 7,216,645 | 5.50%, 11/01/16 – 01/01/34 | 7,154,794 | |||||||||
| 2,107,196 | 6.00%, 04/01/13 – 09/01/28 | 2,134,856 | |||||||||
| 603,333 | 6.50%, 11/01/11 – 04/01/32 | 618,050 | |||||||||
| 179,560 | 7.50%, 02/01/13 – 08/01/30 | 185,606 | |||||||||
| 452,775 | 8.00%, 11/01/12 – 01/01/16 | 468,226 | |||||||||
| Government National Mortgage Association Various Pools, | |||||||||||
| 2,865,142 | ARM, 4.50%, 07/20/34 – 09/20/34 | 2,822,560 | |||||||||
| 14,710 | ARM, 5.75%, 07/20/27 | 14,901 | |||||||||
| 32,815 | 6.50%, 03/15/28 – 09/15/28 | 33,767 | |||||||||
| 78,915 | 7.00%, 12/15/25 – 06/15/28 | 81,579 | |||||||||
| 41,096 | 7.50%, 05/15/23 – 12/20/26 | 42,867 | |||||||||
| 82,448 | 7.75%, 07/15/30 | 86,797 | |||||||||
| 232,825 | 8.00%, 11/20/26 – 10/15/27 | 246,059 | |||||||||
| 18,196 | 9.00%, 11/15/24 | 19,561 | |||||||||
| Total Mortgage Pass-Through Securities (Cost $21,339,060) | 21,070,109 | ||||||||||
U.S. Government Agency Securities — 12.8% | |||||||||||
| 1,500,000 | Federal Farm Credit Bank, 6.75%, 07/07/09 | 1,561,293 | |||||||||
| 1,000,000 | Federal Home Loan Bank System, 5.90%, 03/26/09 (c) | 1,013,839 | |||||||||
| 6,000,000 | Federal National Mortgage Association, | ||||||||||
| Zero Coupon, 09/23/20 | 2,904,924 | ||||||||||
| Financing Corp. Fico, | |||||||||||
| 2,000,000 | Zero Coupon, 11/02/18 | 1,093,254 | |||||||||
| 8,000,000 | Zero Coupon, 12/06/18 | 4,350,120 | |||||||||
| 3,000,000 | Zero Coupon, 10/09/19 | 1,483,374 | |||||||||
| 630,000 | Zero Coupon, 03/23/28 | 207,439 | |||||||||
| Resolution Funding Corp., | |||||||||||
| 1,000,000 | Zero Coupon, 10/15/17 | 587,340 | |||||||||
| 2,000,000 | Zero Coupon, 01/15/20 | 1,038,940 | |||||||||
| 4,000,000 | Zero Coupon, 07/15/20 | 2,026,344 | |||||||||
| Tennessee Valley Authority, | |||||||||||
| 5,000,000 | Zero Coupon, 07/15/16 | 3,061,625 | |||||||||
| 2,000,000 | 6.00%, 03/15/13 | 2,106,984 | |||||||||
| Total U.S. Government Agency Securities (Cost $19,397,307) | 21,435,476 | ||||||||||
U.S. Treasury Obligations — 24.9% | |||||||||||
| U.S. Treasury Bonds, | |||||||||||
| 650,000 | 6.13%, 11/15/27 (c) | 754,152 | |||||||||
| 2,700,000 | 7.25%, 05/15/16 (c) | 3,209,520 | |||||||||
| 1,250,000 | 8.13%, 08/15/19 (c) | 1,633,105 | |||||||||
| 2,000,000 | 9.13%, 05/15/18 | 2,750,782 | |||||||||
| 2,800,000 | 10.38%, 11/15/12 | 2,924,468 | |||||||||
| U.S. Treasury Inflation Indexed Bonds, | |||||||||||
| 579,916 | 3.50%, 01/15/11 | 603,702 | |||||||||
| 6,246,375 | 3.63%, 01/15/08 | 6,312,986 | |||||||||
| U.S. Treasury Notes, | |||||||||||
| 2,250,000 | 4.25%, 08/15/13 (c) | 2,193,575 | |||||||||
| 2,500,000 | 4.50%, 09/30/11 (c) | 2,478,027 | |||||||||
| 200,000 | 6.00%, 08/15/09 | 206,039 | |||||||||
| U.S. Treasury Bonds Coupon STRIPS, | |||||||||||
| 4,000,000 | 11/15/09 (c) | 3,500,836 | |||||||||
| 2,500,000 | 08/15/14 (c) | 1,753,205 | |||||||||
| 2,000,000 | 11/15/14 (c) | 1,384,204 | |||||||||
| 1,750,000 | 02/15/15 (c) | 1,197,107 | |||||||||
| 500,000 | 05/15/15 (c) | 337,780 | |||||||||
| 750,000 | 08/15/15 (c) | 500,771 | |||||||||
| 3,000,000 | 11/15/15 (c) | 1,974,618 | |||||||||
| 400,000 | 05/15/16 | 256,914 | |||||||||
| 15,000,000 | 05/15/20 | 7,810,650 | |||||||||
| Total U.S. Treasury Obligations (Cost $40,631,679) | 41,782,441 | ||||||||||
| Total Long-Term Investments (Cost $161,311,001) | 163,680,698 | ||||||||||
AS OF DECEMBER 31, 2006 (continued)
| SHARES | | SECURITY DESCRIPTION | | VALUE($) | |||||||
|---|---|---|---|---|---|---|---|---|---|---|---|
Short-Term Investment — 1.7% | |||||||||||
Investment Company — 1.7% | |||||||||||
| 2,939,392 | JPMorgan U.S. Government Money Market Fund (b) (m) (Cost $2,939,392) | 2,939,392 | |||||||||
| PRINCIPAL AMOUNT($) | | SECURITY DESCRIPTION | | | |||||||
|---|---|---|---|---|---|---|---|---|---|---|---|
Investments of Cash Collateral for Securities on Loan — 13.5% | |||||||||||
Repurchase Agreements — 13.5% | |||||||||||
| 4,186,260 | Banc of America Securities LLC, 5.32%, dated 12/29/06, due 01/02/07, repurchase price $4,188,735, collateralized by U.S. Government Agency Mortgages | 4,186,260 | |||||||||
| 4,500,000 | Bear Stearns, 5.31%, dated 12/29/06, due 01/02/07, repurchase price $4,502,655, collateralized by U.S. Government Agency Mortgages | 4,500,000 | |||||||||
| 4,900,000 | HSBC Securities, Inc., 5.28%, dated 12/29/06, due 01/02/07, repurchase price $4,902,875, collateralized by U.S. Government Agency Mortgages | 4,900,000 | |||||||||
| 4,500,000 | Lehman Brothers, Inc., 5.31%, dated 12/29/06, due 01/02/07, repurchase price $4,502,655, collateralized by U.S. Government Agency Mortgages | 4,500,000 | |||||||||
| 4,500,000 | UBS Securities LLC, 5.32%, dated 12/29/06, due 01/02/07, repurchase price $4,502,660, collateralized by U.S. Government Agency Mortgages | 4,500,000 | |||||||||
| Total Investments of Cash Collateral for Securities on Loan (Cost $22,586,260) | 22,586,260 | ||||||||||
Total Investments — 112.9% (Cost $186,836,653) | 189,206,350 | ||||||||||
Liabilities in Excess of Other Assets — (12.9)% | (21,635,201 | ) | |||||||||
NET ASSETS — 100.0% | $ | 167,571,149 | |||||||||
| (b) | — | Investment in affiliate. Money market fund registered under the Investment Company Act of 1940, as amended, and advised by JPMorgan Investment Advisors Inc. |
| (c) | — | Security, or a portion of the security, has been delivered to a counterparty as part of a security lending transaction. |
| (m) | — | All or a portion of this security is segregated for current or potential holdings of futures, swaps, options, when issued securities, delayed delivery securities, and reverse repurchase agreements. |
| ARM | — | Adjustable Rate Mortgage. |
| IF | — | Inverse Floaters represent securities that pay interest at a rate that increases (decreases) with a decline (incline) in a specified index. The rate shown is the rate in effect as of December 31, 2006. The rate may be subject to a cap and floor. |
| IO | — | Interest Only represents the right to receive the monthly interest payment on an underlying pool of mortgage loans. The face amount shown represents the par value on the generally higher than prevailing market underlying pool. The yields on these securities exceed yields on other mortgage-backed securities because their cash flow patterns are more volatile and there is a greater risk that the initial investment will not be fully recouped. These securities are subject to accelerated principal paydowns as a result of prepayment or refinancing of the underlying pool of mortgage instruments. As a result, interest income may be reduced considerably. |
| PO | — | Principal Only represents the right to receive the principal portion only on an underlying pool of mortgage loans. The market value of these securities is extremely volatile in response to changes in market interest rates. As prepayments on the underlying mortgages of these securities increase, the yield on these securities increases. |
| STRIPS | — | Separate Trading of Registered Interest and Principal Securities. |
| VAR | — | Variable rate note. The interest rate shown is the rate in effect at December 31, 2006. |
AS OF DECEMBER 31, 2006
| | Government Bond Portfolio | |||||
|---|---|---|---|---|---|---|
ASSETS: | ||||||
| Investments in non-affiliates, at value | $ | 163,680,698 | ||||
| Investments in affiliates, at value | 2,939,392 | |||||
| Repurchase agreements, at value | 22,586,260 | |||||
| Total investment securities, at value | 189,206,350 | |||||
| Receivables: | ||||||
| Investment securities sold | 5,420 | |||||
| Portfolio shares sold | 582,520 | |||||
| Interest and dividends | 904,913 | |||||
| Prepaid expenses and other assets | 45 | |||||
| Total Assets | 190,699,248 | |||||
LIABILITIES: | ||||||
| Payables: | ||||||
| Collateral for securities lending program | 22,586,260 | |||||
| Portfolio shares redeemed | 422,094 | |||||
| Accrued liabilities: | ||||||
| Investment advisory fees | 47,161 | |||||
| Administration fees | 13,875 | |||||
| Trustees’ and Officers’ fees | 8 | |||||
| Other | 58,701 | |||||
| Total Liabilities | 23,128,099 | |||||
| Net Assets: | $ | 167,571,149 | ||||
NET ASSETS: | ||||||
| Paid in capital | $ | 156,855,318 | ||||
| Accumulated undistributed (distributions in excess of) net investment income | 8,681,464 | |||||
| Accumulated net realized gains (losses) | (335,330 | ) | ||||
| Net unrealized appreciation (depreciation) | 2,369,697 | |||||
| Total Net Assets | $ | 167,571,149 | ||||
| Outstanding units of beneficial interest (shares) (unlimited amount authorized, no par value) | 14,958,832 | |||||
| Net asset value, offering and redemption price per share | $ | 11.20 | ||||
| Cost of investments | $ | 186,836,653 | ||||
| Market value of securities on loan | 22,081,671 | |||||
FOR THE YEAR ENDED DECEMBER 31, 2006
| | Government Bond Portfolio | |||||
|---|---|---|---|---|---|---|
INVESTMENT INCOME: | ||||||
| Dividend income from affiliates (a) | $ | 244,260 | ||||
| Interest income | 9,556,978 | |||||
| Income from securities lending (net) | 33,732 | |||||
| Total investment income | 9,834,970 | |||||
EXPENSES: | ||||||
| Investment advisory fees | 754,047 | |||||
| Administration fees | 210,619 | |||||
| Custodian and accounting fees | 14,924 | |||||
| Professional fees | 67,409 | |||||
| Trustees’ and Officers’ fees | 2,701 | |||||
| Printing and mailing costs | 101,127 | |||||
| Transfer agent fees | 6,502 | |||||
| Other | 20,282 | |||||
| Total expenses | 1,177,611 | |||||
| Less amounts waived | (41,799 | ) | ||||
| Less earnings credits | (45 | ) | ||||
| Net expenses | 1,135,767 | |||||
| Net investment income (loss) | 8,699,203 | |||||
REALIZED/UNREALIZED GAINS (LOSSES): | ||||||
| Net realized gain (loss) on transactions from investments | (204,711 | ) | ||||
| Change in net unrealized appreciation (depreciation) of investments | (2,576,988 | ) | ||||
| Net realized/unrealized gains (losses) | (2,781,699 | ) | ||||
| Change in net assets resulting from operations | $ | 5,917,504 | ||||
| (a) | Includes reimbursement of investment advisory, administration and shareholder servicing fees. See Fees and Other Transactions with Affiliates in the Notes to Financial Statements. |
FOR THE PERIODS INDICATED
| Government Bond Portfolio | |||||||||||
|---|---|---|---|---|---|---|---|---|---|---|---|
| | Year Ended 12/31/06 | | Year Ended 12/31/05 | ||||||||
CHANGE IN NET ASSETS RESULTING FROM OPERATIONS: | |||||||||||
| Net investment income (loss) | $ | 8,699,203 | $ | 9,591,180 | |||||||
| Net realized gain (loss) | (204,711 | ) | 211,918 | ||||||||
| Change in net unrealized appreciation (depreciation) | (2,576,988 | ) | (3,691,230 | ) | |||||||
| Change in net assets resulting from operations | 5,917,504 | 6,111,868 | |||||||||
DISTRIBUTIONS TO SHAREHOLDERS: | |||||||||||
| From net investment income | (9,635,666 | ) | (9,946,227 | ) | |||||||
CHANGE IN NET ASSETS FROM CAPITAL TRANSACTIONS: | |||||||||||
| Proceeds from shares issued | 10,413,453 | 14,789,507 | |||||||||
| Dividends reinvested | 9,635,666 | 9,946,227 | |||||||||
| Cost of shares redeemed | (44,573,739 | ) | (38,413,574 | ) | |||||||
| Change in net assets from capital transactions | (24,524,620 | ) | (13,677,840 | ) | |||||||
NET ASSETS: | |||||||||||
| Change in net assets | (28,242,782 | ) | (17,512,199 | ) | |||||||
| Beginning of period | 195,813,931 | 213,326,130 | |||||||||
| End of period | $ | 167,571,149 | $ | 195,813,931 | |||||||
| Accumulated undistributed (distributions in excess of) net investment income | $ | 8,681,464 | $ | 9,616,252 | |||||||
SHARE TRANSACTIONS: | |||||||||||
| Issued | 944,256 | 1,296,364 | |||||||||
| Reinvested | 900,529 | 899,297 | |||||||||
| Redeemed | (4,055,922 | ) | (3,367,833 | ) | |||||||
| Change in shares | (2,211,137 | ) | (1,172,172 | ) | |||||||
FOR THE PERIODS INDICATED
| | Per share operating performance | | |||||||||||||||||||||||||
|---|---|---|---|---|---|---|---|---|---|---|---|---|---|---|---|---|---|---|---|---|---|---|---|---|---|---|---|
| Investment operations | Distributions | | |||||||||||||||||||||||||
| | Net asset value, beginning of period | | Net investment income (loss) | | Net realized and unrealized gains (losses) on investments | | Total from investment operations | | Net investment income | | Net asset value end of period | ||||||||||||||||
Government Bond Portfolio | |||||||||||||||||||||||||||
| Year Ended December 31, 2006 | $ | 11.40 | $ | 0.60 | $ | (0.22 | ) | $ | 0.38 | $ | (0.58 | ) | $ | 11.20 | |||||||||||||
| Year Ended December 31, 2005 | 11.63 | 0.58 | (0.25 | ) | 0.33 | (0.56 | ) | 11.40 | |||||||||||||||||||
| Year Ended December 31, 2004 | 11.67 | 0.54 | (0.01 | ) | 0.53 | (0.57 | ) | 11.63 | |||||||||||||||||||
| Year Ended December 31, 2003 | 11.92 | 0.56 | (0.26 | ) | 0.30 | (0.55 | ) | 11.67 | |||||||||||||||||||
| Year Ended December 31, 2002 | 10.62 | 0.55 | 0.75 | 1.30 | — | (b) | 11.92 | ||||||||||||||||||||
| (a) | Includes adjustments in accordance with accounting principles generally accepted in the United States of America and as such, the net asset value for financial reporting purposes and the returns based upon those net asset values may differ from the net asset value and returns for shareholder transactions. |
| (b) | Amount rounds to less than $0.01. |
| | Ratios/Supplemental data | | |||||||||||||||||||||
|---|---|---|---|---|---|---|---|---|---|---|---|---|---|---|---|---|---|---|---|---|---|---|---|
| Ratios to average net assets | |||||||||||||||||||||||
| Total return (a) | | Net assets end of period (000’s) | | Net expenses | | Net investment income (loss) | | Expenses without waivers, reimbursements and earnings credits | | Portfolio turnover rate | |||||||||||||
| 3.56% | $ | 167,571 | 0.63 | % | 4.82 | % | 0.65 | % | 3 | % | |||||||||||||
| 3.08 | 195,814 | 0.65 | 4.70 | 0.65 | 10 | ||||||||||||||||||
| 4.64 | 213,326 | 0.62 | 4.65 | 0.63 | 14 | ||||||||||||||||||
| 2.54 | 211,642 | 0.62 | 4.76 | 0.63 | 23 | ||||||||||||||||||
| 12.26 | 208,305 | 0.63 | 5.33 | 0.63 | 16 | ||||||||||||||||||
AS OF DECEMBER 31, 2006
| | Class Offered | |||||
|---|---|---|---|---|---|---|
| Government Bond Portfolio | Class 1 | |||||
securities outstanding during a given month. For the period ended December 31, 2006, JPMCB voluntarily reduced its fees to: (i) 0.05% for each loan of U.S. securities and (ii) 0.10% for each loan of non-U.S. securities, respectively.
| | Lending Agent Fees Paid | | Market Value of Collateral | | Market Value of Loaned Securities | |||||||||
|---|---|---|---|---|---|---|---|---|---|---|---|---|---|---|
| $ | 14,990 | $ | 22,586,260 | $ | 22,081,671 | |||||||||
| | Paid-in-capital | | Accumulated Undistributed/ (Overdistributed) Net Investment Income | | Accumulated Net Realized Gain (Loss) on Investments | |||||||||
|---|---|---|---|---|---|---|---|---|---|---|---|---|---|---|
| $ | (1,676 | ) | $ | 1,675 | $ | 1 | ||||||||
AS OF DECEMBER 31, 2006 (continued)
| | Purchases (excluding U.S. Government) | | Sales (excluding U.S. Government) | | Purchases of U.S. Government | | Sales of U.S. Government | |||||||||||
|---|---|---|---|---|---|---|---|---|---|---|---|---|---|---|---|---|---|---|
| $ | 1,424,285 | $ | 19,973,508 | $ | 2,986,614 | $ | 10,891,532 | |||||||||||
| | Aggregate Cost | | Gross Unrealized Appreciation | | Gross Unrealized Depreciation | | Net Unrealized Appreciation (Depreciation) | |||||||||||
|---|---|---|---|---|---|---|---|---|---|---|---|---|---|---|---|---|---|---|
| $ | 186,836,653 | $ | 4,806,776 | $ | 2,437,079 | $ | 2,369,697 | |||||||||||
| Total Distributions Paid From: | ||||||||||||||
|---|---|---|---|---|---|---|---|---|---|---|---|---|---|---|
| | | Ordinary Income | | Total Distributions Paid | ||||||||||
| $ | 9,635,666 | $ | 9,635,666 | |||||||||||
| Total Distributions Paid From: | ||||||||||||||
|---|---|---|---|---|---|---|---|---|---|---|---|---|---|---|
| | | Ordinary Income | | Total Distributions Paid | ||||||||||
| $ | 9,946,227 | $ | 9,946,227 | |||||||||||
| | Current Distributable Ordinary Income | | Current Distributable Long-Term Capital Gain or (Tax Basis Capital Loss Carryover) | | Unrealized Appreciation (Depreciation) | |||||||||
|---|---|---|---|---|---|---|---|---|---|---|---|---|---|---|
| $ | 8,684,835 | $ | (335,261 | ) | $ | 2,369,697 | ||||||||
| | 2012 | | 2014 | | Total | |||||||||
|---|---|---|---|---|---|---|---|---|---|---|---|---|---|---|
| $ | 130,619 | $ | 204,642 | $ | 335,261 | |||||||||
AS OF DECEMBER 31, 2006 (continued)
disposition of securities, and are subject to the Portfolio’s borrowing restrictions. Interest on borrowings is payable at a rate determined by JPMCB at the time of borrowing. This agreement has been extended until November 20, 2007.
JPMorgan Insurance Trust Government Bond Portfolio:
New York, New York
February 15, 2007
(Unaudited)
| Name (Year of Birth); Positions With the Portfolio | | Principal Occupations During Past 5 Years | | Number of Portfolios in Fund Complex Overseen by Trustee (1) | | Other Directorships Held Outside Fund Complex | |||||||||
|---|---|---|---|---|---|---|---|---|---|---|---|---|---|---|---|
Independent Trustees | |||||||||||||||
| William J. Armstrong (1941); Trustee since 2005; Trustee of heritage JPMorgan Funds since 1987. | Retired; CFO and Consultant, EduNeering, Inc. (internet business education supplier) (2000–2001); Vice President and Treasurer, Ingersoll–Rand Company (manufacturer of industrial equipment) (1972–2000). | 131 | None. | ||||||||||||
| Roland R. Eppley, Jr. (1932); Trustee since 2005; Trustee of heritage JPMorgan Funds since 1989. | Retired; President and Chief Executive Officer, Eastern States Bankcard (1971–1988). | 131 | None. | ||||||||||||
| John F. Finn (1947); Trustee since 2005; Trustee of heritage One Group Mutual Funds since 1998. | President and Chief Executive Officer, Gardner, Inc. (wholesale distributor to outdoor power equipment industry) (1979–present). | 131 | Director, Cardinal Health, Inc (CAH) (1994–present); Chairman, The Columbus Association of the Performing Arts (CAPA) (2003–present). | ||||||||||||
| Dr. Matthew Goldstein (1941); Trustee since 2005; Trustee of heritage JPMorgan Funds since 2003. | Chancellor, City University of New York (1999–present); President, Adelphi University (New York) (1998–1999). | 131 | Director, Albert Einstein School of Medicine (1998–present); Director, New Plan Excel Realty Trust, Inc. (real estate investment trust) (2000–present); Director, Lincoln Center Institute for the Arts in Education (1999–present). | ||||||||||||
| Robert J. Higgins (1945); Trustee since 2005; Trustee of heritage JPMorgan Funds since 2002. | Retired; Director of Administration of the State of Rhode Island (2003–2004); President — Consumer Banking and Investment Services, Fleet Boston Financial (1971–2001). | 131 | None. | ||||||||||||
| Peter C. Marshall (1942); Trustee since 2005; Trustee of heritage One Group Mutual Funds since 1994. | Self-employed business consultant (2001–present); Senior Vice President, W.D. Hoard, Inc. (corporate parent of DCI Marketing, Inc.) (2000–2002); President, DCI Marketing, Inc. (1992–2000). | 131 | None. | ||||||||||||
| Marilyn McCoy (1948); Trustee since 2005; Trustee of heritage One Group Mutual Funds since 1999. | Vice President of Administration and Planning, Northwestern University (1985–present). | 131 | Trustee, Mather LifeWays (1994–present); Trustee, Carleton College (2003–present). | ||||||||||||
| William G. Morton, Jr. (1937); Trustee since 2005; Trustee of heritage JPMorgan Funds since 2003. | Retired; Chairman Emeritus (2001–2002), and Chairman and Chief Executive Officer, Boston Stock Exchange (1985–2001). | 131 | Director, Radio Shack Corporation (electronics) (1987–present); Director, The National Football Foundation and College Hall of Fame (1994–present); Trustee, Stratton Mountain School (2001–present). | ||||||||||||
| Name (Year of Birth); Positions With the Portfolio | | Principal Occupations During Past 5 Years | | Number of Portfolios in Fund Complex Overseen by Trustee (1) | | Other Directorships Held Outside Fund Complex | |||||||||
|---|---|---|---|---|---|---|---|---|---|---|---|---|---|---|---|
Independent Trustees | |||||||||||||||
| Robert A. Oden, Jr. (1946); Trustee since 2005; Trustee of heritage One Group Mutual Funds since 1997. | President, Carleton College (2002–present); President, Kenyon College (1995–2002). | 131 | Director, American University in Cairo. | ||||||||||||
| Fergus Reid, III (1932); Trustee (Chairman) since 2005; Trustee (Chairman) of heritage JPMorgan Funds since 1987. | Chairman, Lumelite Corporation (plastics manufacturing) (2003–present); Chairman and Chief Executive Officer, Lumelite Corporation (1985–2002). | 131 | Trustee, Morgan Stanley Funds (196 portfolios) (1995–present). | ||||||||||||
| Frederick W. Ruebeck (1939); Trustee since 2005; Trustee of heritage One Group Mutual Funds since 1994. | Advisor, Jerome P. Green & Associates, LLC (broker-dealer) (2000–present); Chief Investment Officer, Wabash College (2004–present); self-employed consultant (2000–present); Director of Investments, Eli Lilly and Company (1988–1999). | 131 | Trustee, Wabash College (1988–present); Chairman, Indianapolis Symphony Orchestra Foundation (1994–present). | ||||||||||||
| James J. Schonbachler (1943); Trustee since 2005; Trustee of heritage JPMorgan Funds since 2001. | Retired; Managing Director of Bankers Trust Company (financial services) (1968–1998). | 131 | None. | ||||||||||||
Interested Trustee | |||||||||||||||
| Leonard M. Spalding, Jr.* (1935); Trustee since 2005; Trustee of heritage JPMorgan Funds since 1998. | Retired; Chief Executive Officer, Chase Mutual Funds (investment company) (1989–1998); President and Chief Executive Officer, Vista Capital Management (investment management) (1990–1998); Chief Investment Executive, Chase Manhattan Private Bank (investment management) (1990–1998). | 131 | Director, Glenview Trust Company, LLC (2001–present); Trustee, St. Catherine College (1998–present); Trustee, Bellarmine University (2000–present); Director, Springfield-Washington County Economic Development Authority (1997–present); Trustee, Marion and Washington County, Kentucky Airport Board (1998–present); Trustee, Catholic Education Foundation (2005–present). | ||||||||||||
| (1) | A Fund Complex means two or more registered investment companies that hold themselves out to investors as related companies for purposes of investment and investor services or have a common investment adviser or have an investment adviser that is an affiliated person of the investment adviser of any of the other registered investment companies. The JPMorgan Funds Complex for which the Board of Trustees serves currently includes eight registered investment companies (131 funds). |
| * | Mr. Spalding is deemed to be an “interested person” due to his ownership of JPMorgan Chase stock. |
(Unaudited)
| Name (Year of Birth), Positions Held with the Trust | | Principal Occupations During Past 5 Years | ||||
|---|---|---|---|---|---|---|
| George C.W. Gatch (1962), President since 2005 | Managing Director, J.P. Morgan Investment Management Inc.; Director and President, JPMorgan Distribution Services, Inc. and JPMorgan Funds Management, Inc. since 2005. Mr. Gatch is CEO and President of the JPMorgan Funds. Mr. Gatch has been an employee of JPMorgan since 1986 and has held positions such as President and CEO of DKB Morgan, a Japanese mutual fund company, which was a joint venture between J.P. Morgan and Dai-Ichi Kangyo Bank, as well as positions in business management, marketing and sales. | |||||
| Robert L. Young (1963), Senior Vice President since 2005* | Director and Vice President, JPMorgan Distribution Services, Inc. and JPMorgan Funds Management, Inc.; Chief Operating Officer, JPMorgan Funds since 2005, and One Group Mutual Funds from 2001 until 2005. Mr. Young was Vice President and Treasurer, JPMorgan Funds Management, Inc. (formerly One Group Administrative Services) and Vice President and Treasurer, JPMorgan Distribution Services, Inc. (formerly One Group Dealer Services, Inc.) from 1999 to 2005. | |||||
| Patricia A. Maleski (1960), Vice President and Chief Administrative Officer since 2005 | Managing Director, JPMorgan Funds Management, Inc.; previously, Treasurer, JPMorgan Funds and Head of Funds Administration and Board Liaison. Ms. Maleski was Vice President of Finance for the Pierpont Group, Inc. from 1996–2001, an independent company owned by the Board of Directors/Trustees of the JPMorgan Funds, prior to joining JPMorgan Chase & Co. in 2001. | |||||
| Stephanie J. Dorsey (1969), Treasurer since 2005* | Vice President, JPMorgan Funds Management, Inc.; Director of Mutual Fund Administration, JPMorgan Funds Management, Inc. (formerly One Group Administrative Services), from 2004 to 2005; Ms. Dorsey worked for JPMorgan Chase & Co., (formerly Bank One Corporation) from 2003 to 2004; prior to joining Bank One Corporation, she was a Senior Manager specializing in Financial Services audits at PricewaterhouseCoopers LLP from 1992 through 2002. | |||||
| Stephen M. Ungerman (1953), Chief Compliance Officer since 2005 | Senior Vice President, JPMorgan Chase & Co.; Mr. Ungerman was head of Fund Administration — Pooled Vehicles from 2000 to 2004. Mr. Ungerman held a number of positions in Prudential Financial’s asset management business prior to 2000. | |||||
| Paul L. Gulinello (1950), AML Compliance Officer since 2005 | Vice President and Anti Money Laundering Compliance Officer for JPMorgan Asset Management Americas, additionally responsible for personal trading and compliance testing since 2004; Treasury Services Operating Risk Management and Compliance Executive supporting all JPMorgan Treasury Services business units from July 2000 to 2004. | |||||
| Stephen M. Benham (1959), Secretary since 2005 | Vice President and Assistant General Counsel, JPMorgan Chase & Co. since 2004; Vice President (Legal Advisory) of Merrill Lynch Investment Managers, L.P. from 2000 to 2004. | |||||
| Elizabeth A. Davin (1964), Assistant Secretary since 2005* | Vice President and Assistant General Counsel, JPMorgan Chase & Co. since 2005; Senior Counsel, JPMorgan Chase & Co. (formerly Bank One Corporation) from 2004 to 2005; Assistant General Counsel and Associate General Counsel and Vice President, Gartmore Global Investments, Inc. from 1999 to 2004. | |||||
| Jessica K. Ditullio (1962), Assistant Secretary since 2005* | Vice President and Assistant General Counsel, JPMorgan Chase & Co. since 2005; Ms. Ditullio has served as an attorney with various titles for JPMorgan Chase & Co. (formerly Bank One Corporation) since 1990. | |||||
| Nancy E. Fields (1949), Assistant Secretary since 2005* | Vice President, JPMorgan Funds Management, Inc. and JPMorgan Distribution Services, Inc.; From 1999 to 2005, Director, Mutual Fund Administration, JPMorgan Funds Management, Inc. (formerly One Group Administrative Services) and Senior Project Manager, Mutual Funds, JPMorgan Distribution Services, Inc. (formerly One Group Dealer Services, Inc.). | |||||
| Michael C. Raczynski (1975), Assistant Secretary since 2006 | Vice President and Assistant General Counsel, JPMorgan Chase & Co. since 2006; Associate, Stroock & Stroock & Lavan LLP from 2001 to 2006. | |||||
| Ellen W. O’Brien (1957), Assistant Secretary since 2005** | Assistant Vice President, JPMorgan Investor Services, Co., responsible for Blue Sky registration. Ms. O’Brien has served in this capacity since joining the firm in 1991. | |||||
| Name (Year of Birth), Positions Held with the Trust | | Principal Occupations During Past 5 Years | ||||
|---|---|---|---|---|---|---|
| Laura S. Melman (1966) Assistant Treasurer since 2006 | Vice President, JPMorgan Funds Management, Inc. since August, 2006, responsible for Taxation; Vice President of Structured Products at The Bank of New York Co., Inc. from 2001 to 2006. | |||||
| Arthur A. Jensen (1966), Assistant Treasurer since 2005* | Vice President, JPMorgan Funds Management, Inc. since April 2005; formerly, Vice President of Financial Services of BISYS Fund Services, Inc. from 2001 to 2005; Mr. Jensen was Section Manager at Northern Trust Company and Accounting Supervisor at Allstate Insurance Company prior to 2001. | |||||
| Jeffrey D. House (1972) Assistant Treasurer since 2006* | Vice President, JPMorgan Funds Management, Inc. since July 2006; formerly, Senior Manager of Financial Services at BISYS Fund Services, Inc. from 1995 to 2006. | |||||
| * | The contact address for the officer is 1111 Polaris Parkway, Columbus, OH 43271. |
| ** | The contact address for the officer is 73 Tremont Street, Floor 1, Boston MA 02108. |
(Unaudited)
December 31, 2006
| Class 1 | | Beginning Account Value, July 1, 2006 | | Ending Account Value, December 31, 2006 | | Expenses Paid During July 1, 2006 to December 31, 2006* | | Annualized Expense Ratio | ||||||||||
|---|---|---|---|---|---|---|---|---|---|---|---|---|---|---|---|---|---|---|
| Actual | $ | 1,000.00 | $ | 1,047.70 | $ | 3.10 | 0.60 | % | ||||||||||
| Hypothetical | 1,000.00 | 1,022.18 | 3.06 | 0.60 | ||||||||||||||
| * | Expenses are equal to the Portfolio’s annualized expense ratio, multiplied by the average account value over the period, multiplied by 184/365 (to reflect the one-half year period). |
(Unaudited)
(Unaudited) (continued)
fund investment advisory contracts because comparative information is not generally publicly available and is affected by numerous factors, including the structure of the particular Advisor, the types of funds it manages, its business mix, numerous assumptions regarding allocations and the fact that publicly-traded fund managers’ operating profits and net income are net of distribution and marketing expenses. Based on their review, the Trustees concluded that the profitability to the Advisor of each of the Investment Advisory Agreements was not unreasonable in light of the services and benefits provided to each Fund.