UNITED STATES
SECURITIES AND EXCHANGE COMMISSION
Washington, DC 20549
FORMN-CSRS
CERTIFIED SHAREHOLDER REPORT OF REGISTERED
MANAGEMENT INVESTMENT COMPANIES
Investment Company Act file number811-07876
Templeton China World Fund
(Exact name of registrant as specified in charter)
300 S.E. 2nd Street,
Fort Lauderdale, FL 33301-1923
(Address of principal executive offices) (Zip code)
Craig S. Tyle,
One Franklin Parkway,
San Mateo, CA 94403-1906
(Name and address of agent for service)
Registrant’s telephone number, including area code:(954)527-7500_
Date of fiscal year end:8/31
Date of reporting period:2/28/19
| Item 1. | Reports to Stockholders. |
| | |

| | Semiannual Report and Shareholder Letter February 28, 2019 |
Sign up for electronic delivery at franklintempleton.com/edelivery
Internet Delivery of Fund Reports Unless You Request Paper Copies: Effective January 1, 2021, as permitted by the SEC, paper copies of the Fund’s shareholder reports will no longer be sent by mail, unless you specifically request them from the Fund or your financial intermediary. Instead, the reports will be made available on a website, and you will be notified by mail each time a report is posted and provided with a website link to access the report.
If you already elected to receive shareholder reports electronically, you will not be affected by this change and you need not take any action. If you have not signed up for electronic delivery, we would encourage you to join fellow shareholders who have. You may elect to receive shareholder reports and other communications electronically from the Fund by calling (800)632-2301 or by contacting your financial intermediary.
You may elect to continue to receive paper copies of all your future shareholder reports free of charge by contacting your financial intermediary or, if you invest directly with a Fund, calling (800)632-2301 to let the Fund know of your request. Your election to receive reports in paper will apply to all funds held in your account.
Franklin Templeton
Successful investing begins with ambition. And achievement only comes when you reach for it. That’s why we continually strive to deliver better outcomes for investors. No matter what your goals are, our deep, global investment expertise allows us to offer solutions that can help.
During our more than 70 years of experience, we’ve managed through all kinds of markets—up, down and those in between. We’re always preparing for what may come next. It’s because of this, combined with our strength as one of the world’s largest asset managers that we’ve earned the trust of millions of investors around the world.
Dear Shareholder:
China’s economic expansion moderated during the six months ended February 28, 2019, due to weak investment growth, lower domestic demand and ongoing trade tensions with the U.S. However, investor sentiment improved in the period’s second half amid increased monetary and fiscal stimulus measures and optimism about a potential U.S.-China trade deal. In this environment, Greater China stocks rose modestly for thesix-month period, as measured by the MSCI Golden Dragon Index, which tracks stock market performance in China, Hong Kong and Taiwan.
We are committed to our long-term perspective and disciplined investment approach as we conduct a rigorous, fundamental analysis of securities with a regular emphasis on investment risk management.
Historically, patient investors have achieved rewarding results by evaluating their goals, diversifying their assets globally and maintaining a disciplined investment program, all hallmarks of the Templeton investment philosophy developed more than 60 years ago. We continue to recommend investors consult their financial advisors and review their portfolios to design a long-term strategy and portfolio allocation that meet their individual needs, goals and risk tolerance.
Templeton China World Fund’s semiannual report includes more detail about prevailing conditions and a discussion about
investment decisions during the period. Please remember all securities markets fluctuate, as do mutual fund share prices.
We thank you for investing with Franklin Templeton, welcome your questions and comments, and look forward to serving your investment needs in the years ahead.
|
| Sincerely, |
 |
| Manraj S. Sekhon, CFA |
| Chief Investment Officer |
| Franklin Templeton Emerging Markets Equity |
This letter reflects our analysis and opinions as of February 28, 2019, unless otherwise indicated. The information is not a complete analysis of every aspect of any market, country, industry, security or fund. Statements of fact are from sources considered reliable.
CFA® is a trademark owned by CFA Institute.
| | |
| | Not FDIC Insured | May Lose Value | No Bank Guarantee |
| | | | |
| | | |
| franklintempleton.com | | Not part of the semiannual report | | 1 |
Visitfranklintempleton.comfor fund updates, to access your account, or to find helpful financial planning tools.
| | | | |
| | | |
2 | | Semiannual Report | | franklintempleton.com |
Semiannual Report
Templeton China World Fund
We are pleased to bring you Templeton China World Fund’s semiannual report for the period ended February 28, 2019.
Your Fund’s Goal and Main Investments
The Fund seeks long-term capital appreciation. Under normal market conditions, the Fund invests at least 80% of its net assets in securities of “China companies,” as defined in the Fund’s prospectus.
Performance Overview
For the six months ended February 28, 2019, the Fund’s Class A shares posted a total return of-0.43%. For comparison, the MSCI Golden Dragon Index, which measures stock market performance in China, Hong Kong and Taiwan, posted a +0.49% cumulative total return for the same period.1 Also for comparison, the Standard & Poor’s®/International Finance Corporation Investable China Index, which measures Chinese stock market performance, posted a +0.22% total return for the same period.1 For the10-year period ended February 28, 2019, the Fund’s Class A shares posted a +162.73% cumulative total return, compared with the MSCI Golden Dragon Index’s +228.08% cumulative total return for the same period.2 Please note index performance information is provided for reference and we do not attempt to track the index but rather undertake investments on the basis of fundamental research. You can find more performance data in the Performance Summary beginning on page 6.
Performance data represent past performance, which does not guarantee future results. Investment return and principal value will fluctuate, and you may have a gain or loss when you sell your shares. Current performance may differ from figures shown. For most recentmonth-end performance, go tofranklintempleton.comor call(800)342-5236.
Economic and Market Overview
China’s economy, as measured by gross domestic product,
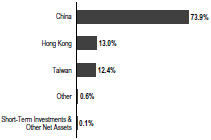
Geographic Composition
Based on Total Net Assets as of 2/28/19
grew at an estimated 6.4% annual rate in 2018’s fourth quarter, the slowest rate since 2009.3 Factors weighing on the economy included the ongoing trade dispute with the U.S., weak investment levels and decreased domestic demand. Growth was supported by an increase in exports and a strengthened service sector. The People’s Bank of China (PBOC) left its benchmark interest rate unchanged during the period. However, in response to the country’s trade conflict with the U.S., the PBOC lowered its cash reserve requirement ratio for some banks in an effort to improve market liquidity, spur lending to smaller companies and support economic growth.
Greater China stocks fell during the first half of thesix-month period due to concerns about escalating trade tensions with the U.S., which included the imposition of higher tariffs on both countries’ goods, and China’s ability to continue its economic growth while making structural adjustments. Chinese equities recovered in the second half of the period largely due to easing trade tensions with the U.S., including the decision by U.S. President Donald Trump to delay the imposition of tariffs scheduled to take effect in March. An appreciating renminbi along with monetary and fiscal stimulus measures also boosted investor sentiment.
1. Source: Morningstar.
2. Source: Morningstar. As of 2/28/19, the Fund’s Class A10-year average annual total return not including sales charges was +10.14%, compared with the10-year average annual total return of +12.62% for the MSCI Golden Dragon Index.
The indexes are unmanaged and include reinvestment of any income or distributions. They do not reflect any fees, expenses or sales charges. One cannot invest directly in an index, and an index is not representative of the Fund’s portfolio.
3. Source: The website of the National Bureau of Statistics of the People’s Republic of China (www.stats.gov.cn).
The dollar value, number of shares or principal amount, and names of all portfolio holdings are listed in the Fund’s Statement of Investments (SOI).
The SOI begins on page 13.
| | | | |
| | | |
| franklintempleton.com | | Semiannual Report | | 3 |
TEMPLETON CHINA WORLD FUND
In this environment, Greater China stocks, as measured by the MSCI Golden Dragon Index, posted a +0.49% total return for the six months ended February 28, 2019.1 The MSCI China Index posted a total return of +1.14%, compared with +8.62% for the MSCI Hong Kong Index and-7.71% for the MSCI Taiwan Index.1
Investment Strategy
Our investment strategy employs a fundamental research, value-oriented, long-term approach. We focus on the market price of a company’s securities relative to our evaluation of the company’s long-term earnings, asset value and cash flow potential. We also consider a company’s profit and loss outlook, balance sheet strength, cash flow trends and asset value in relation to the current price. Our analysis considers the company’s corporate governance behavior as well as its position in its sector, the economic framework and political environment.
Manager’s Discussion
During the six months under review, key contributors to the Fund’s absolute performance included Hopewell Holdings, AIA Group and Anta Sports Products.
Hopewell has major interests in property investment and development as well as hospitality in China and Hong Kong. The company also owns a majority shareholding in Hopewell Highway Infrastructure, which is mainly engaged in building and operating strategic expressways in Guangdong province. Shares of Hopewell jumped in December 2018, as investors welcomed the announcement of a privatization plan by major shareholders.
AIA is a leadingpan-Asian life insurance group with a strong presence in the Asia-Pacific region. The firm also provides retirement planning, accident and health insurance, as well as wealth management products. The company delivered solid third-quarter results with double-digit growth in the value of new business, which measures expected profits from new premiums and is a key gauge for future growth. Growth was driven by operations in Hong Kong, China and Thailand. Investors also welcomed AIA’s plans to bid for a controlling stake in a mainland Chinese life insurance company, which could allow the firm to benefit from growing demand and expand its operations across the country.
Anta Sports Products is a major sportswear company in China. It designs, develops, manufactures and markets apparel, footwear and accessories under the Anta brand. Other brands in its portfolio include global names such as Fila. Shares of Anta
Top 10 Holdings
2/28/19
| | |
Company Sector/Industry, Country | | % of Total
Net Assets |
| |
Tencent Holdings Ltd. Interactive Media & Services, China | | 8.8% |
| |
Alibaba Group Holding Ltd. Internet & Direct Marketing Retail, China | | 8.7% |
| |
Taiwan Semiconductor Manufacturing Co. Ltd. Semiconductors & Semiconductor Equipment, Taiwan | | 8.7% |
| |
Anta Sports Products Ltd. Textiles, Apparel & Luxury Goods, China | | 6.6% |
| |
AIA Group Ltd. Insurance, Hong Kong | | 5.2% |
| |
China Petroleum & Chemical Corp. Oil, Gas & Consumable Fuels, China | | 4.9% |
| |
China Construction Bank Corp. Banks, China | | 4.8% |
| |
Uni-President China Holdings Ltd. Food Products, China | | 4.2% |
| |
Industrial and Commercial Bank of China Ltd. Banks, China | | 4.2% |
| |
China Mobile Ltd. Wireless Telecommunication Services, China | | 3.2% |
rose due to better-than-expected corporate results, including double-digit growth in 2018 revenues and earnings. Investors expect solid sales momentum and the opening of new stores in 2019 to support the company’s continued growth. Anta’s plans to acquire a Finnish sporting goods manufacturer, however, received a lukewarm reception from investors.
Key detractors from absolute performance included Taiwan Semiconductor Manufacturing Co. (TSMC), China Petroleum and Chemical (Sinopec) and Baidu.
TSMC is one of the world’s leading semiconductor makers, with major global technology companies among its primary clients. Macro concerns such as the U.S.-China trade dispute, a decline in memory chip prices and an increase in inventory levels hurt the company’s share price in late 2018. The stock partly recovered in early 2019, but still ended the reporting period down. TSMC was negatively impacted by a weak fourth-quarter 2018 earnings report from U.S. smart-phone maker Apple, and while its results were in line with market expectations, the firm reduced its first-quarter 2019 revenue guidance.
Sinopec is one of China’s largest integrated energy and chemical companies. The company’s share price was hurt by lower-than-expected preliminary 2018 net profit, which implied a sharp decline in fourth-quarter earnings. Lower oil prices, asset impairment and inventory losses, as well as an operating
| | | | |
| | | |
4 | | Semiannual Report | | franklintempleton.com |
TEMPLETON CHINA WORLD FUND
loss at Sinopec’s trading arm due to hedging activities, limited net profit. A rebound in oil prices and expectations that the company would maintain its generous dividend policy, however, lifted shares in the first two months of 2019.
Baidu is China’s largest search engine and a beneficiary of the country’s growing online advertising market. The company reported mixed fourth-quarter 2018 results. Although revenues exceeded market expectations with double-digityear-on-year growth, operating profits declined substantially. Weak first-quarter 2019 management guidance and cost concerns about plans to increase marketing initiatives further negatively impacted sentiment for the stock.
In the past six months, the Fund reduced its investments in the information technology, materials and communication services sectors to raise funds for dividend and capital gains distribution during the period.4 Some sales were also made in the consumer discretionary and energy sectors.5 Key sales included reducing investments in TSMC, Asia Cement China Holdings, a cement producer in China’s Sichuan region, and Tencent Holdings, a Chinese internet services company.
Meanwhile, we increased some of the Fund’s investments in favor of what we viewed as undervalued investments with attractive fundamentals. Key purchases included adding Bank of Ningbo, a regional Chinese commercial bank, to the portfolio, as well as increasing existing investments in Shanghai Pharmaceuticals Holding, a leading state-owned pharmaceutical company in China, Ginko International, a Taiwanese contact lens manufacturer, and Ping An Insurance (Group) Co. of China, a major Chinese insurance company.
Thank you for your continued participation in Templeton China World Fund. We look forward to serving your future investment needs.
| | |
 | | 
Eddie Chow, CFA Portfolio Manager |
The foregoing information reflects our analysis, opinions and portfolio holdings as of February 28, 2019, the end of the reporting period. The way we implement our main investment strategies and the resulting portfolio holdings may change depending on factors such as market and economic conditions. These opinions may not be relied upon as investment advice or an offer for a particular security. The information is not a complete analysis of every aspect of any market, country, industry, security or the Fund. Statements of fact are from sources considered reliable, but the investment manager makes no representation or warranty as to their completeness or accuracy. Although historical performance is no guarantee of future results, these insights may help you understand our investment management philosophy.
4. The information technology sector comprises communications equipment, IT services, and semiconductors and semiconductor equipment in the SOI. The materials sector comprises construction materials and paper and forest products in the SOI. The communication services sector comprises entertainment, interactive media and services, and wireless telecommunication services in the SOI.
5. The consumer discretionary sector comprises auto components; automobiles; internet and direct marketing retail; and textiles, apparel and luxury goods in the SOI. The energy sector comprises oil, gas and consumable fuels in the SOI.
See www.franklintempletondatasources.com for additional data provider information.
| | | | |
| | | |
| franklintempleton.com | | Semiannual Report | | 5 |
TEMPLETON CHINA WORLD FUND
Performance Summary as of February 28, 2019
The performance table does not reflect any taxes that a shareholder would pay on Fund dividends, capital gain distributions, if any, or any realized gains on the sale of Fund shares. Total return reflects reinvestment of the Fund’s dividends and capital gain distributions, if any, and any unrealized gains or losses. Your dividend income will vary depending on dividends or interest paid by securities in the Fund’s portfolio, adjusted for operating expenses of each class. Capital gain distributions are net profits realized from the sale of portfolio securities.
Performance as of 2/28/191
Cumulative total return excludes sales charges. Average annual total return includes maximum sales charges. Sales charges will vary depending on the size of the investment and the class of share purchased. The maximum is 5.50% and the minimum is 0%.Class A:5.50% maximum initial sales charge;Advisor Class:no sales charges. For other share classes, visitfranklintempleton.com.
| | | | |
| Share Class | | Cumulative
Total Return2
| | Average Annual
Total Return3 |
| | |
A4 | | | | |
| | |
6-Month | | -0.43% | | -5.91% |
| | |
1-Year | | -2.05% | | -7.44% |
| | |
5-Year | | +33.62% | | +4.78% |
| | |
10-Year | | +162.73% | | +9.52% |
| | |
Advisor | | | | |
| | |
6-Month | | -0.31% | | -0.31% |
| | |
1-Year | | -1.79% | | -1.79% |
| | |
5-Year | | +35.36% | | +6.24% |
| | |
10-Year | | +170.22% | | +10.45% |
Performance data represent past performance, which does not guarantee future results. Investment return and principal value will fluctuate, and you may have a gain or loss when you sell your shares. Current performance may differ from figures shown. For most recentmonth-end performance, go tofranklintempleton.comor call(800)342-5236.
See page 7 for Performance Summary footnotes.
| | | | |
| | | |
6 | | Semiannual Report | | franklintempleton.com |
TEMPLETON CHINA WORLD FUND
PERFORMANCE SUMMARY
Distributions(9/1/18–2/28/19)
| | | | | | | | | | | | | | | | |
| Share Class | | Net Investment
Income | | | Short-Term
Capital Gain | | | Long-Term
Capital Gain | | | Total | |
| | | | |
| A | | | $0.3029 | | | | $0.1054 | | | | $2.3798 | | | | $2.7881 | |
| | | | |
| C | | | $0.0075 | | | | $0.1054 | | | | $2.3798 | | | | $2.4927 | |
| | | | |
| R6 | | | $0.3661 | | | | $0.1054 | | | | $2.3798 | | | | $2.8513 | |
| | | | |
| Advisor | | | $0.3413 | | | | $0.1054 | | | | $2.3798 | | | | $2.8265 | |
Total Annual Operating Expenses5
| | | | | | | | |
| Share Class | | With Fee
Waiver | | | Without Fee
Waiver | |
| | |
| A | | | 1.85% | | | | 1.85% | |
| | |
| Advisor | | | 1.60% | | | | 1.60% | |
Each class of shares is available to certain eligible investors and has different annual fees and expenses, as described in the prospectus.
All investments involve risks, including possible loss of principal. The government’s participation in the economy is still high and, therefore, the Fund’s investments in China will be subject to larger regulatory risk levels compared to many other countries. In addition, special risks are associated with international investing, including currency fluctuations, economic instability and political developments. Investments in emerging markets involve heightened risks related to the same factors. The Fund may also experience greater volatility than a fund that is more broadly diversified geographically. Historically, smaller and midsized securities have experienced more price volatility than larger company stocks, especially over the short term. Also, as a nondiversified fund investing in China companies, the Fund may invest in a relatively small number of issuers and, as a result, be subject to a greater risk of loss with respect to its portfolio securities. The Fund is designed for the aggressive portion of a well-diversified portfolio. The Fund is actively managed but there is no guarantee that the manager’s investment decisions will produce the desired results. The Fund’s prospectus also includes a description of the main investment risks.
1. The Fund has an expense reduction and a fee waiver associated with any investments it makes in a Franklin Templeton money fund and/or other Franklin Templeton fund, contractually guaranteed through 12/31/19. Fund investment results reflect the expense reduction and fee waiver; without these reductions, the results would have been lower.
2. Cumulative total return represents the change in value of an investment over the periods indicated.
3. Average annual total return represents the average annual change in value of an investment over the periods indicated. Return for less than one year, if any, has not been annualized.
4. Prior to 9/10/18, these shares were offered at a higher initial sales charge of 5.75%, thus actual returns would have differed. Total returns with sales charges have been restated to reflect the current maximum initial sales charge of 5.50%.
5. Figures are as stated in the Fund’s current prospectus and may differ from the expense ratios disclosed in the Your Fund’s Expenses and Financial Highlights sections in this report. In periods of market volatility, assets may decline significantly, causing total annual Fund operating expenses to become higher than the figures shown.
| | | | |
| | | |
| franklintempleton.com | | Semiannual Report | | 7 |
TEMPLETON CHINA WORLD FUND
Your Fund’s Expenses
As a Fund shareholder, you can incur two types of costs: (1) transaction costs, including sales charges (loads) on Fund purchases and redemptions; and (2) ongoing Fund costs, including management fees, distribution and service(12b-1) fees, and other Fund expenses. All mutual funds have ongoing costs, sometimes referred to as operating expenses. The table below shows ongoing costs of investing in the Fund and can help you understand these costs and compare them with those of other mutual funds. The table assumes a $1,000 investment held for the six months indicated.
Actual Fund Expenses
The table below provides information about actual account values and actual expenses in the columns under the heading “Actual.” In these columns the Fund’s actual return, which includes the effect of Fund expenses, is used to calculate the “Ending Account Value” for each class of shares. You can estimate the expenses you paid during the period by following these steps (ofcourse, your account value and expenses will differ from those in this illustration):Divide your account value by $1,000 (if your account had an $8,600 value, then $8,600 ÷ $1,000 = 8.6). Then multiply the result by the number in the row for your class of shares under the headings “Actual” and “Expenses Paid During Period” (ifActual Expenses Paid During Period were $7.50, then 8.6 x $7.50 = $64.50). In this illustration, the actual expenses paid this period are $64.50.
Hypothetical Example for Comparison with Other Funds
Under the heading “Hypothetical” in the table, information is provided about hypothetical account values and hypothetical expenses based on the Fund’s actual expense ratio and an assumed rate of return of 5% per year before expenses, which is not the Fund’s actual return. This information may not be used to estimate the actual ending account balance or expenses you paid for the period, but it can help you compare ongoing costs of investing in the Fund with those of other funds. To do so, compare this 5% hypothetical example for the class of shares you hold with the 5% hypothetical examples that appear in the shareholder reports of other funds.
Please note that expenses shown in the table are meant to highlight ongoing costs and do not reflect any transactional costs. Therefore, information under the heading “Hypothetical” is useful in comparing ongoing costs only, and will not help you compare total costs of owning different funds. In addition, if transactional costs were included, your total costs would have been higher.
| | | | | | | | | | | | | | | | | | |
| | | | | | | Actual (actual return after expenses) | | | | Hypothetical
(5% annual return before expenses) | | | | |
| | | | | | | | | | | | | | |
| | | | | | | | | |
Share
Class | | Beginning
Account
Value 9/1/18 | | | | Ending
Account
Value 2/28/19 | | Expenses Paid During
Period 9/1/18–2/28/191,2 | | | | Ending
Account
Value 2/28/19 | | Expenses Paid During
Period 9/1/18–2/28/191,2 | | | | Net
Annualized
Expense
Ratio2 |
| | | | | | | | | | | | |
A | | $1,000 | | | | $995.70 | | $ 9.01 | | | | $1,015.77 | | $ 9.10 | | | | 1.82% |
C | | $1,000 | | | | $991.60 | | $12.64 | | | | $1,012.10 | | $12.77 | | | | 2.56% |
R6 | | $1,000 | | | | $997.70 | | $ 6.98 | | | | $1,017.80 | | $ 7.05 | | | | 1.41% |
Advisor | | $1,000 | | | | $996.90 | | $ 7.77 | | | | $1,017.01 | | $ 7.85 | | | | 1.57% |
1. Expenses are equal to the annualized expense ratio for thesix-month period as indicated above—in the far right column—multiplied by the simple average account value over the period indicated, and then multiplied by 181/365 to reflect theone-half year period.
2. Reflects expenses after fee waivers and expense reimbursements. Does not include acquired fund fees and expenses.
| | | | |
| | | |
8 | | Semiannual Report | | franklintempleton.com |
TEMPLETON CHINA WORLD FUND
Financial Highlights
| | | | | | | | | | | | | | | | | | | | | | | | |
| | | Six Months Ended
February 28, 2019 (unaudited) | | | Year Ended August 31, | |
| | | 2018 | | | 2017 | | | 2016 | | | 2015 | | | 2014 | |
| | | | | | |
Class A | | | | | | | | | | | | | | | | | | | | | | | | |
| | | | | | |
Per share operating performance | | | | | | | | | | | | | | | | | | | | | | | | |
(for a share outstanding throughout the period) | | | | | | | | | | | | | | | | | | | | | | | | |
| | | | | | |
Net asset value, beginning of period | | | $22.42 | | | | $23.49 | | | | $21.51 | | | | $26.19 | | | | $38.01 | | | | $35.78 | |
| | | | |
| | | | | | |
Income from investment operationsa: | | | | | | | | | | | | | | | | | | | | | | | | |
| | | | | | |
Net investment income (loss)b | | | (0.08 | ) | | | 0.29 | c | | | 0.15 | | | | 0.17 | | | | 0.32 | | | | 0.44 | |
| | | | | | |
Net realized and unrealized gains (losses) | | | (0.38 | ) | | | 1.29 | | | | 4.59 | | | | 2.19 | | | | (7.53 | ) | | | 3.94 | |
| | | | |
| | | | | | |
Total from investment operations | | | (0.46 | ) | | | 1.58 | | | | 4.74 | | | | 2.36 | | | | (7.21 | ) | | | 4.38 | |
| | | | |
| | | | | | |
Less distributions from: | | | | | | | | | | | | | | | | | | | | | | | | |
| | | | | | |
Net investment income | | | (0.30 | ) | | | (0.25 | ) | | | (0.19 | ) | | | (0.46 | ) | | | (0.45 | ) | | | (0.52 | ) |
| | | | | | |
Net realized gains | | | (2.49 | ) | | | (2.40 | ) | | | (2.57 | ) | | | (6.58 | ) | | | (4.16 | ) | | | (1.63 | ) |
| | | | |
| | | | | | |
Total distributions | | | (2.79 | ) | | | (2.65 | ) | | | (2.76 | ) | | | (7.04 | ) | | | (4.61 | ) | | | (2.15 | ) |
| | | | |
| | | | | | |
Net asset value, end of period | | | $19.17 | | | | $22.42 | | | | $23.49 | | | | $21.51 | | | | $26.19 | | | | $38.01 | |
| | | | |
| | | | | | |
Total returnd | | | (0.43)% | | | | 7.26% | | | | 26.00% | | | | 11.19% | | | | (20.57)% | | | | 12.76% | |
| | | | | | |
Ratios to average net assetse | | | | | | | | | | | | | | | | | | | | | | | | |
| | | | | | |
Expenses before waiver and payments by affiliates | | | 1.88% | | | | 1.85% | | | | 1.94% | | | | 1.91% | | | | 1.84% | | | | 1.85% | |
| | | | | | |
Expenses net of waiver and payments by affiliates | | | 1.82% | | | | 1.85%f | | | | 1.94%f,g | | | | 1.91%f,g | | | | 1.84%f | | | | 1.85%f | |
| | | | | | |
Net investment income (loss) | | | (0.81)% | | | | 1.26%c | | | | 0.71% | | | | 0.77% | | | | 0.98% | | | | 1.23% | |
| | | | | | |
Supplemental data | | | | | | | | | | | | | | | | | | | | | | | | |
| | | | | | |
Net assets, end of period (000’s) | | | $167,584 | | | | $178,315 | | | | $188,885 | | | | $186,850 | | | | $232,814 | | | | $373,231 | |
| | | | | | |
Portfolio turnover rate | | | 0.91% | | | | 12.15% | | | | 7.92% | | | | 3.87% | | | | 7.42% | | | | 3.75% | |
aThe amount shown for a share outstanding throughout the period may not correlate with the Statement of Operations for the period due to the timing of sales and repurchases of the Fund’s shares in relation to income earned and/or fluctuating fair value of the investments of the Fund.
bBased on average daily shares outstanding.
cNet investment income per share includes approximately $0.10 per share related to income received in the form of special dividends in connection with certain Fund holdings. Excluding this amount, the ratio of net investment income to average net assets would have been 0.83%.
dTotal return does not reflect sales commissions or contingent deferred sales charges, if applicable, and is not annualized for periods less than one year.
eRatios are annualized for periods less than one year.
fBenefit of waiver and payments by affiliates rounds to less than 0.01%.
gBenefit of expense reduction rounds to less than 0.01%.
| | | | |
| | | |
| franklintempleton.com | | The accompanying notes are an integral part of these financial statements. | Semiannual Report | | 9 |
TEMPLETON CHINA WORLD FUND
FINANCIAL HIGHLIGHTS
| | | | | | | | | | | | | | | | | | | | | | | | |
| | | Six Months Ended
February 28, 2019 (unaudited) | | | Year Ended August 31, | |
| | | 2018 | | | 2017 | | | 2016 | | | 2015 | | | 2014 | |
| | | | | | |
Class C | | | | | | | | | | | | | | | | | | | | | | | | |
| | | | | | |
Per share operating performance | | | | | | | | | | | | | | | | | | | | | | | | |
(for a share outstanding throughout the period) | | | | | | | | | | | | | | | | | | | | | | | | |
| | | | | | |
Net asset value, beginning of period | | | $22.13 | | | | $23.12 | | | | $21.18 | | | | $25.76 | | | | $37.52 | | | | $35.30 | |
| | | | |
| | | | | | |
Income from investment operationsa: | | | | | | | | | | | | | | | | | | | | | | | | |
| | | | | | |
Net investment income (loss)b | | | (0.12 | ) | | | 0.10 | c | | | (0.03) | | | | — | d | | | 0.08 | | | | 0.18 | |
| | | | | | |
Net realized and unrealized gains (losses) | | | (0.38 | ) | | | 1.31 | | | | 4.54 | | | | 2.17 | | | | (7.42) | | | | 3.91 | |
| | | | |
| | | | | | |
Total from investment operations | | | (0.50 | ) | | | 1.41 | | | | 4.51 | | | | 2.17 | | | | (7.34) | | | | 4.09 | |
| | | | |
| | | | | | |
Less distributions from: | | | | | | | | | | | | | | | | | | | | | | | | |
| | | | | | |
Net investment income | | | (0.01 | ) | | | (—) | d | | | — | | | | (0.17) | | | | (0.26) | | | | (0.24) | |
| | | | | | |
Net realized gains | | | (2.49 | ) | | | (2.40) | | | | (2.57) | | | | (6.58) | | | | (4.16) | | | | (1.63) | |
| | | | |
| | | | | | |
Total distributions | | | (2.50 | ) | | | (2.40) | | | | (2.57) | | | | (6.75) | | | | (4.42) | | | | (1.87) | |
| | | | |
| | | | | | |
Net asset value, end of period | | | $19.13 | | | | $22.13 | | | | $23.12 | | | | $21.18 | | | | $25.76 | | | | $37.52 | |
| | | | |
| | | | | | |
Total returne | | | (0.84) | % | | | 6.52% | | | | 24.97% | | | | 10.41% | | | | (21.16)% | | | | 11.98% | |
| | | | | | |
Ratios to average net assetsf | | | | | | | | | | | | | | | | | | | | | | | | |
| | | | | | |
Expenses before waiver and payments by affiliates | | | 2.62 | % | | | 2.60% | | | | 2.69% | | | | 2.66% | | | | 2.56% | | | | 2.54% | |
| | | | | | |
Expenses net of waiver and payments by affiliates | | | 2.56 | % | | | 2.60% | g | | | 2.69% | g,h | | | 2.66% | g,h | | | 2.56% | g | | | 2.54% | g |
| | | | | | |
Net investment income (loss) | | | (1.55) | % | | | 0.51% | c | | | (0.04)% | | | | 0.02% | | | | 0.26% | | | | 0.54% | |
| | | | | | |
Supplemental data | | | | | | | | | | | | | | | | | | | | | | | | |
| | | | | | |
Net assets, end of period (000’s) | | | $18,210 | | | | $36,678 | | | | $42,577 | | | | $48,769 | | | | $63,486 | | | | $103,346 | |
| | | | | | |
Portfolio turnover rate | | | 0.91% | | | | 12.15% | | | | 7.92% | | | | 3.87% | | | | 7.42% | | | | 3.75% | |
aThe amount shown for a share outstanding throughout the period may not correlate with the Statement of Operations for the period due to the timing of sales and repurchases of the Fund’s shares in relation to income earned and/or fluctuating fair value of the investments of the Fund.
bBased on average daily shares outstanding.
cNet investment income per share includes approximately $0.10 per share related to income received in the form of special dividends in connection with certain Fund holdings. Excluding this amount, the ratio of net investment income to average net assets would have been 0.08%.
dAmount rounds to less than $0.01 per share.
eTotal return does not reflect sales commissions or contingent deferred sales charges, if applicable, and is not annualized for periods less than one year.
fRatios are annualized for periods less than one year.
gBenefit of waiver and payments by affiliates rounds to less than 0.01%.
hBenefit of expense reduction rounds to less than 0.01%.
| | | | |
| | | |
10 | | Semiannual Report | The accompanying notes are an integral part of these financial statements. | | franklintempleton.com |
TEMPLETON CHINA WORLD FUND
FINANCIAL HIGHLIGHTS
| | | | | | | | | | | | | | | | | | | | | | | | |
| | | Six Months Ended
February 28, 2019 (unaudited) | | | Year Ended August 31, | |
| | | 2018 | | | 2017 | | | 2016 | | | 2015 | | | 2014 | |
| | | | | | |
Class R6 | | | | | | | | | | | | | | | | | | | | | | | | |
| | | | | | |
Per share operating performance | | | | | | | | | | | | | | | | | | | | | | | | |
(for a share outstanding throughout the period) | | | | | | | | | | | | | | | | | | | | | | | | |
| | | | | | |
Net asset value, beginning of period | | | $22.55 | | | | $23.66 | | | | $21.68 | | | | $26.41 | | | | $38.27 | | | | $36.03 | |
| | | | |
Income from investment operationsa: | | | | | | | | | | | | | | | | | | | | | | | | |
| | | | | | |
Net investment income (loss)b | | | (0.04) | | | | 0.45 | c | | | 0.27 | | | | 0.31 | | | | 0.49 | | | | 0.66 | |
| | | | | | |
Net realized and unrealized gains (losses) | | | (0.38) | | | | 1.25 | | | | 4.59 | | | | 2.18 | | | | (7.61) | | | | 3.93 | |
| | | | |
| | | | | | |
Total from investment operations | | | (0.42) | | | | 1.70 | | | | 4.86 | | | | 2.49 | | | | (7.12) | | | | 4.59 | |
| | | | |
Less distributions from: | | | | | | | | | | | | | | | | | | | | | | | | |
| | | | | | |
Net investment income | | | (0.37) | | | | (0.41) | | | | (0.31) | | | | (0.64) | | | | (0.58) | | | | (0.72) | |
| | | | | | |
Net realized gains | | | (2.49) | | | | (2.40) | | | | (2.57) | | | | (6.58) | | | | (4.16) | | | | (1.63) | |
| | | | |
| | | | | | |
Total distributions | | | (2.86) | | | | (2.81) | | | | (2.88) | | | | (7.22) | | | | (4.74) | | | | (2.35) | |
| | | | |
| | | | | | |
Net asset value, end of period | | | $19.27 | | | | $22.55 | | | | $23.66 | | | | $21.68 | | | | $26.41 | | | | $38.27 | |
| | | | |
| | | | | | |
Total returnd | | | (0.23)% | | | | 7.75% | | | | 26.62% | | | | 11.76% | | | | (20.20)% | | | | 13.31% | |
| | | | | | |
Ratios to average net assetse | | | | | | | | | | | | | | | | | | | | | | | | |
| | | | | | |
Expenses before waiver and payments by affiliates | | | 1.60% | | | | 1.50% | | | | 1.49% | | | | 1.45% | | | | 1.37% | | | | 1.37% | |
| | | | | | |
Expenses net of waiver and payments by affiliates | | | 1.41% | | | | 1.42% | | | | 1.44% | f | | | 1.42% | f | | | 1.37% | g | | | 1.37% | g |
| | | | | | |
Net investment income (loss) | | | (0.40)% | | | | 1.69% | c | | | 1.21% | | | | 1.26% | | | | 1.45% | | | | 1.71% | |
| | | | | | |
Supplemental data | | | | | | | | | | | | | | | | | | | | | | | | |
| | | | | | |
Net assets, end of period (000’s) | | | $2,917 | | | | $3,412 | | | | $1,213 | | | | $720 | | | | $711 | | | | $73,067 | |
| | | | | | |
Portfolio turnover rate | | | 0.91% | | | | 12.15% | | | | 7.92% | | | | 3.87% | | | | 7.42% | | | | 3.75% | |
aThe amount shown for a share outstanding throughout the period may not correlate with the Statement of Operations for the period due to the timing of sales and repurchases of the Fund’s shares in relation to income earned and/or fluctuating fair value of the investments of the Fund.
bBased on average daily shares outstanding.
cNet investment income per share includes approximately $0.10 per share related to income received in the form of special dividends in connection with certain Fund holdings. Excluding this amount, the ratio of net investment income to average net assets would have been 1.26%.
dTotal return is not annualized for periods less than one year.
eRatios are annualized for periods less than one year.
fBenefit of expense reduction rounds to less than 0.01%.
gBenefit of waiver and payments by affiliates rounds to less than 0.01%.
| | | | |
| | | |
| franklintempleton.com | | The accompanying notes are an integral part of these financial statements. | Semiannual Report | | 11 |
TEMPLETON CHINA WORLD FUND
FINANCIAL HIGHLIGHTS
| | | | | | | | | | | | | | | | | | | | | | | | |
| | | Six Months Ended
February 28, 2019 (unaudited) | | | Year Ended August 31, | |
| | | 2018 | | | 2017 | | | 2016 | | | 2015 | | | 2014 | |
| | | | | | |
Advisor Class | | | | | | | | | | | | | | | | | | | | | | | | |
| | | | | | |
Per share operating performance | | | | | | | | | | | | | | | | | | | | | | | | |
(for a share outstanding throughout the period) | | | | | | | | | | | | | | | | | | | | | | | | |
| | | | | | |
Net asset value, beginning of period | | | $22.60 | | | | $23.68 | | | | $21.68 | | | | $26.39 | | | | $38.26 | | | | $36.01 | |
| | | | |
| | | | | | |
Income from investment operationsa: | | | | | | | | | | | | | | | | | | | | | | | | |
| | | | | | |
Net investment income (loss)b | | | (0.06) | | | | 0.35 | c | | | 0.22 | | | | 0.22 | | | | 0.42 | | | | 0.55 | |
| | | | | | |
Net realized and unrealized gains (losses) | | | (0.38) | | | | 1.30 | | | | 4.60 | | | | 2.22 | | | | (7.61) | | | | 3.98 | |
| | | | |
| | | | | | |
Total from investment operations | | | (0.44) | | | | 1.65 | | | | 4.82 | | | | 2.44 | | | | (7.19) | | | | 4.53 | |
| | | | |
| | | | | | |
Less distributions from: | | | | | | | | | | | | | | | | | | | | | | | | |
| | | | | | |
Net investment income | | | (0.34) | | | | (0.33) | | | | (0.25) | | | | (0.57) | | | | (0.52) | | | | (0.65) | |
| | | | | | |
Net realized gains | | | (2.49) | | | | (2.40) | | | | (2.57) | | | | (6.58) | | | | (4.16) | | | | (1.63) | |
| | | | |
| | | | | | |
Total distributions | | | (2.83) | | | | (2.73) | | | | (2.82) | | | | (7.15) | | | | (4.68) | | | | (2.28) | |
| | | | |
| | | | | | |
Net asset value, end of period | | | $19.33 | | | | $22.60 | | | | $23.68 | | | | $21.68 | | | | $26.39 | | | | $38.26 | |
| | | | |
| | | | | | |
Total returnd | | | (0.31)% | | | | 7.54% | | | | 26.31% | | | | 11.51% | | | | (20.38)% | | | | 13.12% | |
| | | | | | |
Ratios to average net assetse | | | | | | | | | | | | | | | | | | | | | | | | |
| | | | | | |
Expenses before waiver and payments by affiliates | | | 1.63% | | | | 1.60% | | | | 1.69% | | | | 1.66% | | | | 1.56% | | | | 1.55% | |
| | | | | | |
Expenses net of waiver and payments by affiliates | | | 1.57% | | | | 1.60% | f | | | 1.69% | f,g | | | 1.66% | f,g | | | 1.56% | f | | | 1.55% | f |
| | | | | | |
Net investment income (loss) | | | (0.56)% | | | | 1.51% | c | | | 0.96% | | | | 1.02% | | | | 1.26% | | | | 1.53% | |
| | | | | | |
Supplemental data | | | | | | | | | | | | | | | | | | | | | | | | |
| | | | | | |
Net assets, end of period (000’s) | | | $71,490 | | | | $79,456 | | | | $83,172 | | | | $73,504 | | | | $107,454 | | | | $223,825 | |
| | | | | | |
Portfolio turnover rate | | | 0.91% | | | | 12.15% | | | | 7.92% | | | | 3.87% | | | | 7.42% | | | | 3.75% | |
aThe amount shown for a share outstanding throughout the period may not correlate with the Statement of Operations for the period due to the timing of sales and repurchases of the Fund’s shares in relation to income earned and/or fluctuating fair value of the investments of the Fund.
bBased on average daily shares outstanding.
cNet investment income per share includes approximately $0.10 per share related to income received in the form of special dividends in connection with certain Fund holdings. Excluding this amount, the ratio of net investment income to average net assets would have been 1.08%.
dTotal return is not annualized for periods less than one year.
eRatios are annualized for periods less than one year.
fBenefit of waiver and payments by affiliates rounds to less than 0.01%.
gBenefit of expense reduction rounds to less than 0.01%.
| | | | |
| | | |
12 | | Semiannual Report | The accompanying notes are an integral part of these financial statements. | | franklintempleton.com |
TEMPLETON CHINA WORLD FUND
Statement of Investments, February 28, 2019 (unaudited)
| | | | | | | | | | | | |
| | | Country | | | Shares | | | Value | |
Common Stocks 99.9% | | | | | | | | | | | | |
Auto Components 0.2% | | | | | | | | | | | | |
| | | |
Weifu High-Technology Co. Ltd., B | | | China | | | | 279,527 | | | $ | 556,935 | |
| | | | | | | | | | | | |
| | | |
Automobiles 3.2% | | | | | | | | | | | | |
| | | |
Chongqing Changan Automobile Co. Ltd., B | | | China | | | | 2,592,457 | | | | 1,479,564 | |
Dongfeng Motor Group Co. Ltd., H | | | China | | | | 2,827,478 | | | | 3,007,668 | |
Jiangling Motors Corp. Ltd., B | | | China | | | | 3,490,446 | | | | 3,784,031 | |
| | | | | | | | | | | | |
| | | |
| | | | | | | | | | | 8,271,263 | |
| | | | | | | | | | | | |
| | | |
Banks 9.7% | | | | | | | | | | | | |
| | | |
Bank of Ningbo Co. Ltd., A | | | China | | | | 94,600 | | | | 272,743 | |
China Construction Bank Corp., H. | | | China | | | | 14,056,926 | | | | 12,499,423 | |
Industrial and Commercial Bank of China Ltd., H | | | China | | | | 14,080,725 | | | | 10,834,431 | |
Standard Chartered PLC | | | United Kingdom | | | | 200,599 | | | | 1,609,954 | |
| | | | | | | | | | | | |
| | | |
| | | | | | | | | | | 25,216,551 | |
| | | | | | | | | | | | |
| | | |
Beverages 0.3% | | | | | | | | | | | | |
| | | |
Yantai Changyu Pioneer Wine Co. Ltd., B | | | China | | | | 400,099 | | | | 869,032 | |
| | | | | | | | | | | | |
| | | |
Capital Markets 2.4% | | | | | | | | | | | | |
| | | |
China Everbright Ltd. | | | China | | | | 1,610,000 | | | | 3,252,919 | |
GF Securities Co. Ltd., H | | | China | | | | 1,810,000 | | | | 3,052,887 | |
| | | | | | | | | | | | |
| | | |
| | | | | | | | | | | 6,305,806 | |
| | | | | | | | | | | | |
| | | |
Communications Equipment 0.6% | | | | | | | | | | | | |
| | | |
Hytera Communications Corp. Ltd., A | | | China | | | | 880,000 | | | | 1,497,307 | |
| | | | | | | | | | | | |
| | | |
Construction Materials 1.9% | | | | | | | | | | | | |
| | | |
Asia Cement China Holdings Corp. | | | China | | | | 2,947,171 | | | | 2,665,679 | |
Huaxin Cement Co. Ltd., B | | | China | | | | 1,188,826 | | | | 2,370,519 | |
| | | | | | | | | | | | |
| | | |
| | | | | | | | | | | 5,036,198 | |
| | | | | | | | | | | | |
| | | |
Electric Utilities 0.7% | | | | | | | | | | | | |
| | | |
CK Infrastructure Holdings Ltd. | | | Hong Kong | | | | 221,348 | | | | 1,845,565 | |
| | | | | | | | | | | | |
| | | |
Entertainment 0.7% | | | | | | | | | | | | |
| | | |
Poly Culture Group Corp. Ltd., H | | | China | | | | 448,300 | | | | 649,913 | |
Zhejiang Huace Film & TV Co. Ltd., A | | | China | | | | 995,594 | | | | 1,209,142 | |
| | | | | | | | | | | | |
| | | |
| | | | | | | | | | | 1,859,055 | |
| | | | | | | | | | | | |
| | | |
Food & Staples Retailing 4.4% | | | | | | | | | | | | |
| | | |
Beijing Jingkelong Co. Ltd., H | | | China | | | | 679,971 | | | | 135,999 | |
Dairy Farm International Holdings Ltd. | | | Hong Kong | | | | 802,876 | | | | 7,177,711 | |
President Chain Store Corp. | | | Taiwan | | | | 399,059 | | | | 4,123,152 | |
| | | | | | | | | | | | |
| | | |
| | | | | | | | | | | 11,436,862 | |
| | | | | | | | | | | | |
| | | |
Food Products 5.2% | | | | | | | | | | | | |
| | | |
Uni-President China Holdings Ltd. | | | China | | | | 12,227,980 | | | | 10,888,701 | |
Uni-President Enterprises Corp. | | | Taiwan | | | | 1,042,394 | | | | 2,536,156 | |
| | | | | | | | | | | | |
| | | |
| | | | | | | | | | | 13,424,857 | |
| | | | | | | | | | | | |
| | | |
Health Care Equipment & Supplies 1.1% | | | | | | | | | | | | |
| | | |
Ginko International Co. Ltd. | | | Taiwan | | | | 399,000 | | | | 2,951,145 | |
| | | | | | | | | | | | |
| | | |
Health Care Providers & Services 3.7% | | | | | | | | | | | | |
| | | |
Shanghai Pharmaceuticals Holding Co. Ltd., H | | | China | | | | 2,762,500 | | | | 6,207,905 | |
Sinopharm Group Co. Ltd., H | | | China | | | | 764,000 | | | | 3,396,745 | |
| | | | | | | | | | | | |
| | | |
| | | | | | | | | | | 9,604,650 | |
| | | | | | | | | | | | |
| | | | |
| | | |
| franklintempleton.com | | Semiannual Report | | 13 |
TEMPLETON CHINA WORLD FUND
STATEMENT OF INVESTMENTS (UNAUDITED)
| | | | | | | | | | | | |
| | | Country | | | Shares | | | Value | |
Common Stocks(continued) | | | | | | | | | | | | |
| | | |
Industrial Conglomerates 3.8% | | | | | | | | | | | | |
| | | |
CK Hutchison Holdings Ltd. | | | Hong Kong | | | | 264,690 | | | $ | 2,817,268 | |
Hopewell Holdings Ltd. | | | Hong Kong | | | | 1,547,500 | | | | 7,116,755 | |
| | | | | | | | | | | | |
| | | |
| | | | | | | | | | | 9,934,023 | |
| | | | | | | | | | | | |
Insurance 7.9% | | | | | | | | | | | | |
| | | |
AIA Group Ltd. | | | Hong Kong | | | | 1,362,100 | | | | 13,621,434 | |
China Life Insurance Co. Ltd., H | | | China | | | | 1,802,000 | | | | 4,958,527 | |
Ping An Insurance (Group) Co. of China Ltd., H | | | China | | | | 180,000 | | | | 1,895,220 | |
| | | | | | | | | | | | |
| | | |
| | | | | | | | | | | 20,475,181 | |
| | | | | | | | | | | | |
Interactive Media & Services 10.4% | | | | | | | | | | | | |
| | | |
aBaidu Inc., ADR | | | China | | | | 26,302 | | | | 4,275,127 | |
Tencent Holdings Ltd. | | | China | | | | 533,300 | | | | 22,813,738 | |
| | | | | | | | | | | | |
| | | |
| | | | | | | | | | | 27,088,865 | |
| | | | | | | | | | | | |
Internet & Direct Marketing Retail 9.4% | | | | | | | | | | | | |
| | | |
aAlibaba Group Holding Ltd., ADR | | | China | | | | 123,720 | | | | 22,644,472 | |
aCtrip.com International Ltd., ADR | | | China | | | | 54,400 | | | | 1,856,672 | |
| | | | | | | | | | | | |
| | | |
| | | | | | | | | | | 24,501,144 | |
| | | | | | | | | | | | |
IT Services 2.2% | | | | | | | | | | | | |
| | | |
TravelSky Technology Ltd., H | | | China | | | | 1,925,441 | | | | 5,580,277 | |
| | | | | | | | | | | | |
| | | |
Marine 0.6% | | | | | | | | | | | | |
| | | |
COSCO Shipping Energy Transportation Co. Ltd., H | | | China | | | | 2,492,000 | | | | 1,466,676 | |
| | | | | | | | | | | | |
| | | |
Oil, Gas & Consumable Fuels 7.7% | | | | | | | | | | | | |
| | | |
China Petroleum & Chemical Corp., H | | | China | | | | 14,683,678 | | | | 12,682,612 | |
CNOOC Ltd. | | | China | | | | 2,242,400 | | | | 3,867,906 | |
PetroChina Co. Ltd., H | | | China | | | | 5,206,403 | | | | 3,442,305 | |
| | | | | | | | | | | | |
| | | |
| | | | | | | | | | | 19,992,823 | |
| | | | | | | | | | | | |
Paper & Forest Products 1.5% | | | | | | | | | | | | |
| | | |
Nine Dragons Paper Holdings Ltd. | | | China | | | | 3,796,400 | | | | 3,936,775 | |
| | | | | | | | | | | | |
| | | |
Pharmaceuticals 0.8% | | | | | | | | | | | | |
| | | |
Jiangsu Hengrui Medicine Co. Ltd., A | | | China | | | | 107,841 | | | | 1,158,290 | |
Tong Ren Tang Technologies Co. Ltd., H | | | China | | | | 656,700 | | | | 860,012 | |
| | | | | | | | | | | | |
| | | |
| | | | | | | | | | | 2,018,302 | |
| | | | | | | | | | | | |
Real Estate Management & Development 1.2% | | | | | | | | | | | | |
| | | |
China Overseas Land & Investment Ltd. | | | China | | | | 544,000 | | | | 2,002,816 | |
CK Asset Holdings Ltd. | | | Hong Kong | | | | 141,690 | | | | 1,175,974 | |
| | | | | | | | | | | | |
| | | |
| | | | | | | | | | | 3,178,790 | |
| | | | | | | | | | | | |
Semiconductors & Semiconductor Equipment 8.7% | | | | | | | | | | | | |
| | | |
Taiwan Semiconductor Manufacturing Co. Ltd. | | | Taiwan | | | | 2,913,330 | | | | 22,587,617 | |
| | | | | | | | | | | | |
| | | |
Textiles, Apparel & Luxury Goods 6.6% | | | | | | | | | | | | |
| | | |
Anta Sports Products Ltd. | | | China | | | | 2,950,355 | | | | 17,289,255 | |
| | | | | | | | | | | | |
| | | |
Transportation Infrastructure 1.8% | | | | | | | | | | | | |
| | | |
COSCO Shipping Ports Ltd. | | | China | | | | 2,660,513 | | | | 2,826,673 | |
Sichuan Expressway Co. Ltd., H | | | China | | | | 5,850,000 | | | | 1,937,642 | |
| | | | | | | | | | | | |
| | | |
| | | | | | | | | | | 4,764,315 | |
| | | | | | | | | | | | |
Wireless Telecommunication Services 3.2% | | | | | | | | | | | | |
| | | |
China Mobile Ltd. | | | China | | | | 785,270 | | | | 8,263,104 | |
| | | | | | | | | | | | |
| | | |
Total Common Stocks (Cost $128,242,370) | | | | | | | | | | | 259,952,373 | |
| | | | | | | | | | | | |
| | | | |
| | | |
14 | | Semiannual Report | | franklintempleton.com |
TEMPLETON CHINA WORLD FUND
STATEMENT OF INVESTMENTS (UNAUDITED)
| | | | | | | | | | | | |
| | | Country | | | Shares | | | Value | |
Short Term Investments (Cost $2,877,688) 1.1% | | | | | | | | | | | | |
| | | |
Money Market Funds 1.1% | | | | | | | | | | | | |
| b,cInstitutional Fiduciary Trust Money Market Portfolio, 2.06% | | | United States | | | | 2,877,688 | | | $ | 2,877,688 | |
| | | | | | | | | | | | |
Total Investments (Cost $131,120,058) 101.0% | | | | | | | | | | | 262,830,061 | |
Other Assets, less Liabilities (1.0)% | | | | | | | | | | | (2,628,879 | ) |
| | | | | | | | | | | | |
| | | |
Net Assets 100.0% | | | | | | | | | | $ | 260,201,182 | |
| | | | | | | | | | | | |
See Abbreviations on page 26.
aNon-income producing.
bSee Note 3(f) regarding investments in affiliated management investment companies.
cThe rate shown is the annualizedseven-day effective yield at period end.
| | | | |
| | | |
| franklintempleton.com | | The accompanying notes are an integral part of these financial statements. | Semiannual Report | | 15 |
TEMPLETON CHINA WORLD FUND
Financial Statements
Statement of Assets and Liabilities
February 28, 2019 (unaudited)
| | | | |
Assets: | | | | |
Investments in securities: | | | | |
Cost - Unaffiliated issuers | | | $128,242,370 | |
Cost -Non-controlled affiliates (Note 3f) | | | 2,877,688 | |
| | | | |
| |
Value - Unaffiliated issuers | | | $259,952,373 | |
Value -Non-controlled affiliates (Note 3f) | | | 2,877,688 | |
Receivables: | | | | |
Investment securities sold | | | 630,650 | |
Capital shares sold | | | 370,878 | |
Other assets | | | 277 | |
| | | | |
| |
Total assets | | | 263,831,866 | |
| | | | |
Liabilities: | | | | |
Payables: | | | | |
Investment securities purchased | | | 2,323 | |
Capital shares redeemed | | | 3,249,871 | |
Management fees | | | 275,636 | |
Distribution fees | | | 45,239 | |
Transfer agent fees | | | 34,811 | |
Accrued expenses and other liabilities | | | 22,804 | |
| | | | |
| |
Total liabilities | | | 3,630,684 | |
| | | | |
| |
Net assets, at value | | | $260,201,182 | |
| | | | |
Net assets consist of: | | | | |
Paid-in capital | | | $121,356,861 | |
Total distributable earnings (loss) | | | 138,844,321 | |
| | | | |
| |
Net assets, at value | | | $260,201,182 | |
| | | | |
Class A: | | | | |
Net assets, at value | | | $167,584,053 | |
| | | | |
Shares outstanding | | | 8,743,093 | |
| | | | |
Net asset value per sharea | | | $19.17 | |
| | | | |
Maximum offering price per share (net asset value per share ÷ 94.50%) | | | $20.29 | |
| | | | |
Class C: | | | | |
Net assets, at value | | | $ 18,210,227 | |
| | | | |
Shares outstanding | | | 951,732 | |
| | | | |
Net asset value and maximum offering price per sharea | | | $19.13 | |
| | | | |
Class R6: | | | | |
Net assets, at value | | | $ 2,916,590 | |
| | | | |
Shares outstanding | | | 151,382 | |
| | | | |
Net asset value and maximum offering price per share | | | $19.27 | |
| | | | |
Advisor Class: | | | | |
Net assets, at value | | | $ 71,490,312 | |
| | | | |
Shares outstanding | | | 3,698,600 | |
| | | | |
Net asset value and maximum offering price per share | | | $19.33 | |
| | | | |
aRedemption price is equal to net asset value less contingent deferred sales charges, if applicable.
| | | | |
| | | |
16 | | Semiannual Report | The accompanying notes are an integral part of these financial statements. | | franklintempleton.com |
TEMPLETON CHINA WORLD FUND
FINANCIAL STATEMENTS
Statement of Operations
for the six months ended February 28, 2019 (unaudited)
| | | | |
Investment income: | | | | |
Dividends: (net of foreign taxes)* | | | | |
Unaffiliated issuers | | | $1,277,537 | |
Non-controlled affiliates (Note 3f) | | | 10,446 | |
| | | | |
| |
Total investment income | | | 1,287,983 | |
| | | | |
| |
Expenses: | | | | |
Management fees (Note 3a) | | | 1,670,206 | |
Distribution fees: (Note 3c) | | | | |
Class A | | | 201,085 | |
Class C | | | 110,253 | |
Transfer agent fees: (Note 3e) | | | | |
Class A | | | 148,991 | |
Class C | | | 20,691 | |
Class R6 | | | 2,279 | |
Advisor Class | | | 64,651 | |
Custodian fees (Note 4) | | | 31,007 | |
Reports to shareholders | | | 28,096 | |
Registration and filing fees | | | 46,674 | |
Professional fees | | | 42,470 | |
Trustees’ fees and expenses | | | 17,429 | |
Other | | | 10,668 | |
| | | | |
| |
Total expenses | | | 2,394,500 | |
Expenses waived/paid by affiliates (Note 3f and 3g) | | | (82,958) | |
| | | | |
| |
Net expenses | | | 2,311,542 | |
| | | | |
| |
Net investment income (loss) | | | (1,023,559) | |
| | | | |
| |
Realized and unrealized gains (losses): | | | | |
Net realized gain (loss) from: | | | | |
Investments: | | | | |
Unaffiliated issuers | | | 14,047,382 | |
Foreign currency transactions | | | (8,926) | |
| | | | |
| |
Net realized gain (loss) | | | 14,038,456 | |
| | | | |
| |
Net change in unrealized appreciation (depreciation) on: | | | | |
Investments: | | | | |
Unaffiliated issuers | | | (16,751,000) | |
Translation of other assets and liabilities denominated in foreign currencies. | | | 653 | |
| | | | |
| |
Net change in unrealized appreciation (depreciation) | | | (16,750,347) | |
| | | | |
| |
Net realized and unrealized gain (loss) | | | (2,711,891 | ) |
| | | | |
| |
Net increase (decrease) in net assets resulting from operations | | | $(3,735,450) | |
| | | | |
| | | | |
*Foreign taxes withheld on dividends | | $ | 84,937 | |
| | | | |
| | | |
| franklintempleton.com | | The accompanying notes are an integral part of these financial statements. | Semiannual Report | | 17 |
TEMPLETON CHINA WORLD FUND
FINANCIAL STATEMENTS
Statements of Changes in Net Assets
| | | | | | | | |
| | | Six Months Ended
February 28, 2019 (unaudited) | | | Year Ended
August 31, 2018 | |
| | |
Increase (decrease) in net assets: | | | | | | | | |
| | |
Operations: | | | | | | | | |
Net investment income (loss) | | | $(1,023,559) | | | | $3,910,790 | |
Net realized gain (loss) | | | 14,038,456 | | | | 37,588,105 | |
Net change in unrealized appreciation (depreciation) | | | (16,750,347) | | | | (18,459,664) | |
| | | | |
| | |
Net increase (decrease) in net assets resulting from operations | | | (3,735,450) | | | | 23,039,231 | |
| | | | |
| | |
Distributions to shareholders: (Note 1d) | | | | | | | | |
Class A | | | (22,209,961) | | | | (20,927,999) | |
Class C | | | (2,201,466) | | | | (4,258,764) | |
Class R6 | | | (387,499) | | | | (415,371) | |
Advisor Class | | | (9,496,641) | | | | (9,515,407) | |
| | | | |
| | |
Total distributions to shareholders. | | | (34,295,567) | | | | (35,117,541) | |
| | | | |
| | |
Capital share transactions: (Note 2) | | | | | | | | |
Class A | | | 12,263,509 | | | | (3,737,413) | |
Class C | | | (14,312,853) | | | | (4,458,988) | |
Class R6 | | | (59,635) | | | | 2,420,880 | |
Advisor Class | | | 2,479,224 | | | | (130,979) | |
| | | | |
| | |
Total capital share transactions | | | 370,245 | | | | (5,906,500) | |
| | | | |
| | |
Net increase (decrease) in net assets | | | (37,660,772) | | | | (17,984,810) | |
Net assets: | | | | | | | | |
Beginning of period | | | 297,861,954 | | | | 315,846,764 | |
| | | | |
| | |
End of period (Note 1d) | | | $260,201,182 | | | | $297,861,954 | |
| | | | |
| | | | |
| | | |
18 | | Semiannual Report | The accompanying notes are an integral part of these financial statements. | | franklintempleton.com |
TEMPLETON CHINA WORLD FUND
Notes to Financial Statements (unaudited)
1. Organization and Significant Accounting Policies
Templeton China World Fund (Fund) is registered under the Investment Company Act of 1940 (1940 Act) as anopen-end management investment company and applies the specialized accounting and reporting guidance in U.S. Generally Accepted Accounting Principles (U.S. GAAP). The Fund offers four classes of shares: Class A, Class C, Class R6, and Advisor Class. Beginning on October 19, 2018, Class C shares automatically convert to Class A shares after they have been held for 10 years. Each class of shares may differ by its initial sales load, contingent deferred sales charges, voting rights on matters affecting a single class, its exchange privilege and fees due to differing arrangements for distribution and transfer agent fees.
The following summarizes the Fund’s significant accounting policies.
a. Financial Instrument Valuation
The Fund’s investments in financial instruments are carried at fair value daily. Fair value is the price that would be received to sell an asset or paid to transfer a liability in an orderly transaction between market participants on the measurement date. The Fund calculates the net asset value (NAV) per share each business day as of 4 p.m. Eastern time or the regularly scheduled close of the New York Stock Exchange (NYSE), whichever is earlier. Under compliance policies and procedures approved by the Fund’s Board of Trustees (the Board), the Fund’s administrator has responsibility for oversight of valuation, including leading the cross-functional Valuation Committee (VC). The Fund may utilize independent pricing services, quotations from securities and financial instrument dealers, and other market sources to determine fair value.
Equity securities listed on an exchange or on the NASDAQ National Market System are valued at the last quoted sale price or the official closing price of the day, respectively. Foreign equity securities are valued as of the close of trading on the foreign stock exchange on which the security is primarily traded, or as of 4 p.m. Eastern time. The value is then converted into its U.S. dollar equivalent at the foreign exchange rate in effect at 4 p.m. Eastern time on the day that the value of the security is determined.Over-the-counter (OTC) securities are valued within the range of the most recent quoted bid and ask prices. Securities that trade in multiple markets or on multiple
exchanges are valued according to the broadest and most representative market. Certain equity securities are valued based upon fundamental characteristics or relationships to similar securities.
Investments inopen-end mutual funds are valued at the closing NAV.
The Fund has procedures to determine the fair value of financial instruments for which market prices are not reliable or readily available. Under these procedures, the Fund primarily employs a market-based approach which may use related or comparable assets or liabilities, recent transactions, market multiples, book values, and other relevant information for the investment to determine the fair value of the investment. An income-based valuation approach may also be used in which the anticipated future cash flows of the investment are discounted to calculate fair value. Discounts may also be applied due to the nature or duration of any restrictions on the disposition of the investments. Due to the inherent uncertainty of valuations of such investments, the fair values may differ significantly from the values that would have been used had an active market existed.
Trading in securities on foreign securities stock exchanges and OTC markets may be completed before 4 p.m. Eastern time. In addition, trading in certain foreign markets may not take place on every Fund’s business day. Occasionally, events occur between the time at which trading in a foreign security is completed and 4 p.m. Eastern time that might call into question the reliability of the value of a portfolio security held by the Fund. As a result, differences may arise between the value of the Fund’s portfolio securities as determined at the foreign market close and the latest indications of value at 4 p.m. Eastern time. In order to minimize the potential for these differences, the VC monitors price movements following the close of trading in foreign stock markets through a series of country specific market proxies (such as baskets of American Depositary Receipts, futures contracts and exchange traded funds). These price movements are measured against established trigger thresholds for each specific market proxy to assist in determining if an event has occurred that may call into question the reliability of the values of the foreign securities held by the Fund. If such an event occurs, the securities may be valued using fair value procedures, which may include the use of independent pricing services.
| | | | |
| | | |
| franklintempleton.com | | Semiannual Report | | 19 |
TEMPLETON CHINA WORLD FUND
NOTES TO FINANCIAL STATEMENTS (UNAUDITED)
1. Organization and Significant Accounting Policies(continued)
a. Financial Instrument Valuation(continued)
When the last day of the reporting period is anon-business day, certain foreign markets may be open on those days that the Fund’s NAV is not calculated, which could result in differences between the value of the Fund’s portfolio securities on the last business day and the last calendar day of the reporting period. Any significant security valuation changes due to an open foreign market are adjusted and reflected by the Fund for financial reporting purposes.
b. Foreign Currency Translation
Portfolio securities and other assets and liabilities denominated in foreign currencies are translated into U.S. dollars based on the exchange rate of such currencies against U.S. dollars on the date of valuation. The Fund may enter into foreign currency exchange contracts to facilitate transactions denominated in a foreign currency. Purchases and sales of securities, income and expense items denominated in foreign currencies are translated into U.S. dollars at the exchange rate in effect on the transaction date. Portfolio securities and assets and liabilities denominated in foreign currencies contain risks that those currencies will decline in value relative to the U.S. dollar. Occasionally, events may impact the availability or reliability of foreign exchange rates used to convert the U.S. dollar equivalent value. If such an event occurs, the foreign exchange rate will be valued at fair value using procedures established and approved by the Board.
The Fund does not separately report the effect of changes in foreign exchange rates from changes in market prices on securities held. Such changes are included in net realized and unrealized gain or loss from investments in the Statement of Operations.
Realized foreign exchange gains or losses arise from sales of foreign currencies, currency gains or losses realized between the trade and settlement dates on securities transactions and the difference between the recorded amounts of dividends, interest, and foreign withholding taxes and the U.S. dollar equivalent of the amounts actually received or paid. Net unrealized foreign exchange gains and losses arise from changes in foreign exchange rates on foreign denominated assets and liabilities other than investments in securities held at the end of the reporting period.
c. Income and Deferred Taxes
It is the Fund’s policy to qualify as a regulated investment company under the Internal Revenue Code. The Fund intends to distribute to shareholders substantially all of its taxable income and net realized gains to relieve it from federal income and excise taxes. As a result, no provision for U.S. federal income taxes is required.
The Fund may be subject to foreign taxation related to income received, capital gains on the sale of securities and certain foreign currency transactions in the foreign jurisdictions in which it invests. Foreign taxes, if any, are recorded based on the tax regulations and rates that exist in the foreign markets in which the Fund invests. When a capital gain tax is determined to apply, the Fund records an estimated deferred tax liability in an amount that would be payable if the securities were disposed of on the valuation date.
The Fund may recognize an income tax liability related to its uncertain tax positions under U.S. GAAP when the uncertain tax position has a less than 50% probability that it will be sustained upon examination by the tax authorities based on its technical merits. As of February 28, 2019, the Fund has determined that no tax liability is required in its financial statements related to uncertain tax positions for any open tax years (or expected to be taken in future tax years). Open tax years are those that remain subject to examination and are based on the statute of limitations in each jurisdiction in which the Fund invests.
d. Security Transactions, Investment Income, Expenses and Distributions
Security transactions are accounted for on trade date. Realized gains and losses on security transactions are determined on a specific identification basis. Estimated expenses are accrued daily. Dividend income is recorded on theex-dividend date except for certain dividends from securities where the dividend rate is not available. In such cases, the dividend is recorded as soon as the information is received by the Fund. Distributions to shareholders are recorded on theex-dividend date. Distributable earnings are determined according to income tax regulations (tax basis) and may differ from earnings recorded in accordance with U.S. GAAP. These differences may be permanent or temporary. Permanent differences are reclassified among capital accounts to reflect their tax character. These reclassifications
| | | | |
| | | |
20 | | Semiannual Report | | franklintempleton.com |
TEMPLETON CHINA WORLD FUND
NOTES TO FINANCIAL STATEMENTS (UNAUDITED)
have no impact on net assets or the results of operations. Temporary differences are not reclassified, as they may reverse in subsequent periods.*
Realized and unrealized gains and losses and net investment income, excluding class specific expenses, are allocated daily to each class of shares based upon the relative proportion of net assets of each class. Differences in per share distributions by class are generally due to differences in class specific expenses.
e. Accounting Estimates
The preparation of financial statements in accordance with U.S. GAAP requires management to make estimates and assumptions that affect the reported amounts of assets and liabilities at the date of the financial statements and the amounts of income and expenses during the reporting period. Actual results could differ from those estimates.
f. Guarantees and Indemnifications
Under the Fund’s organizational documents, its officers and trustees are indemnified by the Fund against certain liabilities arising out of the performance of their duties to the Fund. Additionally, in the normal course of business, the Fund enters into contracts with service providers that contain general indemnification clauses. The Fund’s maximum exposure under these arrangements is unknown as this would involve future claims that may be made against the Fund that have not yet occurred. Currently, the Fund expects the risk of loss to be remote.
*Effective during the current reporting period, it is no longer required to present certain line items in the Statements of Changes in Net Assets. The below prior period amounts affected by this change are shown as they were in the prior year Statements of Changes in Net Assets.
For the year ended August 31, 2018, distributions to shareholders were as follows:
| | | | |
Distributions from net investment income: | | | | |
Class A. | | $ | (2,001,507 | ) |
Class C | | | (354 | ) |
Class R6. | | | (60,142 | ) |
Advisor Class | | | (1,159,991 | ) |
Distributions from net realized gains: | | | | |
Class A. | | | (18,926,492 | ) |
Class C | | | (4,258,410 | ) |
Class R6. | | | (355,229 | ) |
Advisor Class | | | (8,355,416 | ) |
For the year ended August 31, 2018, undistributed net investment income included in net assets was $2,536,663.
2. Shares of Beneficial Interest
At February 28, 2019, there were an unlimited number of shares authorized (without par value). Transactions in the Fund’s shares were as follows:
| | | | | | | | | | | | | | | | |
| | | Six Months Ended February 28, 2019 | | | Year Ended August 31, 2018 | |
| | | Shares | | | Amount | | | Shares | | | Amount | |
| | | | |
Class A Shares: | | | | | | | | | | | | | | | | |
Shares solda | | | 2,814,568 | | | $ | 56,779,700 | | | | 3,227,886 | | | $ | 75,140,172 | |
Shares issued in reinvestment of distributions | | | 1,267,136 | | | | 21,477,961 | | | | 940,804 | | | | 20,181,431 | |
Shares redeemed | | | (3,290,886) | | | | (65,994,152) | | | | (4,258,664) | | | | (99,059,016) | |
| | | | |
Net increase (decrease) | | | 790,818 | | | $ | 12,263,509 | | | | (89,974) | | | $ | (3,737,413) | |
| | | | |
| | | |
| franklintempleton.com | | Semiannual Report | | 21 |
TEMPLETON CHINA WORLD FUND
NOTES TO FINANCIAL STATEMENTS (UNAUDITED)
2. Shares of Beneficial Interest(continued)
| | | | | | | | | | | | | | | | |
| | | Six Months Ended February 28, 2019 | | | Year Ended August 31, 2018 | |
| | | Shares | | | Amount | | | Shares | | | Amount | |
| | | | |
Class C Shares: | | | | | | | | | | | | | | | | |
Shares sold | | | 56,545 | | | $ | 1,084,139 | | | | 214,085 | | | $ | 4,908,064 | |
Shares issued in reinvestment of distributions | | | 123,406 | | | | 2,090,496 | | | | 192,967 | | | | 4,106,349 | |
Shares redeemeda | | | (885,526) | | | | (17,487,488) | | | | (590,979) | | | | (13,473,401) | |
| | | | |
Net increase (decrease) | | | (705,575) | | | $ | (14,312,853) | | | | (183,927) | | | $ | (4,458,988) | |
| | | | |
Class R6 Shares: | | | | | | | | | | | | | | | | |
Shares sold | | | 13,846 | | | $ | 282,324 | | | | 133,716 | | | $ | 3,224,411 | |
Shares issued in reinvestment of distributions | | | 22,767 | | | | 387,499 | | | | 19,311 | | | | 415,371 | |
Shares redeemed | | | (36,542) | | | | (729,458) | | | | (52,978) | | | | (1,218,902) | |
| | | | |
Net increase (decrease) | | | 71 | | | $ | (59,635) | | | | 100,049 | | | $ | 2,420,880 | |
| | | | |
Advisor Class Shares: | | | | | | | | | | | | | | | | |
Shares sold | | | 367,842 | | | $ | 7,032,088 | | | | 1,134,576 | | | $ | 26,366,812 | |
Shares issued in reinvestment of distributions | | | 487,969 | | | | 8,334,499 | | | | 376,082 | | | | 8,115,857 | |
Shares redeemed | | | (672,540) | | | | (12,887,363) | | | | (1,508,258) | | | | (34,613,648) | |
| | | | |
Net increase (decrease) | | | 183,271 | | | $ | 2,479,224 | | | | 2,400 | | | $ | (130,979) | |
aMay include a portion of Class C shares that were automatically converted to Class A.
3. Transactions with Affiliates
Franklin Resources, Inc. is the holding company for various subsidiaries that together are referred to as Franklin Templeton. Certain officers and trustees of the Fund are also officers and/or directors of the following subsidiaries:
| | |
| Subsidiary | | Affiliation |
| |
Templeton Asset Management Ltd. (Asset Management) | | Investment manager |
| |
Franklin Templeton Services, LLC (FT Services) | | Administrative manager |
| |
Franklin Templeton Distributors, Inc. (Distributors) | | Principal underwriter |
| |
Franklin Templeton Investor Services, LLC (Investor Services) | | Transfer agent |
a. Management Fees
The Fund pays an investment management fee to Asset Management based on the average weekly net assets of the Fund as follows:
| | | | |
| Annualized Fee Rate | | Net Assets | | |
| | |
| 1.300% | | Up to and including $1 billion | | |
| | |
| 1.250% | | Over $1 billion, up to and including $5 billion | | |
| | |
| 1.200% | | Over $5 billion, up to and including $10 billion | | |
| | |
| 1.150% | | Over $10 billion, up to and including $15 billion | | |
| | |
| 1.100% | | Over $15 billion, up to and including $20 billion | | |
| | |
| 1.050% | | In excess of $20 billion | | |
b. Administrative Fees
Under an agreement with Asset Management, FT Services provides administrative services to the Fund. The fee is paid by Asset Management based on average weekly net assets, and is not an additional expense of the Fund.
| | | | |
| | | |
22 | | Semiannual Report | | franklintempleton.com |
TEMPLETON CHINA WORLD FUND
NOTES TO FINANCIAL STATEMENTS (UNAUDITED)
c. Distribution Fees
The Board has adopted distribution plans for each share class, with the exception of Class R6 and Advisor Class shares, pursuant to Rule12b-1 under the 1940 Act. Under the Fund’s Class A reimbursement distribution plan, the Fund reimburses Distributors for costs incurred in connection with the servicing, sale and distribution of the Fund’s shares up to the maximum annual plan rate. Under the Class A reimbursement distribution plan, costs exceeding the maximum for the current plan year cannot be reimbursed in subsequent periods. In addition, under the Fund’s Class C compensation distribution plan, the Fund pays Distributors for costs incurred in connection with the servicing, sale and distribution of the Fund’s shares up to the maximum annual plan rate. The plan year, for purposes of monitoring compliance with the maximum annual plan rates, is February 1 through January 31.
The maximum annual plan rates, based on the average daily net assets, for each class, are as follows:
| | | | | | |
| | Class A | | | 0.35 | % |
| | Class C | | | 1.00 | % |
The Board has set the current rate at 0.25% per year for Class A shares until further notice and approval by the Board.
d. Sales Charges/Underwriting Agreements
Front-end sales charges and contingent deferred sales charges (CDSC) do not represent expenses of the Fund. These charges are deducted from the proceeds of sales of Fund shares prior to investment or from redemption proceeds prior to remittance, as applicable. Distributors has advised the Fund of the following commission transactions related to the sales and redemptions of the Fund’s shares for the period:
| | | | |
Sales charges retained net of commissions paid to unaffiliated brokers/dealers | | $ | 7,356 | |
| |
CDSC retained | | $ | 141 | |
Effective September 10, 2018, the Board approved changes to certainfront-end sales charges and dealer commissions on Class A shares. Further details are disclosed in the Fund’s Prospectus.
e. Transfer Agent Fees
Each class of shares pays transfer agent fees to Investor Services for its performance of shareholder servicing obligations. The fees are based on an annualized asset based fee of 0.02% plus a transaction based fee. In addition, each class reimburses Investor Services for out of pocket expenses incurred and, except for Class R6, reimburses shareholder servicing fees paid to third parties. These fees are allocated daily based upon their relative proportion of such classes’ aggregate net assets. Class R6 pays Investor Services transfer agent fees specific to that class.
For the period ended February 28, 2019, the Fund paid transfer agent fees of $236,612, of which $171,512 was retained by Investor Services.
| | | | |
| | | |
| franklintempleton.com | | Semiannual Report | | 23 |
TEMPLETON CHINA WORLD FUND
NOTES TO FINANCIAL STATEMENTS (UNAUDITED)
3. Transactions with Affiliates(continued)
f. Investments in Affiliated Management Investment Companies
The Fund invests in one or more affiliated management investment companies for purposes other than exercising a controlling influence over the management or policies. Management fees paid by the Fund are waived on assets invested in the affiliated management investment companies, as noted in the Statement of Operations, in an amount not to exceed the management and administrative fees paid directly or indirectly by each affiliate. During the period ended February 28, 2019, the Fund held investments in affiliated management investment companies as follows:
| | | | | | | | | | | | | | | | | | | | | | | | | | | | | | | | |
| | | Number of
Shares Held
at Beginning
of Period | | | Gross
Additions | | | Gross
Reductions | | | Number of
Shares
Held at End
of Period | | | Value at End of Period | | | Dividend
Income | | | Realized
Gain
(Loss) | | | Net Change in
Unrealized
Appreciation
(Depreciation) | |
Non-Controlled Affiliates | | | | | | | | | | | | | | | | | | | | | | | | | | | | | | | | |
Institutional Fiduciary Trust Money Market Portfolio, 2.06% | | | 5,084,830 | | | | 33,264,355 | | | | (35,471,497 | ) | | | 2,877,688 | | | | $2,877,688 | | | | $10,446 | | | | $ — | | | | $ — | |
| | | | | |
| | | | | | | | | | | | | | | | | | | | |
g. Waiver and Expense Reimbursements
Asset Management and Investor Services have contractually agreed in advance to waive or limit their respective fees and to assume as their own expense certain expenses otherwise payable by the Fund so that the expenses (excluding distribution fees, acquired fund fees and expenses, and certainnon-routine expenses or costs including those relating to litigation, indemnification, reorganizations, and liquidations) for Class A, Class C, and Advisor Class of the Fund do not exceed 1.60% and for Class R6 do not exceed 1.43% based on the average net assets of each class until December 31, 2019. Total expenses waived or paid are not subject to recapture subsequent to the Fund’s fiscal year end.
Prior to January 1, 2019, expenses (excluding certain fees and expenses as previously disclosed) for Class R6 were limited to 1.40% based on the average net assets of the class.
4. Expense Offset Arrangement
The Fund has entered into an arrangement with its custodian whereby credits realized as a result of uninvested cash balances are used to reduce a portion of the Fund’s custodian expenses. During the period ended February 28, 2019, there were no credits earned.
5. Income Taxes
At February 28, 2019, the cost of investments and net unrealized appreciation (depreciation) for income tax purposes were as follows:
| | | | |
Cost of investments | | $ | 132,541,160 | |
| | | | |
| |
Unrealized appreciation | | $ | 138,693,302 | |
Unrealized depreciation | | | (8,404,401 | ) |
| | | | |
| |
Net unrealized appreciation (depreciation) | | $ | 130,288,901 | |
| | | | |
Differences between income and/or capital gains as determined on a book basis and a tax basis are primarily due to differing treatment of passive foreign investment company shares.
| | | | |
| | | |
24 | | Semiannual Report | | franklintempleton.com |
TEMPLETON CHINA WORLD FUND
NOTES TO FINANCIAL STATEMENTS (UNAUDITED)
6. Investment Transactions
Purchases and sales of investments (excluding short term securities) for the period ended February 28, 2019, aggregated $2,382,298 and $32,435,228, respectively.
7. Concentration of Risk
Investing in securities of “China companies” may include certain risks and considerations not typically associated with investing in U.S. securities. In general, China companies are those that are organized under the laws of, or with a principal office or principal trading market in, the People’s Republic of China, Hong Kong, or Taiwan. Such risks include fluctuating currency values and changing local and regional economic, political and social conditions, which may result in greater market volatility. In addition, these securities may not be as liquid as U.S. securities.
8. Credit Facility
The Fund, together with other U.S. registered and foreign investment funds (collectively, Borrowers), managed by Franklin Templeton, are borrowers in a joint syndicated senior unsecured credit facility totaling $2 billion (Global Credit Facility) which matures on February 7, 2020. This Global Credit Facility provides a source of funds to the Borrowers for temporary and emergency purposes, including the ability to meet future unanticipated or unusually large redemption requests.
Under the terms of the Global Credit Facility, the Fund shall, in addition to interest charged on any borrowings made by the Fund and other costs incurred by the Fund, pay its share of fees and expenses incurred in connection with the implementation and maintenance of the Global Credit Facility, based upon its relative share of the aggregate net assets of all of the Borrowers, including an annual commitment fee of 0.15% based upon the unused portion of the Global Credit Facility. These fees are reflected in other expenses in the Statement of Operations. During the period ended February 28, 2019, the Fund did not use the Global Credit Facility.
9. Fair Value Measurements
The Fund follows a fair value hierarchy that distinguishes between market data obtained from independent sources (observable inputs) and the Fund’s own market assumptions (unobservable inputs). These inputs are used in determining the value of the Fund’s financial instruments and are summarized in the following fair value hierarchy:
| | • | | Level 1 – quoted prices in active markets for identical financial instruments |
| | • | | Level 2 – other significant observable inputs (including quoted prices for similar financial instruments, interest rates, prepayment speed, credit risk, etc.) |
| | • | | Level 3 – significant unobservable inputs (including the Fund’s own assumptions in determining the fair value of financial instruments) |
The input levels are not necessarily an indication of the risk or liquidity associated with financial instruments at that level.
At February 28, 2019, all of the Fund’s investments in financial instruments carried at fair value were valued using Level 1 inputs. For detailed categories, see the accompanying Statement of Investments.
| | | | |
| | | |
| franklintempleton.com | | Semiannual Report | | 25 |
TEMPLETON CHINA WORLD FUND
NOTES TO FINANCIAL STATEMENTS (UNAUDITED)
10. Subsequent Events
The Fund has evaluated subsequent events through the issuance of the financial statements and determined that no events have occurred that require disclosure.
| | |
| Abbreviations | | |
| |
Selected Portfolio | | |
| |
| ADR American Depositary Receipt | | |
| | | | |
| | | |
26 | | Semiannual Report | | franklintempleton.com |
TEMPLETON CHINA WORLD FUND
Tax Information (unaudited)
At August 31, 2018 more than 50% of the Fund’s total assets were invested in securities of foreign issuers. In most instances, foreign taxes were withheld from income paid to the Fund on these investments. As shown in the table below, the Fund hereby reports to shareholders the foreign source income and foreign taxes paid, pursuant to Section 853 of the Internal Revenue Code. This written statement will allow shareholders of record on December 20, 2018, to treat their proportionate share of foreign taxes paid by the Fund as having been paid directly by them. The shareholder shall consider these amounts as foreign taxes paid in the tax year in which they receive the Fund distribution.
The following table provides a detailed analysis of foreign tax paid, foreign source income, and foreign source qualified dividends as reported by the Fund to shareholders of record.
| | | | | | | | | | | | |
| Class | | Foreign Tax Paid
Per Share | | | Foreign Source
Income Per Share | | | Foreign Source Qualified
Dividends Per Share | |
| | | |
Class A | | | $0.0786 | | | | $0.4507 | | | | $0.1439 | |
Class C | | | $0.0786 | | | | $0.0339 | | | | $0.0108 | |
Class R6 | | | $0.0786 | | | | $0.5442 | | | | $0.1736 | |
Advisor Class | | | $0.0786 | | | | $0.5035 | | | | $0.1607 | |
Foreign Tax Paid Per Share is the amount per share available to you, as a tax credit (assuming you held your shares in the Fund for a minimum of 16 days during the31-day period beginning 15 days before theex-dividend date of the Fund’s distribution to which the foreign taxes relate), or, as a tax deduction.
Foreign Source Income Per Share is the amount per share of income dividends attributable to foreign securities held by the Fund, plus any foreign taxes withheld on these dividends. The amounts reported include foreign source qualified dividends that have not been adjusted for the rate differential applicable to such dividend income.1
Foreign Source Qualified Dividends Per Share is the amount per share of foreign source qualified dividends, plus any foreign taxes withheld on these dividends. These amounts represent the portion of the Foreign Source Income reported to you in column 2 that were derived from qualified foreign securities held by the Fund.1
In February 2019, shareholders received Form1099-DIV which included their share of taxes paid and foreign source income distributed during the calendar year 2018. The Foreign Source Income reported on Form1099-DIV was not adjusted for the rate differential on foreign source qualified dividend income. Shareholders are advised to check with their tax advisors for information on the treatment of these amounts on their 2018 individual income tax returns.
1Qualified dividends are taxed at reduced long term capital gains tax rates. In determining the amount of foreign tax credit that may be applied against the U.S. tax liability of individuals receiving foreign source qualified dividends, adjustments may be required to the foreign tax credit limitation calculation to reflect the rate differential applicable to such dividend income. The rules however permit certain individuals to elect not to apply the rate differential adjustments for capital gains and/or dividends for any taxable year. Please consult your tax advisor and the instructions to Form 1116 for more information.
| | | | |
| | | |
| franklintempleton.com | | Semiannual Report | | 27 |
TEMPLETON CHINA WORLD FUND
Shareholder Information
Proxy Voting Policies and Procedures
The Fund’s investment manager has established Proxy Voting Policies and Procedures (Policies) that the Fund uses to determine how to vote proxies relating to portfolio securities. Shareholders may view the Fund’s complete Policies online at franklintempleton.com. Alternatively, shareholders may request copies of the Policies free of charge by calling the Proxy Group collect at (954)527-7678 or by sending a written request to: Franklin Templeton Companies, LLC, 300 S.E. 2nd Street, Fort Lauderdale, FL 33301, Attention: Proxy Group. Copies of the Fund’s proxy voting records are also made available online at franklintempleton.com and posted on the U.S. Securities and Exchange Commission’s website at sec.gov and reflect the most recent12-month period ended June 30.
Quarterly Statement of Investments
The Fund files a complete statement of investments with the U.S. Securities and Exchange Commission for the first and third quarters for each fiscal year as an exhibit to its report on FormN-PORT. Shareholders may view the filed FormN-PORT by visiting the Commission’s website at sec.gov. The filed form may also be viewed and copied at the Commission’s Public Reference Room in Washington, DC. Information regarding the operations of the Public Reference Room may be obtained by calling(800) SEC-0330.
| | | | |
| | | |
28 | | Semiannual Report | | franklintempleton.com |
| | |
| | Semiannual Report and Shareholder Letter Templeton China World Fund Investment Manager Templeton Asset Management Ltd. Distributor Franklin Templeton Distributors, Inc. (800) DIAL BEN® /342-5236 franklintempleton.com Shareholder Services (800)632-2301 |
Authorized for distribution only when accompanied or preceded by a summary prospectus and/or prospectus. Investors should carefully consider a fund’s investment goals, risks, charges and expenses before investing. A prospectus contains this and other information; please read it carefully before investing.
To help ensure we provide you with quality service, all calls to and from our service areas are monitored and/or recorded.
| | |
© 2019 Franklin Templeton Investments. All rights reserved. | | 188 S 04/19 |
| (a) | The Registrant has adopted a code of ethics that applies to its principal executive officers and principal financial and accounting officer. |
| (f) | Pursuant to Item 12(a)(1), the Registrant is attaching as an exhibit a copy of its code of ethics that applies to its principal executive officers and principal financial and accounting officer. |
| Item 3. | Audit Committee Financial Expert. |
| (a) | (1) The Registrant has an audit committee financial expert serving on its audit committee. |
| | (2) | The audit committee financial expert is David W. Niemiec and he is “independent” as defined under the relevant Securities and Exchange Commission Rules and Releases. |
| Item 4. | Principal Accountant Fees and Services. N/A |
| Item 5. | Audit Committee of Listed Registrants. N/A |
| Item 6. | Schedule of Investments. N/A |
| Item 7. | Disclosure of Proxy Voting Policies and Procedures forClosed-End Management Investment Companies. N/A |
| Item 8. | Portfolio Managers ofClosed-End Management Investment Companies. N/A |
| Item 9. | Purchases of Equity Securities byClosed-End Management Investment Company and Affiliated Purchasers. N/A |
| Item 10. | Submission of Matters to a Vote of Security Holders. |
There have been no changes to the procedures by which shareholders may recommend nominees to the Registrant’s Board of Trustees that would require disclosure herein.
| Item 11. | Controls and Procedures. |
(a)Evaluation of Disclosure Controls and Procedures. The Registrant maintains disclosure controls and procedures that are designed to provide reasonable assurance that information required to be disclosed in the Registrant’s filings under the Securities Exchange Act of 1934, as amended, and the Investment Company Act of 1940 is recorded, processed, summarized and reported within the
periods specified in the rules and forms of the Securities and Exchange Commission. Such information is accumulated and communicated to the Registrant’s management, including its principal executive officer and principal financial officer, as appropriate, to allow timely decisions regarding required disclosure. The Registrant’s management, including the principal executive officer and the principal financial officer, recognizes that any set of controls and procedures, no matter how well designed and operated, can provide only reasonable assurance of achieving the desired control objectives.
Within 90 days prior to the filing date of this Shareholder Report on FormN-CSRS, the Registrant had carried out an evaluation, under the supervision and with the participation of the Registrant’s management, including the Registrant’s principal executive officer and the Registrant’s principal financial officer, of the effectiveness of the design and operation of the Registrant’s disclosure controls and procedures. Based on such evaluation, the Registrant’s principal executive officer and principal financial officer concluded that the Registrant’s disclosure controls and procedures are effective.
(b)Changes in Internal Controls: Effective November 1, 2018, the Registrant’s controls were enhanced through the implementation of a daily secondary review of market events following the close of trading on foreign stock markets to ensure the appropriate application of market level fair value.
| Item 12. | Disclosure of Securities Lending Activities forClosed-End Management Investment Company. N/A |
(a) (1)Code of Ethics
(a) (2) Certifications pursuant to Section 302 of the Sarbanes-Oxley Act of 2002 of Matthew T. Hinkle, Chief Executive Officer - Finance and Administration, and Robert G. Kubilis, Chief Financial Officer and Chief Accounting Officer
(b) Certifications pursuant to Section 906 of the Sarbanes-Oxley Act of 2002 of Matthew T. Hinkle, Chief Executive Officer - Finance and Administration, and Robert G. Kubilis, Chief Financial Officer and Chief Accounting Officer
SIGNATURES
Pursuant to the requirements of the Securities Exchange Act of 1934 and the Investment Company Act of 1940, the registrant has duly caused this report to be signed on its behalf by the undersigned, thereunto duly authorized.
| | |
| TEMPLETON CHINA WORLD FUND |
| |
| By | | /s/MATTHEW T. HINKLE |
| | Matthew T. Hinkle |
| | Chief Executive Officer – Finance and Administration |
| Date April 26, 2019 |
Pursuant to the requirements of the Securities Exchange Act of 1934 and the Investment Company Act of 1940, this report has been signed below by the following persons on behalf of the registrant and in the capacities and on the dates indicated.
| | |
| By | | /s/MATTHEW T. HINKLE |
| | Matthew T. Hinkle |
| | Chief Executive Officer – Finance and Administration |
| Date April 26, 2019 |
| |
| By | | /s/ROBERT G. KUBILIS |
| | Robert G. Kubilis |
| | Chief Financial Officer and Chief Accounting Officer |
| Date April 26, 2019 |