Exhibit 99.1

Record sales, significant inventory drawdown and lower production cash cost
São Paulo, February 12, 2020.Suzano S.A. (B3: SUZB3 | NYSE: SUZ), one of the world’s largest integrated pulp and paper producers, announces today its consolidated results for the fourth quarter of 2019 (4Q19). Data for the comparison periods in 2018 (4Q18 and 2018) are based on the simple sum or weighted average, when applicable, of Suzano + Fibria.
HIGHLIGHTS
| · | Pulp inventory drawdown of approximately 650 thousand tons. |
| · | Pulp sales of 2,920 thousand tons, up 15% vs. 3Q19. |
| · | Paper sales of 369 thousand tons, up 18% vs. 3Q19. |
| · | Adjusted EBITDA1 and Operating cash generation²: R$2.5 billion and R$1.5 billion, respectively. |
| · | Adjusted EBITDA1/ton4 for pulp of R$741/ton (-14% vs. 3Q19). |
| · | Adjusted EBITDA1/ton5 for paper of R$1,150/ton (-6% vs. 3Q19). |
| · | Average net pulp price – export market: US$471/t (-11% vs. 3Q19). |
| · | Average net paper price5 of R$3,844/ton (-4% vs. 3Q19). |
| · | Pulp cash cost ex-downtime of R$631/t, down 3% vs. 3Q19. |
| · | Synergies captured in 2019 reached R$763 million, already excluding implementation costs. Considering the reduction on production the synergies captured raised R$311 million. |
| · | Estimated operating synergies revised upwards from R$1.1bn to R$1.2bn. |
| Consolidated Financial Data (R$ million) | 4Q19 | 4Q18 | Δ Y-o-Y | 3Q19 | Δ Q-o-Q | 2019 | 2018 | Δ Y-o-Y | ||||||||||||||||||||||||
| Net Revenue | 7,049 | 7,242 | -3 | % | 6,600 | 7 | % | 26,013 | 31,702 | -18 | % | |||||||||||||||||||||
| Adjusted EBITDA1 | 2,465 | 3,550 | -31 | % | 2,396 | 3 | % | 10,724 | 16,361 | -34 | % | |||||||||||||||||||||
| Adjusted EBITDA Margin1 | 35 | % | 49 | % | -14 | p.p. | 36 | % | -1 | p.p. | 41 | % | 52 | % | -10 | p.p. | ||||||||||||||||
| Adjusted EBITDA Margin1 ex- Klabin4 | 37 | % | 52 | % | -15 | p.p. | 39 | % | -2. | p.p. | 43 | % | 55 | % | -12 | p.p. | ||||||||||||||||
| Net Financial Result | 1,625 | 1,679 | -3 | % | (6,493 | ) | - | (6,726 | ) | (7,748 | ) | -13 | % | |||||||||||||||||||
| Net Income | 1,175 | 2,987 | -61 | % | (3,460 | ) | - | (2,815 | ) | 3,378 | - | |||||||||||||||||||||
| Operating Cash Generation2 | 1,540 | 2,465 | -38 | % | 1,515 | 2 | % | 7,063 | 12,709 | -44 | % | |||||||||||||||||||||
| Net Debt /Adjusted EBITDA¹ (x) - R$ | 5.0 | x | 1.5 | x | 3.5 | x | 4.7 | x | 0.3 | x | 5.0 | x | 1.5 | x | 3.5 | x | ||||||||||||||||
| Net Debt /Adjusted EBITDA1 (x) - US$ | 4.9 | x | 1.4 | x | 3.5 | x | 4.3 | x | 0.6 | x | 4.9 | x | 1.4 | x | 3.5 | x |
| Operational Data ('000 tons) | 4Q19 | 4Q18 | Δ Y-o-Y | 3Q19 | Δ Q-o-Q | 2019 | 2018 | Δ Y-o-Y | ||||||||||||||||||||||||
| Sales | 3,288 | 2,435 | 35 | % | 2,862 | 15 | % | 10,668 | 11,266 | -5 | % | |||||||||||||||||||||
| Pulp | 2,920 | 2,085 | 40 | % | 2,549 | 15 | % | 9,412 | 10,012 | -6 | % | |||||||||||||||||||||
| Paper5 | 369 | 350 | 5 | % | 313 | 18 | % | 1,256 | 1,254 | 0 | % | |||||||||||||||||||||
| Production | 2,587 | 2,918 | -11 | % | 2,406 | 7 | % | 9,997 | 11,524 | -13 | % | |||||||||||||||||||||
| Pulp | 2,267 | 2,581 | -12 | % | 2,095 | 8 | % | 8,757 | 10,259 | -15 | % | |||||||||||||||||||||
| Paper5 | 319 | 337 | -5 | % | 311 | 3 | % | 1,240 | 1,265 | -2 | % |
¹ Excluding non-recurring items and PPA impact. |2 Considers Adjusted EBITDA less sustaining capex (cash basis). |3 Corresponds to adjusted EBITDA less maintenance capex (accrual basis), less working capital, less net interest rates, less income tax and social contribution. |4 Excludes Klabin’s sales volume. |5 Includes the results of the Consumer Goods Unit.


The consolidated quarterly information has been prepared in accordance with the Securities and Exchange Commission (CVM) and Accounting Standards Committee (CPC) standards and is in compliance with International Accounting Standard (IFRS) issued by the International Accounting Standard Board (IASB). The data contained in this document was obtained from the financial information as made available to the CVM. The operating and financial information is presented based on consolidated numbers in Reais (R$). Summaries may diverge due to rounding. Non-financial data, such as volume, quantity, average price, average price, in Reais and Dollars, were not reviewed by independent auditors.
CONTENTS
| EXECUTIVE SUMMARY | 3 |
| PULP BUSINESS PERFORMANCE | 4 |
| PULP SALES VOLUME AND REVENUE | 4 |
| PULP CASH COST | 5 |
| PULP SEGMENT EBITDA | 7 |
| PULP OPERATING CASH GENERATION | 8 |
| PAPER BUSINESS PERFORMANCE | 8 |
| PAPER SALES VOLUME AND REVENUE | 8 |
| PAPER OPERATING CASH FLOW | 11 |
| ECONOMIC AND FINANCIAL PERFORMANCE | 11 |
| NET REVENUE | 11 |
| PRODUCTION | 12 |
| COST OF GOODS SOLD | 13 |
| OPERATING EXPENSES | 14 |
| ADJUSTED EBITDA | 16 |
| FINANCIAL RESULT | 17 |
| DERIVATIVE TRANSACTIONS | 18 |
| NET INCOME (LOSS) | 19 |
| INDEBTEDNESS | 20 |
| CAPITAL EXPENDITURE | 22 |
| OPERATING CASH GENERATION | 23 |
| IFRS 16 | 24 |
| SYNERGIES | 24 |
| CAPITAL MARKETS | 24 |
| FIXED INCOME | 26 |
| RISK RATING | 26 |
| UPCOMING EVENTS | 27 |
| IR CONTACTS | 27 |
| APPENDIX 1² – Operating Data | 28 |
| APPENDIX 2² – Consolidated Statement of Income and Goodwill Amortization | 30 |
| APPENDIX 3¹ – Consolidated Balance Sheet | 31 |
| APPENDIX 4¹ – Consolidated Statement of Cash Flow | 32 |
| APPENDIX 5² – EBITDA | 34 |
| APPENDIX 6² – Segmented Statement of Income | 35 |
| Forward-looking Statements | 37 |
Page 2 of 36
EXECUTIVE SUMMARY
The year 2019 began with a major milestone in Suzano’s history: the conclusion of the asset combination with Fibria. Over the year, we worked to build pillars to support the success of the post-merger company, which focused on capturing the projected synergies, unifying the organizational culture and integrating processes and systems. Amidst a highly challenging period for the pulp industry, we were able to end 2019 not just with a new company, but already with a single culture and a unified process represented by a single operational system.
The challenge of our post-merger journey was surmounted and successfully completed. In terms of synergies, we accelerated the capture curve, given the pulp market scenario, with the potential synergies to be captured annually in a steady state increased from between R$800 and R$900 million to between R$1.1 and R$1.2 billion. In parallel, we focused not just on integrating two distinct organizational cultures, but also on evolving towards a new culture based on the collective perceptions of our human capital. And, in this way, we implemented a comprehensive effort to reflect on who we are, what we do and how we do it, which culminated in three drivers: “people who inspire and transform,” “create and share value,” and “it’s only good for us if it's good for the world.” By the end of the year, the new culture proved to be robust by achieving 91% adherence. On the operational front, over the course of 2019, Suzano implemented a massive and important project to integrate its operational systems, which enabled us to end the year with our internal processes unified, with the go-live a big success that resulted in higher operating efficiency from 2020 onwards and a safer environment, paving the path towards Sarbanes-Oxley certification.
In the market environment, in 2019, we faced an adverse scenario in the pulp market due to the sudden drop in pulp prices, which was worsened by macroeconomic events such as the trade war between China and the United States and the economic slowdown in Europe. The scenario had direct impacts on our pulp business and on our financial statements. Nevertheless, we delivered important results in 2019, demonstrated by, for example, our capacity to reduce significantly our pulp inventories in the second half of the year, the decline in our cash cost despite the adverse effect from lower production volume, the Adjusted EBITDA record in the Paper Business Unit and the on our financial strength.
We ended 2019 with Suzano demonstrating strong resilience in the face of an adverse market scenario, moving forward even stronger, more competitive and confident in its determination to create and share value in the long term.
Page 3 of 36
PULP BUSINESS PERFORMANCE
PULP SALES VOLUME AND REVENUE
After a challenging year, the fourth quarter of 2019 enjoyed a more balanced scenario for the pulp market. The production increase of printing papers and paperboard packaging in China, combined with the continued growth in global tissue production, which in the year to October posted growth of 3% on the same period of 2018, supported strong pulp demand, which also benefitted from the scenario of attractive pulp prices for paper producers.
On the supply side, although there were no unexpected significant events, scheduled shutdowns during the fourth quarter ended up limiting the supply favoring a balanced market. The favorable dynamics of improvement in the demand for pulp and production reductions boosted the re-stocking movement in the chain of pulp producers. Softwood and hardwood pulp prices, after suffering a series of corrections, remained stable in the closing weeks of the year. By being very close to or even below the cash cost of marginal pulp producers, the price level should continue to pressure the supply of high-cost pulp.
In this context, Suzano register a historical record of sales in the quarter, which came to 2,920 thousand tons of market pulp, 15% higher than in 3Q19 and 40% higher than in 4Q18.
The average net pulp price in USD sold by Suzano was US$469/ton in 4Q19, representing decreases of US$59/t (-11%) and US$268/ton (-36%) compared to 3Q19 and 4Q18, respectively. The average price pulp price in the export market in 4Q19 was US$471/ton (compared to US$526/ton in 3Q19 and US$743/ton in 4Q18).
The average net price in BRL was R$1,929/ton in 4Q19, down 8% and 31% compared to 3Q19 and 4Q18, respectively, reflecting the lower prices in USD.
Page 4 of 36

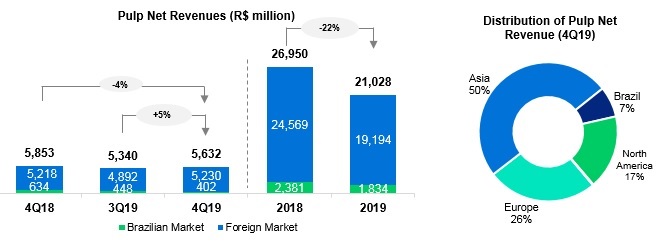
Net revenue from pulp sales was R$5,632 million in 4Q19, down 4% from 4Q18, mainly due to the lower average net price in USD (-36%), which was partially offset by the higher sales volume (+40%) and by the average appreciation in the USD against the BRL of 4%.
Compared to 3Q19, the main factors in the 5% increase in net revenue was the 15% sales volume growth and the 4% average appreciation in the USD against BRL, which were partially offset by the 11% decrease in the average net pulp price in USD.
PULP CASH COST
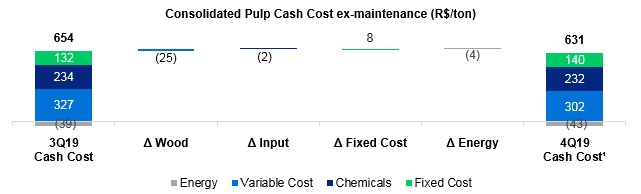
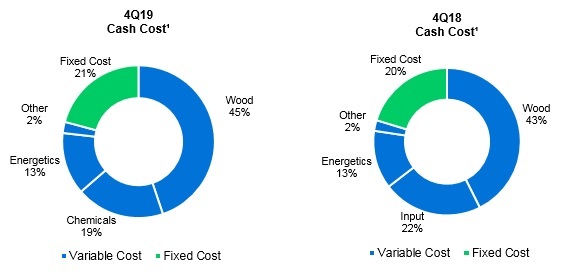
The consolidated cash cost of market pulp production in 4Q19, excluding the impacts from downtime in the period, was R$631/ton. Cash cost including downtime was R$644/t.
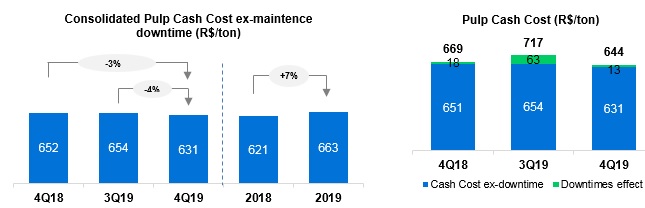
Pulp cash cost ex-downtime in 4Q19 decreased R$21/ton from 4Q18 (-3%), reflecting primarily the reductions in specific consumption and chemical prices, as well as synergy gains (mainly in caustic soda) and the higher result from energy sales (higher sales price). These effects were partially offset by the wood supply mix (higher share of third-party wood and higher wood logistics cost).
Page 5 of 36
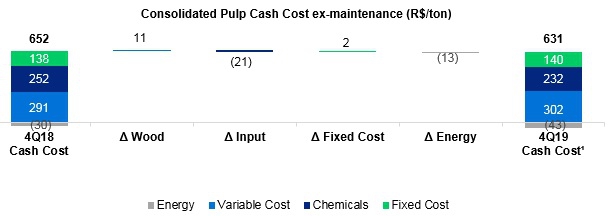
Cash cost ex-downtime in 4Q19 decreased R$23/ton from 3Q19 (-4%), mainly due to the lower wood cost (shorter average supply radius and lower share of third-party wood), which was partially offset by the increase in fixed costs. This increase is explained by the higher effect of the lower production rate, despite the lower impact of downtimes, which in turn explains the increase in production during the quarter.
¹Excludes maintenance and administrative downtimes impact.
¹Considers cash cost without downtimes. Does not consider energy sales.
Page 6 of 36
PULP SEGMENT EBITDA
| Pulp Segment | 4Q19 | 4Q18 | Δ Y-o-Y | 3Q19 | Δ Q-o-Q | 2019 | 2018 | Δ Y-o-Y | ||||||||||||||||||||||||
| Adjusted EBITDA (R$ million)¹ | 2,041 | 3,119 | -35 | % | 2,012 | 1 | % | 9,259 | 15,027 | -38 | % | |||||||||||||||||||||
| Sales Volume (k ton) – ex-Klabin | 2,757 | 1,949 | 41 | % | 2,347 | 17 | % | 8,873 | 9,302 | -5 | % | |||||||||||||||||||||
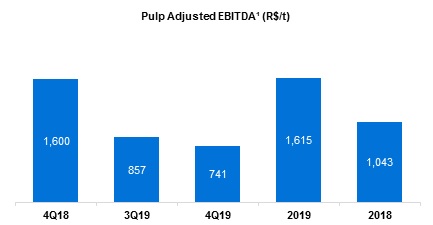
| Pulp Adjusted¹ EBITDA Ex-Klabin (R$/ton) | 741 | 1,600 | -54 | % | 857 | -14 | % | 1,043 | 1,615 | -35 | % |
¹Excluding non-recurring items and PPA impact.
The reduction in Adjusted EBITDA from pulp in 4Q19 compared to 4Q18 mainly reflects the lower net pulp price in USD (-36%), which was partially offset by the higher sales volume (+40%) and the 8% average appreciation in the USD against BRL. The reduction in per-ton adjusted EBITDA is explained by the lower average net pulp price and higher cash COGS per ton, due to inventories turnover, appreciation of the USD vs BRL, among other factors.
Compared to 3Q19, the 1% increase in adjusted EBITDA from pulp is explained by sales volume growth (+15%), the reduction in cash COGS (lower impact from downtimes and lower cash production cost) and the 4% average appreciation in the USD against BRL, with these factors offset by the 11% reduction in the average net price in USD. The decrease in per-ton pulp Adjusted EBITDA is explained by the higher pulp price in USD.
¹ Excluding non-recurring items and PPA impact.
Page 7 of 36
PULP OPERATING CASH GENERATION
| Pulp segment (R$ million) | 4Q19 | 4Q18 | Δ Y-o-Y | 3Q19 | Δ Q-o-Q | 2019 | 2018 | Δ Y-o-Y | ||||||||||||||||||||||||
| Adjusted EBITDA¹ | 2,041 | 3,119 | -35 | % | 2,012 | 1 | % | 9,259 | 15,027 | -38 | % | |||||||||||||||||||||
| Maintenance Capex² | (842 | ) | (1,029 | ) | -18 | % | (811 | ) | 4 | % | (3,343 | ) | (3,434 | ) | -3 | % | ||||||||||||||||
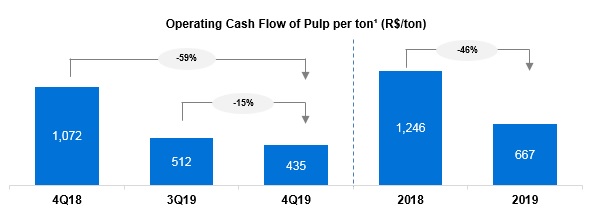
| Operating Cash Flow | 1,199 | 2,090 | -43 | % | 1,201 | 0 | % | 5,916 | 11,593 | -49 | % |
¹ Excluding non-recurring items and PPA impact.
²Cash basis.
¹ Excludes sales volume related to the agreement with Klabin.
Per-ton operating cash generation in the pulp segment decreased 59% and 15% from 4Q18 and 3Q19, respectively, impacted by the lower per-ton Adjusted EBITDA, as already explained, which was partially offset by the higher dilution of maintenance capex due to higher sales, besides the maintenance capex reduction vs. 4Q18.
PAPER BUSINESS PERFORMANCE
The data and analyses below incorporate the results from the consumer goods business, which is still in the ramp-up phase.
PAPER SALES VOLUME AND REVENUE
According to the Forestry Industry Association (Ibá), domestic sales of printing & writing paper and paperboard increased 23% and 1% in relation to 3Q19 and 4Q19, respectively. Meanwhile, imports decreased by 19% from 3Q19 and increased by 3% from 4Q18.
In the whole of 2019, domestic sales of printing & writing paper and paperboard contracted 4% in relation to the previous year, while imports decreased 5%. Domestic sales of printing & writing paper fell 6%, while paperboard sales decreased 1%.
In Brazil, Suzano’s paper sales came to 257 thousand tons in 4Q19, up 22% from 3Q19, explained by the seasonality of the Brazilian market intensified by the delayed timetable for the National Textbook Program (PNLD), and 4% higher than in 4Q18.
Paper sales in the domestic and export markets in 4Q19 came to 369 thousand tons, up 18% and 5% from 3Q19 and 4Q18, respectively, corroborating the volume flexibility between the national and international market.
Page 8 of 36

¹Includes consumer goods segment.
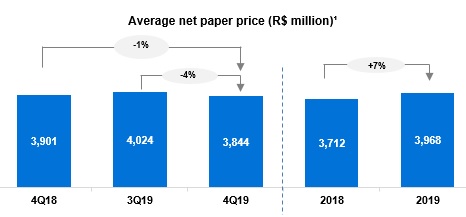
The average net price in the domestic market in 4Q19 was R$3,942/ton, down R$196/ton (5%) compared to 3Q19 and stable compared to 4Q18.
The average net price of paper exports in 4Q19 was US$879/ton, representing reductions of US$74/ton (-8%) vs. 3Q19 and US$111/ton (-11%) vs. 4Q18.In BRL, the export price in 4Q19 was R$3,619/ton, down R$169/ton (-4%) in relation to 3Q19 and down R$152/ton (-4%) in relation to 4Q18, reflecting the lower price in USD and partially offset by the BRL depreciation in the period.
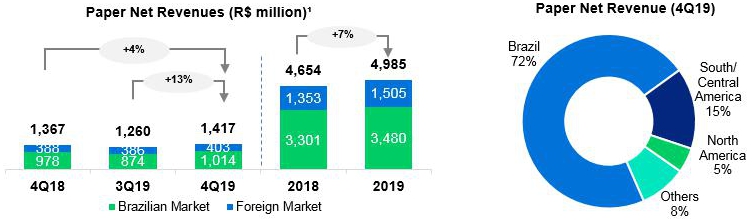
As a result of the strategy of profitability and the flexibility to operate in different markets, in 2019 it was observed a 7% increase in prices in comparison to 2018, despite the challenging price scenario in several markets.
Page 9 of 36
¹Includes consumer goods segment.
Net revenue from paper sales amounted to R$1,417 million in 4Q19, up 13% from 3Q19, mainly due to the higher sales volume, which was partially offset by the lower average net price.
Compare to prior-year period, this revenue grew by 4%, also due to the higher sales volume (+5%), which was partially offset by the reduction on average net price in BRL (-1%).
PAPER EBITDA
| Paper segment | 4Q19 | 4Q18 | Δ Y-o-Y | 3Q19 | Δ Q-o-Q | 2019 | 2018 | Δ Y-o-Y | ||||||||||||||||||||||||
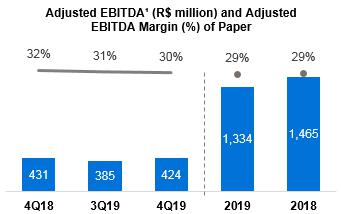
| Adjusted EBITDA (R$ million) ¹ | 424 | 431 | -2 | % | 385 | 10 | % | 1,465 | 1,334 | 10 | % | |||||||||||||||||||||
| Sales volume (k ton) | 369 | 350 | 5 | % | 313 | 18 | % | 1,256 | 1,254 | 0 | % | |||||||||||||||||||||
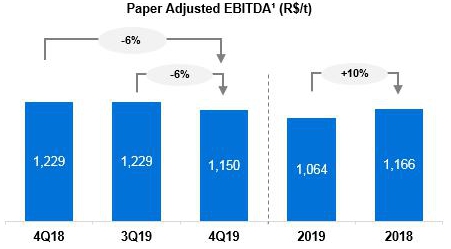
| Paper adjusted¹ EBITDA (R$/ton) | 1,150 | 1,229 | -6 | % | 1,229 | -6 | % | 1,166 | 1,064 | 10 | % | |||||||||||||||||||||
¹ Excluding non-recurring items and PPA impact.
The performance of Adjusted EBITDA from paper in 4Q19 compared to 4Q18 is explained mainly by the lower average net price (-1%) and higher cash COGS. These effects were partially neutralized by the higher sales volume (+5%), lower administrative expenses and appreciation in the USD against BRL (+8%).
Compared to 3Q19, the increase is due to the significant growth in sales volume (+18%), the lower cash COGS in the period, with these factors partially offset especially by the lower average net price in BRL (-4%).
Adjusted EBITDA reached a record of R$ 1,465 million, due to the volume allocation strategy, which contributed to the 7% increase in the average net price in 2019 vs 2018.
Page 10 of 36
¹ Excluding non-recurring items and PPA impact.
PAPER OPERATING CASH FLOW
| Operating cash flow - Paper (R$ million) | 4Q19 | 4Q18 | Δ Y-o-Y | 3Q19 | Δ Q-o-Q | 2019 | 2018 | Δ Y-o-Y | ||||||||||||||||||||||||
| Adjusted EBITDA¹ | 424 | 431 | -2 | % | 385 | 10 | % | 1,465 | 1,334 | 10 | % | |||||||||||||||||||||
| Maintenance Capex² | (83 | ) | (56 | ) | 48 | % | (70 | ) | 19 | % | (318 | ) | (218 | ) | 46 | % | ||||||||||||||||
| Operating Cash Flow | 341 | 375 | -9 | % | 314 | 9 | % | 1,147 | 1,116 | 3 | % | |||||||||||||||||||||
¹ Excluding non-recurring items and PPA impact.
²Cash basis.
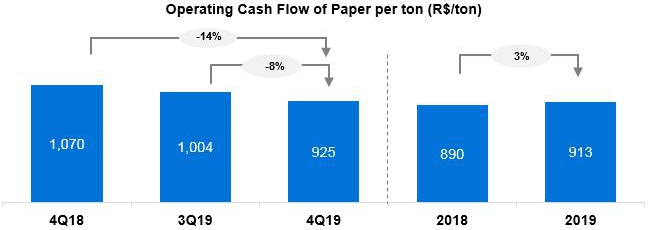
Operating cash generation came to R$925/t in 4Q19.Compared to 4Q18, operating cash generation per ton declined by 14%. Compared to the previous quarter, operating cash generation per ton increased by 8%, explained by higher adjusted EBITDA (+10%) partially offset by the higher (+18%) maintenance capex.
ECONOMIC AND FINANCIAL PERFORMANCE
NET REVENUE
Suzano’s net revenue in 4Q19 was R$7,049 million, 80% of which came from export sales (vs. 78% in 4Q18 and 80% in 3Q19).Pulp and paper sales in the quarter amounted to 3,288 thousand tons, 15% and 35% higher than in 3Q19 and 4Q18, respectively. Compared to 4Q18, the increase is mainly due to the better performance of pulp sales to Asia. Compared to the previous quarter, the sales increase occurred in all regions.
Page 11 of 36
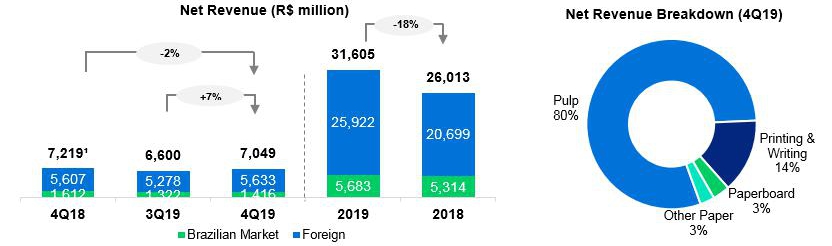
¹ Excludes service revenue from Portocel.
The increase in consolidated net revenue in 4Q19 compared to 3Q19 is explained by the 15% higher pulp sales volume and by the 4% average appreciation in the USD against the BRL. These effects were partially offset by the 11% decrease in the average net price of pulp in USD.
Compared to 4Q18, the lower net revenue was mainly due to the decrease in the average net price of pulp in USD (-36%), which was practically offset by the 35% higher sales volume and the 8% average appreciation in the USD against BRL.
PRODUCTION
| Production (k ton) | 4Q19 | 4Q18 | Δ Y-o-Y | 3Q19 | Δ Q-o-Q | 2019 | 2018 | Δ Y-o-Y | ||||||||||||||||||||||||
| Market Pulp | 2,267 | 2,581 | -12 | % | 2,095 | +8 | % | 8,757 | 10,259 | -15 | % | |||||||||||||||||||||
| Paper | 319 | 337 | -5 | % | 311 | +3 | % | 1,240 | 1,265 | -2 | % | |||||||||||||||||||||
| Total | 2,587 | 2,918 | -11 | % | 2,406 | +7 | % | 9,997 | 11,525 | -13 | % |
In the fourth quarter of 2019, there were no scheduled maintenance downtimes. However, production volume was affected by the Company’s decision to continue to produce below its capacity in order to optimize its inventories, which currently are above historical levels.
The following calendar details Suzano’s scheduled maintenance downtimes:
| Mill - Pulp capacity | 2019 | 2020 | 2021 | |||||||||||||||||||||||||||||||||||||||||||||
| 1Q19 | 2Q19 | 3Q19 | 4Q19 | 1Q20 | 2Q20 | 3Q20 | 4Q20 | 1Q21 | 2Q21 | 3Q21 | 4Q21 | |||||||||||||||||||||||||||||||||||||
| Aracruz - Linha A (ES) – 590 kt | ||||||||||||||||||||||||||||||||||||||||||||||||
| Aracruz - Linha B (ES) – 830 kt | ||||||||||||||||||||||||||||||||||||||||||||||||
| Aracruz - Linha C (ES) – 920 kt | ||||||||||||||||||||||||||||||||||||||||||||||||
| Imperatriz (MA)² – 1.650 kt | ||||||||||||||||||||||||||||||||||||||||||||||||
| Jacareí (SP) – 1.100 kt | ||||||||||||||||||||||||||||||||||||||||||||||||
| Limeira (SP)² – 690 kt | ||||||||||||||||||||||||||||||||||||||||||||||||
| Mucuri - Linha 1 (BA)² – 600 kt | ||||||||||||||||||||||||||||||||||||||||||||||||
| Mucuri - Linha 2 (BA) – 1.130 kt | ||||||||||||||||||||||||||||||||||||||||||||||||
| Suzano (SP)² – 520 kt | ||||||||||||||||||||||||||||||||||||||||||||||||
| Três Lagoas - Linha 1 (MS) – 1.300 kt | ||||||||||||||||||||||||||||||||||||||||||||||||
| Três Lagoas - Linha 2 (MS) – 1.950 kt | ||||||||||||||||||||||||||||||||||||||||||||||||
| Veracel (BA)¹ – 560 kt | ||||||||||||||||||||||||||||||||||||||||||||||||
¹ Veracel is a joint venture between Suzano (50%) and Stora Enso (50%) with total annual capacity of 1,120 thousand tons.
² Includes integrated capacities.
Page 12 of 36
COST OF GOODS SOLD
| COGS – Income Statement (R$ million) | 4Q19 | 4Q18 | Δ Y-o-Y | 3Q19 | Δ Q-o-Q | 2019 | 2018 | Δ Y-o-Y | |||||||||||||||||||||
| Pulp | 4,859 | 3,020 | 61 | % | 4,166 | 17 | % | 17,440 | 13,870 | 26 | % | ||||||||||||||||||
| Paper | 951 | 825 | 15 | % | 820 | 16 | % | 3,303 | 2,953 | 12 | % | ||||||||||||||||||
| Consolidated | 5,810 | 3,845 | 51 | % | 4,986 | 17 | % | 20,743 | 16,823 | 23 | % |
| COGS – Income Statement (R$/ton) | 4Q19 | 4Q18 | Δ Y-o-Y | 3Q19 | Δ Q-o-Q | 2019 | 2018 | Δ Y-o-Y | |||||||||||||||||||||
| Pulp | 1,664 | 1,449 | 15 | % | 1,634 | 2 | % | 1,853 | 1,385 | 34 | % | ||||||||||||||||||
| Paper | 2,580 | 2,354 | 10 | % | 2,620 | -2 | % | 2,629 | 2,355 | 12 | % | ||||||||||||||||||
| Consolidated | 1,767 | 1,579 | 12 | % | 1,742 | 1 | % | 1,944 | 1,493 | 30 | % |
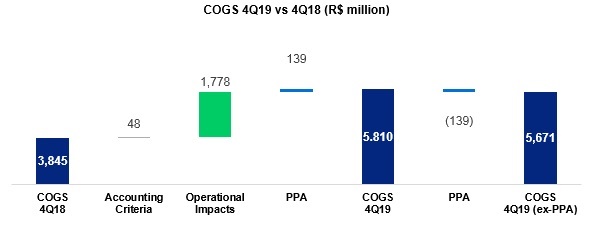
As a result of the business combination with Fibria, Suzano assessed the fair value of the assets acquired and liabilities assumed from Fibria and made the corresponding allocations to the balance sheet (Purchase Price Allocation – PPA). For the purposes of the operating analysis for 4Q19, the following information excludes the effects from the realization of the surplus value allocated to COGS in the period (whose impact was an additional expense of R$139 million.For more details, see Appendix II.
| COGS – ex-PPA (R$ million) | 4Q19 | 4Q18 | Δ Y-o-Y | 3Q19 | Δ Q-o-Q | 2019 | 2018 | Δ Y-o-Y | |||||||||||||||||||||
| Pulp | 4,720 | 3,020 | 56 | % | 3,987 | 18 | % | 14,595 | 13,870 | 5 | % | ||||||||||||||||||
| Paper | 951 | 825 | 15 | % | 820 | 16 | % | 3,303 | 2,953 | 12 | % | ||||||||||||||||||
| Consolidated | 5,671 | 3,845 | 47 | % | 4,808 | 18 | % | 17,899 | 16,823 | 6 | % |
| COGS – ex-PPA (R$/ton) | 4Q19 | 4Q18 | Δ Y-o-Y | 3Q19 | Δ Q-o-Q | 2019 | 2018 | Δ Y-o-Y | |||||||||||||||||||||
| Pulp | 1,617 | 1,449 | 12 | % | 1,564 | 3 | % | 1,674 | 1,385 | 21 | % | ||||||||||||||||||
| Paper | 2,580 | 2,354 | 10 | % | 2,620 | -2 | % | 2,629 | 2,355 | 12 | % | ||||||||||||||||||
| Consolidated | 1,725 | 1,579 | 9 | % | 1,680 | 3 | % | 1,678 | 1,493 | 12 | % |
Excluding the effect above from PPA, COGS in 4Q19 came to R$5,671 million, or R$1,725/ton.Compared to 4Q18, including theaccounting allocation effect (R$48 million), COGS increased 46%, mainly due to the higher pulp sales, by the effect from inventory turnover and appreciation of USD vs. BRL. The effect on COGS related to the alignment of criteria for accounting allocation was due to the business combination with Fibria, which is mainly explained by logistics expenses, which in 2018 were allocated to “selling expenses” at Fibria and as of 1Q19 were reallocated to “logistics costs” under COGS. Analyzing COGS per ton excluding PPA, the increase of 9% is mainly due from inventory turnover and appreciation of USD vs. BRL.
Page 13 of 36
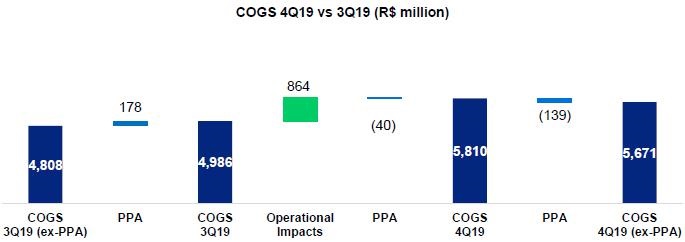
Compared to 3Q19 and excluding the impact from PPA, the 21% increase was due to the growth in pulp and paper sales volumes. On a per-ton basis, the increase of 3% is mainly due to contingencies update, contractual renegotiations as a result of the synergies and appreciation of the average USD vs the BRL.
OPERATING EXPENSES
| Operating Expenses – Income Statement (R$ million) | 4Q19 | 4Q18 | Δ Y-o-Y | 3Q19 | Δ Q-o-Q | 2019 | 2018 | Δ Y-o-Y | ||||||||||||||||||||||||
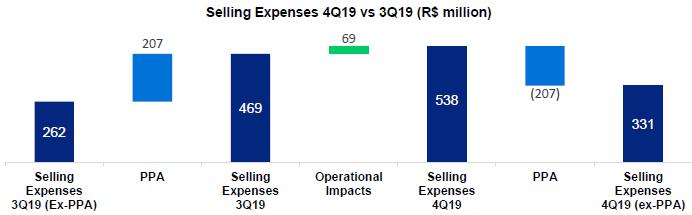
| Selling Expenses | 538 | 340 | 58 | % | 469 | 15 | % | 1,905 | 1,411 | 35 | % | |||||||||||||||||||||
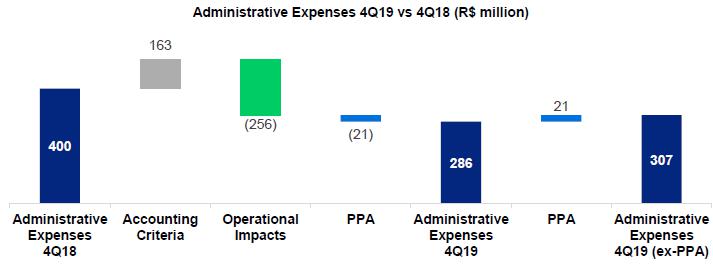
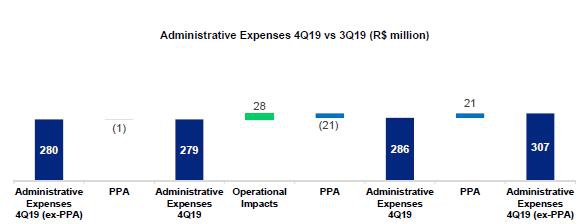
| General and Administrative Expenses | 286 | 400 | -29 | % | 279 | 3 | % | 1,173 | 1,217 | -4 | % | |||||||||||||||||||||
| Total Expenses | 824 | 740 | 11 | % | 748 | 10 | % | 3,079 | 2,629 | 17 | % | |||||||||||||||||||||
| Total Expenses/Sales Volume (R$/ton) | 250 | 304 | -18 | % | 261 | -4 | % | 289 | 233 | 24 | % |
| Operating Expenses – ex-PPA (R$ million) | 4Q19 | 4Q18 | Δ Y-o-Y | 3Q19 | Δ Q-o-Q | 2019 | 2018 | Δ Y-o-Y | ||||||||||||||||||||||||
| Selling Expenses | 331 | 340 | -3 | % | 262 | 26 | % | 1,085 | 1,411 | -23 | % | |||||||||||||||||||||
| General and Administrative Expenses | 307 | 400 | -23 | % | 280 | 10 | % | 1,200 | 1,217 | -1 | % | |||||||||||||||||||||
| Total Expenses | 638 | 740 | -14 | % | 542 | 18 | % | 2,285 | 2,629 | -13 | % | |||||||||||||||||||||
| Total Expenses/Sales Volume (R$/ton) | 194 | 304 | -36 | % | 189 | 3 | % | 214 | 233 | -8 | % |
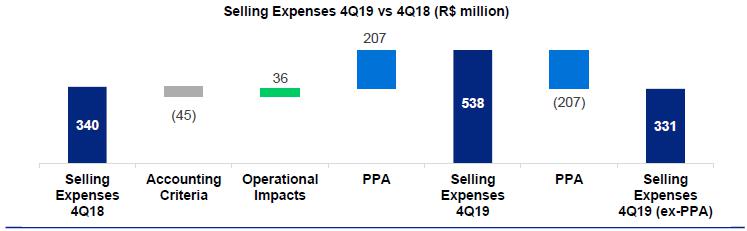
Excluding the effect from PPA of R$207 million on the result for 4Q19, Selling Expenses decreased 3% from 4Q18, since the operating impacts (higher volume and appreciation of USD vs. BRL) were offset by the effect of R$45 million related to the alignment of criteria for accounting allocation due to the merger of Fibria shares (especially on selling expenses, which as of 1Q19 are recorded as COGS). Excluding the accounting allocation effect, selling expenses per ton fell 28%, mainly due to higher dilution of fixed costs.
Page 14 of 36
Compared to 3Q19, the 26% increase is mainly explained by the higher sales volume and by the 4% appreciation in the average price of the USD against the BRL. Per-ton selling expenses decreased 10% due to exchange variation and client mix.
Excluding the effect from the positive PPA on administrative expenses (R$21 million) in the comparison with 4Q18, the 23% decrease in this item is explained by higher expenses arising from the transaction with Fibria in that period and by the capture of synergies, with these factors partially offset by the effect from the accounting allocation of R$163 million (related to a portion of variable compensation and contingencies that Fibria previously recorded as “other operating income and expenses”).
Compared to 3Q19, the item was 10% higher due to the increase in expenses with payroll and benefits. On a per-ton basis, administrative expenses decreased 5%, reflecting the higher sales volume.
Page 15 of 36
Excluding the effect from PPA, “other operating income (expenses)” amounted to income of R$139 million in 4Q19, compared to the expense of R$469 million in 4Q18 and the income of R$116 million in 3Q19.The variation compared to 4Q18 is mainly explained by the gain from the revaluation of biological assets, compared to the loss in that quarter. In relation to 3Q19, the variation is explained by the adjustment to the fair value of biological assets, which was partially offset by the income from tax credits in the previous quarter.
ADJUSTED EBITDA
| Consolidated | 4Q19 | 4Q18 | Δ Y-o-Y | 3Q19 | Δ Q-o-Q | 2019 | 2018 | Δ Y-o-Y | |||||||||||||||||||||||||
| Adjusted EBITDA (R$ million)¹ | 2,465 | 3,550 | -31 | % | 2,396 | 3 | % | 10,724 | 16,361 | -34 | % | ||||||||||||||||||||||
| Adjusted EBITDA¹ Margin - ex-Klabin | 37 | % | 52 | % | -15 | p.p. | 39 | % | -2 | p.p. | 43 | % | 55 | % | -12 | p.p. | |||||||||||||||||
| Sales Volume ex-Klabin (mil ton) | 3,125 | 2,300 | 36 | % | 2,661 | 17 | % | 10,130 | 10,556 | -4 | % | ||||||||||||||||||||||
| Adjusted EBITDA¹ ex-Klabin / Ton (R$/ton) | 789 | 1,544 | -49 | % | 901 | -12 | % | 1,059 | 1,550 | -32 | % |
¹ Excluding non-recurring items and PPA impact.
Adjusted EBITDA in 4Q19 was R$2,465 million, decreasing compared to 4Q18, mainly due to the lower net pulp price in USD (-36%), which was partially offset by: (i) the higher pulp sales volume (+40%); (ii) the appreciation in the average price of the USD against the BRL (+8%); and (iii) the reduction in administrative expenses (as explained above). The 49% decline in EBITDA per ton also is explained by the price factor.
Compared to 3Q19, the 3% growth in Adjusted EBITDA is mainly due to the higher pulp price (+15%), the appreciation in the average price of the USD against the BRL (+4%), which offset the lower average net price of pulp. The 12% decline in per-ton adjusted EBITDA is basically due to the lower average net price of pulp in USD.
Page 16 of 36
FINANCIAL RESULT
| Financial Result (R$ million) | 4Q19 | 4Q18 | Δ Y-o-Y | 3Q19 | Δ Q-o-Q | 2019 | 2018 | Δ Y-o-Y | ||||||||||||||||||||||||
| Financial Expenses | (1,055 | ) | (861 | ) | 23 | % | (1,045 | ) | 1 | % | (4,179 | ) | (2,941 | ) | 42 | % | ||||||||||||||||
| Interest on loans and financing (local currency) | (324 | ) | (374 | ) | -13 | % | (355 | ) | -9 | % | (1,444 | ) | (1,137 | ) | 27 | % | ||||||||||||||||
| Interest on loans and financing (foreign currency) | (557 | ) | (380 | ) | 47 | % | (597 | ) | -7 | % | (2,140 | ) | (1,147 | ) | 87 | % | ||||||||||||||||
| Capitalized interest1 | 2 | 0 | - | 0 | - | 4 | 8 | -50 | % | |||||||||||||||||||||||
| Other financial expenses | (176 | ) | (107 | ) | 64 | % | (93 | ) | 89 | % | (599 | ) | (665 | ) | -10 | % | ||||||||||||||||
| Financial Income | 100 | 360 | -72 | % | 94 | 6 | % | 493 | 825 | -40 | % | |||||||||||||||||||||
| Interest on financial investments | 87 | 341 | -75 | % | 91 | -4 | % | 392 | 753 | -48 | % | |||||||||||||||||||||
| Other financial income | 13 | 19 | -32 | % | 3 | 333 | % | 101 | 72 | 41 | % | |||||||||||||||||||||
| Monetary and Exchange Variations | 1,418 | 634 | 123 | % | (3,685 | ) | -138 | % | (1,965 | ) | (2,812 | ) | -30 | % | ||||||||||||||||||
| Foreign exchange variations (Debt) | 1,522 | 850 | 79 | % | (3,627 | ) | -142 | % | (1,764 | ) | (3,197 | ) | -45 | % | ||||||||||||||||||
| Other foreign exchange variations | (104 | ) | (216 | ) | -52 | % | (58 | ) | 79 | % | (201 | ) | 385 | -152 | % | |||||||||||||||||
| Derivative income (loss), net2 | 1,161 | 1,545 | -25 | % | (1,857 | ) | -163 | % | (1,075 | ) | (2,822 | ) | -62 | % | ||||||||||||||||||
| Cash flow hedge | 474 | 1,290 | -63 | % | (654 | ) | -172 | % | 153 | (1,813 | ) | -108 | % | |||||||||||||||||||
| Debt hedge | 731 | 316 | 131 | % | (1,246 | ) | -159 | % | (1,255 | ) | (919 | ) | 37 | % | ||||||||||||||||||
| Others3 | (44 | ) | (61 | ) | -28 | % | 43 | -202 | % | 27 | (90 | ) | -130 | % | ||||||||||||||||||
| Net Financial Result | 1,624 | 1,678 | -3 | % | (6,493 | ) | -125 | % | (6,726 | ) | (7,750 | ) | -13 | % |
¹ Capitalized interest due to construction in progress.
2 Variation in mark-to-market adjustment plus adjustments paid and received (4Q19: 1,241 million | R$ 3Q19: R$ (1,806) million).
³ Includes commodity hedge and embedded derivatives.
Financial expenses came to R$1,055 million in 4Q19, up 1% from 3Q19, reflecting the effect of the average USD depreciation vs. BRL (4%), which was partially offset by the lower interest rates in the local and international markets. Compared to 4Q18, the 23% increase in financial expenses is explained by the loans taken out for the business combination with Fibria.
Financial income in 4Q19 compared to 3Q19 increased 6%, which is mainly explained by the lower effect from the amortization of surplus value related to the business combination with Fibria (for more details, see note 27 of the Financial Statements - DFP) impacting “Other Financial Income”. The 5% decline in “Interest on financial investments” was mainly due to the cuts to the Selic interest rate during 4Q19 (cumulative reduction of 150 bps in the period). Compared to 4Q18, in addition to the aforementioned effect from the lower Selic rate, the 75% reduction is due to the lower accrual of interest on financial investments caused by the reduction in the cash position, given that the quarter was marked by a strong concentration of cash to conclude the deal with Fibria (R$21.8 billion).
Inflation adjustment and exchange variation had a positive impact of R$1,418 million on the Company’s financial result in the quarter, given the effect from the USD depreciation of 3% against the BRL on the foreign-denominated portion of debt (73% of total debt). It is important to note that the cash effect from the exchange variation on foreign-denominated debt has impact only upon the respective maturities.
Derivative operations generated a gain of R$1,162, mainly due to debt hedge position. The mark-to-market variation on derivatives this quarter is mainly explained by the effects from the end-of-period price of the BRL against the USD on existing agreements. There also was a less significant impact caused by the variation in the Pré, Cupom and Libor curves on the operations. The mark-to-market adjustment of financial derivatives on December 31, 2019 generated a loss of R$1,819 million, compared to the loss of R$3,060 million at September 30, 2019, representing a positive variation of R$1,241 million.
Due to the aforementioned factors, net financial income was R$1,625 million in 4Q19, compared to the net financial expense of R$6,493 million in 3Q19 and of R$1,679 million in 4Q18.
Page 17 of 36
DERIVATIVE TRANSACTIONS
Suzano carries out derivatives transactions exclusively for hedging purposes. The following table reflects the position of derivative hedging instruments at December 31, 2019:
| Notional | Fair Value | |||||||
| Hedge | (USD million) | (R$ million) | ||||||
| Debt | 6,546 | (2,154 | ) | |||||
| Cash flow | 3,425 | 67 | ||||||
| Others¹ | 680 | 268 | ||||||
| Total | 10,650 | (1,819 | ) | |||||
¹ Refer to note 4 of the 2019 Annual Financial Statements for further details and fair value sensitivity analysis.
2 Includes commodity hedge and embedded derivatives.
The Company’s currency exposure policy seeks to minimize the volatility of its cash generation and to impart greater flexibility to its cash flow management. Currently, the policy stipulates that surplus dollars may be partially hedged (up to 75% of exchange variation exposure over the next 18 months) using plain vanilla instruments, such as Zero Cost Collars (ZCC) and Non-deliverable Forwards (NDF).
ZCC transactions establish minimum and maximum limits for the exchange rate that minimize adverse effects in the event of significant appreciation in the BRL. If the exchange rate is within such limits, the Company neither pays nor receives any financial adjustments. Therefore, the Company is protected in scenarios of extreme BRL appreciation. However, these transactions also limit potential gains in scenarios of extreme BRL depreciation. The characteristics allows for capturing greater benefits from export revenue in a potential scenario of USD appreciation within the range contracted. The current scenario of volatility in the BRL/USD exchange rate made this strategy more adequate for protecting the cash flow of the Company, which is constantly monitoring the market and analyzing the attractiveness at any given moment of any full or partial reversal in the transaction.
At December 31, 2019, the outstanding notional value of operations involving forward USD sales through ZCCs was US$3,425 million, whose maturities are distributed from January 2020 to July 2021, with an average forward rate ranging from R$3.98 to R$4.31. In 4Q19, results from ZCC transactions posted a gain of R$474 million. The mark-to-market adjustment (fair value) of ZCC transactions was a gain of R$67 million at the end of the quarter.
| Cash Flow Hedge | Maturity | Strike Range | Notional (US$ million) | |||
| Zero-Cost Collars | 1Q2020 | 3.86 – 4.30 | 670 | |||
| Zero-Cost Collars | 2Q2020 | 3.87 – 4.20 | 705 | |||
| Zero-Cost Collars | 3Q2020 | 3.93 – 4.10 | 705 | |||
| Zero-Cost Collars | 4Q2020 | 4.07 – 4.44 | 350 | |||
| Zero-Cost Collars | 1Q2021 | 4.10 – 4.46 | 525 | |||
| Zero-Cost Collars | 2Q2021 | 4.17 – 4.52 | 470 | |||
| Total | 3.98 – 4.31 | 3,425 |
The Company also uses currency and interest rate swaps to mitigate the effects from exchange and interest rate variations on the balance of its debt and on its cash flow. Contracts swapping different interest rates and inflation indexes may be entered into as a way to mitigate the mismatch between financial assets and liabilities.
On December 31, 2019, the Company had outstanding (notional value) the amount of US$6,546 million, distributed as shown in the table below.In 4Q19, debt hedge transactions posted a gain of R$731 million, mainly due to the BRL appreciation in the period. The mark-to-market adjustment (fair value) of such operations was a loss of R$2,154 million at the end of the quarter.
Page 18 of 36
| Debt Hedge | Maturity | Currency | Notional (US$ million) | |||||||||
| Swap (PRÉ x USD) | 2024 | USD | 350 | |||||||||
| Swap (CDI x USD) | 2026 | USD | 3,116 | |||||||||
| Swap (IPCA x CDI) | 2023 | BRL | 209 | |||||||||
| Swap (IPCA x USD) | 2023 | USD | 121 | |||||||||
| Swap (LIBOR x USD) | 2024 | USD | 2,750 | |||||||||
| Total | 6,546 | |||||||||||
¹Translated at the closing exchange rate on 12/30/2019 of 4.0307.
Forestry partnership agreements and standing-timber supply agreements entered into on December 30, 2013 by former Fibria Celulose S.A. are denominated in USD per cubic meter of standing timber, adjusted by U.S. inflation measured by the Consumer Price Index (CPI), which is not related to inflation in the economic environments where the forests are located, which therefore constitutes an embedded derivative. Such instrument, which is presented in the table below, consists of a swap contract with the short leg consisting of the variations in the U.S. CPI during the period of the aforementioned agreements. See note 4 of the 3Q19 Financial Statements for more details and for a sensitivity analysis of the fair value in the event of substantial variation in the U.S. CPI. At December 31, 2019, the outstanding (notional) value of the operation was US$679 million. The result from the swap was a loss of R$43 million in 4Q19. The mark-to-market adjustment (fair value) of such operations was as gain of R$269 million at the end of the quarter.}
| Embedded Derivative | Maturity | Index | Notional (US$ million) | |||
| Embedded Derivative | 2035 | Fixed USD – USD US-CPI | 679 | |||
| Total | 679 |

NET INCOME (LOSS)
In 4Q19, the Company posted net income of R$1,175 million, compared to net income of R$2,987 million in 4Q18 and a net loss of R$3,460 million in 3Q19.The variation in relation to 4Q18 is mainly explained by the lower operating result, which is basically explained by the effects from the pulp price, which were partially offset by the higher sales volume.
Compared to 3Q19, the variation is explained by the net financial income in the period, mainly due to exchange variation on debt and hedge instruments, compared to the net financial expense in the previous quarter.
Page 19 of 36
| INDEBTEDNESS |
| Debt (R$ million) | 31/12/2019 | 31/12/2018 | Δ Y-o-Y | 30/09/2019 | Δ Q-o-Q | |||||||||||||||
| Local Currency | 18,185 | 17,859 | 2 | % | 17,278 | 5 | % | |||||||||||||
| Short Term | 3,563 | 2,455 | 45 | % | 2,620 | 36 | % | |||||||||||||
| Long Term | 14,622 | 15,404 | -5 | % | 14,658 | 0 | % | |||||||||||||
| Foreign Currency | 45,500 | 38,546 | 18 | % | 46,743 | -3 | % | |||||||||||||
| Short Term | 2,665 | 4,048 | -34 | % | 2,472 | 8 | % | |||||||||||||
| Long Term | 42,835 | 34,498 | 24 | % | 44,271 | -3 | % | |||||||||||||
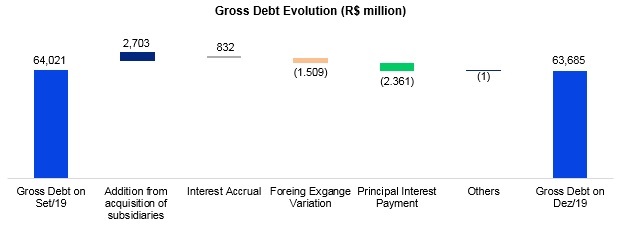
| Gross Debt | 63,685 | 56,405 | 13 | % | 64,021 | -1 | % | |||||||||||||
| (-) Cash and financial statements | 9,579 | 31,770 | -70 | % | 8,790 | 9 | % | |||||||||||||
| Net Debt | 54,106 | 24,635 | 120 | % | 55,231 | -2 | % | |||||||||||||
| Net Debt/Adjusted EBITDA1 (x) – R$ | 5.0 | x | 1.5 | x | 3.5 | x | 4.7 | x | 0.3 | x | ||||||||||
| Net Debt/EBITDA Ajustado¹ (x) – US$ | 4.9 | x | 1.4 | x | 3.5 | x | 4.3 | x | 0.6 | x | ||||||||||
¹ Excluding non-recurring items.
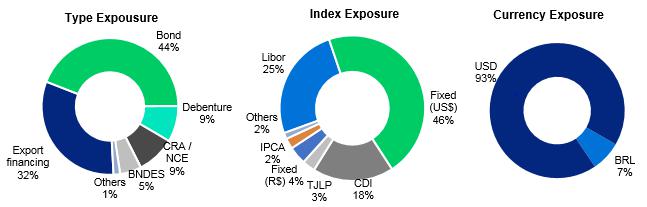
On December 31, 2019, gross debt stood at R$63,685 million and was composed of 90% long-term maturities and 10% short-term maturities, with 71% denominated in foreign currency and 29% in local currency. The percentage of gross debt denominated in foreign currency, considering the effect from debt hedge, was 93%. Gross debt increased by 1% compared to 3Q19 (R$0.3 billion), reflecting the effect from exchange variation on debt. Compared to 4Q18, the increase in gross debt reflects the funds raised for the business combination with Fibria and the effects from exchange variation in the period.
Suzano contracts debt in foreign currency as a natural hedge, since net operating cash generation is denominated in foreign currency. This structural exposure allows it to contract export financing in USD to match financing payments with receivable flows from sales.
* Corresponding mainly to transaction costs (emission, fund raising, etc.) and impacts from surplus value resulting from the operation with Fibria.
Page 20 of 36
At December 31, 2019, the total average cost of debt in USD was 4.8% p.a. (debt in BRL adjusted by the market swap curve). The average term of consolidated debt at the end of the year decreased to 84 months (vs. 85 months in September 2019).
¹ Considers the portion of the debt with swap in foreign currency. The original debt comprised 72% USD and 28% BRL.
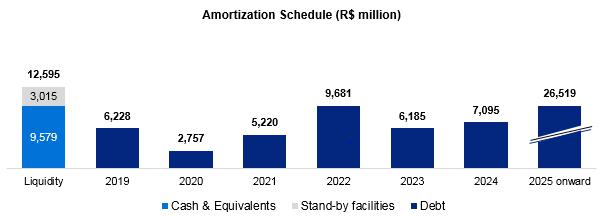
Cash and cash equivalents at December 31, 2019 was R$9,579 million, 73% of which was invested in local currency, in government and fixed-income bonds, and the remainder in short-term investments abroad.
The Company maintains two stand-by credit facilities in the aggregate amount of R$3,015 million available through 2024, with one facility denominated in local currency in the amount of R$1 billion and one facility in foreign currency in the amount of US$500 million. These funds, although untapped, help to improve the company’s liquidity conditions. As a result, the current cash position of R$9,579 million plus this line of R$3,015 million amounts to a readily available cash position of R$12,594 million.
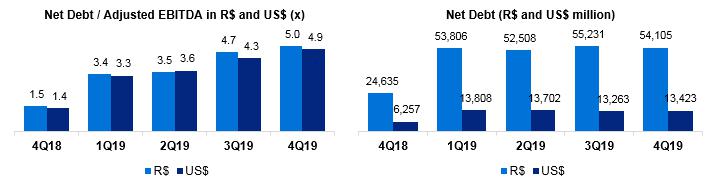
Net debt stood at R$54.1 billion (US$13.4 billion) on December 31, 2019, compared to R$55.2 billion (US$13.3 billion) on September 30, 2019. The decrease is mainly due to the depreciation in the USD against the BRL.
Page 21 of 36
The breakdown of gross debt between trade and non-trade finance on December 31, 2019 is shown below:
| 2020 | 2021 | 2022 | 2023 | 2024 | 2025 on | Total | ||||||||||||||||||||||
| Trade Finance | 35 | % | 54 | % | 62 | % | 80 | % | 54 | % | 23 | % | 32 | % | ||||||||||||||
| Non Trade Finance | 65 | % | 46 | % | 38 | % | 20 | % | 46 | % | 77 | % | 68 | % | ||||||||||||||
The ratio of net debt to Adjusted EBITDA in BRL stood at 5.0x on December 31, 2019, compared to 4.7x at the end of 3Q19. In USD, the ratio of net debt to Adjusted EBITDA was 4.9x on December 31, 2019, compared to 4.3x at the end of 3Q19.
CAPITAL EXPENDITURE
In 4Q19, capital investments (cash basis) amounted to R$1,380 million, down 19% from 4Q18, mainly due to lower expenses with maintenance and modernization. Compared to 3Q19, the decrease was mainly due to the impact in the previous quarter from the acquisition of Duratex’s forest assets, which was partially offset by higher maintenance costs in 4Q19 and the higher investments in modernization.
For 2020, the Management approved a Capital Budget of R$4.4 billion, of which R$3.6 billion is allocated to industrial and forest maintenance.
| Investiments (R$ million) | 4Q19 | 4Q18 | Δ Y-o-Y | 3Q19 | Δ Q-o-Q | 2019 | 2018 | Δ Y-o-Y | Guidance2020 | |||||||||||||||||||||||||||
| Sustaining | 924 | 1,085 | -15 | % | 881 | 5 | % | 3,661 | 3,652 | 0 | % | 3,642 | ||||||||||||||||||||||||
| Industrial Maintenance | 177 | 226 | -22 | % | 211 | -16 | % | 711 | 678 | 5 | % | 689 | ||||||||||||||||||||||||
| Forestry Maintenance | 703 | 841 | -16 | % | 630 | 12 | % | 2,815 | 2,928 | -4 | % | 2,808 | ||||||||||||||||||||||||
| Other | 44 | 18 | 144 | % | 40 | 10 | % | 135 | 45 | 200 | % | 145 | ||||||||||||||||||||||||
| Expansion and Modernization | 92 | 180 | -49 | % | 69 | 33 | % | 287 | 2,121 | -86 | % | 267 | ||||||||||||||||||||||||
| Land and Forestry | 257 | 301 | -15 | % | 541 | -52 | % | 1,462 | 1,072 | 36 | % | 397 | ||||||||||||||||||||||||
| Port Terminals | 106 | 139 | -24 | % | 102 | 4 | % | 369 | 176 | 110 | % | 140 | ||||||||||||||||||||||||
| Total | 1,380 | 1,705 | -19 | % | 1,593 | -13 | % | 5,779 | 7,020 | -18 | % | 4,446 | ||||||||||||||||||||||||
Page 22 of 36
OPERATING CASH GENERATION
| (R$ million) | 4Q19 | 4Q18 | Δ Y-o-Y | 3Q19 | Δ Q-o-Q | 2019 | 2018 | Δ Y-o-Y | ||||||||||||||||||||||||
| Adjusted EBITDA¹ | 2,465 | 3,550 | -31 | % | 2,396 | 3 | % | 10,724 | 16,361 | -34 | % | |||||||||||||||||||||
| Maintenance Capex² | (925 | ) | (1,085 | ) | -15 | % | (881 | ) | 5 | % | (3,661 | ) | (3,652 | ) | 0 | % | ||||||||||||||||
| Operating Cash Flow | 1,540 | 2,465 | -38 | % | 1,515 | 2 | % | 7,063 | 12,709 | -44 | % | |||||||||||||||||||||
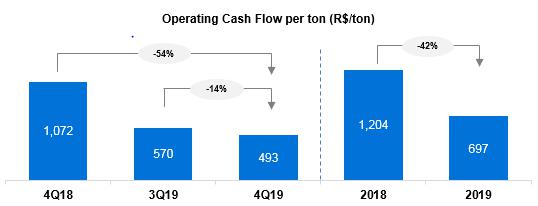
| Operating Cash Flow (R$/ton) | 493 | 1,072 | -54 | % | 570 | -13 | % | 697 | 1,204 | -42 | % |
¹Excluding non-recurring items and PPA impact.
² Cash basis.
Operating cash generation, measured by Adjusted EBITDA less sustaining capex (cash basis), amounted to R$1,540 million in 4Q19. The decrease compared to 4Q18 reflects primarily the lower net price of pulp in USD (-36%).Compared to 3Q19, the 2% increase reflects mainly the higher sales volume, which was offset in large part by the lower net pulp price in USD (-11%). Per-ton operating cash flow performance also is largely explained by the price factor.
Page 23 of 36
IFRS 16
The Company first adopted CPC 06 (R2) / IFRS 16 as of January 1, 2019. As a result, it recognized on January 1, 2019 the amounts corresponding to the right-of-use of current contracts, in amounts equivalent to the present value of obligations assumed with its counterparties. These balances will be amortized over the terms of the leases. Upon adoption of the standard, the Company recognized lease liabilities for contracts that meet the definition of lease, in the amount of R$4,019 million. The updated balance of liabilities on December 31, 2019 was R$3,984 million, while the updated balance on the same date of “Rights of use over lease contracts” under assets was R$3,850 million. For more details, see Note 19 to the 2019 Financial Statements (DFP).
SYNERGIES
The Company updated its projected synergy gains from the business combination with Fibria Celulose S.A. Currently, Suzano expects to capture from 2019 to 2021 operating synergies estimated at R$1,100 to R$1,200 million per year (before taxes), and on a recurring basis as from 2021, with a reduction in costs, expenses and capital expenditures from the areas of procurement, forest, industrial, logistics, sales, administrative and personnel, and expects to capture tax synergies that result in tax deductions of around R$2.0 billion per year.
The amount captured from operating synergies in 2019 totaled R$ 311 million, considering the implementation costs (of the order of R$ 60 million) and the negative impacts of the production cut carried out in the period. Excluding this last effect, the synergies capture would have reached R$ 763 million in the year.
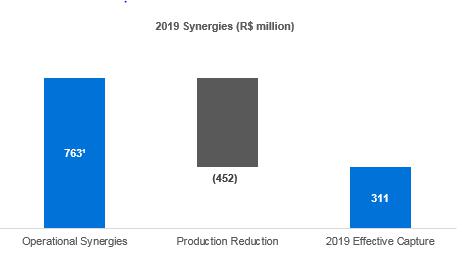
¹Considers implementation costs.
CAPITAL MARKETS
On December 31, 2019, Suzano’s stock was quoted at R$39.68/share (SUZB3) and US$9.84 (SUZ). The Company’s stock is listed on the Novo Mercado, the trading segment of the São Paulo Exchange (B3 – Brasil, Bolsa e Balcão) with the highest corporate governance standards, and also is traded on the New York Stock Exchange (NYSE) - Level II.
Page 24 of 36
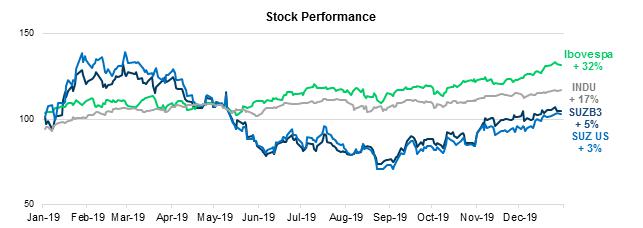
Source: Bloomberg.
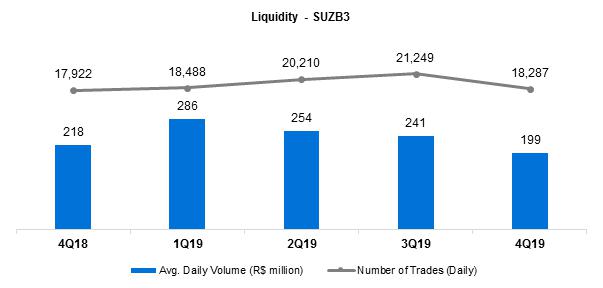
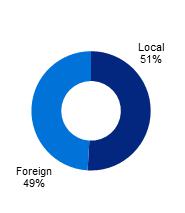
On December 31, 2019, the Company's share capital was represented by 1,361,263,584 common shares, of which 12,042,004 were held in Treasury. Suzano’s market capitalization stood at R$54.4 billion on December 31, 2019. In 4Q19, the free float corresponded to 53.3% of the total capital.
| Free Float Distribution 12/31/2019 | Ownership Structure 12/31/2019 |
| (B3+ NYSE) |
 | 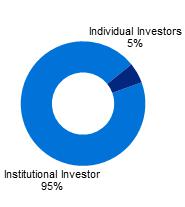 | 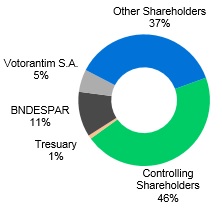 |
Page 25 of 36
FIXED INCOME
| Unit | Sep/18 | Jun/19 | Sep/19 | Δ Y-o-Y | Δ Q-o-Q | |||||||||||||||||||
| Suzano 2021 – Price | USD/k | 103.787 | 103.757 | 103.59 | -0.2 | % | -0.2 | % | ||||||||||||||||
| Suzano 2021 –Yield | % | 3.938 | 2.924 | 2.409 | -38.8 | % | -17.6 | % | ||||||||||||||||
| Fibria 2024 – Price | USD/k | 102 | 106.886 | 108.446 | 6.3 | % | 1.5 | % | ||||||||||||||||
| Fibria 2024 – Yield | % | 4.8 | 3.614 | 3.159 | -34.2 | % | -12.6 | % | ||||||||||||||||
| Fibria 2025 – Price | USD/k | 94.7 | 102.101 | 103.592 | 9.4 | % | 1.5 | % | ||||||||||||||||
| Fibria 2025 – Yield | % | 5 | 3.559 | 3.221 | -35.6 | % | -9.5 | % | ||||||||||||||||
| Suzano 2026 – Price | USD/k | 102.482 | 110.632 | 112.023 | 9.3 | % | 1.3 | % | ||||||||||||||||
| Suzano 2026 –Yield | % | 5.345 | 3.947 | 3.663 | -31.5 | % | -7.2 | % | ||||||||||||||||
| Fibria 2027 – Price | USD/k | 101.1 | 107.664 | 109.635 | 8.4 | % | 1.8 | % | ||||||||||||||||
| Fibria 2027 – Yield | % | 5.3 | 4.265 | 3.92 | -26.0 | % | -8.1 | % | ||||||||||||||||
| Suzano 2029 – Price | USD/k | 102.5 | 108.815 | 111.005 | 8.3 | % | 2.0 | % | ||||||||||||||||
| Suzano 2029 –Yield | % | 5.67 | 4.811 | 4.503 | -20.6 | % | -6.4 | % | ||||||||||||||||
| Suzano 2030 – Price | USD/k | - | 102.511 | 102.57 | - | 0.1 | % | |||||||||||||||||
| Suzano 2030 –Yield | % | - | 4.688 | 4.676 | - | -0.3 | % | |||||||||||||||||
| Suzano 2047 – Price | USD/k | 103.045 | 114.679 | 117.657 | 14.2 | % | 2.6 | % | ||||||||||||||||
| Suzano 2047 –Yield | % | 6.756 | 5.912 | 5.713 | -15.4 | % | -3.4 | % | ||||||||||||||||
| Treasury 10 years | % | 2.6842 | 1.6646 | 1.9175 | -28.6 | % | 15.2 | % | ||||||||||||||||
Note: Senior Notes issued with face value of 100 USD/k
RISK RATING
| Agency | National Scale | Global Scale | Outlook | |||||
| Fitch Ratings | AAA | BBB- | Negative | |||||
| Standard & Poor’s | brAAA | BBB- | Negative | |||||
| Moody’s | Aaa.br | Ba1 | Stable |
Page 26 of 36
UPCOMING EVENTS
| Suzano Day | |
| São Paulo (simultaneous translation into English) | New York |
| Date: February 13, 2020 (Thursday) | Date: February 19, 2020 (Wednesday) |
| Hotel Unique | The New York Stock Exchange |
| Av. Brigadeiro Luís Antônio, 4,700 – Sala Tavarua | 2 Broad Street |
The event will feature a slide presentation and be transmitted simultaneously via webcast. The access links will be available on the Company’s Investor Relations website (www.suzano.com.br/ri).
If you are unable to participate, the webcast link will be available for future consultation on the Investor Relations website of Suzano S.A.
IR CONTACTS
Marcelo Bacci
Camila Nogueira
Roberto Costa
Luiz Otávio Souza Fonseca
Camilla Galvão
Tel.: +55 (11) 3503-9330
ri@suzano.com.br
www.suzano.com.br/ri
Page 27 of 36
APPENDICES
APPENDIX 1² – Operating Data
| Revenue breakdown (R$ '000) | 4Q19 | 4Q18 | Δ Y-o-Y | 3Q19 | Δ Q-o-Q | 2019 | 2018 | Δ Y-o-Y | ||||||||||||||||||||||||
| Exports | 5,632,704 | 5,606,756 | 0 | % | 5,277,946 | 7 | % | 20,698,735 | 25,921,843 | -20 | % | |||||||||||||||||||||
| Pulp | 5,229,914 | 5,218,305 | 0 | % | 4,892,173 | 7 | % | 19,193,750 | 24,568,931 | -22 | % | |||||||||||||||||||||
| Paper | 402,790 | 388,451 | 4 | % | 385,774 | 4 | % | 1,504,985 | 1,352,912 | 11 | % | |||||||||||||||||||||
| Domestic Market | 1,416,256 | 1,612,460 | -12 | % | 1,321,963 | 7 | % | 5,314,216 | 5,682,810 | -6 | % | |||||||||||||||||||||
| Pulp | 401,800 | 634,383 | -37 | % | 448,042 | -10 | % | 1,833,936 | 2,381,394 | -23 | % | |||||||||||||||||||||
| Paper | 1,014,455 | 978,077 | 4 | % | 873,921 | 16 | % | 3,480,279 | 3,301,417 | 5 | % | |||||||||||||||||||||
| Total Net Revenue | 7,048,960 | 7,219,216 | -2 | % | 6,599,909 | 7 | % | 26,012,950 | 31,604,653 | -18 | % | |||||||||||||||||||||
| Pulp | 5,631,715 | 5,852,688 | -4 | % | 5,340,214 | 5 | % | 21,027,686 | 26,950,325 | -22 | % | |||||||||||||||||||||
| Paper | 1,417,245 | 1,366,528 | 4 | % | 1,259,695 | 13 | % | 4,985,264 | 4,654,329 | 7 | % |
| Volume de Vendas (em ton) | 4Q19 | 4Q18 | Δ Y-o-Y | 3Q19 | Δ Q-o-Q | 2019 | 2018 | Δ Y-o-Y | ||||||||||||||||||||||||
| Exports | 2,810,848 | 1,946,532 | 44 | % | 2,442,076 | 15 | % | 8,983,742 | 9,385,957 | -4 | % | |||||||||||||||||||||
| Pulp | 2,699,546 | 1,843,511 | 46 | % | 2,340,238 | 15 | % | 8,580,691 | 9,010,354 | -5 | % | |||||||||||||||||||||
| Paper | 111,302 | 103,021 | 8 | % | 101,838 | 9 | % | 403,051 | 375,603 | 7 | % | |||||||||||||||||||||
| Paperboard | 17,915 | 17,380 | 3 | % | 17,673 | 1 | % | 62,219 | 57,585 | 8 | % | |||||||||||||||||||||
| Printing & Writing | 92,640 | 85,641 | 8 | % | 83,712 | 11 | % | 338,562 | 318,018 | 6 | % | |||||||||||||||||||||
| Other paper1 | 748 | - | - | 453 | - | 2,271 | - | - | ||||||||||||||||||||||||
| Domestic Market | 477,322 | 488,367 | -2 | % | 420,143 | 14 | % | 1,684,374 | 1,880,182 | -10 | % | |||||||||||||||||||||
| Pulp | 219,973 | 241,127 | -9 | % | 208,929 | 5 | % | 830,962 | 1,001,850 | -17 | % | |||||||||||||||||||||
| Paper | 257,349 | 247,240 | 4 | % | 211,214 | 22 | % | 853,412 | 878,332 | -3 | % | |||||||||||||||||||||
| Paperboard | 34,996 | 34,129 | 3 | % | 32,173 | 9 | % | 130,210 | 130,844 | 0 | % | |||||||||||||||||||||
| Printing & Writing | 190,773 | 188,857 | 1 | % | 150,248 | 27 | % | 619,802 | 658,324 | -6 | % | |||||||||||||||||||||
| Other paper1 | 31,580 | 127,654 | -75 | % | 28,793 | 10 | % | 103,400 | 89,164 | 16 | % | |||||||||||||||||||||
| Total Sales Volume | 3,288,170 | 2,434,899 | 35 | % | 2,862,219 | 15 | % | 10,668,115 | 11,266,140 | -5 | % | |||||||||||||||||||||
| Pulp | 2,919,519 | 2,084,638 | 40 | % | 2,549,167 | 15 | % | 9,411,653 | 10,012,204 | -6 | % | |||||||||||||||||||||
| Paper | 368,652 | 350,261 | 5 | % | 313,052 | 18 | % | 1,256,463 | 1,253,935 | 0 | % | |||||||||||||||||||||
| Paperboard | 52,911 | 51,509 | 3 | % | 49,846 | 6 | % | 192,428 | 188,429 | 2 | % | |||||||||||||||||||||
| Printing & Writing | 283,413 | 274,498 | 3 | % | 233,960 | 21 | % | 958,363 | 976,342 | -2 | % | |||||||||||||||||||||
| Other paper1 | 32,328 | 127,654 | -75 | % | 29,246 | 11 | % | 105,671 | 89,164 | 19 | % |
| Average net price (R$/ton) | 4Q19 | 4Q18 | Δ Y-o-Y | 3Q19 | Δ Q-o-Q | 2019 | 2018 | Δ Y-o-Y | ||||||||||||||||||||||||
| Exports | 2,004 | 2,880 | -30 | % | 2,161 | -7 | % | 2,304 | 2,762 | -17 | % | |||||||||||||||||||||
| Pulp | 1,937 | 2,831 | -32 | % | 2,090 | -7 | % | 2,237 | 2,727 | -18 | % | |||||||||||||||||||||
| Paper | 3,619 | 3,771 | -4 | % | 3,788 | -4 | % | 3,734 | 3,602 | 4 | % | |||||||||||||||||||||
| Domestic Market | 2,967 | 3,302 | -10 | % | 3,146 | -6 | % | 3,155 | 3,022 | 4 | % | |||||||||||||||||||||
| Pulp | 1,827 | 2,631 | -31 | % | 2,144 | -15 | % | 2,207 | 2,377 | -7 | % | |||||||||||||||||||||
| Paper | 3,942 | 3,956 | 0 | % | 4,138 | -5 | % | 4,078 | 3,759 | 8 | % | |||||||||||||||||||||
| Total | 2,144 | 2,965 | -28 | % | 2,306 | -7 | % | 2,438 | 2,805 | -13 | % | |||||||||||||||||||||
| Pulp | 1,929 | 2,808 | -31 | % | 2,095 | -8 | % | 2,234 | 2,692 | -17 | % | |||||||||||||||||||||
| Paper | 3,844 | 3,901 | -1 | % | 4,024 | -4 | % | 3,968 | 3,712 | 7 | % | |||||||||||||||||||||
Page 28 of 36
| Average net price (US$/ton) | 4Q19 | 4Q18 | Δ Y-o-Y | 3Q19 | Δ Q-o-Q | 2019 | 2018 | Δ Y-o-Y | ||||||||||||||||||||||||
| Exports | 487 | 756 | -36 | % | 544 | -10 | % | 584 | 756 | -23 | % | |||||||||||||||||||||
| Pulp | 471 | 743 | -37 | % | 526 | -10 | % | 567 | 746 | -24 | % | |||||||||||||||||||||
| Paper | 879 | 990 | -11 | % | 953 | -8 | % | 946 | 986 | -4 | % | |||||||||||||||||||||
| Domestic Market | 721 | 867 | -17 | % | 792 | -9 | % | 800 | 827 | -3 | % | |||||||||||||||||||||
| Pulp | 444 | 691 | -36 | % | 540 | -18 | % | 559 | 650 | -14 | % | |||||||||||||||||||||
| Paper | 957 | 1,038 | -8 | % | 1,041 | -8 | % | 1,034 | 1,029 | 1 | % | |||||||||||||||||||||
| Total | 521 | 778 | -33 | % | 580 | -10 | % | 618 | 768 | -20 | % | |||||||||||||||||||||
| Pulp | 469 | 737 | -36 | % | 527 | -11 | % | 566 | 737 | -23 | % | |||||||||||||||||||||
| Paper | 934 | 1,024 | -9 | % | 1,013 | -8 | % | 1,006 | 1,016 | -1 | % | |||||||||||||||||||||
¹ Paper from other manufacturers sold by Suzano and tissue paper.
² Data for the comparison periods of 2018 (4Q18 and 2018) are based on the simple sum or weighted average of Suzano + Fibria.
| FX Rate R$/US$ | 4Q19 | 4Q18 | Δ Y-o-Y | 3Q19 | Δ Q-o-Q | |||||||||||||||
| Closing | 4.03 | 3.87 | 4 | % | 4.16 | -3 | % | |||||||||||||
| Average | 4.12 | 3.81 | 8 | % | 3.97 | 4 | % | |||||||||||||
Page 29 of 36
APPENDIX 2² – Consolidated Statement of Income and Goodwill Amortization
Income Statement (R$ ‘000) | 4Q19 | 4Q18 | Δ Y-o-Y | 3Q19 | Δ Q-o-Q | 2019 | 2018 | Δ Y-o-Y | ||||||||||||||||
| Net Revenue | 7,048,959 | 7,241,895 | -3 | % | 6,599,909 | 7 | % | 26,012,950 | 31,701,815 | -18 | % | |||||||||||||
| Cost of Goods Sold | (5,810,056 | ) | (3,844,991 | ) | 51 | % | (4,986,414 | ) | 17 | % | (20,743,482 | ) | (16,822,773 | ) | 23 | % | ||||||||
| Gross Profit | 1,238,903 | 3,396,904 | -64 | % | 1,613,495 | -23 | % | 5,269,468 | 14,879,042 | -65 | % | |||||||||||||
| Gross Margin | 17.6 | % | 46.9 | % | -29 | p.p. | 24.4 | % | -7 | p.p. | 20.3 | % | 46.9 | % | -27 | p.p. | ||||||||
| Operating Expense/Income | (675,513 | ) | (1,204,835 | ) | -44 | % | (616,180 | ) | 10 | % | (2,640,890 | ) | (3,151,802 | ) | -16 | % | ||||||||
| Selling Expenses | (537,981 | ) | (340,056 | ) | 58 | % | (469,014 | ) | 15 | % | (1,905,279 | ) | (1,411,494 | ) | 35 | % | ||||||||
| General and Administrative Expenses | (285,586 | ) | (399,924 | ) | -29 | % | (278,976 | ) | 2 | % | (1,173,358 | ) | (1,217,312 | ) | -4 | % | ||||||||
| Other Operating Income (Expenses) | 137,307 | (468,562 | ) | -129 | % | 116,132 | 18 | % | 405,754 | (531,254 | ) | -176 | % | |||||||||||
| Equity Equivalence | 10,746 | 3,707 | 190 | % | 15,678 | -31 | % | 31,993 | 8,258 | 287 | % | |||||||||||||
| EBIT | 563,390 | 2,192,069 | -74 | % | 997,315 | -44 | % | 2,628,578 | 11,727,256 | -78 | % | |||||||||||||
| Depreciation, Amortization & Depletion | 1,778,852 | 945,450 | 88 | % | 1,514,089 | 17 | % | 8,091,931 | 4,199,898 | 93 | % | |||||||||||||
| EBITDA | 2,342,242 | 3,137,519 | -25 | % | 2,511,404 | -7 | % | 10,720,509 | 15,927,154 | -33 | % | |||||||||||||
| EBITDA Margin (%) | 33.2 | % | 43.3 | % | -10 | p.p. | 38.1 | % | -5 | p.p. | 41.2 | % | 50.2 | % | -9 | p.p. | ||||||||
| Adjusted EBITDA1 | 2,465,382 | 3,550,406 | -31 | % | 2,396,426 | 3 | % | 10,723,569 | 16,361,470 | -34 | % | |||||||||||||
| Adjusted EBITDA Margin1 | 35.0 | % | 49.0 | % | -14 | p.p. | 36.3 | % | -1 | p.p. | 41.2 | % | 51.6 | % | -10 | p.p. | ||||||||
| Net Financial Result | 1,624,575 | 1,679,457 | -3 | % | (6,493,278 | ) | -125 | % | (6,725,781 | ) | (7,748,156 | ) | -13 | % | ||||||||||
| Financial Expenses | 86,174 | 359,252 | -76 | % | 108,143 | -20 | % | 493,246 | 824,950 | -40 | % | |||||||||||||
| Financial Revenues | (1,041,368 | ) | (860,202 | ) | 21 | % | (1,058,484 | ) | -2 | % | (4,178,848 | ) | (2,940,428 | ) | 42 | % | ||||||||
| Exchange Rate Variation | 1,418,117 | 635,064 | 123 | % | (3,685,540 | ) | -138 | % | (1,964,927 | ) | (2,462,147 | ) | -20 | % | ||||||||||
| Net Proceeds Generated by Derivatives | 1,161,652 | 1,545,343 | -25 | % | (1,857,397 | ) | -163 | % | (1,075,252 | ) | (3,170,531 | ) | -66 | % | ||||||||||
| Earnings Before Taxes | 2,187,965 | 3,871,526 | -43 | % | (5,495,963 | ) | -140 | % | (4,097,203 | ) | 3,979,099 | -203 | % | |||||||||||
| Income and Social Contribution Taxes | (1,013,188 | ) | (884,259 | ) | 15 | % | 2,035,728 | -150 | % | 1,282,461 | (600,680 | ) | -314 | % | ||||||||||
| Net Income (Loss) | 1,174,777 | 2,987,267 | -61 | % | (3,460,235 | ) | -134 | % | (2,814,742 | ) | 3,378,420 | -183 | % | |||||||||||
| Net Margin | 16.7 | % | 41.2 | % | -25 | p.p. | -52.4 | % | 69 | p.p. | -10.8 | % | 10.7 | % | -21 | p.p. |
¹ Excluding non-recurring items.
² Data for the comparison periods of 2018 (4Q18 and 2018) are based on the simple sum or weighted average of Suzano + Fibria.
| Goodwill amortization - PPA (R$ ‘000) | 4Q19 | 4Q18 | Δ Y-o-Y | 3Q19 | Δ Q-o-Q | |||||||||||||||
| COGS | (138,646 | ) | - | - | (180,036 | ) | - | |||||||||||||
| Selling Expenses | (206,700 | ) | - | - | (206,700 | ) | - | |||||||||||||
| General and administrative expenses | 21,436 | - | - | 794 | - | |||||||||||||||
| Other operational revenues (expenses) | (121 | ) | - | - | (6,820 | ) | - | |||||||||||||
| Financial results | (108,357 | ) | - | - | (31,143 | ) | - |
Page 30 of 36
APPENDIX 3¹ – Consolidated Balance Sheet
| Assets (R$ ´000) | 12/31/2019 | 09/30/2019 | 12/31/2018 | |||||||||
| Current Assets | ||||||||||||
| Cash and cash equivalents | 3,249,127 | 3,714,646 | 6,181,900 | |||||||||
| Financial investments | 6,150,631 | 4,897,585 | 25,414,992 | |||||||||
| Trade accounts receivable | 3,035,817 | 2,058,731 | 3,862,323 | |||||||||
| Inventories | 4,685,595 | 6,258,364 | 5,861,406 | |||||||||
| Recoverable taxes | 997,201 | 1,235,668 | 557,832 | |||||||||
| Derivative financial instruments | 260,273 | 239,161 | 210,852 | |||||||||
| Other assets | 505,593 | 417,223 | 837,426 | |||||||||
| Total Current Assets | 18,884,237 | 18,821,378 | 42,926,731 | |||||||||
| Non-Current Assets | ||||||||||||
| Recoverable taxes | 708,914 | 557,373 | 2,044,730 | |||||||||
| Financial investments | 179,703 | 177,453 | 172,891 | |||||||||
| Derivative financial instruments | 838,699 | 677,305 | 455,325 | |||||||||
| Biological assets | 10,571,499 | 10,280,967 | 9,515,526 | |||||||||
| Investments | 322,446 | 279,263 | 214,381 | |||||||||
| Property, plant and equipment | 41,120,945 | 41,500,872 | 32,620,900 | |||||||||
| Right of use | 3,850,237 | 4,359,907 | ||||||||||
| Intangible | 17,712,803 | 17,968,738 | 4,879,131 | |||||||||
| Other assets | 3,718,742 | 4,723,820 | 1,922,484 | |||||||||
| Total Non-Current Assets | 79,023,988 | 80,525,698 | 51,825,368 | |||||||||
| Total Assets | 97,908,225 | 99,347,076 | 94,824,099 | |||||||||
| Liabilities and Equity (R$ ´000) | 12/31/2019 | 09/30/2019 | 12/31/2018 | |||||||||
| Current Liabilities | ||||||||||||
| Trade accounts payable | 2,376,459 | 3,325,724 | 4,166,503 | |||||||||
| Loans, financing and debentures | 6,227,951 | 5,091,236 | 6,503,325 | |||||||||
| Lease liabilities | 656,844 | 587,910 | - | |||||||||
| Derivative financial instruments | 893,413 | 1,111,477 | 276,407 | |||||||||
| Taxes payable | 307,639 | 212,378 | 372,994 | |||||||||
| Payroll and charges | 400,435 | 439,615 | 635,751 | |||||||||
| Liabilities for assets acquisitions and subsidiaries | 94,414 | 92,098 | 2,402,700 | |||||||||
| Dividends payable | 5,720 | 9,904 | - | |||||||||
| Other liabilities | 516,320 | 310,540 | - | |||||||||
| Total Current Liabilities | 11,479,195 | 11,180,882 | 14,357,680 | |||||||||
| Non-Current Liabilities | ||||||||||||
| Loans, financing and debentures | 57,456,375 | 58,929,307 | 50,028,056 | |||||||||
| Lease liabilities | 3,327,226 | 3,946,474 | - | |||||||||
| Liabilities for assets acquisitions and subsidiaries | 447,201 | 463,835 | - | |||||||||
| Provision for judicial liabilities | 3,512,477 | 3,495,447 | - | |||||||||
| Derivative financial instruments | 2,024,500 | 2,865,034 | 1,040,000 | |||||||||
| Other liabilities | 1,573,282 | 1,429,838 | 3,077,519 | |||||||||
| Total Non-Current Liabilities | 68,341,061 | 71,129,935 | 54,145,575 | |||||||||
| Shareholders’ Equity | ||||||||||||
| Share capital | 9,235,546 | 9,235,546 | 15,971,006 | |||||||||
| Capital reserves | 6,416,864 | 6,419,941 | 688,190 | |||||||||
| Treasury shares | (218,265 | ) | (218,265 | ) | (218,000 | ) | ||||||
| Retained earnings | 317,144 | 3,081,740 | 3,604,126 | |||||||||
| Other reserves | 2,221,341 | 2,348,132 | 6,115,681 | |||||||||
| Accumulated losses | - | (3,947,403 | ) | - | ||||||||
| Total Equity | 17,972,630 | 16,919,691 | 26,161,003 | |||||||||
| Non-controlling shareholders interests | 115,339 | 116,568 | 87,841 | |||||||||
| Total Liabilities and Equity | 97,908,225 | 99,347,076 | 94,752,099 | |||||||||
¹ Data for the comparison periods of 2018 (4Q18 and 2018) are based on the simple sum or weighted average of Suzano + Fibria.
Page 31 of 36
APPENDIX 4¹ – Consolidated Statement of Cash Flow
| Cash Flow (R$ ‘000) | 4Q19 | 4Q18 | 2019 | 2018 | ||||||||||||
| Cash flow from operating activities | ||||||||||||||||
| Net income/(loss) for the period | 1,174,776 | 2,986,928 | (2,814,742 | ) | 3,378,081 | |||||||||||
| Depreciation, depletion and amortization | 1,407,547 | 945,449 | 4,286,730 | 4,199,896 | ||||||||||||
| Amortization of fair value adjustment on business combination with Fibria/Facepa/Ibema | 324,031 | - | 3,651,005 | - | ||||||||||||
| Amortization of fair value adjustment on business combination with Fibria classified at financial result | 30,437 | - | (38,960 | ) | - | |||||||||||
| Amortization of right of use | 47,292 | - | 154,217 | - | ||||||||||||
| Interest expense on lease liabilities | 73,042 | - | 226,103 | - | ||||||||||||
| Results from sale and disposals of property, plant and equipment and biological assets, net | 51,649 | 68,988 | 77,930 | 103,912 | ||||||||||||
| Equity equivalence | (10,746 | ) | (3,580 | ) | (31,993 | ) | (8,144 | ) | ||||||||
| Provision for loss and write-off of fixed assets and biological assets | - | 2,600 | - | 18,103 | ||||||||||||
| Exchange rate and monetary variations, net | (1,418,127 | ) | (489,252 | ) | 1,964,927 | 3,190,711 | ||||||||||
| Interest expenses with financing and loans, debentures and debentures, net | 830,503 | 495,326 | 3,358,806 | 1,691,222 | ||||||||||||
| Accrual of interest on financial investments | 258,935 | - | (31,368 | ) | - | |||||||||||
| Amortization of fundraising costs | 13,004 | - | 185,807 | - | ||||||||||||
| Deferred income tax and social contribution expenses | 989,070 | 717,838 | (1,528,571 | ) | 14,113 | |||||||||||
| Tax credits - gains in tax lawsuits (ICMS from the PIS/COFINS calculation basis) | - | - | (128,115 | ) | - | |||||||||||
| Fair value adjustment of biological assets | (101,946 | ) | 198,070 | (185,399 | ) | 102,409 | ||||||||||
| Interest on employee benefits | 5,734 | 10,069 | 44,496 | 35,920 | ||||||||||||
| Provision/ (Reversal) for judicial liabilities | 48,665 | 4,295 | 26,807 | 13,285 | ||||||||||||
| Provision for stock-based compensation plan | - | 13,830 | - | 131,610 | ||||||||||||
| Derivative (gains) losses, net | (1,161,652 | ) | (1,545,020 | ) | 1,075,252 | 2,822,289 | ||||||||||
| Expected credit losses, net | 2,078 | 17 | (12,286 | ) | 6,450 | |||||||||||
| Reversal for rebates | - | (1,297 | ) | - | 27,681 | |||||||||||
| Estimated loss in inventories | 76,479 | (11,420 | ) | 107,269 | (34,560 | ) | ||||||||||
| Provision for loss of ICMS credits, net | 41,787 | 34,587 | 129,283 | 109,215 | ||||||||||||
| Other | (49,656 | ) | (70,538 | ) | (56,517 | ) | 122,127 | |||||||||
| Decrease (increase) in assets | 117,802 | 622,964 | 2,080,352 | (1,812,766 | ) | |||||||||||
| Trade accounts receivable | (1,023,818 | ) | 935,431 | 991,476 | (166,867 | ) | ||||||||||
| Inventories | 1,217,349 | (1,138,897 | ) | 873,420 | (2,122,792 | ) | ||||||||||
| Recoverable taxes | 104,148 | 780,753 | 241,934 | 615,125 | ||||||||||||
| Other assets | (179,877 | ) | 45,677 | (26,478 | ) | (138,232 | ) | |||||||||
| Increase (decrease) in liabilities | (388,503 | ) | (411,127 | ) | (1,482,016 | ) | 278,776 | |||||||||
| Payroll and charges | (38,902 | ) | - | (234,948 | ) | - | ||||||||||
| Trade accounts payables | (829,169 | ) | 211,943 | (1,555,697 | ) | 168,546 | ||||||||||
| Taxes payable | 107,261 | (1,038,579 | ) | 370,923 | (311,638 | ) | ||||||||||
| Other liabilities | 372,307 | 415,509 | (62,294 | ) | 421,868 | |||||||||||
| Cash provided by operations | 2,362,201 | 3,568,727 | 11,059,017 | 14,390,330 | ||||||||||||
| Payment of interest with financing and loans and debentures | (615,626 | ) | (434,144 | ) | (2,977,957 | ) | (1,942,100 | ) | ||||||||
| Interest received from financial investments | (467,434 | ) | 72,263 | (112,898 | ) | 193,719 | ||||||||||
| Payment of other taxes | - | 254,202 | - | (135,265 | ) | |||||||||||
| Payment of income taxes | (55,245 | ) | (87,572 | ) | (391,725 | ) | (395,069 | ) | ||||||||
| Payment of actuarial liabilities | (26,061 | ) | (26,061 | ) | ||||||||||||
| Contigency payment | (41,013 | ) | (41,013 | ) | ||||||||||||
| Net cash from operating activities | 1,223,896 | 3,306,402 | 7,576,437 | 12,044,541 | ||||||||||||
| Cash flow from investing activities | ||||||||||||||||
| Financial investments | (1,049,228 | ) | (10,488,918 | ) | 19,378,893 | (21,014,932 | ) | |||||||||
| Cash provided by the merger of subsidiary | (21,431 | ) | ||||||||||||||
| Settlement of derivative operations | - | (10,151 | ) | - | (216,377 | ) | ||||||||||
| Increase of capital in subsidiaries and associates | - | 2,676 | (45,856 | ) | (313,228 | ) | ||||||||||
| Advance for acquisition of wood from operations with development | (61,285 | ) | - | (355,447 | ) | - | ||||||||||
| Acquisition of subsidiaries, net cash | - | - | (26,002,540 | ) | - | |||||||||||
| Additions to property, plant and equipment | (1,124,275 | ) | (1,831,781 | ) | (4,868,427 | ) | (6,339,674 | ) | ||||||||
| Proceeds from sale of assets | 44,905 | 53,613 | 198,644 | 108,036 | ||||||||||||
| Other investments | (21 | ) | - | (286 | ) | - | ||||||||||
| Net cash (used in) / provided by investment activities | (2,189,904 | ) | (12,295,992 | ) | (11,695,019 | ) | (27,776,175 | ) | ||||||||
| Financing activities | ||||||||||||||||
| Proceeds from loans, financing and debentures | 2,677,927 | 12,624,694 | 18,993,837 | 26,989,575 | ||||||||||||
| Loans raised - IFRS 16 | - | - | - | - | ||||||||||||
| Payment of derivative transactions | (79,452 | ) | (323,365 | ) | (135,449 | ) | (1,586,415 | ) | ||||||||
| Payment of loans, financing, debentures | (1,745,186 | ) | (770,365 | ) | (13,994,708 | ) | (5,660,487 | ) | ||||||||
| Payment of leases | (219,774 | ) | - | (645,071 | ) | - | ||||||||||
| Payment of dividends | (4,897 | ) | (2,785,603 | ) | (606,632 | ) | (3,255,812 | ) | ||||||||
| Others financing | 5,616 | (2,139 | ) | 10,191 | 3,597 | |||||||||||
| Proceeds from own shares | (879 | ) | (879 | ) | 8,514 | |||||||||||
| Acquisition of own shares | - | 9,051 | - | 10,781 | ||||||||||||
| Liabilities for assets acquisitions and subsidiaries | (9,084 | ) | (13,424 | ) | (479,480 | ) | (84,090 | ) | ||||||||
| Cash provided by financing activities | 624,271 | 8,738,849 | 3,141,809 | 16,425,663 | ||||||||||||
| Exchange variation on cash and cash equivalents | (123,782 | ) | (218,492 | ) | (161,553 | ) | 359,774 | |||||||||
| Increase (reduction) in cash and cash equivalents | (465,519 | ) | (469,233 | ) | (1,138,326 | ) | 1,053,803 | |||||||||
| Cash and cash equivalents at the beginning for the period | 3,714,646 | 4,945,824 | 4,387,453 | 5,128,550 | ||||||||||||
| Cash and cash equivalents at the end for the period | 3,249,127 | 4,476,591 | 3,249,127 | 6,182,353 | ||||||||||||
| Statement of increase (reduction) in cash and cash equivalents | (465,519 | ) | (469,233 | ) | (1,138,326 | ) | 1,053,803 | |||||||||
¹ Data for the comparison periods of 2018 (4Q18 and 2018) are based on the simple sum or weighted average of Suzano + Fibria.
Page 32 of 36
APPENDIX 5² – EBITDA
| (R$ '000, except where otherwise indicated) | 4Q19 | 4Q18 | 2019 | 2018 | ||||||||||||
| Net Income | 1,174,777 | 2,986,928 | (2,814,742 | ) | 3,378,081 | |||||||||||
| Net Financial Result | 1,624,575 | 1,679,457 | (6,725,781 | ) | (7,748,156 | ) | ||||||||||
| Income and Social Contribution Taxes | (1,013,188 | ) | (208,749 | ) | 1,282,461 | 3,589,703 | ||||||||||
| EBIT | 563,390 | 2,191,940 | 2,628,578 | 11,727,127 | ||||||||||||
| Depreciation, Amortization and Depletion | 1,778,852 | 945,450 | 8,091,931 | 4,199,899 | ||||||||||||
| EBITDA1 | 2,342,242 | 3,137,390 | 10,720,509 | 15,927,026 | ||||||||||||
| EBITDA Margin | 33 | % | 43 | % | 41 | % | 50 | % | ||||||||
| Expenses with Fibria's transaction | 3,924 | 88,804 | 79,870 | 126,550 | ||||||||||||
| Indemnity – FACEPA | 840 | - | 4,123 | - | ||||||||||||
| Accruals for losses on ICMS credits | 97,061 | 34,587 | 181,117 | 109,214 | ||||||||||||
| Property, Plant and Equipment disposal | 996 | 75,446 | 996 | 108,425 | ||||||||||||
| Contract renegotiation | 45,723 | - | 45,723 | - | ||||||||||||
| Losango Project Adjustments | 57,764 | - | 57,764 | - | ||||||||||||
| Fair value adjustment (others) | (32,705 | ) | - | (32,705 | ) | - | ||||||||||
| Losses for PIS/COFINS provision | 21,132 | - | 21,132 | - | ||||||||||||
| Labor lawsuits provision | 32,178 | - | 32,178 | - | ||||||||||||
| Equity equivalence | (10,746 | ) | (3,578 | ) | (31,993 | ) | (8,145 | ) | ||||||||
| Adjustment of the fair value of biological assets | (101,946 | ) | 198,070 | (185,399 | ) | 102,409 | ||||||||||
| Sale of judicial credits | 390 | - | (86,610 | ) | - | |||||||||||
| PPA effect (Asset disposal) | 9,123 | - | 33,991 | - | ||||||||||||
| Fiscal credits (PIS/COFINS calculation base) | - | - | (128,115 | ) | - | |||||||||||
| Sprout cancellation | - | - | - | 7,366 | ||||||||||||
| Write downs of inventories | - | 6,969 | - | 24,062 | ||||||||||||
| PIS/COFINS revision | - | - | - | 3,729 | ||||||||||||
| Valmet agreement | - | - | - | (52,780 | ) | |||||||||||
| Others | (595 | ) | 12,323 | 10,989 | 12,652 | |||||||||||
| Adjusted EBITDA | 2,465,381 | 3,550,011 | 10,723,569 | 16,360,507 | ||||||||||||
| Adjusted EBITDA Margin | 35 | % | 49 | % | 41 | % | 52 | % |
¹ The Company's EBITDA is calculated in accordance with CVM Instruction 527 of October 4, 2012,
² Data for the comparison periods of 2018 (4Q18 and 2018) are based on the simple sum or weighted average of Suzano + Fibria,
Page 33 of 36
APPENDIX 6² – Segmented Statement of Income
| 4Q19 | 4Q18 | |||||||||||||||||||||||||||||||
| Segmented Financial Statement (R$ '000) | Pulp | Paper | Non Segmented | Total Consolidated | Pulp | Paper | Non Segmented | Total Consolidated | ||||||||||||||||||||||||
| Net Revenue | 5,631,714 | 1,417,245 | - | 7,048,959 | 5,875,366 | 1,366,528 | - | 7,241,895 | ||||||||||||||||||||||||
| Cost of Goods Sold | (4,859,010 | ) | (951,046 | ) | - | (5,810,056 | ) | (3,020,350 | ) | (824,641 | ) | - | (3,844,991 | ) | ||||||||||||||||||
| Gross Profit | 772,704 | 466,199 | - | 1,238,903 | 2,855,016 | 541,887 | - | 3,396,904 | ||||||||||||||||||||||||
| Gross Margin | 13.7 | % | 32.9 | % | 17.6 | % | 48.6 | % | 39.7 | % | 46.9 | % | ||||||||||||||||||||
| Operating Expense/Income | (557,552 | ) | (117,961 | ) | - | (675,513 | ) | (955,105 | ) | (249,858 | ) | - | (1,204,964 | ) | ||||||||||||||||||
| Selling Expenses | (419,438 | ) | (118,543 | ) | - | (537,981 | ) | (229,197 | ) | (110,859 | ) | - | (340,056 | ) | ||||||||||||||||||
| General and Administrative Expenses | (200,354 | ) | (85,231 | ) | - | (285,586 | ) | (217,063 | ) | (182,860 | ) | - | (399,924 | ) | ||||||||||||||||||
| Other Operating Income (Expenses) | 56,355 | 80,952 | 137,307 | (508,716 | ) | 40,154 | - | (468,562 | ) | |||||||||||||||||||||||
| Equity Equivalence | 5,885 | 4,861 | - | 10,746 | (129 | ) | 3,707 | - | 3,578 | |||||||||||||||||||||||
| EBIT | 215,152 | 348,238 | - | 563,390 | 1,899,911 | 292,029 | - | 2,191,940 | ||||||||||||||||||||||||
| Depreciation, Amortization & Depletion | 1,639,056 | 139,797 | - | 1,778,852 | 832,701 | 112,749 | - | 945,450 | ||||||||||||||||||||||||
| EBITDA | 1,854,208 | 488,034 | - | 2,342,242 | 2,732,612 | 401,071 | - | 3,133,683 | ||||||||||||||||||||||||
| EBITDA Margin (%) | 32.9 | % | 34.4 | % | - | 33.2 | % | 46.5 | % | 29.3 | % | 43.3 | % | |||||||||||||||||||
| Adjusted EBITDA1 | 2,041,559 | 423,824 | - | 2,465,382 | 3,119,484 | 430,526 | - | 3,550,010 | ||||||||||||||||||||||||
| Adjusted EBITDA Margin1 | 36.3 | % | 29.9 | % | 34.8 | % | 53.1 | % | 31.5 | % | 49.0 | % | ||||||||||||||||||||
| Net Financial Result | - | - | 1,624,575 | 1,624,575 | 431,790 | - | 1,247,457 | 1,679,247 | ||||||||||||||||||||||||
| Earnings Before Taxes | 215,152 | 348,238 | 1,624,575 | 2,187,965 | 2,331,701 | 292,029 | 1,247,457 | 3,871,187 | ||||||||||||||||||||||||
| Income and Social Contribution Taxes | - | - | (1,013,188 | ) | (1,013,188 | ) | 544,335 | - | (753,084 | ) | (208,749 | ) | ||||||||||||||||||||
| Net Income (Loss) | 215,152 | 348,238 | 611,387 | 1,174,777 | 2,200,526 | 292,029 | 494,373 | 2,986,928 | ||||||||||||||||||||||||
| Net Margin | 3.8 | % | 24.6 | % | 0.0 | % | 16.7 | % | 37.5 | % | 21.4 | % | 0.0 | % | 41.2 | % | ||||||||||||||||
¹ Excluding non-recurring items,
² Data for the comparison periods of 2018 (4Q18 and 2018) are based on the simple sum or weighted average of Suzano + Fibria,
Page 34 of 36
| 2019 | 2018 | |||||||||||||||||||||||||||||||
| Segmented Financial Statement (R$ '000) | Pulp | Paper | Non Segmented | Total Consolidated | Pulp | Paper | Non Segmented | Total Consolidated | ||||||||||||||||||||||||
| Net Revenue | 21,027,686 | 4,985,264 | - | 26,012,950 | 27,047,484 | 4,654,329 | - | 31,701,813 | ||||||||||||||||||||||||
| Cost of Goods Sold | (17,440,018 | ) | (3,303,464 | ) | - | (20,743,482 | ) | (13,870,169 | ) | (2,952,603 | ) | - | (16,822,772 | ) | ||||||||||||||||||
| Gross Profit | 3,587,668 | 1,681,800 | - | 5,269,468 | 13,177,316 | 1,701,726 | - | 14,879,042 | ||||||||||||||||||||||||
| Gross Margin | 17.1 | % | 33.7 | % | 20.3 | % | 48.7 | % | 36.6 | % | 46.9 | % | ||||||||||||||||||||
| Operating Expense/Income | (2,089,286 | ) | (679,719 | ) | 128,115 | (2,640,890 | ) | (2,265,565 | ) | (886,350 | ) | - | (5,569,154 | ) | ||||||||||||||||||
| Selling Expenses | (1,503,775 | ) | (401,504 | ) | - | (1,905,279 | ) | (2,529,815 | ) | (1,298,918 | ) | - | (3,828,733 | ) | ||||||||||||||||||
| General and Administrative Expenses | (806,774 | ) | (366,584 | ) | - | (1,173,358 | ) | (667,961 | ) | (549,351 | ) | - | (1,217,312 | ) | ||||||||||||||||||
| Other Operating Income (Expenses) | 209,577 | 68,062 | 128,115 | 405,754 | (572,535 | ) | 41,282 | - | (531,253 | ) | ||||||||||||||||||||||
| Equity Equivalence | 11,686 | 20,307 | - | 31,993 | 569 | 7,576 | - | 8,145 | ||||||||||||||||||||||||
| EBIT | 1,498,382 | 1,002,081 | 128,115 | 2,628,578 | 10,911,751 | 815,376 | - | 11,727,127 | ||||||||||||||||||||||||
| Depreciation, Amortization & Depletion | 7,575,630 | 516,301 | - | 8,091,931 | 3,742,056 | 457,844 | - | 4,199,899 | ||||||||||||||||||||||||
| EBITDA | 9,074,013 | 1,518,381 | 128,115 | 10,720,509 | 14,653,806 | 1,265,644 | - | 15,919,450 | ||||||||||||||||||||||||
| EBITDA Margin (%) | 43.2 | % | 30.5 | % | - | 41.2 | % | 54.2 | % | 27.2 | % | 50.2 | % | |||||||||||||||||||
| Adjusted EBITDA1 | 9,258,796 | 1,464,372 | - | 10,723,569 | 15,026,861 | 1,333,646 | - | 16,360,507 | ||||||||||||||||||||||||
| Adjusted EBITDA Margin1 | 44.0 | % | 29.4 | % | - | 41.1 | % | 55.6 | % | 28.7 | % | - | 51.6 | % | ||||||||||||||||||
| Net Financial Result | - | - | (6,725,781 | ) | (6,725,781 | ) | (2,905,853 | ) | - | (4,842,513 | ) | (7,748,366 | ) | |||||||||||||||||||
| Earnings Before Taxes | 1,498,383 | 1,002,080 | (6,597,666 | ) | (4,097,203 | ) | 8,005,898 | 815,376 | (4,842,513 | ) | 3,978,761 | |||||||||||||||||||||
| Income and Social Contribution Taxes | - | - | 1,282,461 | 1,282,461 | 3,434,489 | - | 155,214 | 3,589,703 | ||||||||||||||||||||||||
| Net Income (Loss) | 1,498,383 | 1,002,080 | (5,315,205 | ) | (2,814,742 | ) | 7,250,004 | 815,376 | (4,687,299 | ) | 3,378,081 | |||||||||||||||||||||
| Net Margin | 7.1 | % | 20.1 | % | -10.8 | % | 26.8 | % | 17.5 | % | 0.0 | % | 10.7 | % | ||||||||||||||||||
¹ Excluding non-recurring items,
² Data for the comparison periods of 2018 (4Q18 and 2018) are based on the simple sum or weighted average of Suzano + Fibria,
Page 35 of 36
Forward-looking Statements
This release may contain forward-looking statements, Such statements are subject to known and unknown risks and uncertainties that could cause the expectations expressed not to materialize or to differ substantially from the expected results, These risks include changes in future demand for the Company’s products, changes in factors affecting domestic and international product prices, changes in the cost structure, changes in the seasonal patterns of markets, changes in prices charged by competitors, foreign exchange variations, changes in the political or economic situation of Brazil, and changes in emerging and international markets, The forward-looking statements were not reviewed by our independent auditors,
Page 36 of 36