Exhibit 99.1

Day 2020
Disclaimer This communication contains certain statements that are “forward-looking statements” within the meaning of Section 27A of the Securities Act and Section 21E of the Securities Exchange Act of 1934, as amended. Some of these forward-looking statements are identified with words like “believe,” “may,” “could,” “would,” “might,” “possible,” “will,” “should,” “expect,” “intend,” “plan,” “anticipate,” “estimate”, “potential”, “outlook” or “continue,” the negative of these words, other terms of similar meaning or the use of future dates. Forward-looking statements in this communication include, without limitation, statements regarding the implementation of operating and financing strategies and initiatives, including with respect to the integration of Fibria’s operations and expected potential synergies, plans with respect to capital expenditures, and factors or trends affecting financial condition, liquidity or results of operations. Such statements reflect the current views of management and are subject to a number of risks and uncertainties, including changes in prices and customer demand for our products, changes in raw material costs, pricing actions by competitors, changes in the rates of exchange of the Brazilian real against the US dollar, and general changes in the economic environment in Brazil, emerging markets or internationally. Such forward-looking statements are qualified by the inherent risks and uncertainties surrounding future expectations generally, and actual results could differ materially from those currently anticipated due to such risks and uncertainties. There is no guarantee that the expected events, trends or results will actually occur. The statements information, opinions and forward-looking statements contained in this presentation speak only as at the date of this presentation and should thus be considered in the context of the circumstances prevailing at the time. They are based on many assumptions and factors, including general economic and market conditions, industry conditions, and operating factors, and are subject to change without notice. Any changes in such assumptions or factors could cause actual results to differ materially from current expectations. Suzano does not undertake any obligation to update any information, opinion or forward-looking statements as a result of new information, future developments or otherwise, except as expressly required by law. All information, opinions and forward-looking statements in this communication are qualified in their entirety by this cautionary statement.
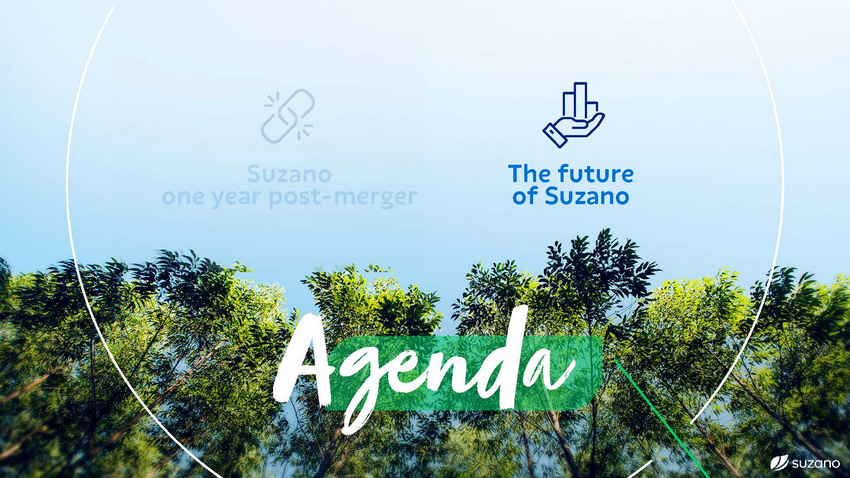
Suzano one year post-merger The future of Suzano
Suzano one year post-merger The future of Suzano
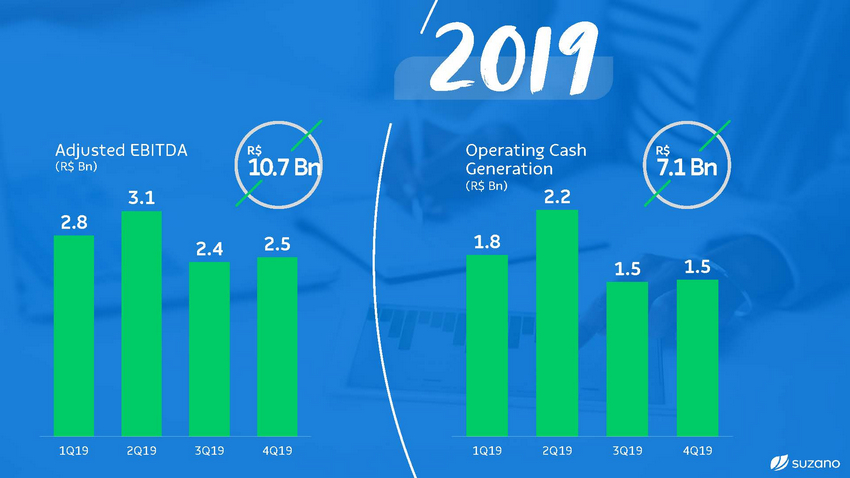
2019 Adjusted EBITDA (R$ Bn) Operating Cash Generation R$ 10.7 Bn R$ 7.1 Bn (R$ Bn) 2.2 3.1 2.8 1.8 2.5 2.4 1.5 1.5 1Q19 2Q19 3Q19 4Q19 1Q19 2Q19 3Q19 4Q19
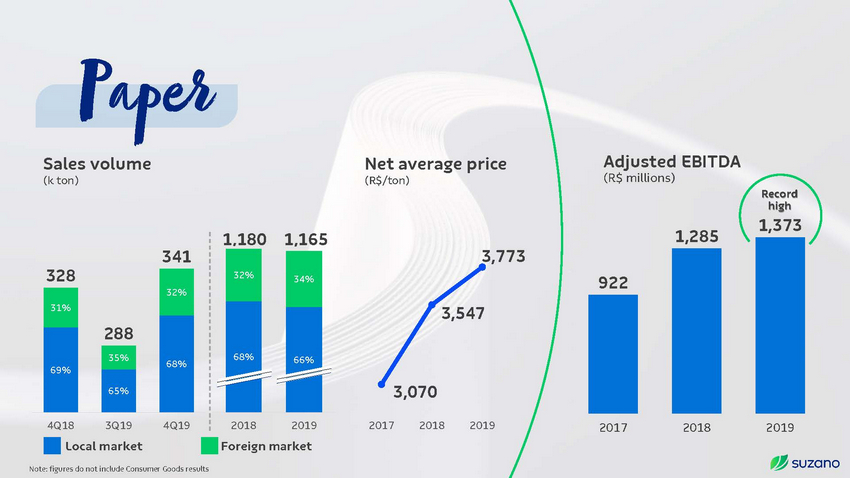
Paper Adjusted EBITDA (R$ millions) Sales volume (k ton) Net average price (R$/ton) Record high 1,373 4100 1,500 1,285 1,180 1,165 3900 1.2 1,300 3,773 100 1,100 922 3700 80 900 3,547 3500 700 60 3300 500 40 300 3100 20 3,070 100 0 0 2900 4Q18 3Q19 4Q19 2018 2019 2017 2018 2019 2017 2018 2019 (100) Local market Foreign market Note: figures do not include Consumer Goods results 341 32% 34% 328 32% 1 0.8 0.6 0.4 0.2 31% 288 68% 66% 68% 69% 35% 65%
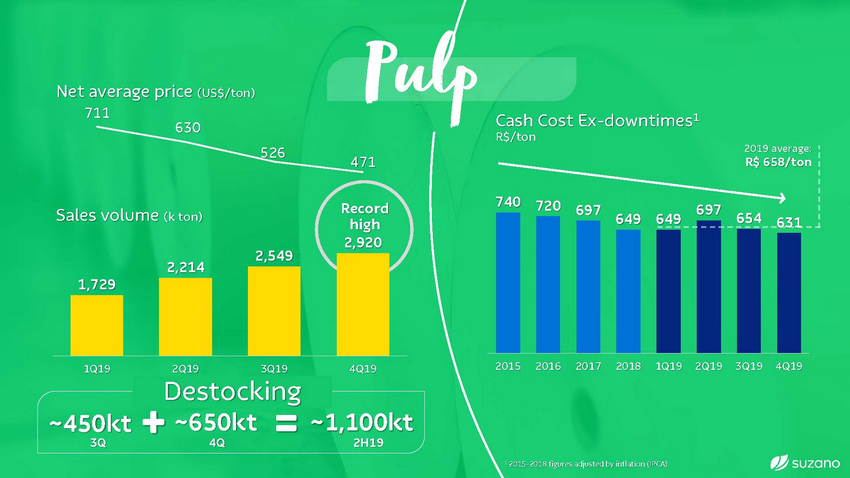
Pulp Net average price (US$/ton) 711 Cash Cost Ex-downtimes1 2019 average: on 526 Record high 697 697 Sales volume (k ton) 654 649 649 631 2,920 2,214 2017 2018 1Q19 2Q19 3Q19 4Q19 1Q19 2Q19 3Q19 4Q19 adjusted by inflation (IPCA) Destocking 2,549 1,729
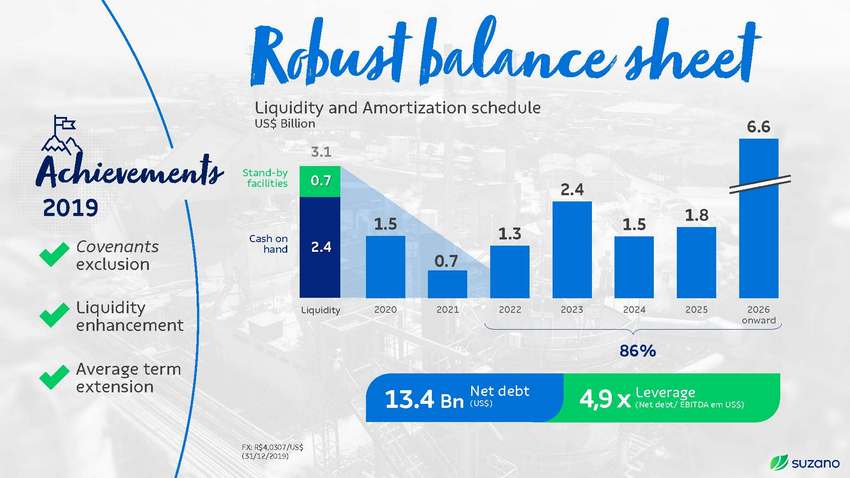
Robust balance 6.6 Liquidity and Amortization schedule Achievemenstsheet US$ Billion 3.1 Stand-by facilities 2.4 2019 Covenants exclusion 1.8 1.5 1.5 1.3 Cash on hand 0.7 0 Liquidity enhancement 2020 2021 2022 2023 2024 2025 2026 onward Liquidity 86% Average term extension Net debt (US$) 4,9 x Leverage (Net debt/ EBITDA em US$) 13.4 Bn FX: R$4,0307/US$ (31/12/2019) 0.7 2.4
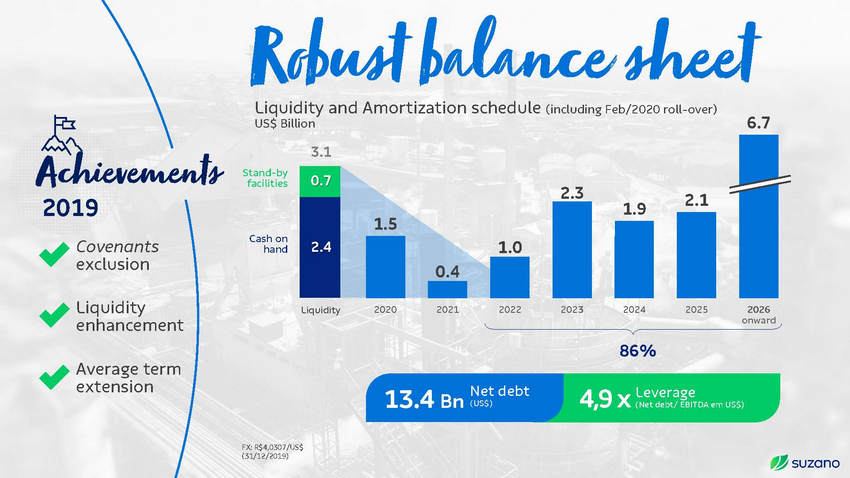
Robust balance Liquidity and Amortization schedule (including Feb/2020 roll-over) Achievemenstsheet 6.67 US$ Billion 3.1 Stand-by facilities 2.4 2.3 2.1 2019 Covenants exclusion 1.9 1.5 1.3 1.0 Cash on hand 0.7 0.4 00 Liquidity enhancement 2020 2021 2022 2023 2024 2025 2026 onward Liquidity 86% Average term extension Net debt (US$) 4,9 x Leverage (Net debt/ EBITDA em US$) 13.4 Bn FX: R$4,0307/US$ (31/12/2019) 1.5 1.8 0.7 2.4

Planned Executed Capex limited to sustaining and commitments already made 2019: R$ 5.78 Bn (below original guidance) 2020: R$ 4.44 Bn Monetization of excesso inventories of ~US$ 500 Millions 1.1 M tons inventory reduction in 2H19 Non-core assets sale Sale of R$ 0.4 Bi in forests Financia lDisciplin Sinergias capture: 90% in 2020 Acelleration of capture
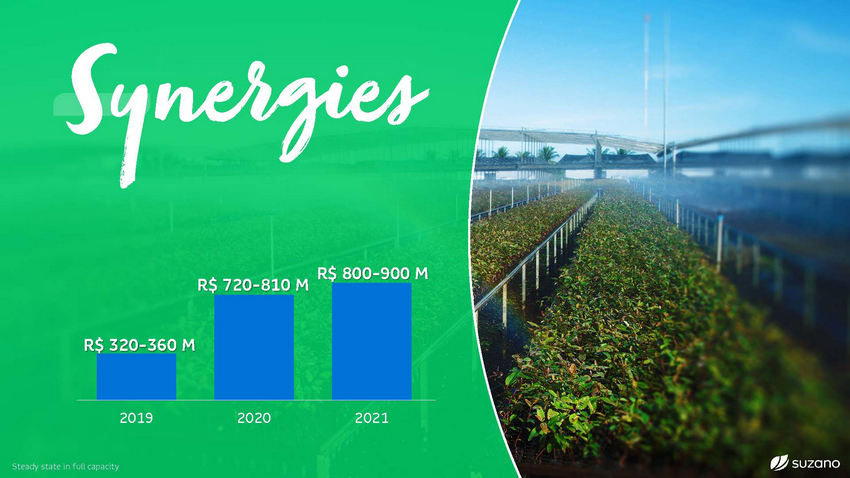
Synergi es R$ 800-900 M R$ 720-810 M 2019 2020 2021 Steady state in full capacity R$ 320-360 M
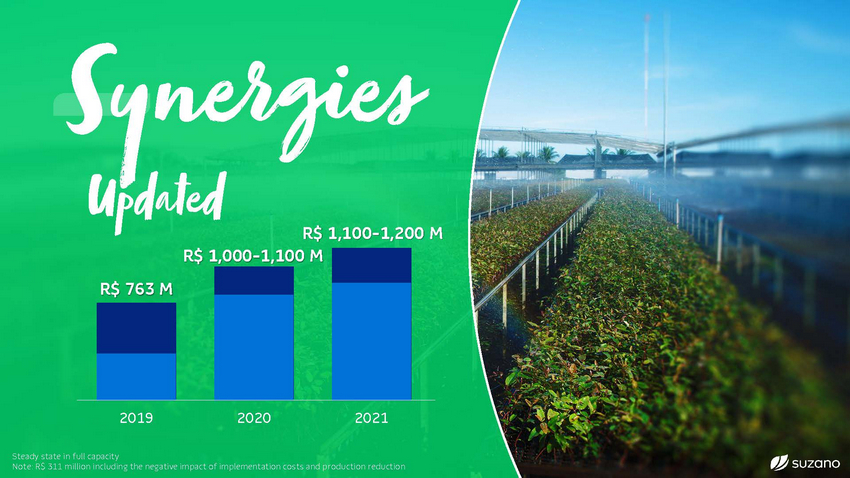
Synergi es Updated R$ 1,100-1,200 M R$ 1,000-1,100 M 2019 2020 2021 Steady state in full capacity Note: R$ 311 million including the negative impact of implementation costs and production reduction R$ 763 M
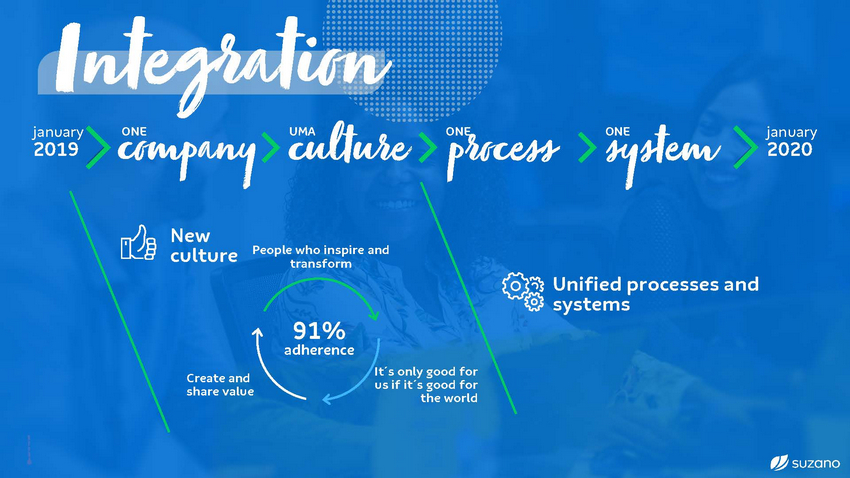
Integrat january january 2020 ONE UMA ONE ONE 201i9 ocnomp cultur proces s syste m anyNew culture e People who inspire and transform Unified processes and systems 91% adherence It´s only good for us if it´s good for the world Create and share value
Suzano one year post-merger The future of Suzano

Vídeo: Megatrends and Opportunities
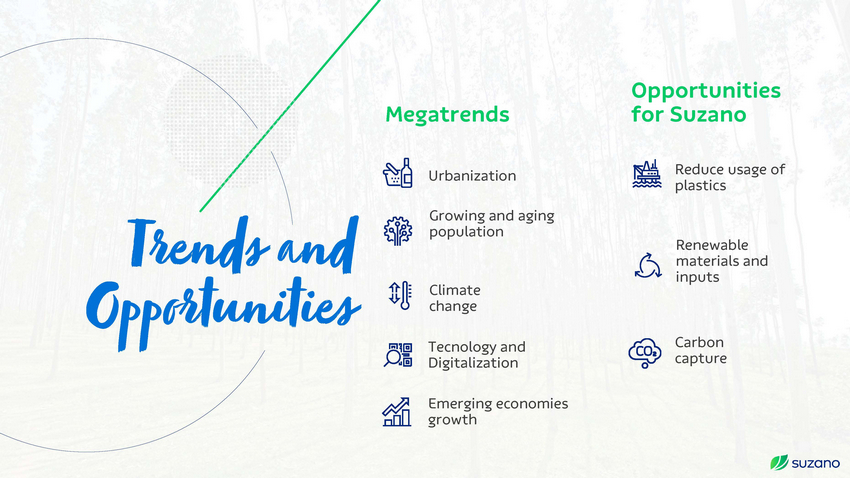
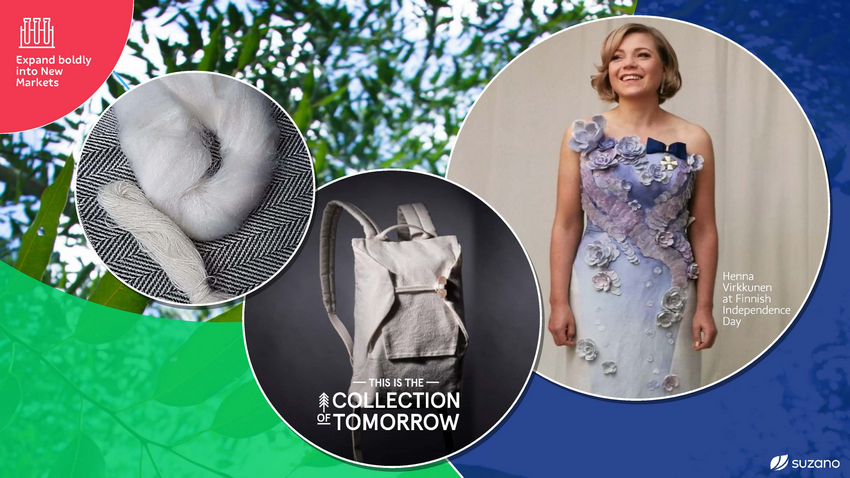
Opportunities for Suzano Megatrends Reduce usage of plastics Urbanization Growing and aging population Trends and Renewable materials and inputs Climate change Opportunit ies Carbon capture Tecnology and Digitalization Emerging economies growth
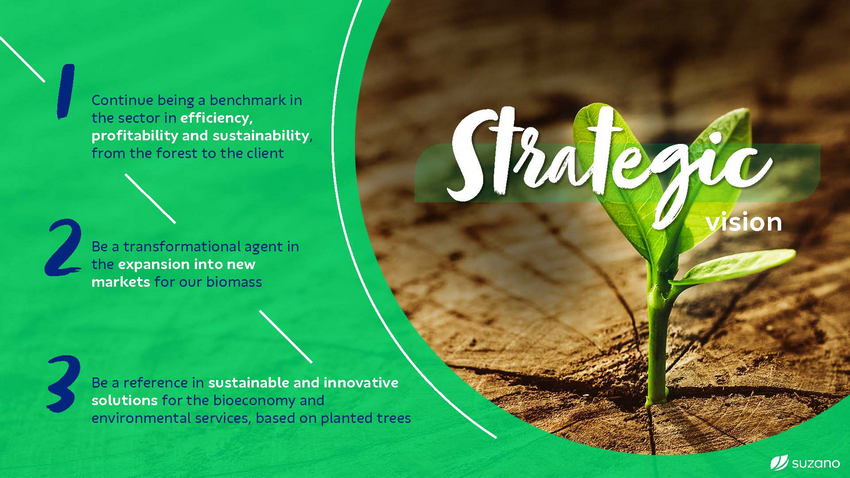
1Continue being a benchmark in the sector in efficiency, Strategi profitability and sustainability, from the forest to the client vision 2expansion into new markets for our Be a transformational agent in the c biomass 3Be a reference in sustainable and innovative solutions for the bioeconomy and environmental services, based on planted trees
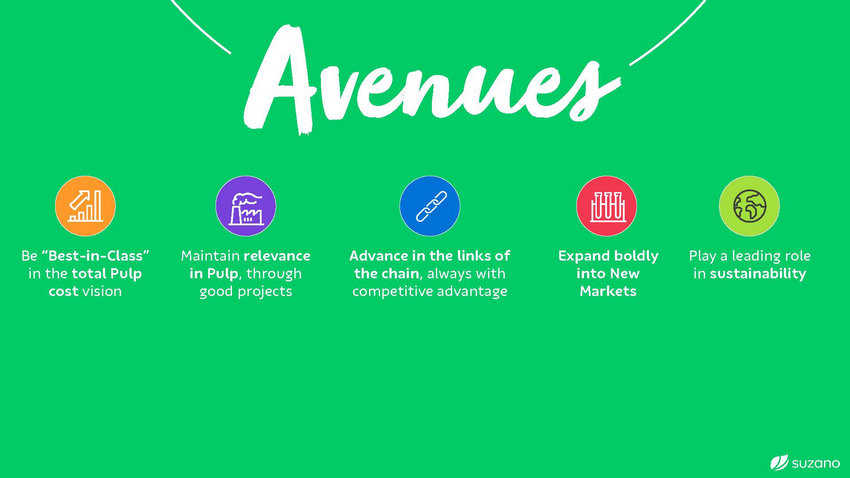
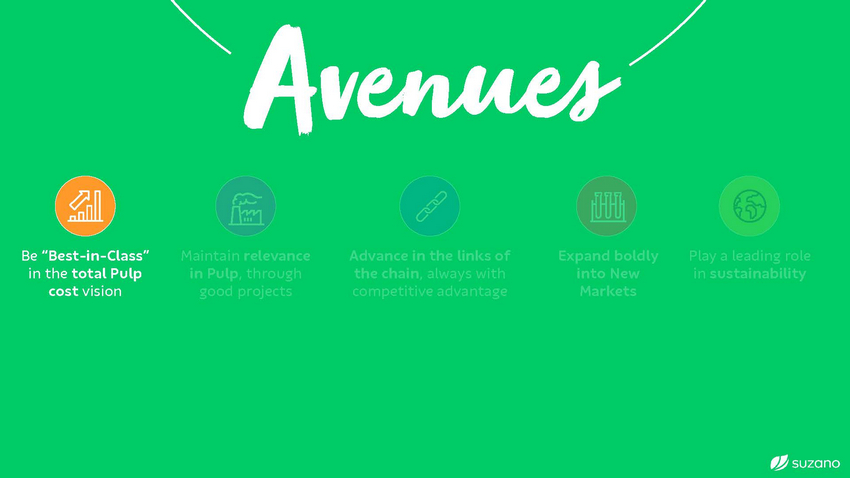
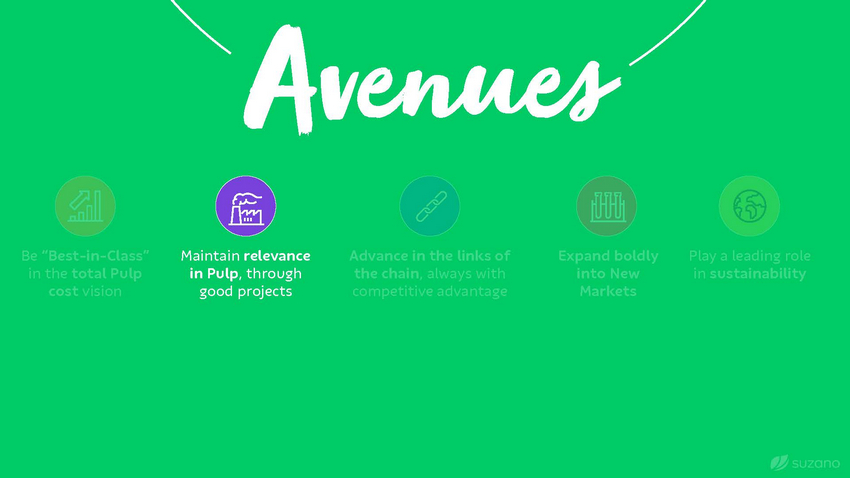
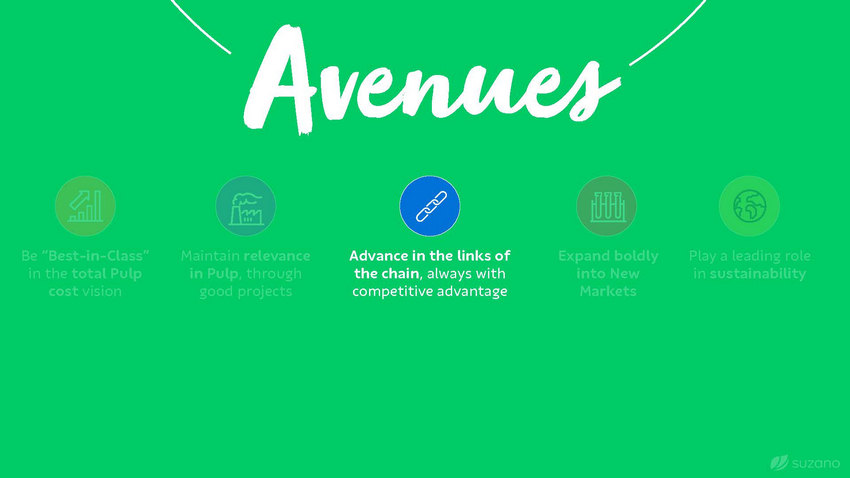
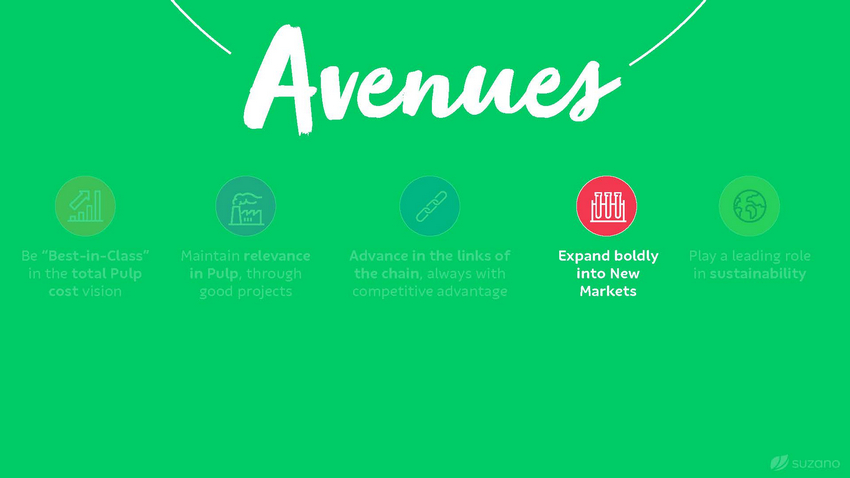
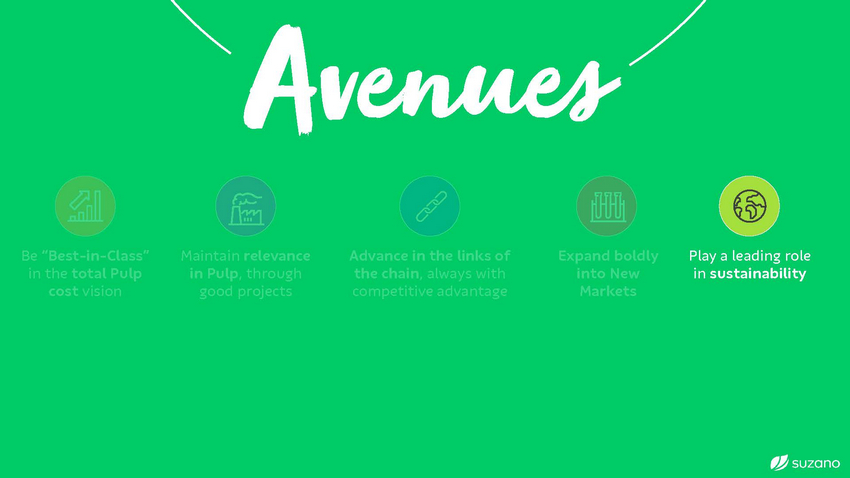
1Ser referência do setor Visão estratég em eficiência, rentabilidade e sustentabilidade, da floresta ao cliente 2na expansão em novos Be “Best-inSer agente transformador -Class” in Maintain relevance Advance in the links of the chain, always with competitive advantage Expand boldly into Play a leading role in sustainability the total Pulp cost in Pulp, through good New Markets ica mercados para nossa biomassa vision projects 3Ser referência em soluções sustentáveis e inovadoras para bioeconomia e serviços ambientais, a partir da árvore cultivada
1Ser referência do setor Visão estratég em eficiência, rentabilidade e sustentabilidade, da floresta ao cliente 2na expansão em novos Be “Best-inSer agente transformador -Class” in Maintain relevance Advance in the links of the chain, always with competitive advantage Expand boldly into Play a leading role in sustainability the total Pulp cost in Pulp, through good New Markets ica mercados para nossa biomassa vision projects 3Ser referência em soluções sustentáveis e inovadoras para bioeconomia e serviços ambientais, a partir da árvore cultivada

Value creation Total Operational Disbursement (R$/ton)(1) 1,584 ~1,300 Sustaining Capex +addiRtiona$l cash g2ener.at8ion Bn SG&A + freight Production Cash Cost (incl. downtime) 706 ~560 2024 2 US$ ~329/ton 2019 US$ 401/ton (1) Real figures. Average 2019 FX : R$ 3.95/US$. Does not include working capital variation | (2) Structural Total Operational Disbursement in full capacity ~340 ~400 418 460
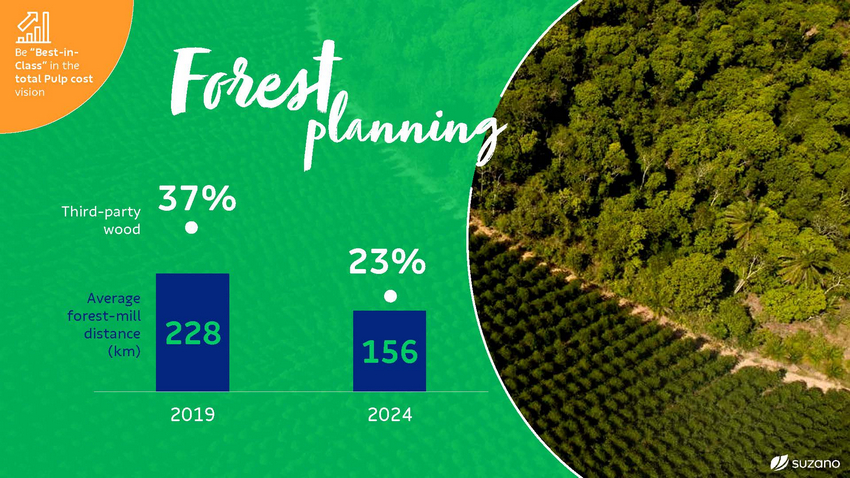
Foreplsatnning 37% Third-party wood 23% Average forest-mill distance (km) 2019 2024 228 156
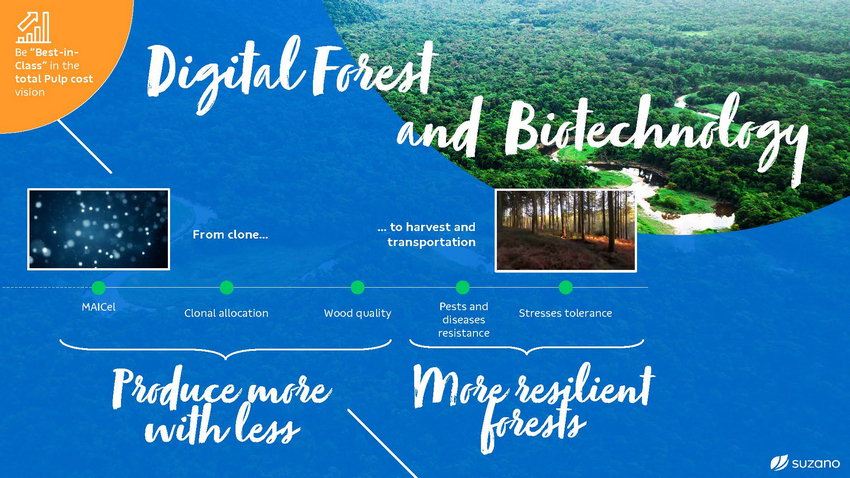
Digital Forest and ..B. to harviestoand t From clone... transportation y Pests and diseases resistance MAICel Clonal allocation Stresses tolerance Wood quality Producemor withless eresilient forests
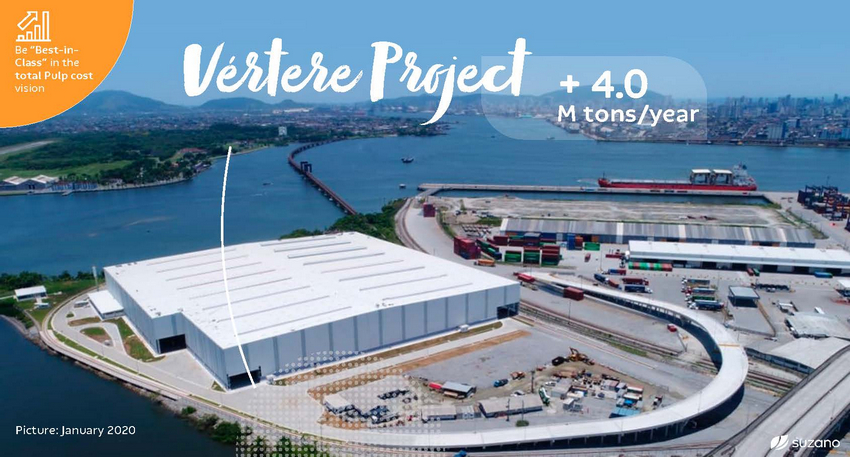
Vértere Pro+j4e.0ct M tons/year Picture: January 2020
1Ser referência do setor Visão estratég em eficiência, rentabilidade e sustentabilidade, da floresta ao cliente 2na expansão em novos Be “Best-inSer agente transformador -Class” in Maintain relevance Advance in the links of the chain, always with competitive advantage Expand boldly into Play a leading role in sustainability the total Pulp cost in Pulp, through good New Markets ica mercados para nossa biomassa vision projects 3Ser referência em soluções sustentáveis e inovadoras para bioeconomia e serviços ambientais, a partir da árvore cultivada
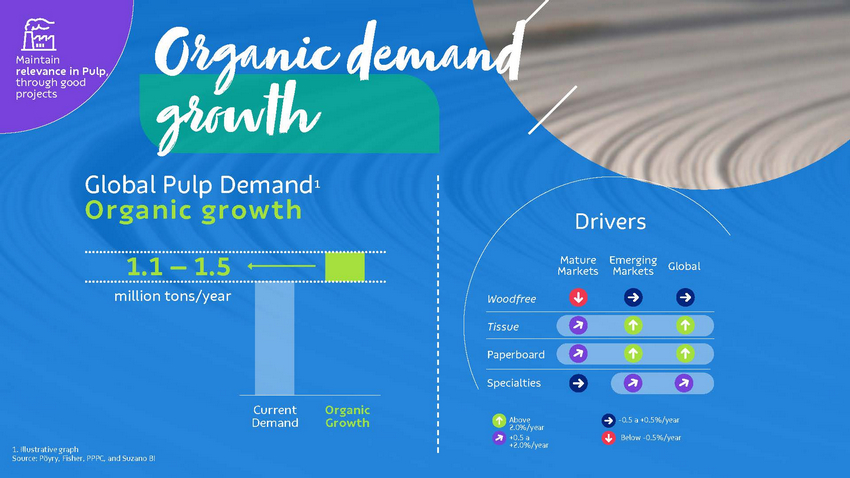
Organic growth demand Global Pulp Demand1 Organic growth 1.1 – 1.5 million tons/year Current Demand Organic Growth Above 2.0%/year +0.5 a +2.0%/year -0.5 a +0.5%/year Below -0.5%/year 1. Illustrative graph Source: Pöyry, Fisher, PPPC, and Suzano BI
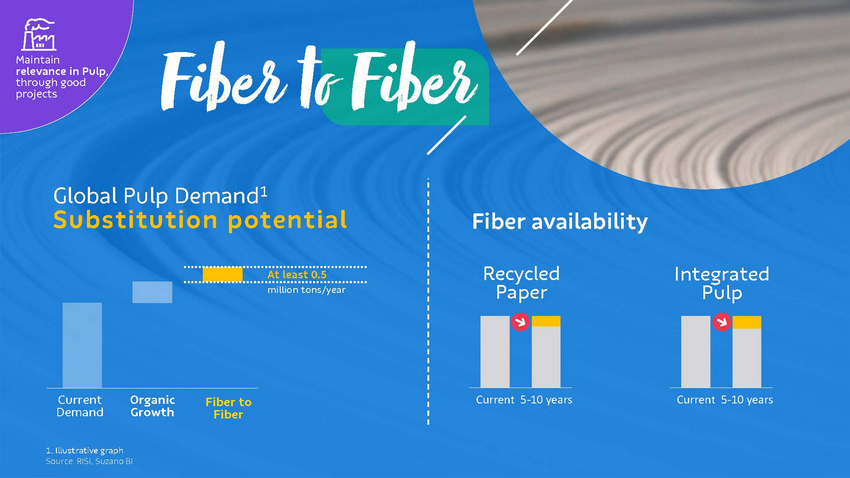
Fiber to Global Pulp FDemianbd1 er Substitution potential Fiber availability Recycled Paper Integrated Pulp At least 0.5 million tons/year CurrentOrganic Growth Fiber to Fiber Demand Current 5-10 years Current 5-10 years 1. Illustrative graph Source: RISI, Suzano BI
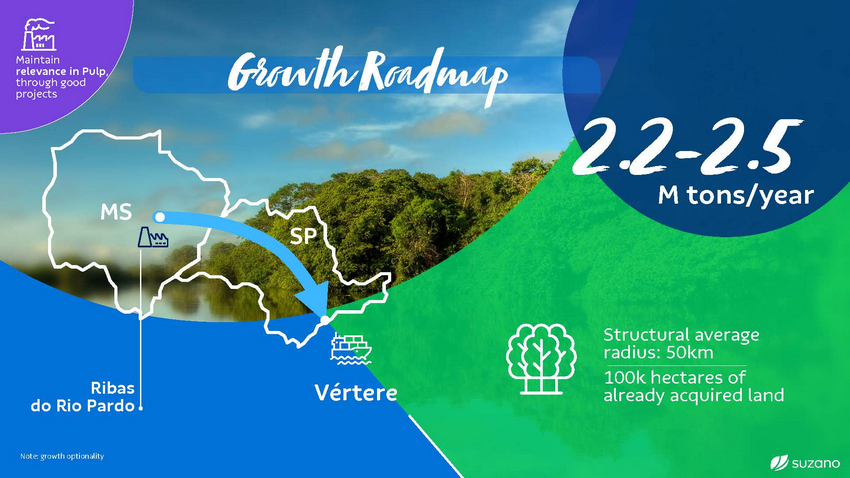
Growth Roadmap 2.M2ton-s/year 2.5 Structural average radius: 50km 100k hectares of already acquired land Ribas do Rio Pardo Vértere Note: growth optionality
1Ser referência do setor Visão estratég em eficiência, rentabilidade e sustentabilidade, da floresta ao cliente 2na expansão em novos Be “Best-inSer agente transformador -Class” in Maintain relevance Advance in the links of the chain, always with competitive advantage Expand boldly into Play a leading role in sustainability the total Pulp cost in Pulp, through good New Markets ica mercados para nossa biomassa vision projects 3Ser referência em soluções sustentáveis e inovadoras para bioeconomia e serviços ambientais, a partir da árvore cultivada
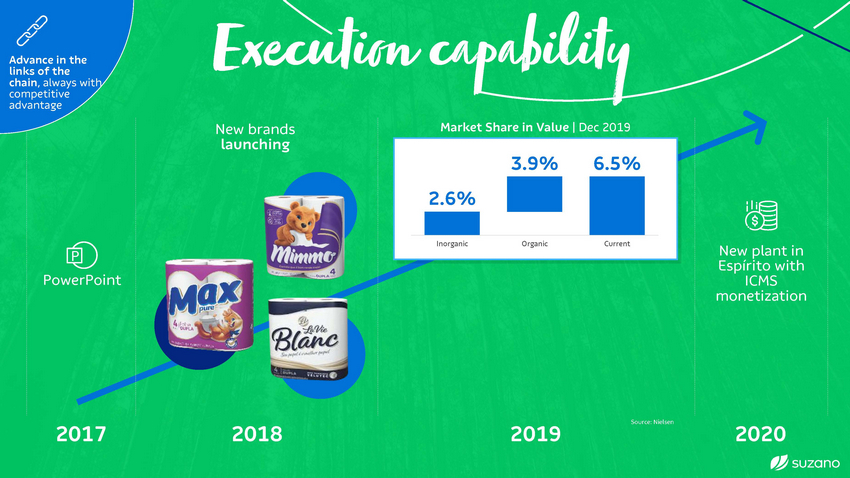
Execution New brandcs apabMiarklet iShatre inyValue | Dec 2019 launching 3.9% 6.5% Inorganic Organic Current New Espírit t in with Pow rPoint mone ation Source: Nielsen 2017 2018 2019 2020 2.6%
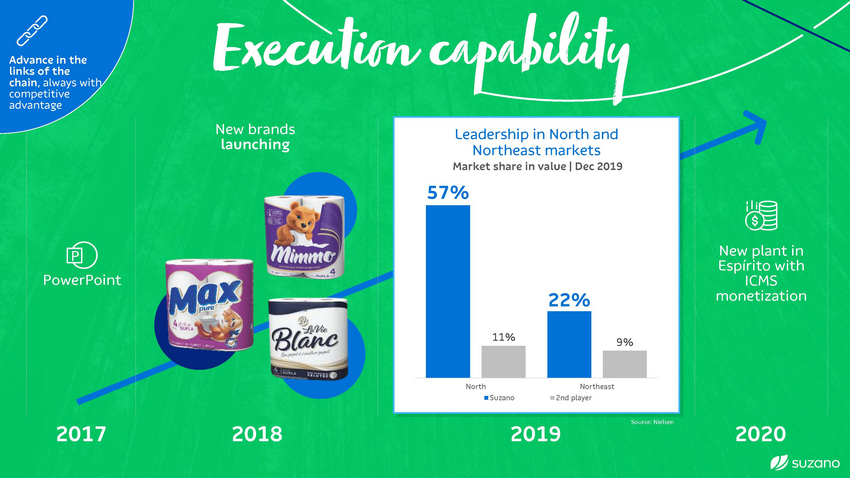
Execution New brandcs apabLeaMdiearrklsehtiipShiantreNinoyrVtahluaen|dDNeco2r0th19east launching markets 3.9% 6.5% Market share in value | Dec 2019 527.6%% New Espírit t in with Pow rPoint mone ation North Northeast 2nd player Suzano Source: Nielsen 2017 2018 2019 2020 Inorganic Organic Current 22% 11% 9%
1Ser referência do setor Visão estratég em eficiência, rentabilidade e sustentabilidade, da floresta ao cliente 2na expansão em novos Be “Best-inSer agente transformador -Class” in Maintain relevance Advance in the links of the chain, always with competitive advantage Expand boldly into Play a leading role in sustainability the total Pulp cost in Pulp, through good New Markets ica mercados para nossa biomassa vision projects 3Ser referência em soluções sustentáveis e inovadoras para bioeconomia e serviços ambientais, a partir da árvore cultivada
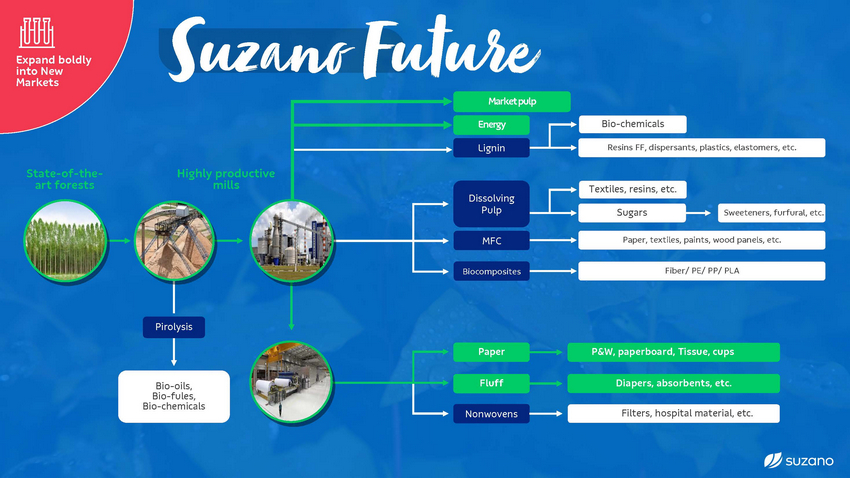
Suzano Marketpulp Energy Bio-chemicals Future Lignin Resins FF, dispersants, plastics, elastomers, etc. State-of-the-art forests Highly productive mills Textiles, resins, etc. Dissolving Pulp Sugars Sweeteners, furfural, etc. Paper, textiles, paints, wood panels, etc. MFC Fiber/ PE/ PP/ PLA Biocomposites Pirolysis Paper P&W, paperboard, Tissue, cups Fluff Diapers, absorbents, etc. Bio-oils, Bio-fules, Bio-chemicals Filters, hospital material, etc. Nonwovens
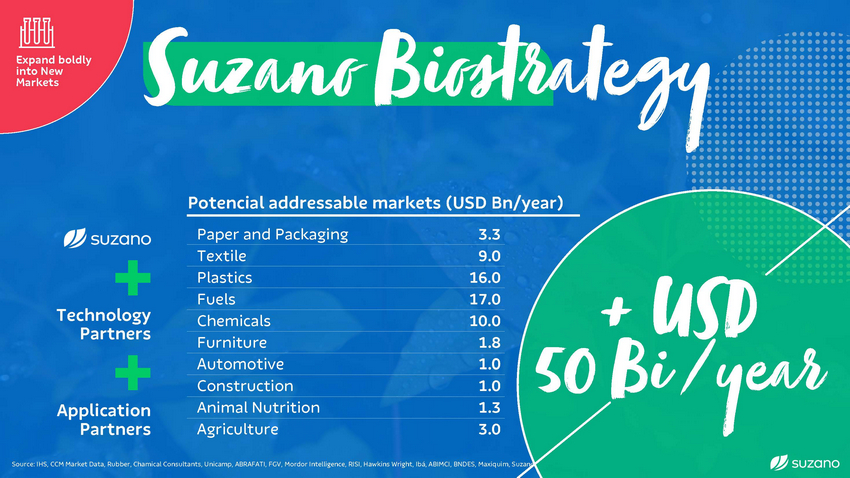
Suzano BPiapeor and Pasckagintg rat 3.3 Potencial addressable markets (USD Bn/year) Textile 9.0 Plastics 16.0 Fuels 17.0 Technology Partners Chemicals 10.0 Furniture 1.8 Automotive 1.0 Construction 1.0 Animal Nutrition 1.3 Application Partners Agriculture 3.0 Source: IHS, CCM Market Data, Rubber, Chamical Consultants, Unicamp, ABRAFATI, FGV, Mordor Intelligence, RISI, Hawkins Wright, Ibá, ABIMCI, BNDES, Maxiquim, Suzano
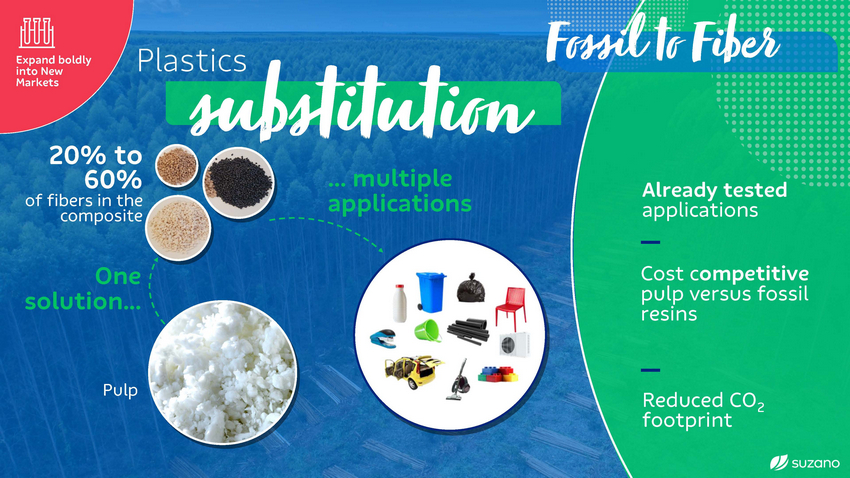
F Plastics substitu 20% to ... multiple 60% Already tested applications applications of fibers in the composite tion One solution... Cost competitive pulp versus fossil resins Pulp Reduced CO2 footprint
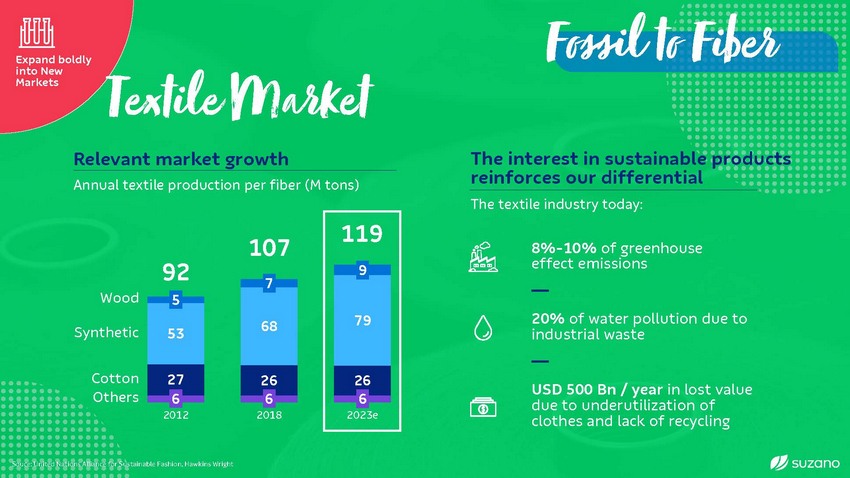
Fossil to extile Relevant market growth Market Fiber The interest in sustainable products reinforces our differential Annual textile production per fiber (M tons) The textile industry today: 119 107 8%-10% of greenhouse effect emissions 92 Wood 5 20% of water pollution due to industrial waste Synthetic Cotton Others 27 26 26 USD 500 Bn / year in lost value due to underutilization of clothes and lack of recycling 2012 2018 2023e Souce: United Nations Alliance for Sustainable Fashion, Hawkins Wright 53 6 7 68 6 9 79 6
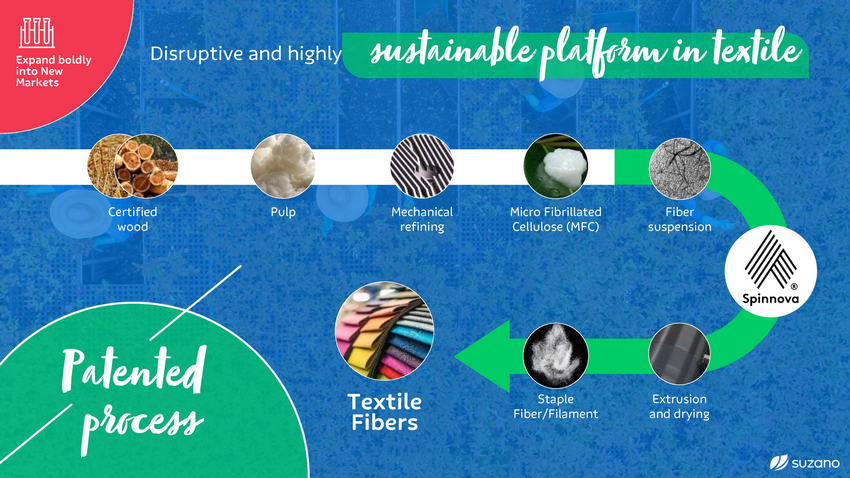
Disruptive and highlysustainable platform in textile Pulp Mechanical refining Micro Fibrillated Cellulose (MFC) Fiber suspension Certified wood Textile Fibers Staple Fiber/Filament Extrusion and drying
[LOGO]

Fossil Fiber to Single-useto paper 87 1cou2ntries7 tonnes of plastic packaging million 500 billion plastic bags/year Equivalent to 1new pulpmill Substitution into paper products 20 380 billion plastic cups/year Source: Pöyry, Datamark, Suzano BI
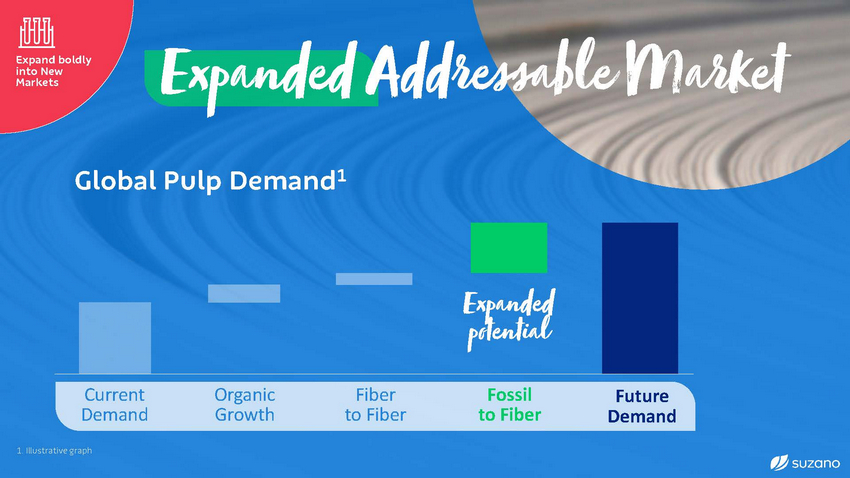
Expanded Addressable Market Demand1 Global Pulp ed Faoslsil to Fiber Current Demand Organic Growth Fiber to Fiber Future Demand 1. Illustrative graph Expand potenti
1Ser referência do setor Visão estratég em eficiência, rentabilidade e sustentabilidade, da floresta ao cliente 2na expansão em novos Be “Best-inSer agente transformador -Class” in Maintain relevance Advance in the links of the chain, always with competitive advantage Expand boldly into Play a leading role in sustainability the total Pulp cost in Pulp, through good New Markets ica mercados para nossa biomassa vision projects 3Ser referência em soluções sustentáveis e inovadoras para bioeconomia e serviços ambientais, a partir da árvore cultivada

Play a leading role in sustainability Climate change Reduce specific emissions in 15% Energy Increase exports in 50% Water • Forest: Increase water availability in 100% of critical watersheds • Industry: Reduce 15% of collected water Diversity and Inclusion • 30% of women and 30% of black people in leadership positions 100% of accessibility 100% inclusive environment and zero prejudice: people with disabilities and LGBTI+ • • Industrial waste to landfill Reduce in 70% Education Enhance IDEB in 40% of our priority municipalities Innovabili ty 2030 goals, except for Diversity and Inclusion (2025)
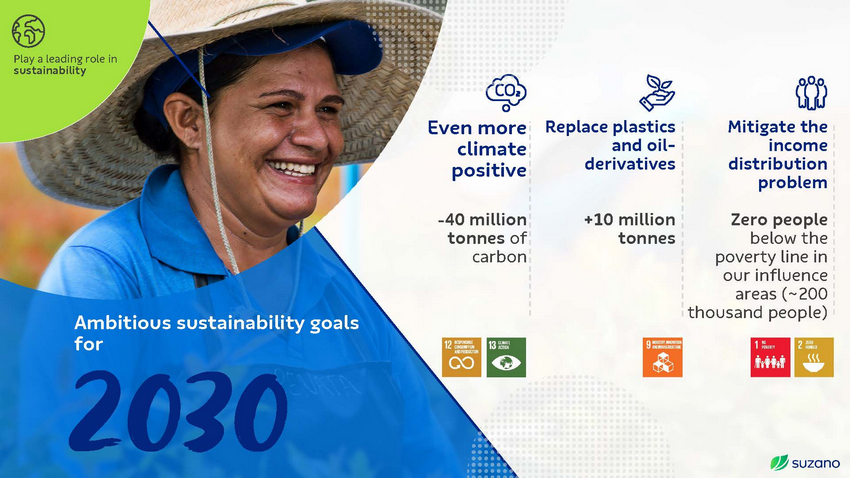
Play a leading role in sustainability Even more Replace plastics and Mitigate the income distribution problem oil-derivatives climate positive +10 million tonnes Zero people below the poverty line in our influence areas (~200 thousand people) -40 million tonnes of carbon Ambitious sustainability goal for
More efficiency Bigger addressable market Leading role in sustainability Value Strong financial discipline

Day 2020