Exhibit 99.1

Inventory levels normalized and cash production cost decrease
São Paulo, May 14, 2020.Suzano S.A. (B3: SUZB5 | NYSE: SUZ), one of the largest integrated pulp and paper producers in the world, announces today its consolidated results for the first quarter of 2020 (1Q20).
HIGHLIGHTS
| · | Reduction of approximately 500 thousand tons of pulp inventory. |
| · | Pulp sales of 2,856 thousand tons, up 65% vs. 1Q19. |
| · | Paper sales of 268 thousand tons, down 2% vs. 1Q19. |
| · | Adjusted EBITDA1 and Operating cash generation² of R$3.0 billion and R$2.3 billion, respectively. |
| · | Adjusted EBITDA1/ton3 from pulp of R$961/ton (-35% vs. 1Q19). |
| · | Adjusted EBITDA1/ton4 of paper of R$1,186/ton (+12% vs. 1Q19). |
| · | Average net pulp price - Export Market: US$469/t (-34% vs. 1Q19). |
| · | Average net paper price5 of R$4,085/ton (+2% vs. 1Q19). |
| · | Pulp cash cost ex-downtime of R$596/ton, down 6% vs. 4Q19. |
| · | Capture of operating synergies in line with planning. |
| · | Initiatives against Covid-19 focused on people, society and business continuity. |
Financial Data (R$ million) | 1Q20 | 1Q19 | Δ Y-o-Y | 4Q19 | Δ Q-o-Q | LTM 1Q20 |
| Net Revenue | 6,981 | 5,699 | 22% | 7,049 | -1% | 27,295 |
| Adjusted EBITDA1 | 3,026 | 2,761 | 10% | 2,465 | 23% | 10,988 |
| Adjusted EBITDA Margin1 | 43% | 48% | -5 p.p. | 35% | 8 p.p. | 40% |
| Adjusted EBITDA Margin¹ ex- Klabin3 | 45% | 50% | -4 p.p. | 37% | 9 p.p. | 42% |
| Net Financial Result | (22,444) | (1,936) | - | 1,625 | - | (27,234) |
| Net Income | (13,419) | (1,229) | - | 1,175 | - | (15,005) |
| Operating Cash Generation2 | 2,336 | 1,781 | 31% | 1,540 | 52% | 7,618 |
| Net Debt /Adjusted EBITDA1 (x) - R$ | 6.0 x | 3.4 x | 2.6 x | 5.0 x | 1.0 x | 6.0 x |
| Net Debt /Adjusted EBITDA1 (x) - US$ | 4.8 x | 3.3 x | 1.4 x | 4.9 x | -0.1 x | 4.8 x |
| Operational Data ('000 tons) | 1Q20 | 1Q19 | Δ Y-o-Y | 4Q19 | Δ Q-o-Q | LTM 1Q20 |
| Sales | 3,124 | 2,003 | 56% | 3,288 | -5% | 11,789 |
| Pulp | 2,856 | 1,729 | 65% | 2,920 | -2% | 10,539 |
| Paper4 | 268 | 274 | -2% | 369 | -27% | 1,250 |
| Production | 2,644 | 2,465 | 7% | 2,587 | 2% | 10,176 |
| Pulp | 2,337 | 2,173 | 8% | 2,267 | 3% | 8,921 |
| Paper4 | 307 | 292 | 5% | 319 | -4% | 1,255 |
¹ Excluding non-recurring items and PPA effects. |2 Considers Adjusted EBITDA less maintenance capex (cash basis). |3 Excludes Klabin’s sales volume |4 Includes the results of the Consumer Goods Unit.

1Q20 EARNINGS RELEASE |  |
The consolidated quarterly information has been prepared in accordance with the Securities and Exchange Commission (CVM) and Accounting Standards Committee (CPC) standards and is in compliance with International Accounting Standard (IFRS) issued by the International Accounting Standard Board (IASB). The data contained in this document was obtained from the financial information as made available to the CVM. The operating and financial information is presented based on consolidated numbers in Reais (R$). Summaries may diverge due to rounding. Non-financial data, such as volume, quantity, average price, average price, in Reais and Dollars, were not reviewed by independent auditors.
CONTENTS
| EXECUTIVE SUMMARY | 3 |
| PULP BUSINESS PERFORMANCE | 4 |
| PULP SALES VOLUME AND REVENUE | 4 |
| PULP CASH COST | 5 |
| PULP SEGMENT EBITDA | 7 |
| OPERATING CASH FLOW FROM THE PULP SEGMENT | 7 |
| PAPER BUSINESS PERFORMANCE | 8 |
| PAPER SALES VOLUME REVENUE | 8 |
| ECONOMIC AND FINANCIAL PERFORMANCE | 11 |
| NET REVENUE | 11 |
| PRODUCTION | 11 |
| COST OF GOODS SOLD | 12 |
| SELLING EXPENSES | 12 |
| GENERAL AND ADMINISTRATIVE EXPENSES | 13 |
| ADJUSTED EBITDA | 13 |
| FINANCIAL RESULT | 14 |
| DERIVATIVE OPERATIONS | 15 |
| NET INCOME (LOSS) | 18 |
| INDEBTEDNESS | 18 |
| CAPITAL EXPENDITURE | 20 |
| OPERATING CASH GENERATION | 21 |
| FREE CASH FLOW | 22 |
| COVID-19 | 22 |
| SYNERGIES | 23 |
| TOTAL OPERATIONAL EXPENDITURES - PULP | 23 |
| EVENTS AFTER THE REPORTING PERIOD | 23 |
| CAPITAL MARKETS | 24 |
| FIXED INCOME | 25 |
| RATING | 25 |
| UPCOMING EVENTS | 26 |
| IR CONTACTS | 26 |
| APPENDICES | 27 |
| APPENDIX 1 – Operating Data | 27 |
| APPENDIX 2 – Consolidated Statement of Income and Goodwill Amortization | 29 |
| APPENDIX 3 – Consolidated Balance Sheet | 30 |
| APPENDIX 4 – Consolidated Statement of Cash Flow | 31 |
| APPENDIX 5 – EBITDA | 32 |
| APPENDIX 6 – Segmented Income Statement | 33 |
| Forward-Looking Statements | 34 |
| Page 2 of 34 | |
1Q20 EARNINGS RELEASE | |
EXECUTIVE SUMMARY
2020 began with global challenges unprecedented in recent history resulting from the Covid-19 pandemic, popularly known as the new coronavirus. An environment that lasts beyond the first quarter of the year and, therefore, until the present date, is still part of the situation currently experienced by the Company. In order to minimize, as much as possible, any impacts associated with the pandemic and in view of its role as an important social and economic agent, Suzano has adopted a systemic management approach, prioritizing three focuses: people, society and the continuity of its business.
Regarding the protection of people, several preventive and mitigating measures have been implemented in line with the guidelines established by national and international health authorities, always seeking best practices and adopting initiatives that have proven to be effective. From an economic point of view, the Company decided to maintain all direct jobs even for employees removed from their duties as a result of the protective measures adopted.
Suzano's support for society begins with the support of those in its value chain. Accordingly, the Company decided to maintain full transfer of payroll costs to service providers with activities suspended due to the coronavirus; as well as providing support to suppliers and customers in situations of greater fragility. Anchored in its culture driver“It is only good for us, if it is good for the world”, Suzano's social initiatives total a contribution of R$50 million, allocated to various initiatives in the regions where it is present, such as through donation of toilet paper and diapers; donation of hospital masks; structural improvements in hospitals; and acquisition of 159 respirators, which were donated to municipal and state governments in the regions where we operate. Regarding this last item, it is also worth noting that Suzano has dedicated a great deal of managerial and financial effort, together with other companies, to enable the production of about 6,500 respirators by the companyMagnamed, as it understands that the significant increase in respirators is crucial to combat to the pandemic in Brazil.
The essentiality of Suzano's business as a participant in the supply chain of essential goods such as hygiene products, printing & writing papers and packaging has inspired the Company to strive even more to preserve the operational stability of its business, overcoming the challenges arising of the pandemic. In addition, the systemic management of the crisis, at both the internal and external levels, has contributed to ensure that the Company's operating performance is in line with the initial planning for the year. With an irreplicable asset base, a global presence and diversified geographically and by consumer segments and a unique logistical set-up, Suzano maintains its trajectory even in the current situation of becoming increasingly competitive, illustrated for example in the continuity of reduction of its pulp production cash cost in the first quarter of this year.
When we examine impacts on the business due to the external dynamics caused by the Covid-19 pandemic, the following aspects are worth highlighting: (i) the significant increase in the demand for pulp mainly due to the heating of the sanitary paper segment, evidenced by the strong sales volume pulp observed in 1Q20, which allowed the Company to achieve inventory normalization; (ii) the reduction in demand for printing & writing paper, a reason why the Company decided to temporarily stop production at the Mucuri and Rio Verde units; (iii) supply restrictions by the industry and changes in scheduled maintenance downtimes; and (iv) the strong devaluation of the domestic currency against the dollar, which benefits the Company's cash generation.
Suzano's financial strength is also a fundamental aspect of the Company's solidity, especially in the current period of greater uncertainty in the short term and less visibility about the future. In view of this scenario, the Company in 1Q20 decided to further increase its already strong cash position by withdrawing a low-cost revolving credit line and continued its liability management initiatives to further improve its debt profile, which has comfortable average term of approximately 7 years. Suzano's liquidity position vis-à-vis its debt amortization commitments is enough to represent zero refinancing risk by 2022. Another initiative that highlights its financial discipline and its commitment to the Company's deleveraging refers to the reduction of expected capital investments for 2020 by approximately R$ 200 million, in addition to reducing costs and operating expenses provided for in the year's budget. Suzano's robust credit management and structure means that there is no significant impact resulting from the default of its customer base.
Suzano therefore navigates the complex environment caused by the Covid-19 pandemic, showing its differentiated resilience and robustness, while dedicating enormous efforts to the world, and especially Brazil, to go through this unexpected crisis as soon as possible and in the safest way possible for the whole society.
| Page 3 of 34 | |
1Q20 EARNINGS RELEASE | |
PULP BUSINESS PERFORMANCE
PULP SALES VOLUME AND REVENUE
The COVID-19 pandemic has generated many uncertainties in the global macroeconomic context, including the pulp industry. Even in the face of challenges, pulp demand in the first quarter continued to be driven by the sanitary paper segment (Tissue), which represents the largest consumption of hardwood.
On the supply side, the first quarter was marked by unscheduled downtimes in several regions due to different factors that generated a significant reduction in the available volume of pulp on the market, some of these downtimes were related to COVID-19.
Pulp inventories in general decreased in Chinese and European ports after the recovery in demand started at the end of 2019. Suzano followed the same behavior of significant reduction in the volume of inventories in the period.
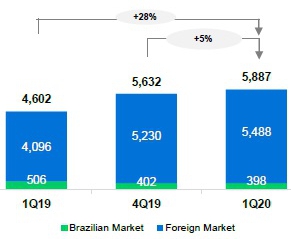
In this context, Suzano’s sales were record high for a first quarter, to 2,856 thousand tons of market pulp, slightly down (-2%) from the high volume shown in 4Q19 and up 65% from 1Q19. In comparison with 1Q19, it is worth highlighting the different commercial strategy of the Company in that quarter.
Pulp Sales Volume ('000 ton)

Suzano’s average net pulp price in USD was US$462/ton in 1Q20, representing decreases of US$7/t (-1%) and US$243/ton (-34%) compared to 4Q19 and 1Q19, respectively.The average net pulp price in the export market in 1Q20 was US$469/ton, compared to US$471/ton in 4Q19 and US$711/ton in 1Q19.
Average net price (USD/t)

| Page 4 of 34 | |
1Q20 EARNINGS RELEASE | |
The average net price in BRL was R$2,060/ton in 1Q20, up 7% compared to 4Q19, and down 23% from 1Q19, reflecting the lower prices in USD, partially offset by the exchange depreciation of 18% in the period.
Net revenue from pulp was 28% higher compared to 1Q19, explained mainly by the higher sales volume (+65%) and the 18% appreciation in the average price of the USD against the BRL, with these factors partially offset by the lower average net price in USD (-34%).
Compared to 4Q19, the 5% growth in revenue was due to the 8% appreciation in the average price of the USD against the BRL, with this effect partially offset by the 1% lower average net price in USD and by the lower sales volume.
Pulp Net Revenues (R$ million)
PULP CASH COST
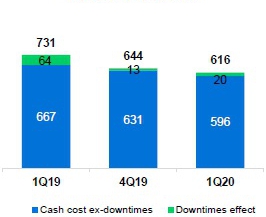
Cash cost excluding downtime in 1Q20 compared to 1Q19 decreased R$71/ton to R$596/ton (-11%), which is mainly explained by: i) the lower wood cost, given the lower average distance, largely due to the reduced share of the wood from Losango in Aracruz, the reduced share of third-party wood and the lower harvest cost due to the higher productivity and lower maintenance costs; ii) the reduced fixed costs, given the lower maintenance expenses and the higher economies of scale with the growth in production; and iii) the lower costs with energy and chemicals, especially natural gas and caustic soda, also resulting from the synergy gains, the improved stability of mills. These positive effects on input were partially offset by the 18% appreciation in the average price of the USD against the BRL.
Consolidated Pulp Cash Cost ex- maintenance downtime (R$/ton) | Pulp Cash Cost (R$/ton) |
 |  |
| Page 5 of 34 | |
1Q20 EARNINGS RELEASE | |
Consolidated Pulp Cash Cost ex-maintenance (R$/ton)1

¹Excludes maintenance and administrative downtimes impact.
Cash cost ex-downtime in 1Q20 compared to 4Q19 also decreased, by R$35/ton (-6%), explained mainly by the lower wood cost (shorter average distance, reduced share of third-party wood and lower harvesting costs) and by the lower fixed costs (higher production).The performance of input, although it recorded a cost reduction, mainly with caustic soda and natural gas, was negatively impacted mainly by the 8% appreciation in average price of the USD against the BRL.
Consolidated Pulp Cash Cost ex-maintenance (R$/ton)1

¹Excludes maintenance and administrative downtimes impact.
| Cash Cost 1Q20¹ | Cash Cost 1Q19¹ |
 | 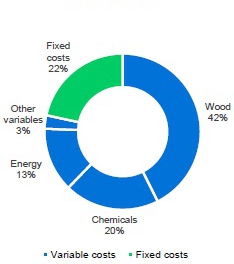 |
¹Based on cash cost excluding downtimes. Excludes energy sales.
| Page 6 of 34 | |
1Q20 EARNINGS RELEASE | |
PULP SEGMENT EBITDA
| Pulp Segment | 1Q20 | 1Q19 | Δ Y-o-Y | 4Q19 | Δ Q-o-Q | LTM 1Q20 |
| Adjusted EBITDA (R$ million)¹ | 2,709 | 2,471 | 10% | 2,042 | 33% | 9,496 |
| Sales Volume (k ton) – ex-Klabin | 2,818 | 1,674 | 68% | 2,757 | 2% | 10,018 |
| Pulp Adjusted¹ EBITDA ex-Klabin (R$/ton) | 961 | 1,476 | -35% | 741 | 30% | 948 |
¹ Excludes non-recurring items and PPA effects.
The increase inAdjusted EBITDA from pulp in 1Q20 compared to 1Q19 mainly reflects the higher sales volume (+65%), the 18% appreciation in the average price of the USD against BRL and the reduction in cash COGS, with these factors partially offset by the lower net pulp price in USD (-34%). The 35% decrease in per-ton Adjusted EBITDA is by the lower average net pulp price in USD, partially offset by the exchange rate variation.
Compared to 4Q19, the 33% growth in adjusted EBITDA from pulp is explained by the 8% appreciation in the average price of the USD against the BRL and by the lower cash COGS, with these factors partially neutralized by the 1% drop in the average net price in USD and the lower sales volume. In the EBITDA analysis per ton, the foreign exchange factor and the reduction in cash COGS (lower production cost, mix of plants and lower Klabin effect) explain the increase of 30%.
Adjusted EBITDA¹ (R$ million) and Ajusted EBITDA Margin (%) of Pulp | Pulp Adjusted EBITDA (R$/ton) |
 |  |
¹ Excludes non-recurring items and PPA effects.
OPERATING CASH FLOW FROM THE PULP SEGMENT
| Pulp Segment (R$ million) | 1Q20 | 1Q19 | Δ Y-o-Y | 4Q19 | Δ Q-o-Q | LTM 1Q20 |
| Adjusted EBITDA¹ | 2,709 | 2,471 | 10% | 2,042 | 33% | 9,496 |
| Maintenance Capex² | (633) | (894) | -29% | (842) | -25% | (3,082) |
| Operating Cash Flow | 2,076 | 1,577 | 32% | 1,200 | 73% | 6,414 |
¹ Excludes non-recurring items and PPA effects.
² Cash basis.
| Page 7 of 34 | |
1Q20 EARNINGS RELEASE | |
Operating Cash Flow of Pulp per ton (R$/ton)

¹ Excludes sales volume related to the agreement with Klabin.
Per-ton operating cash flow in the pulp segment decreased 22% from 1Q19, impacted by the decline in per-ton Adjusted EBITDA, which was partially offset by the lower maintenance capex. Compared to 4Q19, the increase was due to the increase in per-ton EBITDA (as already explained) and to the lower maintenance capex.
PAPER BUSINESS PERFORMANCE
The data and analyses below incorporate the results from the consumer goods business, which is still in the ramp-up phase.
PAPER SALES VOLUME REVENUE
Data from the Forestry Industry Association (Ibá) indicate that domestic sales of printing & writing paper and paperboard declined by 30% in the first quarter compared to 4Q19, due to the seasonality of sales in Brazil, and by 10% compared to same period last year. Meanwhile, imports decreased by 6% from 4Q19 and by 12% from 1Q19.
In March, Ibá data pointed to a 20% decline in sales from the national printing & writing and paperboard industry compared to March 2019, mainly explained by the economic slowdown in the latter half of the month caused by the social distancing measures in Brazil as a result of the Covid-19 pandemic.
In Brazil, Suzano’s paper sales came to 183,000 tons in 1Q20, down 29% from 4Q19 and 7% from 1Q19, in line with the market slowdown observed.
Paper sales in both the domestic and export markets in 1Q20 came to 268,000 tons, down 27% and 2% from 4Q19 and 1Q19, respectively. Taking advantage of weaker demand due to the typical seasonality of the period in the Brazilian market, the Company used its commercial flexibility to launch a plan to accelerate export sales and to rebuild inventories in the chain to ensure adequate service to the clients who participate in theSuzano Mais program in Brazil and to our international clients.
| Page 8 of 34 | |
1Q20 EARNINGS RELEASE | |
| Paper Sales Volume ('000 ton) | Average net paper price (R$/ton)¹ |
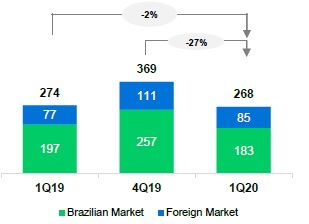 |  |
The average net price in the domestic market in 1Q20 stood at R$4,180/ton, representing increases of R$238/ton (+6%) compared to 4Q19 and R$83/ton (+2%) compared to 1Q19.
The average net price of the paper exported was down US$8/ton (-1%) from 4Q19 and US$125/ton (-13%) from 1Q19. In BRL, the export price of paper in 1Q20 came to R$3,881/ton, up 7% from 4Q19 and up 3% from 1Q19, reflecting the appreciation in the average price of the USD against the BRL in the period.
Net revenue from paper sales amounted to R$1,094 million in 1Q20, down 23% from 4Q19, reflecting the lower sales volume due to seasonality heightened by Covid-19's impact on the business environment, partially offset by the higher average net price in BRL (+6%).
When compared to the same period last year, paper net revenues remained stable, due to the lower sales volume (-2%), which was offset by the higher average net price in BRL (+2%).
Paper Net Revenues (R$ million)

*Includes the Consumer Goods Unit.
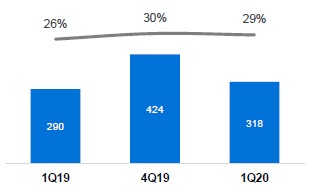
PAPER EBITDA
| Paper segment | 1Q20 | 1Q19 | Δ Y-o-Y | 4Q19 | Δ Q-o-Q | LTM 1Q20 |
| Adjusted EBITDA (R$ million) | 318 | 290 | 10% | 424 | -25% | 1,492 |
| Sales volume (k ton) | 268 | 274 | -2% | 369 | -27% | 1,250 |
| Paper adjusted¹ EBITDA (R$/ton) | 1,186 | 1,058 | 12% | 1,150 | 3% | 1,194 |
¹ Excludes non-recurring items and PPA effects.
| Page 9 of 34 | |
1Q20 EARNINGS RELEASE | |
The performance ofAdjusted EBITDA from paper in 1Q20 compared to 1Q19 (+10%) is explained mainly due: (i) to the lower cash COGS, in turn as result of the better operational performance and lower concentration of scheduled maintenance downtimes; and (ii) depreciation of the average BRL against the USD (-18%).
Compared to 4Q19, the 25% decline in paper adjusted EBITDA is due to decrease in sales volume (-27%), partially offset by the increase in paper prices in BRL and by the operating expenses reduction. When comparing performance per ton, the increase compared to 1Q19 and 4Q19 are due to the better net price in BRL and lower cash COGS.
Adjusted EBITDA (R$ million) and Adjustd EBITDA Margin (%) of Paper | Paper Adjusted EBITDA (R$/ton) |
 |  |
¹ Excludes non-recurring items.
PAPER OPERATING CASH FLOW
| Operating cash flow - Paper (R$ million) | 1Q20 | 1Q19 | Δ Y-o-Y | 4Q19 | Δ Q-o-Q | LTM 1Q20 |
| Adjusted EBITDA1 | 318 | 290 | 10% | 424 | -25% | 1,492 |
| Maintenance Capex2 | (57) | (87) | -34% | (83) | -31% | (289) |
| Operating Cash Flow | 260 | 203 | 28% | 341 | -24% | 1,204 |
¹ Excludes non-recurring items.
² Cash basis.
Operating Cash Flow of Paper per ton (R$/ton)

| Page 10 of 34 | |
1Q20 EARNINGS RELEASE | |
Operating cash flow per ton of paper in 1Q20 was R$972/ton. In comparison with the same quarter of the previous year, there was an increase of 31%, explained by the 10% increase in adjusted EBITDA, enhanced by the reduction in maintenance capex (- 34%).
Compared to 4Q19, although the adjusted Ebitda was lower in 1Q20, operating cash flow per ton increased by 5%, due to higher adjusted EBITDA per ton (as previously explained) and lower capex.
ECONOMIC AND FINANCIAL PERFORMANCE
NET REVENUE
Suzano’snet revenue in 1Q20 was R$6,981 million, 83% of which came from exports (vs. 77% in 1Q19 and 80% in 4Q19). Paper and packaging sales in the quarter came to 3,124,000 tons, increasing 56% compared to 1Q19 and decreasing 5% compared to 4Q19. Compared to 1Q19, the net revenues increase is mainly explained by the better performance of pulp sales to all regions, especially Asia, and by the 18% appreciation in the average price of the USD against the BRL, with these effects partially offset by the 34% decline in the average net pulp price in USD.
Net Revenue (R$ Millions) | Net Revenue Breakdown (1Q20) | |
 |  |
¹ Excludes service revenue from Portocel.
The 1% decline in consolidated net revenue in 1Q20 compared to 4Q19 is mainly explained by the 5% lower sales volume, which was partially offset by the 8% appreciation in the average price of the USD against the BRL.
PRODUCTION
| Production (k ton) | 1Q20 | 1Q19 | Δ Y-o-Y | 4Q19 | Δ Q-o-Q | LTM 1Q20 |
| Market Pulp | 2,337 | 2,173 | 8% | 2,267 | 3% | 8,921 |
| Paper | 307 | 292 | 5% | 319 | -4% | 1,255 |
| Total | 2,644 | 2,465 | 7% | 2,587 | 2% | 10,176 |
In the first quarter of 2020, the scheduled maintenance downtime was carried out at the Limeira Unit. Due to the current social context caused by the COVID-19 pandemic, aiming in protecting people and the society, the Company has decided to postpone scheduled maintenance downtimes planned for the year. Despite the downtime at the Limeira Unit, a 3% increase in pulp production was observed in relation to 4Q19 due to the resumption of the normal pace of some mills. In comparison with the same period last year, in addition to the normalization of the pace of some plants, there was also a greater concentration of scheduled maintenance shutdowns in 1Q19.
| Page 11 of 34 | |
1Q20 EARNINGS RELEASE | |
The new calendar of Suzano’s scheduled maintenance downtimes follows:
| Mill - Pulp capacity | 2019 | 2020 | 2021 | ||||||||||||||
| 1Q19 | 2Q19 | 3Q19 | 4Q19 | 1Q20 | 2Q20 | 3Q20 | 4Q20 | 1Q21 | 2Q21 | 3Q21 | 4Q21 | ||||||
| Aracruz - Mill A (ES) – 590 kt | To be defined | ||||||||||||||||
| Aracruz - Mill B (ES) – 830 kt | To be defined | ||||||||||||||||
| Aracruz - Mill C (ES) – 920 kt | To be defined | ||||||||||||||||
| Imperatriz (MA)² – 1,650 kt | No downtime | ||||||||||||||||
| Jacareí (SP) – 1,100 kt | |||||||||||||||||
| Limeira (SP)² – 690 kt | To be defined | ||||||||||||||||
| Mucuri - Mill 1 (BA)² – 600 kt | No downtime | ||||||||||||||||
| Mucuri - Mill 2 (BA) – 1,130 kt | To be defined | ||||||||||||||||
| Suzano (SP)² – 520 kt | No downtime | ||||||||||||||||
| Três Lagoas - Mill 1 (MS) – 1,300 kt | No downtime | ||||||||||||||||
| Três Lagoas - Mill 2 (MS) – 1,950 kt | No downtime | ||||||||||||||||
| Veracel (BA)¹ – 560 kt | To be defined | ||||||||||||||||
¹ Veracel is a joint operation between Suzano (50%) and Stora Enso (50%) with total annual capacity of 1,120 thousand tons.
² Includes integrated capacities.
COST OF GOODS SOLD
| COGS (R$ million) | 1Q20 | 1Q19 | Δ Y-o-Y | 4Q19 | Δ Q-o-Q | LTM 1Q20 |
| COGS (Income statement) | 4,820 | 4,725 | 2% | 5,810 | -17% | 20,839 |
| Depreciation, depletion and amortization1 | 1,381 | 2,235 | -38% | 1,549 | -11% | 6,281 |
| Cash COGS | 3,439 | 2,490 | 38% | 4,261 | -19% | 14,558 |
| Sales volume | 3,124 | 2,003 | 56% | 3,288 | -5% | 11,789 |
| Cash COGS/ton (R$/ton) | 1,101 | 1,243 | -11% | 1,296 | -15% | 1,235 |
1Includes PPA amortization.
Cash COGS in 1Q20 came to R$3,439 million, or R$1,101/ton. Compared to 1Q19, cash COGS increased 38%, mainly due to the higher sales volume and the 18% appreciation in the average USD against the BRL, partially offset by the lower production cost (especially in pulp). On a per-ton basis, cash COGS decreased 11% due to the lower production costs of pulp and paper affecting COGS.
Compared to 4Q19, cash COGS fell 19% due to the lower production cost (mainly in the pulp segment), the weaker Klabin sales volume effect and lower impact of non-recurring events, plant mix, and the lower total sales volume, with these factors partially offset by the 8% appreciation in average price of the USD against the BRL. On a per-ton basis, the 15% decrease is mainly explained by the same effects mentioned above.
SELLING EXPENSES
| Selling expenses (R$ million) | 1Q20 | 1Q19 | Δ Y-o-Y | 4Q19 | Δ Q-o-Q | LTM 1Q20 |
| Selling expenses (income statement) | 515 | 441 | 17% | 538 | -4% | 1,979 |
| Depreciation, depletion and amortization1 | 234 | 217 | 7% | 233 | 0% | 921 |
| Cash selling expenses | 281 | 224 | 26% | 305 | -8% | 1,058 |
| Sales volume | 3,124 | 2,003 | 56% | 3,288 | -5% | 11,789 |
| Cash selling expenses/ton (R$/ton) | 90 | 112 | -19% | 93 | -3% | 90 |
1Includes PPA amortization.
| Page 12 of 34 | |
1Q20 EARNINGS RELEASE | |
Cash selling expenses registered a 26% increase from 1Q19, mainly due to the 56% growth in sales volume and the 18% appreciation in the average price of the USD against the BRL. On a per-ton analysis, cash selling expenses fell 19%, mainly due to the higher dilution of the fixed portion of the item, partially offset by the exchange effect on expenses in foreign currency.
Compared to 4Q19, the 8% decrease in cash selling expenses is explained mainly by the lower sales volume and the lower operational costs, with these effects partially offset by the 8% appreciation in the average price of the USD against the BRL. Per-ton cash selling expenses decreased 3% due to the logistics expenses optimization in the paper business, despite the exchange variation effect.
GENERAL AND ADMINISTRATIVE EXPENSES
| General and Administrative Expenses (R$ million) | 1Q20 | 1Q19 | Δ Y-o-Y | 4Q19 | Δ Q-o-Q | LTM 1Q20 |
| General and Administrative Expenses (Income Statament) | 315 | 331 | -5% | 286 | 10% | 1,157 |
| Depreciation, depletion and amortization1 | 25 | 13 | 92% | (7)² | - | 38 |
| Cash general and administrative expenses | 290 | 318 | -9% | 293 | -1% | 1,119 |
| Sales volume | 3,124 | 2,003 | 56% | 3,288 | -5% | 11,789 |
| Cash general and administrative expenses/t (R$/ton) | 93 | 159 | -42% | 89 | 4% | 95 |
1Includes PPA amortization.
²Inverse effect due to the write-off of the PPA on contingencies (write-off of processes initially reassessed in the business combination).
Compared to 1Q19, the 9% decrease incash general and administrative expenses is explained by the lower expenses given thetransaction with Fibria and by the capture of synergies. On a per-ton analysis, the 42% reduction, in addition to the factors mentioned above, the performance was benefited by the dilution of the fixed portion of the item. Compared to 4Q19, cash general and administrative expenses were virtually stable. On a per-ton analysis, the increase of 4% refers mainly to the higher spending on salaries and benefits and the updating of contingencies.
Excluding the effect from PPA,“other operating income (expenses)” amounted to income of R$17 million in 1Q20, compared to the expense of R$19 million in 4Q19 and the income of R$137 million in 4Q19. In relation to 1Q19, the variation is explained mainly by the impact on the sale of other products (result from the asset divestments). Compared to 4Q19, the variation is mainly explained by the result of the adjustment to fair value of biological assets that occurred in that quarter.
ADJUSTED EBITDA
| Consolidated | 1Q20 | 1Q19 | Δ Y-o-Y | 4Q19 | Δ Q-o-Q | LTM 1Q20 |
| Adjusted EBITDA (R$ million)¹ | 3,026 | 2,761 | 10% | 2,465 | 23% | 10,988 |
| Adjusted EBITDA¹ Margin - ex-Klabin (%) | 45% | 50% | -5 p.p. | 37% | 8 p.p. | 42% |
| Sales Volume ex-Klabin (mil ton) | 3,086 | 1,948 | 58% | 3,125 | -1% | 11,268 |
| Adjusted EBITDA¹ ex-Klabin (R$/ton) | 981 | 1,417 | -31% | 789 | 24% | 975 |
¹ Excludes non-recurring items and PPA effects.
Adjusted EBITDA increased in 1Q20 compared to 1Q19, explained by: (i) the higher pulp sales volume (+65%); (ii) the appreciation in the average price of the USD against the BRL (+18%); and (iii) the decrease in cash COGS, as detailed above. These effects were partially offset by the lower net pulp price in USD (-34%). The 31% decrease in EBITDA per ton is basically explained by the price factor.
Compared to 4Q19, the 23% increase in Adjusted EBITDA is due to the higher average price of the USD to the BRL (+8%) and the lower cash COGS, with these effects partially offset by the lower sales volume and the lower average net pulp price. The 24% increase in per-ton Adjusted EBITDA is basically due to the exchange variation factor and the lower cash COGS, as explained above.
| Page 13 of 34 | |
1Q20 EARNINGS RELEASE | |
FINANCIAL RESULT
| Financial Result (R$ million) | 1Q20 | 1Q19 | Δ Y-o-Y | 4Q19 | Δ Q-o-Q |
| Financial Expenses | (1,086) | (993) | 9% | (1,055) | 3% |
| Interest on loans and financing (local currency) | (243) | (421) | -42% | (324) | -25% |
| Interest on loans and financing (foreign currency) | (643) | (448) | 44% | (557) | 15% |
| Capitalized interest1 | 4 | 1 | - | 2 | 64% |
| Other financial expenses | (204) | (125) | 63% | (176) | 16% |
| Financial Income | 121 | 149 | -19% | 100 | 21% |
| Interest on financial investments | 70 | 140 | -50% | 87 | -19% |
| Other financial income | 51 | 9 | - | 13 | 291% |
| Monetary and Exchange Variations | (12,420) | (455) | - | 1,418 | - |
| Foreign exchange variations (Debt) | (13,188) | (306) | - | 1,522 | - |
| Other foreign exchange variations | 768 | (149) | - | (104) | - |
| Derivative income (loss), net2 | (9,059) | (637) | - | 1,161 | - |
| Cash flow hedge | (3,361) | (75) | - | 474 | - |
| Debt hedge | (5,871) | (563) | - | 731 | - |
| Others3 | 175 | 2 | - | (44) | - |
| Net Financial Result | (22,444) | (1,936) | - | 1,624 | - |
¹ Capitalized interest due to construction in progress.
2Variation in mark-to-market adjustment (1Q20: -R$8,886 million | 4Q19: R$1,241 million), plus adjustments paid and received.
³ Includes commodity hedging and embedded derivatives.
Financial expenses amounted to R$1,086 million in 1Q20, increasing 9% and 3% compared to 1Q19 and 4Q19, respectively. In the prior-year comparison, the decrease in interest expenses in local currency is explained mainly by the 43% decline in the CDI, which stood at 6.40% in March 2019 and ended the first quarter of 2020 at 3.65%. The downward trend in interest rates was also observed in the international market (150 bps reduction in Federal Funds Rates in the period), however, it was offset by the 44% increase in interest expenses in foreign currency, given the appreciation in the USD against the BRL and the higher share of USD-denominated debt due to the arising from liability management transactions carried out over the period. Compared to 4Q19, the same factors above explain the variations, with the 25% drop in interest expenses in national currency due to a further reduction in the CDI, while the 15% increase in interest expenses in foreign currency is mainly explained the appreciation of the USD against the BRL.
Financial income in 1Q20 compared to 4Q19 increased 21%, reflecting the positive variation in “other financial income”, explained by the amortization of the goodwill related to the asset combination with Fibria and by the update of deposits into court, partially offset by the interest rates decrease. Compared to 1Q19, the reduction of interest with financial investments resulting from theSelic interest rate cuts (75 bps in the period) and of the interest rate of the international market that remunerates the cash balance abroad.
Inflation adjustment and exchange variation had a negative impact of R$12,420 million on the Company’s financial result in the quarter, due to the 29% appreciation in the end-of-period price of the USD against the BRL on the foreign-denominated portion of debt (76% of the total debt). Bear in mind that the accounting impact from exchange variation on foreign-denominated debt has a cash impact only on the respective maturities.
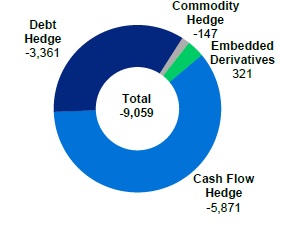
Derivative operations generated a loss of R$9,059 million in 1Q20, mainly due to the impact from the sharp local-currency depreciation and high volatility on debt and cash flow hedge operations. During 1Q20, the COVID-19 pandemic caused major impacts on world economies and risk aversion movements adversely affected the local currency, in the context of high volatility. There also was a less significant impact caused by the variations in the Pré, Cupom and Libor rate curves on operations. The mark-to-market adjustment of derivative instruments on March 31, 2020 was a loss of R$10,705 million, compared to a loss of R$1,819 million on December 30, 2019, representing a loss position of R$8,886 million.As with exchange variation, the impact from BRL depreciation on the derivatives portfolio has a cash impact only upon the respectivematurities. The net effect on cash, referring to the settlement of operations that matured in the first quarter was negative by R$173 million (negative by R$11 million related to debt hedge and R$162 million related to operational hedge).
| Page 14 of 34 | |
1Q20 EARNINGS RELEASE | |
Due to the aforementioned factors, thenet financial expense was R$22,444 million in 1Q20, compared to the net financial income of R$1,624 million in 4Q19 and the net financial expense of R$1,936 million in 1Q19.
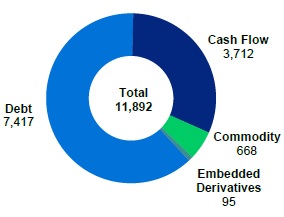
DERIVATIVE OPERATIONS
Suzano carries out derivative operations exclusively for hedging purposes. It is important to note that none of the company's hedge operations have margin calls. The following table reflects the position of derivative instruments on March 31, 2020:
| Hedge1 | Notional (US$ million) | Fair value (R$ million) | ||
| Mar/2020 | Dec/2019 | Mar/2020 | Dec/2019 | |
| Debt | 7,417 | 6,546 | (8,014) | (2,154) |
| Cash flow | 3,712 | 3,425 | (3,133) | 67 |
| Others2 | 763 | 680 | 442 | 268 |
| Total | 11,892 | 10,651 | (10,705) | (1,819) |
¹ See note 4 of the 1Q20 Financial Statements for more details and sensitivity analyses of fair value.
2Includes commodity hedge and embedded derivatives.
The Company’s currency hedging policy seeks to minimize the volatility of its cash generation and to provide greater flexibility to cash flow management. The policy determines that surplus dollars of its cash flow may be partially hedged (up to 75% of exchange variation exposure over the next 18 months) using plain vanilla instruments, such as Zero Cost Collars (ZCC) and Non-deliverable Forwards (NDF).
ZCC transactions establish minimum and maximum limits for the exchange rate that minimize adverse effects in the event of significant appreciation in the BRL. If the exchange rate is within such limits, the Company neither pays nor receives any financial adjustments. The characteristics allows for capturing greater benefits from export revenue in a potential scenario of USD appreciation within the range contracted. Therefore, the Company is protected in scenarios of extreme BRL appreciation. However, these transactions also limit potential gains in scenarios of extreme BRL depreciation.
On March 31, 2020, the outstanding notional value of operations involving forward USD sales through ZCCs was US$3,667 million, whose maturities are distributed from April 2020 to September 2021, with an average strike between R$4.09 to R$4.47. On the same date, the amount outstanding of the operations (notional) involving forward dollar sales through NDFs was US$45 million, whose maturities are distributed from April to September 2020 and with an average strike in a range from R$4.26 to R$4.28. In 1Q20, cash flow hedge operations resulted in a loss of R$3,361 million. The mark-to-market adjustment (fair value) of ZCC transactions was a loss of R$3,090 million and for NDFs was a loss of R$43 million at the end of the quarter. The difference between the result in the quarter and the marked to market (MtM) refers to adjustments paid during 1Q20.
The following table presents a sensitivity analysis of the cash impact the Company could experience on its cash flow hedge portfolio (ZCC and NDF) if the exchange rate remains the same as the closing FX for 1Q20 (R$ / US$ = 5.20) in the coming quarters; as well as what the variation should be the cash impact for each R$0.10 variation at the same reference exchange rate (1Q20). It is important to note that the values presented in the table reflect a forecast of the Company considering the closing curves in the period and may fluctuate depending on market conditions.
| Page 15 of 34 | |
1Q20 EARNINGS RELEASE | |
| Cash adjustment (R$ million)1 | |||||
| Maturity (up to) | Strike Range | Notional (US$ million) | Actual | R$ / US$ = 5.20 (1Q20) | Sensitivity at R$ 0.10 / US$ variation (+/-)1 |
| Zero Cost Collars | |||||
| 1Q20 | - | - | (162) | - | - |
| 2Q20 | 3.87 – 4.20 | 705 | - | (682) | 71 |
| 3Q20 | 3.93 – 4.10 | 705 | - | (744) | 71 |
| 4Q20 | 4.12 – 4.53 | 490 | - | (308) | 49 |
| 1Q21 | 4.17 – 4.60 | 655 | - | (378) | 66 |
| 2Q21 | 4.23 – 4.70 | 810 | - | (447) | 81 |
| 3Q21 | 4.34 – 4.94 | 302 | - | (121) | 30 |
| Total | 4.09 – 4.47 | 3,667 | (162) | (2,681) | 367 |
| NDF | |||||
| 2Q20 | 4.28 | 20 | - | (18) | 2 |
| 3Q20 | 4.26 | 25 | - | (22) | 3 |
| Total | 45 | (40) | 5 | ||
1Note: adjustment sensitivity for exchange rate above the strike.
The Company also uses currency and interest rate swaps to mitigate the effects from exchange and interest rate variations on the balance of its debt and on its cash flow. Contracts swapping different interest rates and inflation indexes may be entered to mitigate the mismatch between financial assets and liabilities.
On March 31, 2020, the Company held US$7,417 million (notional value) in swaps, distributed as shown in the table below. In 1Q20, the result of liability hedge transactions was a loss of R$5,871 million, mainly due to the BRL depreciation in the period. The mark-to-market (fair value) adjustment of these operations generated a loss of R$8,014 million at the end of the quarter.
| Notional (US$ million) | Fair value (R$ million) | |||||
| Debt hedge | Maturity (up to) | Currency | Mar/20 | Dec/19 | Mar/20 | Dec/19 |
| Swap (PRÉ x USD) | 2024 | USD | 350 | 350 | (565) | (33) |
| Swap (CDI x USD) | 2026 | USD | 3,099 | 3,116 | (6,366) | (1,940) |
| Swap (IPCA x USD) | 2023 | USD | 121 | 121 | (161) | 31 |
| Swap (LIBOR x USD) | 2026 | USD | 3,683 | 2,750 | (1,139) | (445) |
| Swap (IPCA x CDI) | 2023 | BRL | 1641 | 209 | 217 | 233 |
1Converted by the closing exchange rate (5.20).
The following table presents a sensitivity analysis¹ of the cash impact the Company could experience on its debt hedge portfolio (swaps) if the exchange rate remains the same as the closing exchange rate for 1Q20 (R$ / US$ = 5.20) in the coming quarters; as well as what the variation of the cash impact for each R$0.10 variation at the same reference exchange rate (1Q20). Note that the figures presented in the table reflect the Company’s forecast based on the end-of-period curves and could fluctuate depending on market conditions.
| Page 16 of 34 | |
1Q20 EARNINGS RELEASE | |
| Cash adjustment (R$ million) | ||||
| Maturity (up to) | Notional (US$ million) | Actual | R$ / US$ = 5.20 (1Q20) | Sensitivity at R$ 0.10 / US$ variation (+/-)1 |
| 1Q20 | - | (11) | - | - |
| 2020 (2Q-4Q) | 832 | - | (1,856) | 100 |
| 2021 | 333 | - | (500) | 20 |
| 2022 | 737 | - | (819) | 59 |
| 2023 | 2,181 | - | (339) | 49 |
| 2024 | 1,331 | - | (389) | 46 |
| 2025 | 845 | - | (1,053) | 90 |
| >2026 | 1,156 | - | (1,094) | 81 |
| Total | 7,417 | (11) | (6,049) | 445 |
¹ This sensitivity analysis assumes variation only in the exchange rate (R$ / US$), considering other variables constant.
The Company's other derivative transactions refer to the embedded derivative due to a forest partnership and commodity hedge (ship fuel), according to the table below.
Notional (US$ million) | Fair value (R$ million) | |||||
| Other hedges | Maturity (up to) | Index | Mar/20 | Dec/19 | Mar/20 | Dec/19 |
| Embedded Derivative | 2035 | Fixed USD | USD US-CPI | 668 | 679 | 589 | 269 |
| Commodities | 2021 | Brent/VLSFO | 95 | 0 | (147) | 0 |
| Total | 763 | 679 | 442 | 269 | ||
Forestry partnership agreements and timber supply agreements signed on December 30, 2013 by former Fibria Celulose S.A. are denominated in USD per cubic meter of standing timber, adjusted by U.S. inflation measured by the Consumer Price Index (CPI), which is not related to inflation in the economic environment where the forests are located and, hence, constitutes an embedded derivative. Such instrument, which is presented in the table above, consists of a swap contract with the short leg consisting of the variations in the U.S. CPI during the period of the aforementioned agreements. See note 4 of the 1Q20 Financial Statements for more details and for a sensitivity analysis of the fair value in the event of substantial variation in the U.S. CPI. On March 31, 2020, the outstanding amount (notional) of the operation was US$668 million. The result from the swap in 1Q20 was a gain of R$321 million. The mark-to-market adjustment (fair value) of such operations generated a gain of R$589 million at the end of the quarter.
The Company also is exposed to the international oil price, which is reflected in the logistics costs of sales to export markets. In this case, the Company analyzes the contracting of derivative financial instruments to fix the price of maritime fuel.
On March 31, 2020, the outstanding amount (notional) of this operation was US$95 million. The result from the swap in 1Q20 was a loss of R$146 million. The mark-to-market (fair value) adjustment of these operations generated a loss of R$146 million at the end of the quarter.
| Page 17 of 34 | |
1Q20 EARNINGS RELEASE | |
Result of Hedge Operations (R$ million) | Derivatives Notional (US$ million) | |
 |  |
NET INCOME (LOSS)
In 1Q20, the Company posted net loss of R$13,419 million, compared to net loss of R$1,229 million in 1Q19 and net income of R$1,175 million in 4Q19. The variation in relation to 1Q19 and 4Q19 is mainly explained by the net financial loss, which in turn is due to the effects from exchange variation on debt and by the gain/loss from derivative transactions, partially offset by the deferred income taxes credit (notably on the unrealized exchange rate variation expense). This impact was partially offset by the higher operating income in both comparison periods.
INDEBTEDNESS
| Debt (R$ million) | 03/31/2020 | 03/31/2019 | Δ Y-o-Y | 12/31/2019 | Δ Q-o-Q |
| Local Currency | 18,108 | 19,605 | -8% | 18,185 | 0% |
| Short Term | 3,552 | 3,740 | -5% | 3,563 | 0% |
| Long Term | 14,556 | 15,865 | -8% | 14,622 | 0% |
| Foreign Currency | 57,674 | 41,160 | 40% | 45,500 | 27% |
| Short Term | 2,972 | 3,694 | -20% | 2,665 | 12% |
| Long Term | 54,702 | 37,466 | 46% | 42,835 | 28% |
| Gross Debt | 75,782 | 60,765 | 25% | 63,684 | 19% |
| (-) Cash | 9,739 | 6,959 | 40% | 9,579 | 2% |
| Net debt | 66,043 | 53,806 | 23% | 54,105 | 22% |
| Net debt/Adjusted EBITDA1(x) - R$ | 6.0x | 3.4x | 2.6x | 5.0x | 1.0x |
| Net debt/Adjusted EBITDA1(x) - US$ | 4.8x | 3.3x | 1.5x | 4.9x | -0.1x |
¹ Excluding non-recurring items.
Gross debt on March 31, 2020 amounted to R$75.8 billion, composed of 91% long-term maturities and 9% short-term maturities. Debt denominated in foreign currency accounted for 76% of the Company's total debt, while debt denominated in local currency accounted for the remaining 24%. The percentage of gross debt denominated in foreign currency, considering the effect from debt hedge, was 94%. Gross debt increased by 19% (R$12.1 billion) compared to 4Q19, mainly as a result of the exchange variation on liabilities. Compared to 1Q19, the increase in gross debt reflects, especially, the effects from exchange variation in the period.
Suzano contracts debt in foreign currency debt as a natural hedge, since net operating cash generation is denominated in foreign currency (dollar) due to its predominantly exporting condition. This structural exposure allows it to match financing loan payments in dollars with receivable flows from sales.
| Page 18 of 34 | |
1Q20 EARNINGS RELEASE | |
Gross Debt Evolution (R$ million) |
 |
* Corresponding mainly to transaction costs (emission, fund raising, etc.) and impacts from surplus value resulting from the operation with Fibria.
On March 31, 2020, the total average cost of debt in USD was 4.6% p.a. (debt in BRL adjusted by the market swap curve). The average term of consolidated debt ended the quarter at 84 months (same average term as in Dec/19).
Type Expousure | Index Exposure | Currency Exposure1 | ||
 |  |  |
¹ Considers the portion of debt with currency swaps. The original debt was 76% denominated in USD and 24% in BRL.
Cash and cash equivalents at March 31, 2020 amounted to R$9,739 million, 57% of which was invested in local currency, in government and fixed-income bonds, and the remainder in short-term investments abroad.
The Company maintains two stand-by credit facilities in the aggregate amount of R$3,599 million available through 2024, with one facility denominated in local currency in the amount of R$1 billion and one facility in foreign currency in the amount of US$500 million. These funds help to improve the company’s liquidity conditions. As a result, the current cash position of R$9,739 million plus the facilities described above amount to a readily available cash position of R$13,338 million. At the end of the first quarter, the Company decided to withdraw the US$ 500 million revolving credit line to further strengthen its cash position at a time of greater market uncertainty in the context of the Covid-19 pandemic.
| Page 19 of 34 | |
1Q20 EARNINGS RELEASE | |
Net Debt (R$ and US$ million) | Net Debt / Adjusted EBITDA in | |
 |  |
On March 31, 2020,net debt stood at R$66.0 billion (US$12.7 billion), compared to R$54.1 billion (US$13.4 billion) on December 31, 2019. As described above, the increase in debt in BRL was due to the sharp BRL depreciation in the period.
The ratio ofnet debt to Adjusted EBITDA in BRL stood at 6.0x on March 31, 2020, compared to 5.0x at the end of 4Q19. The same ratio in USD, a measure established in Suzano’s financial policy, fell to 4.8x on March 31, 2020, compared to 4.9x at the end of 4Q19.
Amortization Schedule (R$ million) |
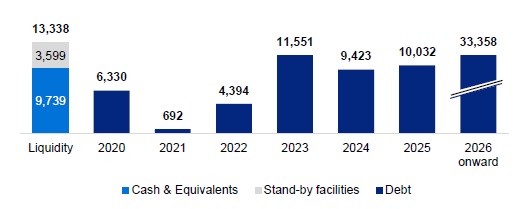 |
The breakdown of total gross debt between trade and non-trade finance on March 31, 2020 is shown below:
| 2020 | 2021 | 2022 | 2023 | 2024 | 2025 onward | Total | |
| Trade Finance¹ | 41% | 25% | 55% | 83% | 62% | 12% | 34% |
| Non Trade Finance² | 59% | 75% | 45% | 17% | 38% | 88% | 66% |
¹ ACC, ACE, NCE, PPE
² Bonds, BNDES, CRA, Debentures, among others.
CAPITAL EXPENDITURE
In 1Q20, capital investments (cash basis) amounted to R$873 million, down 39% and 37% from 1Q19 and 4Q19, respectively, mainlydue to the lower expenses with maintenance, modernization and land and forests. Compared to 1Q19, the 30% reduction in maintenance capex is related to the capture of synergies and the higher intensity of industrial carryovers in that period. Compared to 4Q19, the 25% drop was due to lower spending on projects (greater concentration in 4Q19) and forestry development.
| Page 20 of 34 | |
1Q20 EARNINGS RELEASE | |
The Capex for 2020 was revised to R$4.2 billion (from R$4.4 billion), mainly due to lower maintenance expenditures, due to initiatives related to project payments and scheduled downtimes postponements, without reducing the scope.
| Investiments (R$ million) | 1Q20 | 1Q19 | Δ Y-o-Y | 4Q19 | Δ Q-o-Q | LTM 1Q20 | Previous 2020 Guidance | Current 2020 Guidance |
| Maintenance | 690 | 980 | -30% | 925 | -25% | 3,371 | 3,642 | 3,508 |
| Industrial maintenance | 76 | 167 | -55% | 177 | -57% | 619 | 689 | 611 |
| Forestry maintenance | 594 | 786 | -24% | 703 | -16% | 2,623 | 2,808 | 2.801 |
| Others | 20 | 27 | -24% | 44 | -54% | 128 | 145 | 97 |
| Expansion and modernization | 41 | 79 | -49% | 92 | -56% | 248 | 267 | 248 |
| Land and forestry | 96 | 278 | -65% | 257 | -63% | 1,281 | 397 | 389 |
| Port terminals | 46 | 91 | -49% | 106 | -57% | 324 | 140 | 104 |
| Total | 873 | 1,428 | -39% | 1,380 | -37% | 5,224 | 4,446 | 4,249 |
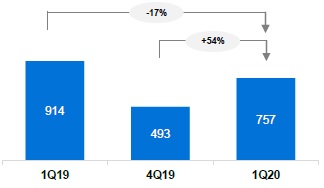
OPERATING CASH GENERATION
| Operating cash flow - Consolidated (R$ million) | 1Q20 | 1Q19 | Δ Y-o-Y | 4Q19 | Δ Q-o-Q | LTM 1Q20 |
| Adjusted EBITDA1 | 3,026 | 2,761 | 10% | 2,465 | 23% | 10,988 |
| Maintenance Capex2 | (690) | (980) | -30% | (925) | -25% | (3,371) |
| Operating Cash Flow | 2,336 | 1,781 | 31% | 1,540 | 52% | 7,618 |
| Operating Cash Flow (R$/ton) | 757 | 914 | -17% | 493 | 54% | 676 |
¹ Excludes non-recurring items and PPA effects.
² Cash basis.
³ Excludes sales volume from Klabin.
Operating cash generation, measured by Adjusted EBITDA less sustaining capex (cash basis), amounted to R$2,336 million in 1Q20. The increase compared to 1Q19 and 4Q19 reflects the higher EBITDA and lower maintenance capex, as previously explained. Per-ton operating cash flow performance compared to 1Q19 is primarily related to the decrease in price, which was partially offset by the appreciation in the USD against the BRL, higher sales volume and the lower maintenance capex. Compared to 4Q19, the increase reflects the appreciation in the USD against the BRL and the lower maintenance capex.
Operating Cash Flow per ton (R$/ton)
| Page 21 of 34 | |
1Q20 EARNINGS RELEASE | |
FREE CASH FLOW
| Free Cash Flow (R$ million) | 1Q20 | 1Q19 | Δ Y-o-Y | 4Q19 | Δ Q-o-Q | LTM 1Q20 |
| Adjusted EBITDA | 3,026 | 2,761 | 10% | 2,465 | 23% | 10,988 |
| (-) Total Capex1 | (938) | (1,678) | -44% | (1,060) | -12% | (4,436) |
| (+/-) D Working capital | (332) | (784) | -58% | (401) | -17% | 920 |
| (-) Net interest | (1,115) | (609) | 83% | (592) | 88% | (3,106) |
| (-) Income taxes | (29) | (311) | -91% | (55) | -48% | (110) |
| (-) Dividend payment | 0 | 0 | - | -5 | - | -607 |
| Free cash flow | 613 | (620) | - | 353 | 74% | 3,650 |
| (+) Capex ex-maintenance | 203 | 667 | -70% | 216 | -6% | 954 |
| (+) Dividend payment | 0 | 0 | -1 | 5 | - | 607 |
| Free cash flow – Adjusted2 | 816 | 47 | - | 574 | 42% | 5,211 |
1On an accrual basis.
2Free cash flow before dividend payment, capex ex-maintenance (accrual basis) and derivative adjustments.
Free cash flow stood at R$816 million in 1Q20, compared to R$47 million in 1Q19 and R$574 million in 4Q19. The increase observed in the comparison with the prior-year period is mainly due to the growth in Adjusted EBITDA, variation in working capital, the lower payment of Income Tax and Social Contribution and the reduction in maintenance capex. These effects were partially offset by the higher disbursements of interest. On working capital, the main variations were observed in accounts receivables (pulp price increase in BRL and the lower amount of credit letters operations due to the COVID-19 pandemic) and in the inventories (in line with the finished products decrease).
Compared to 4Q19, the 42% increase was largely due to the growth in Adjusted EBITDA, the lower maintenance CAPEX and the working capital reduction, with these effects partially offset by the higher expenses with interest.
COVID-19
Suzano has been adopting preventive and mitigatory measures aligned with the guidelines established by the Brazilian and international public health authorities to minimize the impacts from the COVID-19 pandemic with regard to people safety and the continuity of its businesses.
The Company’s actions are based on three pillars: (1) People; (2) Society; (3) Business Continuity.
| (1) | People: in order to provide security to its employees and third parties, Suzano adopted a series of measures and procedures to minimize their exposure to the new coronavirus. Regarding the protection of people, mention should also be made of the Company's decision to maintain all direct jobs and to advance 50% of the 13th salary for all employees. |
| (2) | Society: Suzano now understands its responsibility to the communities in which it operates and based on its guideline“It is only good for us, if it is good for the world”, made the donation of toilet paper and diapers produced by the Company to needy regions, in addition to other social initiatives such as the purchase of masks, 70% alcohol, respirators, improvements in hospitals and in projects in conjunction with other companies to increase the national production of respirators in order to assist in the health crisis experienced by Brazil. Suzano estimates to invest a total of approximately R$50 million in social initiatives. Regarding support to its business partners, the Company decided to maintain payment of 100% of the cost of the payroll of service providers' workers who will have their activities suspended for 60 days (until the end of May) in order to consequent job preservation. |
| (3) | Business continuity: to date the company continues with its normalized operations and there is a crisis management committee acting daily at corporate levels and in each business unit. Suzano has a business continuity plan developed for 100% of operations with different levels of contingency plan. |
| Page 22 of 34 | |
1Q20 EARNINGS RELEASE | |
To further increase its solid cash position given the uncertain scenario, at the end of the first quarterm the Company decided to withdraw the US$500 million revolving credit line credited on 4/1/2020, as mentioned above in the document.
The current situation arising from the new coronavirus also implies greater credit risk. The Company has been monitoring this risk, implementing measures to mitigate it and considers that it is adequately controlled. So far, there has been no significant financial impact.
Due to the social isolation measures adopted in Brazil and in several countries in the world, the demand for printing and writing papers was reduced and due to the uncertainty about its recovery, Suzano decided to make a temporary production stop with a 30-day forecast starting from April 27, 2020 and May 1, 2020, respectively, in the paper production lines of the Mucuri and Rio Verde mills. However, the reduction in production volumes resulting from this decision is not material to the business and to the Company's economic and financial performance. We note that in several countries around the world similar measures have already been announced to temporarily reduce the production of printing and writing papers.
An effect also resulting from the coronavirus concerns the decision to postpone Suzano's Extraordinary and Annual Shareholders Meetings (“AEGM”), initially called for April 24, 2020 and changed to May 22, 2020, in order to allow the holding in digital modality, with content kept for deliberation by the shareholders.
Finally, it is also opportune to inform that, as a result of the current scenario, the Company has made a vast communication effort to further increase the interaction with its main stakeholders, with the objective of guaranteeing the adequate transparency and flow of information with the them in a timely manner to the dynamics of the social and economic conjuncture. More information about Suzano's disclosures to investors about Covid-19; as well as details of the main initiatives and impacts, are available on its Investor Relations website:
| · | Notices to Market (March 17, 2020 and March 30, 2020); |
| · | Conference call “COVID-19” (April 9, 2020) |
SYNERGIES
On February 12, 2020, through Material Fact, the Company updated its projections for the synergy gains resulting from its business combination with Fibria Celulose S.A. Suzano expects to capture, from 2019 to 2021, operating synergies estimated at between R$1,100 million and R$1,200 million per year (before taxes), and on a recurring basis after 2021, through reductions in costs, expenses and capital expenditures in the procurement, forest, industrial, logistics, sales, administrative and people areas, and also expects to capture tax synergies that result in deductions of around R$2.0 billion a year, from the merger of Fibria with Suzano. Synergies are being captured as planned.
The estimated amount of operating synergies mentioned above does not include the costs of implementing the initiatives linked to these synergies, which remain estimated by the Company at approximately R$200 million until 2021.
TOTAL OPERATIONAL EXPENDITURES - PULP
According to Material Fact released on February 13, 2020, the forecast for total operational disbursement forecast for 2024 is maintained at approximately R$1,300/ton and the evolution of the indicator continues as planned.
EVENTS AFTER THE REPORTING PERIOD
Drawdown of Standby Credit Facility
On April 2, the company concluded the drawdown of US$500 million from its standby credit facility held at certain financial institutions, at the cost of Libor + 1.30% p.a., with maturity on February 2024.
The disbursement is one of the preventative measures being taken by the Company to mitigate any impacts arising from the COVID-19 pandemic and to further strengthen its cash position.
| Page 23 of 34 | |
1Q20 EARNINGS RELEASE | |
CAPITAL MARKETS
On March 31, 2020, Suzano stock was quoted at R$35.79 (SUZB3) and US$6.87 (SUZ). The Company’s stock is listed on the Novo Mercado, the trading segment of the São Paulo Exchange (B3 – Brasil, Bolsa e Balcão) with the highest corporate governance standards, and also is traded on the New York Stock Exchange (NYSE) - Level II.
Stock Performance

Source: Bloomberg.
Liquidity - SUZB3

Source: Bloomberg.
On March 31, 2020, the capital stock of the Company was represented by 1,361,263,584 common shares, of which 12,042,004 were held in treasury. Suzano’s market capitalization stood at R$48.7 billion on March 31, 2020. In 1Q20, the free-float corresponded to 53.3% of the total capital.
| Page 24 of 34 | |
1Q20 EARNINGS RELEASE | |
Free-Float Distribution at 03/31/2020 (B3 + NYSE) | Ownership structure (03/31/2020) |
 | 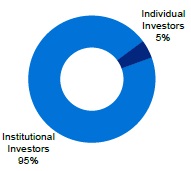 |  |
FIXED INCOME
| Unit | Mar/19 | Dec/19 | Mar/20 | Δ Y-o-Y | Δ Q-o-Q | |
| Suzano 2021 – Price | USD/k | 104.57 | 103.59 | - | - | - |
| Suzano 2021 – Yield | % | 3.27 | 2.41 | - | - | - |
| Fibria 2024 – Price | USD/k | 105.24 | 108.45 | 97.33 | -7.5% | -10.3% |
| Fibria 2024 – Yield | % | 4.10 | 3.16 | 5.99 | 46.1% | 89.7% |
| Fibria 2025 – Price | USD/k | 98.69 | 103.59 | 93.18 | -5.6% | -10.0% |
| Fibria 2025 – Yield | % | 4.17 | 3.22 | 5.65 | 35.5% | 75.3% |
| Suzano 2026 – Price | USD/k | 106.63 | 112.02 | 95.62 | -10.3% | -14.6% |
| Suzano 2026 – Yield | % | 4.68 | 3.66 | 6.61 | 41.4% | 80.5% |
| Fibria 2027 – Price | USD/k | 105.00 | 109.64 | 97.25 | -7.4% | -11.3% |
| Fibria 2027 – Yield | % | 4.72 | 3.92 | 6.00 | 26.9% | 53.0% |
| Suzano 2029 – Price | USD/k | 106.45 | 111.01 | 93.01 | -12.6% | -16.2% |
| Suzano 2029 – Yield | % | 5.14 | 4.50 | 7.08 | 37.7% | 57.2% |
| Suzano 2030 – Price | USD/k | - | 102.57 | 88.59 | - | -13.6% |
| Suzano 2030 – Yield | % | - | 4.68 | 6.60 | - | 41.1% |
| Suzano 2047 – Price | USD/k | 111.61 | 117.66 | 97.37 | -12.8% | -17.2% |
| Suzano 2047 – Yield | % | 6.13 | 5.71 | 7.22 | 17.9% | 26.4% |
| Treasury 10 years | % | 2.41 | 1.92 | 0.67 | -72.2% | -65.1% |
Note: Senior Notes issued with face value of 100 USD/k
RATING
| Agência | National Scale | Global Scale | Outlook |
| Fitch Ratings | AAA | BBB- | Negative |
| Standard & Poor’s | brAAA | BBB- | Negative |
| Moody’s | Aaa.br | Ba1 | Stable |
| Page 25 of 34 | |
1Q20 EARNINGS RELEASE | |
UPCOMING EVENTS
Earnings Conference Call (1Q20)
Date:May 15, 2020 (Friday)
| Portuguese (simultaneous translation) | English |
| 10:00 a.m. (Brasília) | 10:00 a.m. (Brasília) |
| 9:00 a.m. (New York) | 9:00 a.m. (New York) |
| 2:00 p.m. (London) | 2:00 p.m. (London) |
| Tel.: +55 (11) 3181-8565 | Tel.: +1 412 717-9627 |
Please connect 10 minutes before the conference call is scheduled to begin.
The conference call will be held in English, feature a slide presentation and be transmitted simultaneously via webcast. The access links will be available on the Company’s Investor Relations website. (www.suzano.com.br/ri).
If you are unable to participate, the webcast link will be available for future consultation on the Investor Relations website of Suzano S.A.
IR CONTACTS
Marcelo Bacci
Camila Nogueira
Camilla Galvão
Luiz Otavio Fonseca
Roberto Costa
Tel.: +55 (11) 3503-9330
ri@suzano.com.br
www.suzano.com.br/ri
| Page 26 of 34 | |
APPENDICES
APPENDIX 1 – Operating Data
Revenue breakdown (R$ '000) | 1Q20 | 1Q19 | Δ Y-o-Y | 4Q19 | Δ Q-o-Q |
| Exports | 5,818,754 | 4,385,794 | 33% | 5,632,704 | 3% |
| Pulp | 5,488,356 | 4,096,451 | 34% | 5,229,914 | 5% |
| Paper | 330,398 | 289,343 | 14% | 402,790 | -18% |
| Domestic Market | 1,162,039 | 1,313,207 | -12% | 1,416,255 | -18% |
| Pulp | 398,367 | 505,535 | -21% | 401,800 | -1% |
| Paper | 763,672 | 807,672 | -5% | 1,014,455 | -25% |
| Total Net Revenue | 6,980,793 | 5,698,999 | 22% | 7,048,959 | -1% |
| Pulp | 5,886,723 | 4,601,986 | 28% | 5,631,714 | 5% |
| Paper | 1,094,070 | 1,097,013 | 0% | 1,417,245 | -23% |
| Sales volume (‘000) | 1Q20 | 1Q19 | Δ Y-o-Y | 4Q19 | Δ Q-o-Q |
| Exports | 2,711,662 | 1,604,730 | 69% | 2,810,849 | -4% |
| Pulp | 2,626,539 | 1,527,621 | 72% | 2,699,546 | -3% |
| Paper | 85,123 | 77,109 | 10% | 111,303 | -24% |
| Paperboard | 15,599 | 10,940 | 43% | 17,915 | -13% |
| Printing & Writing | 68,666 | 65,855 | 4% | 92,640 | -26% |
| Other paper1 | 857 | 314 | 173% | 748 | 15% |
| Domestic Market | 412,449 | 398,574 | 3% | 477,322 | -14% |
| Pulp | 229,758 | 201,462 | 14% | 219,973 | 4% |
| Paper | 182,691 | 197,112 | -7% | 257,349 | -29% |
| Paperboard | 28,805 | 30,174 | -5% | 34,996 | -18% |
| Printing & Writing | 122,867 | 145,321 | -15% | 190,773 | -36% |
| Other paper1 | 31,019 | 21,617 | 43% | 31,580 | -2% |
| Total Sales Volume | 3,124,111 | 2,003,304 | 56% | 3,288,171 | -5% |
| Pulp | 2,856,297 | 1,729,083 | 65% | 2,919,519 | -2% |
| Paper | 267,814 | 274,221 | -2% | 368,652 | -27% |
| Paperboard | 44,404 | 41,114 | 8% | 52,911 | -16% |
| Printing & Writing | 191,533 | 211,177 | -9% | 283,413 | -32% |
| Other paper1 | 31,876 | 21,931 | 45% | 32,328 | -1% |
Average net price (R$/ton) | 1Q20 | 1Q19 | Δ Y-o-Y | 4Q19 | Δ Q-o-Q |
| Exports | 2,146 | 2,733 | -21% | 2,004 | 7% |
| Pulp | 2,090 | 2,682 | -22% | 1,937 | 8% |
| Paper | 3,881 | 3,752 | 3% | 3,619 | 7% |
| Domestic Market | 2,817 | 3,295 | -14% | 2,967 | -5% |
| Pulp | 1,734 | 2,509 | -31% | 1,827 | -5% |
| Paper | 4,180 | 4,098 | 2% | 3,942 | 6% |
| Total | 2,234 | 2,845 | -21% | 2,144 | 4% |
| Pulp | 2,061 | 2,662 | -23% | 1,929 | 7% |
| Paper | 4,085 | 4,000 | 2% | 3,844 | 6% |
| Page 27 of 34 | |
1Q20 EARNINGS RELEASE | |
Average net price (US$/ton) | 1Q20 | 1Q19 | Δ Y-o-Y | 4Q19 | Δ Q-o-Q |
| Exports | 481 | 725 | -34% | 487 | -1% |
| Pulp | 469 | 711 | -34% | 471 | -1% |
| Paper | 871 | 995 | -13% | 879 | -1% |
| Domestic Market | 632 | 874 | -28% | 721 | -12% |
| Pulp | 389 | 665 | -42% | 444 | -13% |
| Paper | 938 | 1,087 | -14% | 957 | -2% |
| Total | 501 | 754 | -34% | 521 | -4% |
| Pulp | 462 | 706 | -35% | 469 | -2% |
| Paper | 916 | 1,061 | -14% | 934 | -2% |
¹ Paper of other manufacturers sold by Suzano and tissue paper.
FX Rate R$/US$ | 1Q20 | 1Q19 | Δ Y-o-Y | 4Q19 | Δ Q-o-Q |
| Closing | 5.20 | 3.90 | 4% | 4.03 | -3% |
| Average | 4.46 | 3.77 | 8% | 4.12 | 4% |
| Page 28 of 34 | |
1Q20 EARNINGS RELEASE | |
APPENDIX 2 – Consolidated Statement of Income and Goodwill Amortization
Income Statement (R$ ‘000) | 1Q20 | 1Q19 | Δ Y-o-Y | 4Q19 | Δ Q-o-Q |
| Net Revenue | 6,980,793 | 5,698,999 | 22% | 7,048,959 | -1% |
| Cost of Goods Sold | (4,819,999) | (4,724,893) | 2% | (5,810,056) | -17% |
| Gross Debt | 2,160,794 | 974,106 | 122% | 1,238,903 | 74% |
| Gross Margin | 31.0% | 17.1% | 14 p,p, | 17.6% | 13 p,p, |
| Operating Expense/Income | (812,330) | (789,294) | 3% | (675,514) | 20% |
| Selling Expenses | (514,936) | (441,303) | 17% | (537,981) | -4% |
| General and Administrative Expenses | (314,836) | (330,765) | -5% | (285,586) | 10% |
| Other Operating Income (Expenses) | 16,731 | (18,884) | - | 137,307 | -88% |
| Equity Equivalence | 711 | 1,658 | -57% | 10,746 | -93% |
| EBIT | 1,348,464 | 184,812 | 630% | 563,389 | 139% |
| Depreciation, Amortization & Depletion | 1,648,203 | 2,471,286 | -33% | 1,778,852 | -7% |
| EBITDA | 2,995,956 | 2,654,439 | 13% | 2,331,495 | 28% |
| EBITDA Margin (%) | 42.9% | 46.6% | -4 p,p, | 33.1% | 10 p,p, |
| Adjusted EBITDA1 | 3,026,170 | 2,761,243 | 10% | 2,465,382 | 23% |
| Adjusted EBITDA Margin1 | 43.3% | 48.5% | -5 p,p, | 35.0% | 8 p,p, |
| Net Financial Result | (22,444,048) | (1,936,143) | - | 1,624,575 | - |
| Financial Expenses | 120,754 | 149,322 | -19% | 86,174 | 40% |
| Financial Revenues | (1,086,424) | (992,804) | 9% | (1,041,368) | 4% |
| Exchange Rate Variation | (12,419,586) | (455,727) | - | 1,418,117 | - |
| Net Proceeds Generated by Derivatives | (9,058,792) | (636,934) | - | 1,161,652 | - |
| Earnings Before Taxes | (21,095,584) | (1,751,331) | - | 2,187,964 | - |
| Income and Social Contribution Taxes | 7,676,523 | 522,199 | - | (1,013,188) | - |
| Net Income (Loss) | (13,419,061) | (1,229,132) | - | 1,174,776 | - |
| Net Margin | -192.2% | -21.6% | - | 16.7% | - |
1Excluding non-recurring items and PPA effects.
| Goodwill amortization - PPA (R$ ‘000) | 1Q20 | 1Q19 | Δ Y-o-Y | 4Q19 | Δ Q-o-Q |
| COGS | (153,078) | (1,360,990) | -89% | (138,646) | 10% |
| Selling Expenses | (206,467) | (205,245) | 1% | (206,700) | 0% |
| General and administrative expenses | (4,567) | (1,025) | - | 21,436 | - |
| Other operational revenues (expenses) | (8,434) | (3,607) | - | (121) | - |
| Financial results | (18,479) | (2,167) | - | (108,357) | -83% |
| Page 29 of 34 | |
1Q20 EARNINGS RELEASE | |
APPENDIX 3 – Consolidated Balance Sheet
| Assets (R$ ´000) | 03/31/2020 | 12/31/2019 | 03/31/2019 |
| Current Assets | |||
| Cash and cash equivalents | 4,548,329 | 3,249,127 | 3,095,885 |
| Financial investments | 5,009,160 | 6,150,631 | 3,687,230 |
| Trade accounts receivable | 4,447,957 | 3,035,817 | 3,507,439 |
| Inventories | 4,262,511 | 4,685,595 | 8,044,651 |
| Recoverable taxes | 836,043 | 997,201 | 944,407 |
| Derivative financial instruments | 128,845 | 260,273 | 615,887 |
| Other assets | 424,971 | 505,593 | 424,967 |
| Total Current Assets | 19,657,816 | 18,884,237 | 20,320,466 |
| Non-Current Assets | |||
| Recoverable taxes | 679,779 | 708,914 | 771,696 |
| Financial investments | 181,564 | 179,703 | 175,559 |
| Derivative financial instruments | 959,549 | 838,699 | 760,448 |
| Biological assets | 10,431,416 | 10,571,499 | 9,752,742 |
| Investments | 326,879 | 322,446 | 228,684 |
| Property, plant and equipment | 40,701,410 | 41,120,945 | 41,998,207 |
| Right of use | 3,956,304 | 3,850,237 | 3,910,574 |
| Intangible | 17,468,599 | 17,712,803 | 18,465,253 |
| Other assets | 11,079,113 | 3,718,742 | 2,924,222 |
| Total Non-Current Assets | 85,784,613 | 79,023,988 | 78,987,385 |
| Total Assets | 105,442,429 | 97,908,225 | 99,307,851 |
| Liabilities and Equity (R$ ´000) | 31/03/2020 | 31/12/2019 | 31/03/2019 |
| Current Liabilities | |||
| Trade accounts payable | 2,408,286 | 2,376,459 | 4,049,078 |
| Loans, financing and debentures | 6,523,908 | 6,227,951 | 7,422,784 |
| Lease liabilities | 664,651 | 656,844 | 504,828 |
| Derivative financial instruments | 4,642,367 | 893,413 | 808,560 |
| Taxes payable | 226,565 | 307,639 | 228,240 |
| Payroll and charges | 308,756 | 400,435 | 303,419 |
| Liabilities for assets acquisitions and subsidiaries | 116,792 | 94,414 | 487,682 |
| Dividends payable | 5,714 | 5,720 | 11,343 |
| Other liabilities | 370,800 | 516,320 | 399,204 |
| Total Current Liabilities | 15,267,839 | 11,479,195 | 14,215,138 |
| Non-Current Liabilities | |||
| Loans, financing and debentures | 69,257,752 | 57,456,375 | 53,341,845 |
| Lease liabilities | 4,062,710 | 3,327,226 | 3,511,378 |
| Liabilities for assets acquisitions and subsidiaries | 516,979 | 447,201 | 516,815 |
| Provision for judicial liabilities | 3,460,373 | 3,512,477 | 3,527,818 |
| Derivative financial instruments | 7,150,959 | 2,024,500 | 2,108,659 |
| Other liabilities | 1,060,940 | 1,573,282 | 1,732,846 |
| Total Non-Current Liabilities | 85,509,713 | 68,341,061 | 64,739,361 |
| Shareholders’ Equity | |||
| Share capital | 9,235,546 | 9,235,546 | 9,269,281 |
| Capital reserves | 6,198,899 | 6,198,599 | 6,165,406 |
| Retained earnings reserves | 317,144 | 317,144 | 3,677,153 |
| Other reserves | 2,205,836 | 2,221,341 | 2,332,963 |
| Retained loss | (13,409,659) | - | (1,213,666) |
| Total Equity | 4,547,766 | 17,972,630 | 20,231,137 |
| Non-controlling shareholders interests | 117,111 | 115,339 | 122,215 |
| Total Liabilities and Equity | 105,442,429 | 97,908,225 | 99,307,851 |
| Page 30 of 34 | |
1Q20 EARNINGS RELEASE | |
APPENDIX 4 – Consolidated Statement of Cash Flow
| Cash Flow (R$ ‘000) | 1Q20 | 1Q19 |
| Cash flow from operating activities | ||
| Net income/(loss) for the period | (13,419,061) | (1,229,132) |
| Depreciation, depletion and amortization | 1,590,393 | 2,443,326 |
| Amortization of fair value adjustment - net financial result | - | - |
| Amortization of right of use | 39,330 | 27,959 |
| Interest expense on lease liabilities | 95,350 | 38,715 |
Results from sale and disposals of property, plant and equipment and biological assets, net | 4,488 | (11,288) |
| Equity equivalence | (711) | (1,658) |
| Exchange rate and monetary variations, net | 12,419,586 | 455,727 |
| Interest expenses with loans, financing and debentures, net | 886,270 | 823,958 |
| Accrual of interest on marketable securities | (58,870) | (228,047) |
| Amortization of fundraising cost | 25,250 | 31,574 |
| Deferred income tax and social contribution expenses | (7,730,883) | (651,448) |
| Interest on employee benefits | 13,195 | 13,421 |
| Provision/ (Reversal) for judicial liabilities | (8,772) | (10,296) |
| Derivative (gains) losses, net | 9,058,792 | 636,934 |
| Allowance for doubtful accounts, net | 5,522 | 7,724 |
| Provision for (reversal of) inventory losses and write-offs | 16,168 | (1,739) |
| Provision for loss of ICMS credits, net | 19,571 | 37,063 |
| Other | 5,439 | 65,227 |
| Decrease (increase) in assets | 118,377 | (467,459) |
| Trade accounts receivables | (608,145) | 331,901 |
| Inventories | 424,128 | (942,669) |
| Recoverable taxes | 200,988 | 58,745 |
| Other assets | 101,406 | 84,564 |
| Increase (decrease) in liabilities | (454,731) | (316,560) |
| Trade accounts payables | (94,248) | 75,087 |
| Taxes payable | (59,487) | 245,692 |
| Payroll and charges | (92,262) | (332,520) |
| Other liabilities | (208,734) | (304,819) |
| Cash provided by operations, net | 2,624,703 | 1,664,001 |
| Payment of interest with financing, loans and debentures | (1,167,141) | (783,745) |
| Interest received from marketable securities | 52,486 | 175,057 |
| Payment of income taxes | (28,931) | (310,977) |
| Cash provided by operating activities | 1,481,117 | 744,336 |
| Investing activities | ||
| Marketable securities, net | 1,145,994 | 21,756,512 |
| Increase of capital in subsidiaries and associates | - | (11,216) |
| Advance for acquisition of wood for partnership | (68,957) | (126,866) |
| Acquisition of subsidiaries, net cash | - | (26,002,541) |
| Additions to property, plant and equipment | (878,119) | (1,497,566) |
| Proceeds from sale of assets | 27,905 | 33,933 |
| Cash used in investing activities, net | 226,823 | (5,847,744) |
| Financing activities | ||
| Proceeds from loans, financing and debentures | 3,663,623 | 7,671,829 |
| Payment of derivative transactions | (172,797) | 24,765 |
| Payment of loans, financing and debentures | (4,503,548) | (3,735,541) |
| Payment of leases | (157,209) | (118,237) |
| Payment of dividends | - | (68) |
| Liabilities for assets acquisitions and subsidiaries | (2,838) | (1,701) |
| Other financing | - | (377) |
| Cash provided (used) by financing activities, net | (1,172,769) | 3,840,670 |
| Exchange variation on cash and cash equivalents | 764,031 | (28,830) |
| Increase (reduction) in cash and cash equivalents | 1,299,202 | (1,291,568) |
| Cash and cash equivalents at the beginning for the period | 3,249,127 | 4,387,453 |
| Cash and cash equivalents at the end for the period | 4,548,329 | 3,095,885 |
| Increase (reduction) in cash and cash equivalents | 1,299,202 | (1,291,568) |
| Page 31 of 34 | |
1Q20 EARNINGS RELEASE | |
APPENDIX 5 – EBITDA
| (R$ '000, except where otherwise indicated) | 1Q20 | 1Q19 |
| Net income | (13,419,061) | (1,229,132) |
| Net Financial Result | 22,444,048 | 1,936,143 |
| Income and Social Contribution Taxes | (7,676,523) | (522,199) |
| EBIT | 1,348,464 | 184,812 |
| Depreciation, Amortization and Depletion | 1,648,202 | 2,471,286 |
| EBITDA1 | 2,995,955 | 2,654,439 |
| EBITDA Margin | 42.9% | 46.6% |
| Expenses with Fibria's transaction | 916 | 69,372 |
| Indemnity – FACEPA | - | 413 |
| Facepa Fixed Asset Adjustment | (1,093) | - |
| Fixed asset write down | 0 | 1,858 |
| Accruals for losses on ICMS credits | 15,366 | 35,158 |
| ICMS accrual complement | 2,632 | - |
| Expenses with obligations and contract cancellations | 6,008 | 0 |
| PPA effect (asset write down) | 5,793 | 0 |
| Other | 594 | 2 |
| Adjusted EBITDA | 3,026,170 | 2,761,241 |
| EBITDA Margin | 43.3% | 48.5% |
¹ The Company's EBITDA is calculated in accordance with CVM Instruction 527 of October 4, 2012.
| Page 32 of 34 | |
1Q20 EARNINGS RELEASE | |
APPENDIX 6 – Segmented Income Statement
Segmented Financial Statement (R$ '000) | 1Q20 | 1Q19 | ||||||
| Pulp | Paper | Non Segmented | Total Consolidated | Pulp | Paper | Non Segmented | Total Consolidated | |
| Net Revenue | 5,886,724 | 1,094,070 | - | 6,980,793 | 4,601,986 | 1,097,013 | - | 5,698,999 |
| Cost of Goods Sold | (4,129,176) | (690,824) | - | (4,819,999) | (3,980,055) | (744,838) | - | (4,724,893) |
| Gross Profit | 1,757,548 | 403,246 | - | 2,160,794 | 621,931 | 352,175 | - | 974,106 |
| Gross Margin | 29.9% | 36.9% | - | 31.0% | 13.5% | 32.1% | - | 17.1% |
| Operating Expense/Income | (631,644) | (180,686) | - | (812,330) | (596,505) | (192,789) | - | (789,294) |
| Selling Expenses | (418,221) | (96,715) | - | (514,936) | (354,200) | (87,103) | - | (441,303) |
| General and Administrative Expenses | (224,053) | (90,783) | - | (314,836) | (228,760) | (102,005) | - | (330,765) |
| Other Operating Income (Expenses) | 16,592 | 139 | - | 16,731 | (13,545) | (5,339) | - | (18,884) |
| Equity Equivalence | (5,961) | 6,672 | - | 711 | - | 1,658 | - | 1,658 |
| EBIT | 1,125,904 | 222,559 | - | 1,348,464 | 25,426 | 159,386 | - | 184,812 |
Depreciation, Amortization & Depletion | 1,539,864 | 108,339 | - | 1,648,203 | 2,351,650 | 119,635 | - | 2,471,285 |
| EBITDA | 2,671,730 | 324,226 | - | 2,995,956 | 2,377,076 | 277,363 | - | 2,654,439 |
| EBITDA Margin | 45.4% | 29.6% | - | 42.9% | 51.7% | 25.3% | - | 46.6% |
| Adjusted EBITDA1 | 2,708,584 | 317,586 | - | 3,026,170 | 2,471,213 | 290,030 | - | 2,761,243 |
| Adjusted EBITDA Margin1 | 46.0% | 29.0% | - | 43.3% | 53.7% | 26.4% | - | 48.5% |
| Net Financial Result | - | - | (22,444,048) | (22,444,048) | - | - | (1,936,143) | (1,936,143) |
| Earnings Before Taxes | 1,125,904 | 222,559 | (22,444,048) | (21,095,584) | 25,425 | 159,387 | (1,936,143) | (1,751,331) |
Income and Social Contribution Taxes | - | - | 7,676,523 | 7,676,523 | - | - | 522,199 | 522,199 |
| Net Income (Loss) | 1,125,904 | 222,559 | (14,767,525) | (13,419,061) | 25,425 | 159,387 | (1,413,944) | (1,229,132) |
| Net Margin | 19.1% | 20.3% | - | -192.2% | 0.5% | 14.5% | - | -21.6% |
1 Excluding non-recurring items and PPA effects.
| Page 33 of 34 | |
1Q20 EARNINGS RELEASE | |
Forward-Looking Statements
This release may contain forward-looking statements. Such statements are subject to known and unknown risks and uncertainties that could cause the expectations expressed to not materialize or differ substantially from expected results. These risks include, among others, changes in future demand for the Company’s products, changes in factors affecting domestic and international product prices, changes in the cost structure, changes in the seasonal patterns of markets, changes in prices charged by competitors, foreign exchange variations, changes in the political or economic situation of Brazil, as well as emerging and international markets. The forward-looking statements were not reviewed by our independent auditors.
| Page 34 of 34 | |