Exhibit 99.1
 | Earnings Conference Call 1Q20 1 |
 | Disclaimer This presentation contains certain statements that are considered “forward-looking statements,” as defined in Section 27A of the Securities Act of 1933 and in Section 21E of the Securities Exchange Act of 1934, as amended. Some of these forward-looking statements are identified with words such as “believe,” “may,” “could,” “would,” “possible,” “will,” “should,” “expect,” “intend,” “plan,” “anticipate,” “estimate,” “potential,” “outlook” or “continue,” as well as the negative forms of these words, other terms of similar meaning or the use of future dates. The forward-looking statements in this presentation include, but are not limited to, statements relating to the declaration or payment of dividends, implementation of key operating and financial strategies and investment plans, the direction of future operations and factors or trends that affect the financial situation, liquidity or operating results are a few examples of forward-looking statements. These statements reflect the current vision held by Management and are subject to diverse risks and uncertainties. Such statements are qualified in accordance with the inherent risks and uncertainties involving future expectations in general, and actual results could differ materially from those currently expected due to diverse risks and uncertainties. There is no guarantee that the expected events, trends or results will actually occur. The statements are based on diverse assumptions and factors, which include general macroeconomic and market conditions, industry conditions and operating factors. Any changes in such assumptions or factors could cause actual results to differ materially from current expectations. Suzano does not undertake any obligation to update any of these forward-looking statements as a result of new information, future events or otherwise, except when expressly required by law. All forward-looking statements in this presentation are qualified in their entirety by this disclaimer. NO OFFER OR BID This presentation is merely for information purposes and is neither an offer to sell nor a tender offer for the subscription or purchase of shares, nor is it a substitute for any materials that Suzano will file, if requested, with the U.S. Securities and Exchange Commission ("SEC"). No securities offering will be carried out in the United States other than through a prospectus that meets the requirements of Section 10 of U.S. Securities Act of 1933, as amended, or in accordance with any exemption defined in said law. |
 | Executive Summary – 1Q20 Resilience in adverse environment Pulp: Paper1: 2.9 million tons 239 thousand tons Sales Volume Index Adjusted EBITDA: R$3.0 billion Inventory reduction - pulp: ~500 thousand tons Operating Cash Generation2: R$2.3 billion Cash cost ex-downtimes: R$596/ton Capex 2020: reduction from R$4.4 billion to R$4.2 billion Operational Performance Liquidity: Net debt: Leverage3: Average term4: US$2.4 billion US$12.7 billion (vs. US$13.4 billion 4Q19) 4.8x in US$ (6.0x in R$) 82 months Financial Management 1 Excludes Consumer Goods unit. | 2 Operating Cash Generation = Adjusted EBITDA less sustaining capex. | 3 Net debt / Adjusted EBITDA in the last 12 months. | 4 Includes revolving credit facility withdrawn on April 1st, 2020. 3 2) Robust Balance Sheet 1) Business Resilience |
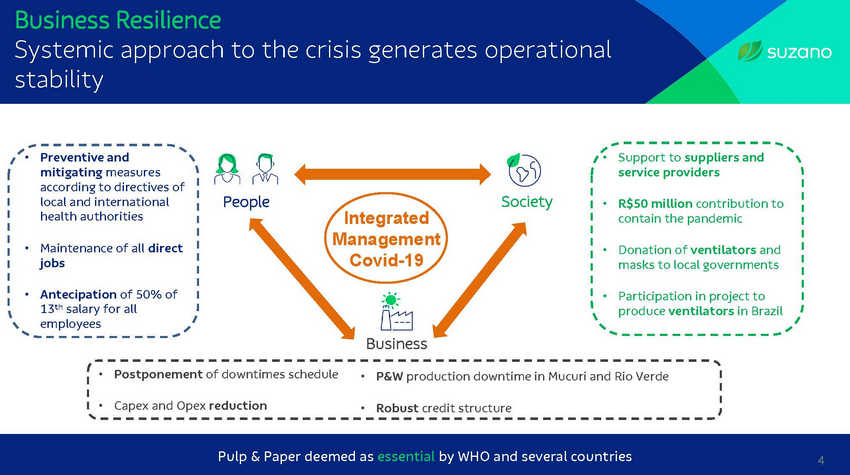 | Business Resilience Systemic approach stability to the crisis generates operational • Preventive and mitigating measures according to directives of local and international health authorities • Support to suppliers and service providers People Society • R$50 million contribution to contain the pandemic Integrated Management Covid-19 • Maintenance of all direct jobs • Donation of ventilators and masks to local governments • Antecipation of 50% of 13th salary for all employees • Participation in project to produce ventilators in Brazil Business • Postponement of downtimes schedule • P&W production downtime in Mucuri and Rio Verde • Capex and Opex reduction • Robust credit structure Pulp & Paper deemed as essential by WHO and several countries 4 |
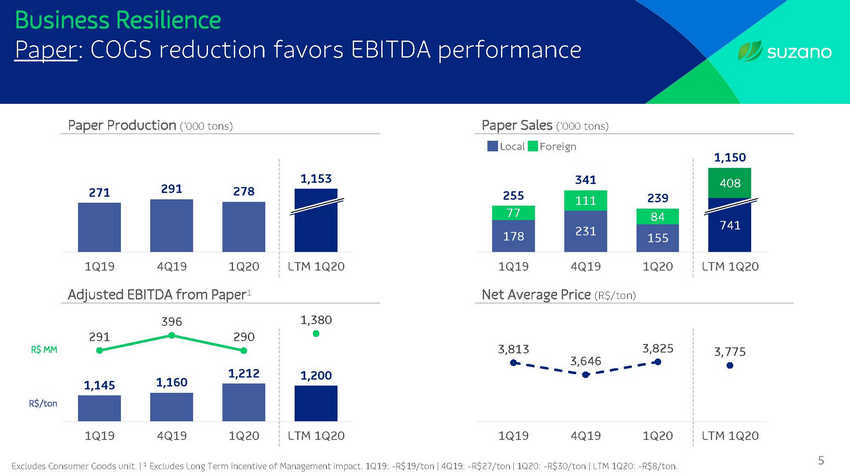 | Business Resilience Paper: COGS reduction favors EBITDA performance Paper Production (‘000 tons) Paper Sales (‘000 tons) Local Foreign 1,150 Adjusted EBITDA from Paper1 Net Average Price (R$/ton) 1,380 396 R$ MM 3,646 1,160 1,145 R$/ton 5 Excludes Consumer Goods unit. | 1 Excludes Long Term Incentive of Management impact. 1Q19: -R$19/ton | 4Q19: -R$27/ton | 1Q20: -R$30/ton | LTM 1Q20: -R$8/ton. 3,813 3,825 3,775 1Q19 4Q19 1Q20 LTM 1Q20 291 290 1,212 1,200 1Q19 4Q19 1Q20 LTM 1Q20 271 291 278 1,153 1Q19 4Q19 1Q20 LTM 1Q20 341 408 255 111 239 741 77 231 84 178 155 1Q19 4Q19 1Q20 LTM 1Q20 |
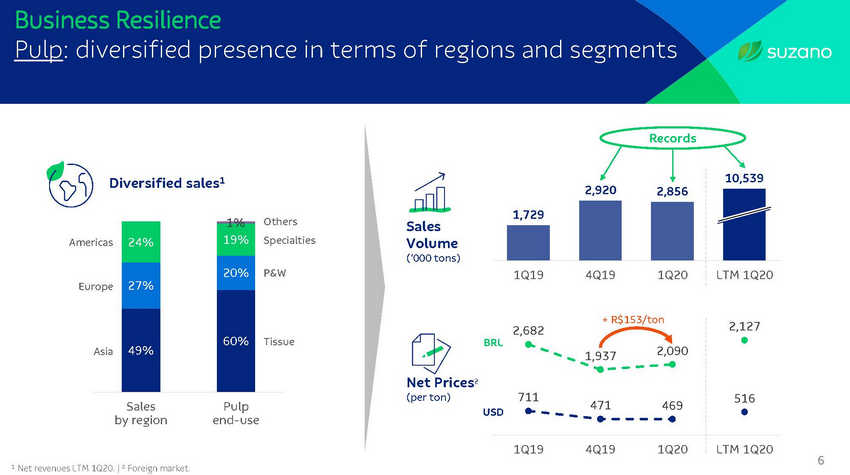 | Business Resilience Pulp: diversified presence in terms of regions and segments Records Diversified sales1 2,856 120% 1% Others Sales Volume (‘000 tons) ecialties Americas P&W Europe ssue BRL Net Prices2 (per ton) Sales by region Pulp end-use USD 6 1 Net revenues LTM 1Q20. | 2 Foreign market. + R$153/ton 2,682 1,937 2,090 711 471 469 2,127 516 1Q19 4Q19 1Q20 LTM 1Q20 Asia 24% 19% Sp Ti 20% 27% 60% 49% 2,920 10,539 1,729 1Q19 4Q19 1Q20 LTM 1Q20 |
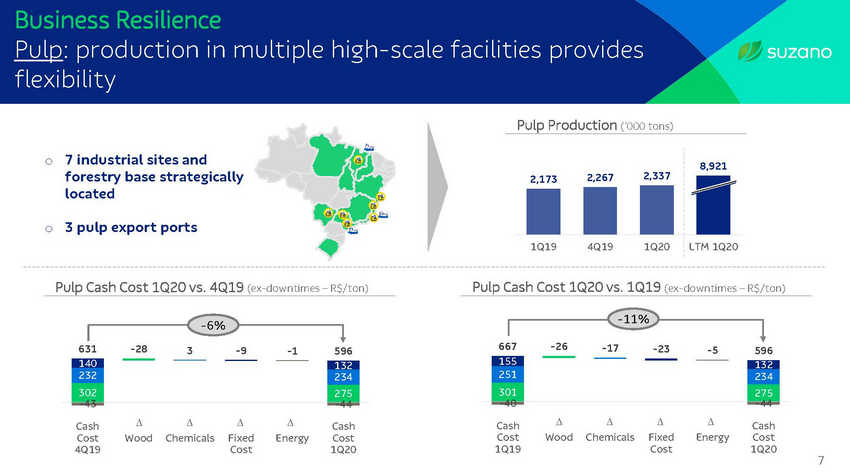 | Business Resilience Pulp: production in multiple high-scale facilities provides flexibility Pulp Production (‘000 tons) 7 industrial sites and forestry base strategically located o 2,337 3 pulp export ports o Pulp Cash Cost 1Q20 vs. 4Q19 (ex-downtimes – R$/ton) Pulp Cash Cost 1Q20 vs. 1Q19 (ex-downtimes – R$/ton) -11% -6% 667 -26 -17 631 -28 -23 3 -9 -1 -5 596 596 -40 -44 -43 -44 D Wood D Chemicals D Fixed Cost D Energy D Wood D Chemicals D Fixed Cost D Energy Cash Cost 4Q19 Cash Cost 1Q20 Cash Cost 1Q19 Cash Cost 1Q20 7 140 132 232 234 302 275 155 132 251 234 301 275 2,173 2,267 8,921 1Q19 4Q19 1Q20 LTM 1Q20 |
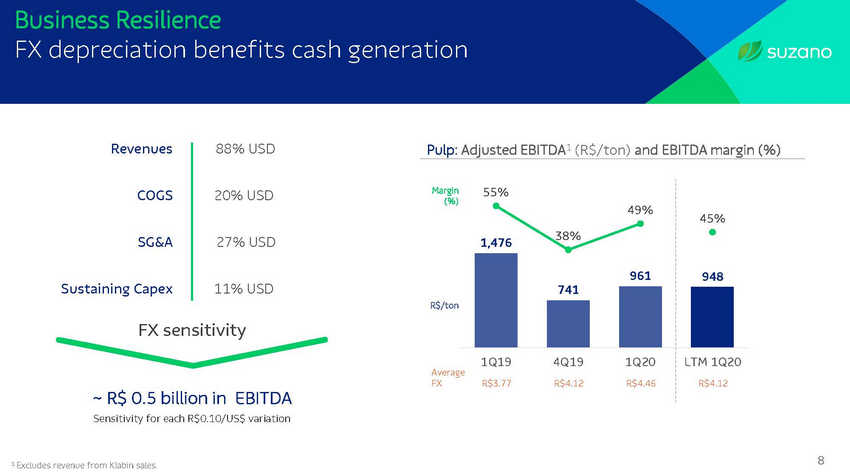 | Business Resilience FX depreciation benefits cash generation Revenues 88% USD Pulp: Adjusted EBITDA1 (R$/ton) and EBITDA margin (%) Margin (%) COGS 20% USD SG&A 27% USD Sustaining Capex 11% USD R$/ton FX sensitivity Average FX ~ R$ 0.5 billion in EBITDA Sensitivity for each R$0.10/US$ variation 8 1 Excludes revenue from Klabin sales. 55% 49% 1,476 38% 45% 948 961 741 1Q19 4Q19 1Q20 R$3.77R$4.12R$4.46 LTM 1Q20 R$4.12 |
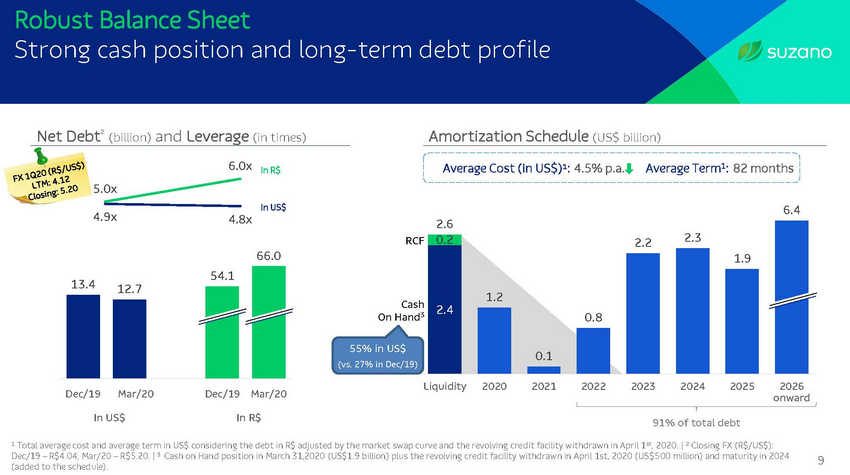 | Robust Balance Sheet Strong cash position and long-term debt profile Net Debt² (billion) and Leverage (in times) Amortization Schedule (US$ billion) 6.0x Average Cost (in US$)¹: 4.5% p.a. Average Term1: 82 months In R$ 5.0x In US$ 6.4 4.9x 4.8x 2.3 RCF 2.2 66.0 13.4 12.7 1.2 Cash On Hand3 0.8 55% in US$ (vs. 27% in Dec/19) Liquidity 2020 2021 2022 2023 2024 2025 2026 onward Dec/19 Mar/20 Dec/19 Mar/20 In US$ In R$ 91% of total debt 1 Total average cost and average term in US$ considering the debt in R$ adjusted by the market swap curve and the revolving cre dit facility withdrawn in April 1st, 2020. | 2 Closing FX (R$/US$): Dec/19 – R$4.04; Mar/20 – R$5.20. | 3 Cash on Hand position in March 31,2020 (US$1.9 billion) plus the revolving credit facility withdrawn in April 1st, 2020 (US$500 million) and maturity in 2024 (added to the schedule). 9 54.1 2.6 1.9 0.1 0.2 2.4 |
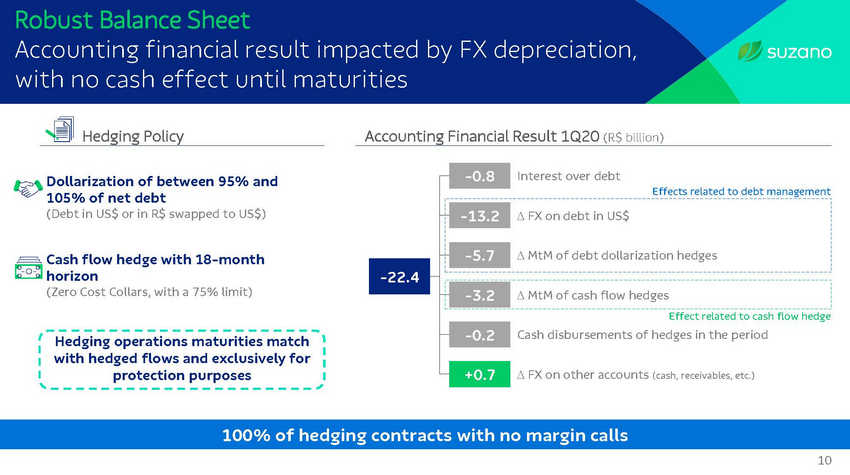 | Robust Balance Sheet Accounting financial result impacted by FX depreciation, with no cash effect until maturities Hedging Policy Accounting Financial Result 1Q20 (R$ billion) Dollarization of between 95% and 105% of net debt (Debt in US$ or in R$ swapped to US$) Cash flow hedge with 18-month horizon (Zero Cost Collars, with a 75% limit) Hedging operations maturities match with hedged flows and exclusively for protection purposes 100% of hedging contracts with no margin calls 10 -0.8 Interest over debt Effects related to debt management -13.2 D FX on debt in US$ -5.7 D MtM of debt dollarization hedges -22.4 -3.2 D MtM of cash flow hedges Effect related to cash flow hedge -0.2 Cash disbursements of hedges in the period +0.7 D FX on other accounts (cash, receivables, etc.) |
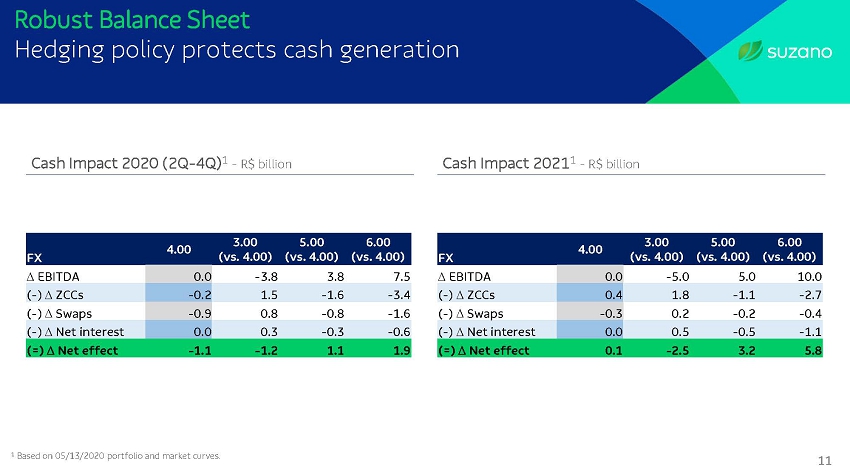 | obust Balance Sheet Hedging policy protects cash generation Cash Impact 2020 (2Q-4Q)1 - R$ billion Cash Impact 20211 - R$ billion 4.00 3.00 FX (vs. 4.00) 5.00 (vs. 4.00) 6.00 (vs. 4.00) 4.00 FX 3.00 (vs. 4.00) 5.00 (vs. 4.00) 6.00 (vs. 4.00) D EBITDA 0.0 -3.8 3.8 7.5 D EBITDA 0.0 -5.0 5.0 10.0 (-) D ZCCs -0.2 1.5 -1.6 -3.4 (-) D ZCCs 0.4 1.8 -1.1 -2.7 (-) D Swaps -0.9 0.8 -0.8 -1.6 (-) D Swaps -0.3 0.2 -0.2 -0.4 (-) D Net interest 0.0 0.3 -0.3 -0.6 (-) D Net interest 0.0 0.5 -0.5 -1.1 (=) D Net effect -1.1 -1.2 1.1 1.9 (=) D Net effect 0.1 -2.5 3.2 5.8 1 Based on 05/13/2020 portfolio and market curves. 11 |
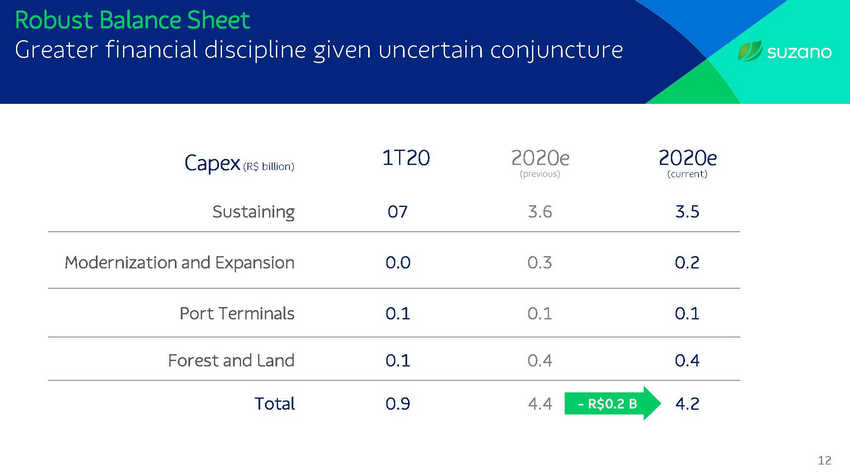 | Robust Balance Sheet Greater financial discipline given uncertain conjuncture 1T20 2020e (previous) 2020e (current) Capex (R$ billion) Sustaining 07 3.6 3.5 Modernization and Expansion 0.0 0.3 0.2 Port Terminals 0.1 0.1 0.1 Forest and Land 0.1 0.4 0.4 Total 0.9 4.4 4.2 - R$0.2 B 12 |
 | 1Q20 Takeaways Culture Focus on People, Society and Business + Competitiveness Global presence: record sales volume and inventory normalization Increasingly competitive assets and dilluted operational risk + Financial robustness FX depreciation benefits cash generation Increased cash position in the face of uncertain conjuncture Long-term debt profile (~7 years) and no financial covenants = Strong resilience in current environment 13 Greater financial austerity reinforces deleveraging commitment |
 | Investor Relations www.suzano.com.br/ir ri@suzano.com.br |