Exhibit 99.3

Growth of 38% in Adjusted EBITDA, additional reduction in pulp inventories and reduction in net debt
São Paulo, August 13, 2020. Suzano S.A. (B3: SUZB3 | NYSE: SUZ), one of the world’s largest integrated pulp and paper producers, announces today its consolidated results for the second quarter of 2020 (2Q20).
HIGHLIGHTS
| · | Pulp sales of 2,778 thousand tons (+25% vs. 2Q19). |
| · | Pulp inventory reduction of approximately 220 thousand tons. |
| · | Paper sales of 235 thousand tons (-22% vs. 2Q19). |
| · | Adjusted EBITDA1 and Operating cash generation² of R$4.2 billion and R$3.4 billion, respectively. |
| · | Adjusted EBITDA1/ton3 from pulp of R$1,391/ton (+7% vs. 2Q19). |
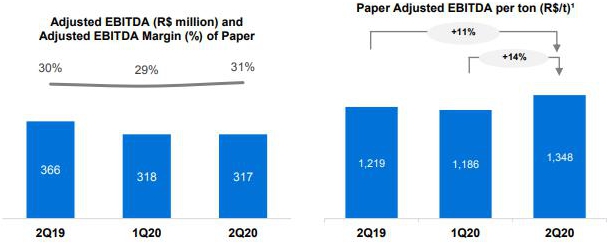
| · | Adjusted EBITDA1/ton4 from paper of R$1,348/ton (+11% vs. 2Q19). |
| · | Average net pulp price - Export Market: US$470/t (-25% vs. 2Q19). |
| · | Average net paper price5 of R$4,330/ton (+7% vs. 2Q19). |
| · | Pulp cash cost ex-downtime of R$599/ton (-14% vs. 2Q19). |
| · | Capture of operating synergies in line with planning. |
| Financial Data (R$ million) | 2Q20 | 2Q19 | Δ Y-o-Y | 1Q20 | Δ Q-o-Q | LTM5 2Q20 |
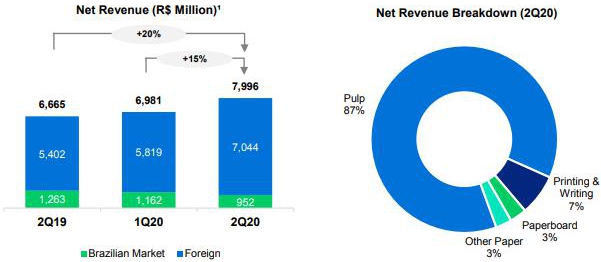
| Net Revenue | 7,996 | 6,665 | 20% | 6,981 | 15% | 28,625 |
| Adjusted EBITDA1 | 4,180 | 3,101 | 35% | 3,026 | 38% | 12,068 |
| Adjusted EBITDA Margin1 | 52% | 47% | 6 p.p. | 43% | 9 p.p. | 42% |
| Adjusted EBITDA Margin¹ ex- Klabin3 | 52% | 49% | 4 p.p. | 44% | 8 p.p. | 43% |
| Net Financial Result | (5,657) | 79 | - | (22,444) | - | (32,970) |
| Net Income | (2,053) | 700 | - | (13,419) | - | (17,757) |
| Operating Cash Generation2 | 3,372 | 2,226 | 51% | 2,336 | 44% | 8,764 |
| Net Debt /Adjusted EBITDA1 (x) - R$ | 5.6 x | 3.5 x | 2.1 x | 6.0 x | -0.4 x | 5.6 x |
| Net Debt /Adjusted EBITDA1 (x) - US$ | 4.7 x | 3.6 x | 1.1 x | 4.8 x | -0.1 x | 4.7 x |
| Operational Data ('000 tons) | 2Q20 | 2Q19 | Δ Y-o-Y | 1Q20 | Δ Q-o-Q | LTM 2Q20 |
| Sales | 3,013 | 2,514 | 20% | 3,124 | -4% | 12,288 |
| Pulp | 2,778 | 2,214 | 25% | 2,856 | -3% | 11,103 |
| Paper4 | 235 | 301 | -22% | 268 | -12% | 1,185 |
| Production | 2,815 | 2,539 | 11% | 2,644 | 6% | 10,453 |
| Pulp | 2,543 | 2,221 | 14% | 2,337 | 9% | 9,243 |
| Paper4 | 272 | 318 | -14% | 307 | -11% | 1,210 |
¹ Excludes non-recurring items and PPA effects. | 2 Considers Adjusted EBITDA less maintenance capex (cash basis). | 3 Excludes Klabin’s sales volume | 4 Includes the results of the Consumer Goods Unit. | 5 Last 12 months.

2Q20 EARNINGS RELEASE |  |
The consolidated quarterly information has been prepared in accordance with the Securities and Exchange Commission (CVM) and Accounting Standards Committee (CPC) standards and is in compliance with International Accounting Standard (IFRS) issued by the International Accounting Standard Board (IASB). The data contained in this document was obtained from the financial information as made available to the CVM. The operating and financial information is presented based on consolidated numbers in Reais (R$). Summaries may diverge due to rounding. Non-financial data, such as volume, quantity, average price, average price, in Reais and Dollars, were not reviewed by independent auditors.
CONTENTS
| EXECUTIVE SUMMARY | 2 |
| PULP BUSINESS PERFORMANCE | 2 |
| PULP SALES VOLUME AND REVENUE | 2 |
| PULP CASH COST | 4 |
| PAPER BUSINESS PERFORMANCE | 7 |
| PAPER OPERATING CASH FLOW | 9 |
| ECONOMIC AND FINANCIAL PERFORMANCE | 10 |
| NET REVENUE | 10 |
| PRODUCTION | 10 |
| COST OF GOODS SOLD | 11 |
| SELLING EXPENSES | 11 |
| GENERAL AND ADMINISTRATIVE EXPENSES | 12 |
| ADJUSTED EBITDA | 12 |
| FINANCIAL RESULTS | 13 |
| DERIVATIVE OPERATIONS | 14 |
| NET INCOME (LOSS) | 17 |
| INDEBTEDNESS | 17 |
| CAPITAL EXPENDITURE | 20 |
| OPERATING CASH GENERATION | 20 |
| FREE CASH FLOW | 21 |
| COVID-19 | 21 |
| ESG | 23 |
| SYNERGIES | 23 |
| TOTAL OPERATIONAL EXPENDITURES - PULP | 23 |
| EVENTS AFTER THE REPORTING PERIOD | 23 |
| CAPITAL MARKETS | 23 |
| FIXED INCOME | 23 |
| RATING | 25 |
| UPCOMING EVENTS | 26 |
| IR CONTACTS | 26 |
| APPENDICES | 27 |
| APPENDIX 1 – Operating Data | 27 |
| APPENDIX 2 – Consolidated Statement of Income and Goodwill Amortization | 29 |
| APPENDIX 3 – Consolidated Balance Sheet | 30 |
| APPENDIX 4 – Consolidated Statement of Cash Flow | 31 |
| APPENDIX 5 – EBITDA | 32 |
| APPENDIX 6 – Segmented Income Statement | 33 |
| Forward-Looking Statements | 35 |

EXECUTIVE SUMMARY
The quarter was marked by the continued effects of the Covid-19 pandemic on the Company’s business environment. In this scenario, Suzano’s focus throughout the second quarter remained on taking preventive and mitigation measures to protect people and society, while also ensuring business continuity. Considering the donations and other expenditure on initiatives aimed at fighting the new coronavirus, the Company’s investments totaled R$75 million until the end of June.
Suzano once again showed its resilience to overcome the challenges in a highly unpredictable market scenario resulting from the global situation. In the pulp business, the strong sales volume further reduced inventories, while the improved production cash cost despite exchange rate pressures underscored the continued gains in structural competitiveness, which in turn, was driven by the synergies obtained from the merger with Fibria. The paper business’ performance was boosted by exports, though affected by the record slump in demand on account of the pandemic, especially in the printing & writing segment. The combination of strong operating performance and the average depreciation of BRL against the USD fueled the 38% growth in Adjusted EBITDA in relation to the prior quarter, to reach R$4.2 billion.
As for financial management, in the second quarter, the Company reduced its net debt in USD and its leverage, measured by net debt/Adjusted EBITDA in the last twelve months. Its liquidity position remained solid, representing zero refinancing risk until 2022. Suzano remains focused on its financial discipline, as evident from its clear and consistent policies over time, and believes that it diligently plays its role of generating and sharing value in the long term.
The second quarter also witnessed progress on Environmental, Social and Governance (ESG) issues. We expanded transparency and accountability towards our stakeholders by publishing in May the first Annual Report of the new Suzano after the merger, and launched a comprehensive Indicators Center. We also have a webpage dedicated to the recommendations made by the Taskforce for Climate-Related Financial Disclosure (TCFD), created by the Financial Stability Board (FSB). In the section, Suzano reiterates its support for the TCFD and reports on its actions in accordance with applicable recommendations. This initiative became one of the 14 highlights in the TCFD Knowledge Hub, with Suzano being the only company from the Paper & Forestry Products sector and the first non-financial company in Latin America to be featured in this select group.
PULP BUSINESS PERFORMANCE
PULP SALES VOLUME AND REVENUE
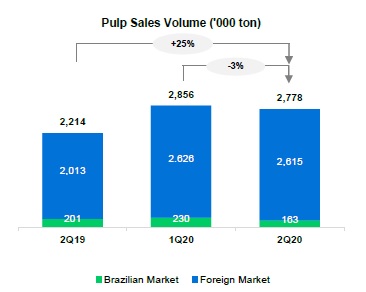
Pulp sales proved resilient during 2Q20 in light of the challenges posed by the macroeconomic scenario resulting from the COVID-19 pandemic. Pulp demand, which initially benefited from the stronger demand for sanitary paper (tissue), towards the end of the quarter was affected by the slowdown in the consumption of printing & writing and specialty papers.
In this context, Suzano’s sales came to 2,778 thousand tons, down slightly (-3%) from the strong sales volume in 1Q20 and up 25% from 2Q19.
Pulp supply was expanded in 2Q20 due to the postponement of scheduled maintenance shutdowns, and occasionally by higher pulp production by integrated paper producers, the expectation is that in the second half of the year we will have a greater number of stoppages due to the concentration of maintenance downtimes in the period, in addition to the continued occurrence of unscheduled downtimes.
In a scenario characterized by constant challenges, Suzano was successful in execute its commercial strategy that resulted in a new and significant reduction in its inventories.
Suzano’s average net pulp price in USD in 2Q20 was US$466/ton, up US$4/ton compared to 1Q20. Meanwhile, the average net price in 2Q19 declined by US$162/ton (-26%), due to the correction in pulp prices in the global market in the period. The average net pulp price in the export market in 2Q20 was US$471/ton (compared to US$469/ton in 1Q20 and US$631/ton in 2Q19).
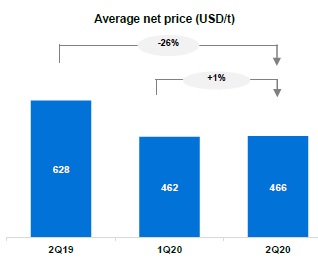
The average net price in BRL was R$2,512/ton in 2Q20, increasing by 22% and 2% compared to 1Q20 and 2Q19, respectively, reflecting the depreciation in the Brazilian real against the U.S. dollar.
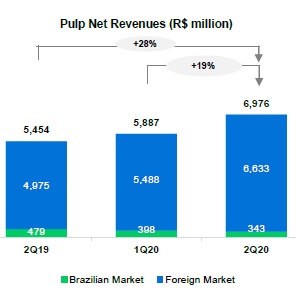
Net revenue from pulp was 28% higher than in 2Q19, explained mainly by the 38% appreciation in the average price of the USD against the BRL and the higher sales volume (+25%), with these factors partially offset by the lower average net price in USD (-26%).
Compared to 1Q20, the 19% growth in revenue was explained by the 21% appreciation in the average price of the USD against the BRL and by the 1% higher average net price in USD, with these effects partially offset by the lower sales volume (-3%).
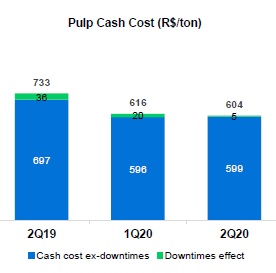
PULP CASH COST
Cash cost excluding downtime in 2Q20 stood at R$599/t, a decreased of R$98/ton vs. 2Q19 (-14%), which is mainly explained by: i) the lower wood cost, given the lower harvest costs due to the improved operational performance, the higher operating productivity and the lower cost of diesel. There also was a decline in the average supply radius in Aracruz (non-use of Losango wood) and Maranhão, and the lower diesel costs on logistics; ii) the lower fixed costs, given the lower maintenance expenses and the higher economies of scale with the growth in production; and iii) the lower costs with energy, especially natural gas, resulting from the synergy and energy-efficiency gains at mills. These positive effects on energy inputs were partially offset by the 38% appreciation in the average price of the USD against the BRL, which had an impact of R$22/t vs. 2Q19.
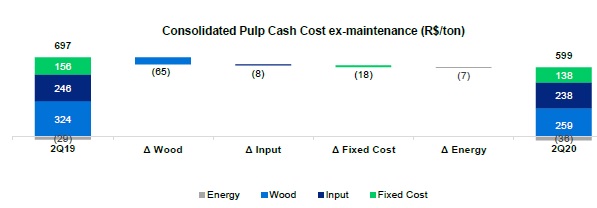
¹Excludes maintenance and administrative downtimes impact.
Cash cost ex-downtime in 2Q20 was virtually stable compared to 1Q20, despite the negative effect from the appreciation of the USD vs. the BRL (R$16/t impact on chemicals and energy). The variation recorded was mainly due to the lower wood costs, which in turn was due to the lower harvest costs, due to lower cost of diesel and lower wood shipping costs given the shorter average supply radius on stretches with higher costs (although the consolidated average radius has remained practically stable) and lower diesel costs. However, these positive factors were offset by: i) the lower result from energy sales (energy exported from renewable sources - biomass and black liquor), which in turn were due to the sharp drop in spot energy prices; ii) the increase in fixed costs due to higher maintenance expenses, as a result of the postponement of activities in 1Q20 due to the covid-19 pandemic; and iii) higher inputs costs, mainly due to the negative effects from the exchange rate (mainly on chlorine dioxide, soda, natural gas and fuel oil), which were partially offset by the lower prices of chemicals and energy (especially fuel oil, natural gas and caustic soda).
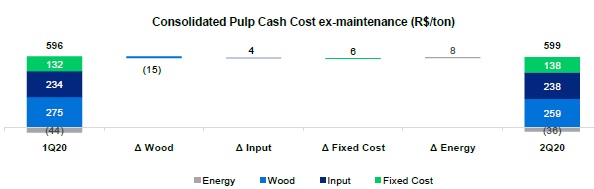
¹Excludes maintenance and administrative downtimes impact.
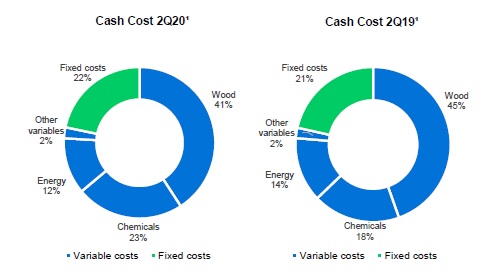
¹Based on cash cost excluding downtimes. Excludes energy sales.
PULP SEGMENT EBITDA
| Pulp Segment | 2Q20 | 2Q19 | Δ Y-o-Y | 1Q20 | Δ Q-o-Q | LTM 2Q20 |
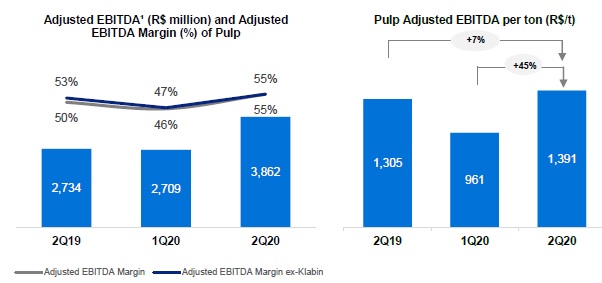
| Adjusted EBITDA (R$ million)1 | 3,862 | 2,734 | 41% | 2,709 | 43% | 10,624 |
| Sales volume (k ton) | 2,777 | 2,095 | 33% | 2,818 | -1% | 10,700 |
| Pulp adjusted¹ EBITDA (R$/ton) | 1,391 | 1,305 | 7% | 961 | 45% | 993 |
¹ Excludes non-recurring items and PPA effects.
The increase in Adjusted EBITDA from pulp in 2Q20 compared to 2Q19 mainly reflects the 38% appreciation in the average price of the USD against the BRL, the higher sales volume (+25%) and the reduction in cash COGS (lower manufacturing costs and weaker impact from downtimes), with these factors partially offset by the lower net pulp price in USD (-26%). The 7% increase in per-ton adjusted EBITDA is explained by exchange variation and the cost factor, which were partially offset by the lower average net pulp price in USD and higher selling expenses (largely impacted by the appreciation of USD vs BRL).
Compared to 1Q20, the 43% growth in adjusted EBITDA from pulp is explained by the 21% appreciation in the average price of the USD against the BRL, the higher average net price in USD (+1%) and the lower cash COGS (weaker effects from downtimes and inventory turnover), with these factors partially offset by the 3% decline in sales volume. The 46% increase in Adjusted EBITDA per ton is explained by exchange variation and the reduction in cash COGS, partially offset by higher selling expenses.
¹ Excludes non-recurring items and PPA effects.
OPERATING CASH FLOW FROM THE PULP SEGMENT
| Pulp Segment (R$ million) | 2Q20 | 2Q19 | Δ Y-o-Y | 1Q20 | Δ Q-o-Q | LTM 2Q20 |
| Adjusted EBITDA1 | 3,862 | 2,734 | 41% | 2,709 | 43% | 10,624 |
| Maintenance Capex2 | (742) | (797) | -7% | (633) | 17% | (3,028) |
| Operating Cash Flow | 3,120 | 1,938 | 61% | 2,076 | 50% | 7,596 |
¹ Excludes non-recurring items and PPA effects.
²Cash basis.

¹ Excludes sales volume related to the agreement with Klabin.
Per-ton operating cash flow in the pulp segment increased 21% from 2Q19, reflecting the increase in per-ton Adjusted EBITDA. Compared to 1Q20, the increase was due to the 53% growth in per-ton EBITDA (as already explained), which was partially offset by the higher maintenance capex.
PAPER BUSINESS PERFORMANCE
The following data and analyses incorporate the joint results from the consumer goods business and paper.
PAPER SALES VOLUME AND REVENUE¹
According to the Forestry Industry Association (Ibá), domestic sales of printing & writing paper and paperboard decreased 31% and 36% in relation to 1Q20 and 2Q19, respectively, which represent the sharpest declines in demand ever registered in the segment and were due to the restrictive measures imposed to combat COVID-19. Meanwhile, imports decreased by 22% from 1Q20 and by 40% from 2Q19.
For the tissue market, however, consumer changes in the face of the implications of COVID 19 positively affected demand. For this market, also determined by Ibá (Brazilian Tree Industry), domestic sales of the industry in the second quarter were in line with 1Q20 while increasing 6% compared to the same period of the previous year.
In Brazil, Suzano’s paper sales (printing and writing, paperboard and tissue) came to 140 thousand tons in 2Q20, down 23% from 1Q20 and 25% from 2Q19.
Paper sales in both the domestic and export markets in 2Q20 came to 235,000 tons, down 12% and 22% from 1Q20 and 2Q19, respectively. Even in the face of such a crisis, the company showed no interruptions in the supply of paper to customers in Brazil or abroad and had its productive and commercial flexibility between the product lines in order to adapt to the current demand reality.
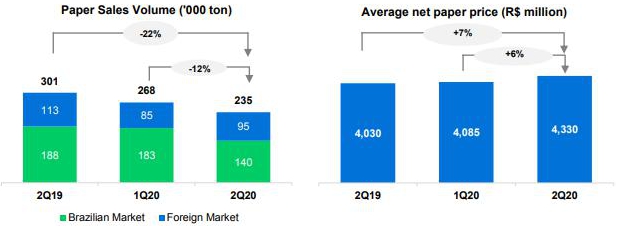
The average net price in the domestic market in 2Q20 was R$4,333/ton, representing increases of R$153/ton (+4%) compared to 1Q20 and R$156/ton (+4%) compared to 2Q19.
The average net price of paper exported in the quarter was US$803/t, down US$68/ton (-8%) from 1Q20 and US$163/ton (-17%) from 2Q19. In BRL, the export price of paper in 2Q20 was R$4,325/ton, up 11% from 1Q20 and 14% from 2Q19, reflecting the appreciation in the average price of the USD against the BRL in the period. The same exchange rate factor on the price of exported paper explains the increase in the total net average price of paper in reais when compared to previous periods (+6% vs. 1Q20 and +7% vs. 2Q19).
Net revenue from paper was R$1,019 million in 2Q20, down 7% from 1Q20, reflecting the lower sales volume due to seasonality, which was aggravated by the impact from COVID-19 on the business environment, and partially offset by the higher average net price in BRL (+6%).
Compared to the same period last year, net revenue from paper also decreased due to the lower sales volume (-22%), which was partially offset by the higher average net price in BRL (+7%).

*Includes the Consumer Goods Unit.
PAPER EBITDA
| Paper segment | 2Q20 | 2Q19 | Δ Y-o-Y | 1Q20 | Δ Q-o-Q | LTM 2Q20 |
| Adjusted EBITDA (R$ million) | 317 | 366 | -13% | 318 | 0% | 1,443 |
| Sales volume (k ton) | 235 | 301 | -22% | 268 | -12% | 1,185 |
| Paper adjusted¹ EBITDA (R$/ton) | 1,348 | 1,219 | 11% | 1,186 | 14% | 1,218 |
¹ Excludes non-recurring items and PPA effects.
The performance of Adjusted EBITDA from paper in 2Q20 compared to 2Q19 (-13%) is mainly explained by the lower sales volume (-22%), reflecting the adverse scenario caused by the COVID-19 pandemic. On a per-ton basis, the indicator increased 11% due to USD appreciation vs the BRL and lower SG&A and other operational.
Compared to 1Q20, Adjusted EBITDA from paper also was stable. On a per-ton analysis, Adjusted EBITDA ended the period up 14% from the prior quarter, also due to the 21% appreciation in the average price of the USD against the BRL and the decline in SG&A and other operating expenses/revenues.
¹ Excluding non-recurring items.
PAPER OPERATING CASH FLOW
| Operating cash flow - Paper (R$ million) | 2Q20 | 2Q19 | Δ Y-o-Y | 1Q20 | Δ Q-o-Q | LTM 2Q20 |
| Adjusted EBITDA1 | 317 | 366 | -13% | 318 | 0% | 1,443 |
| Maintenance Capex2 | (65) | (78) | -16% | (57) | 14% | (276) |
| Operating Cash Flow | 252 | 288 | -13% | 260 | -3% | 1,168 |
¹ Excluding non-recurring items.
² Cash basis.
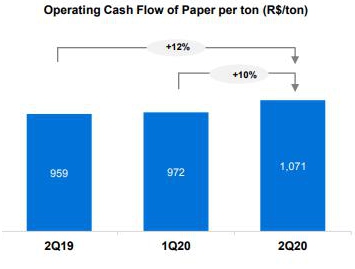
Operating cash generation per ton of paper in 2Q20 was R$1,071/t. Compared to the same quarter last year, the indicator increase of 12% is explained by the higher per-ton Adjusted EBITDA and by the lower Maintenance CAPEX (-16%).
Compared to 1Q20, even though Adjusted EBITDA remained stable, the 10% increase in operating cash generation per ton is due to the higher per-ton Adjusted EBITDA (as explained above).
ECONOMIC AND FINANCIAL PERFORMANCE
NET REVENUE
Suzano’s net revenue in 2Q20 was R$7,996 million, 88% of which came from exports (vs. 81% in 2Q19 and 83% in 1Q20). Paper and packaging sales in the quarter came to 3,013 thousand tons, increasing 20% compared to 2Q19 and decreasing 4% compared to 1Q20. Compared to 2Q19, the 20% growth in net revenue mainly reflected the 38% appreciation in the average price of the USD against the BRL and the 25% growth in pulp sales volume, with these factors partially offset by the 26% drop in the average net pulp price in USD.
¹ Excludes service revenue from Portocel.
Consolidated net revenue increased in 2Q20 compared to 1Q20, explained basically by the 21% appreciation in the USD against BRL and by the US$4/t (+1%) increase in net average pulp price, with these factors partially offset by the 4% drop in pulp and paper sales volume.
PRODUCTION
| Production (k ton) | 2Q20 | 2Q19 | Δ Y-o-Y | 1Q20 | Δ Q-o-Q | LTM 2Q20 |
| Market Pulp | 2,543 | 2,221 | +14% | 2,337 | +9% | 9,243 |
| Paper | 272 | 318 | -14% | 307 | -11% | 1,210 |
| Total | 2,815 | 2,539 | +11% | 2,644 | +6% | 10,453 |
In the second quarter of 2020, there were no scheduled maintenance downtimes. Given the current social context arising from the COVID-19 pandemic, and with the goal of protecting its employees and the general public, the Company decided to postpone its maintenance downtimes initially scheduled for this year. Pulp production increase of 9% compared to 1Q20, reflects the acceleration of normal pace of operations at its pulp mills and the absence of maintenance downtimes. Compared to the same period last year, in addition to the acceleration of production at its pulp mills, there also was in that quarter scheduled maintenance downtimes.
The calendar of Suzano’s scheduled maintenance downtimes follows:
| Fábrica – Capacidade celulose | 2019 | 2020 | 2021 |
| 1Q19 | 2Q19 | 3Q19 | 4Q19 | 1Q20 | 2Q20 | 3Q20 | 4Q20 | 1Q21 | 2Q21 | 3Q21 | 4Q21 |
| Aracruz - Mill A (ES) – 590 kt | | | | | | | | | | | To be defined |
| Aracruz - Mill B (ES) – 830 kt | | | | | | | | | | | To be defined |
| Aracruz - Mill C (ES) – 920 kt | | | | | | | | | | | | To be defined |
| Imperatriz (MA)² – 1,650 kt | | | | | | | | | | | No downtime |
| Jacareí (SP) – 1,100 kt | | | | | | | | | | | No downtime |
| Limeira (SP)² – 690 kt | | | | | | | | | | | To be defined |
| Mucuri - Mill 1 (BA)² – 600 kt | | | | | | | | | | No downtime |
| Mucuri - Mill 2 (BA) – 1,130 kt | | | | | | | | | | | To be defined |
| Suzano (SP)² – 520 kt | | | | | | | | | | | No downtime |
| Três Lagoas - Mill 1 (MS) – 1,300 kt | | | | | | | | | | | No downtime |
| Três Lagoas - Mill 2 (MS) – 1,950 kt | | | | | | | | | | | No downtime |
| Veracel (BA)¹ – 560 kt | | | | | | | | | | | To be defined |
¹ Veracel is a joint operation between Suzano (50%) and Stora Enso (50%) with total annual capacity of 1,120 thousand tons.
² Includes integrated capacities.
COST OF GOODS SOLD
| COGS (R$ million) | 2Q20 | 2Q19 | Δ Y-o-Y | 1Q20 | Δ Q-o-Q | LTM 2Q20 |
| COGS (Income statement) | 4,789 | 5,222 | -8% | 4,820 | -1% | 20,405 |
| Depreciation, depletion and amortization | 1,462 | 2,086 | -30% | 1,381 | 6% | 5,658 |
| Cash COGS | 3,327 | 3,136 | 6% | 3,439 | -3% | 14,747 |
| Sales volume | 3,013 | 2,514 | 20% | 3,124 | -4% | 12,288 |
| Cash COGS/ton (R$/ton) | 1,104 | 1,247 | -12% | 1,101 | 0% | 1,200 |
¹Includes amortization of goodwill surplus/loss (PPA)
Cash COGS in 2Q20 came to R$3,327 million, or R$1,104/ton. Compared to 2Q19, cash COGS was up 6%, mainly due to the higher sales volume and 21% appreciation in the average price of the USD against the BRL, with these factors partially offset by the lower production cost (mainly in pulp, due to factors noted in the analysis of cash cost and to the lower impacts from downtimes). On a per-ton basis, cash COGS decreased 12%, due to the reduction in pulp production costs affecting COGS, partially offset by the 5% increase in logistics costs per ton, in turn mainly explained by the exchange rate variation.
Compared to 1Q20, cash COGS decreased 3%, due to the lower sales volume and lower production costs, with these factors partially offset by the 21% appreciation in the average price of the USD against the BRL. On a per-ton basis, the indicator remained stable (exchange variation effects offsetting the cost benefit).
SELLING EXPENSES
| Selling expenses (R$ million) | 2Q20 | 2Q19 | Δ Y-o-Y | 1Q20 | Δ Q-o-Q | LTM 2Q20 |
| Selling expenses (Income Statement) | 547 | 457 | 20% | 515 | 6% | 2,069 |
| Depreciation, depletion and amortization1 | 227 | 225 | 1% | 234 | -3% | 923 |
| Cash selling expenses | 320 | 232 | 38% | 281 | 14% | 1,146 |
| Sales volume | 3,013 | 2,514 | 20% | 3,124 | -4% | 12,288 |
| Cash selling expenses/ton (R$/ton) | 106 | 92 | 15% | 90 | 18% | 93 |
¹Includes amortization of goodwill surplus/loss (PPA)
Cash selling expenses registered a 38% increase from 2Q19, due to the 20% growth in sales volume, the 38% appreciation in the average price of the USD against the BRL and sales mix. On a per-ton basis, cash selling expenses increased 15% due to the exchange variation effect on expenses in foreign currency, partially offset by higher fixed cost dilution.
Compared to 1Q20, the 14% expansion in cash selling expenses is mainly explained by the 21% appreciation in the average price of the USD against the BRL and by the increase in logistics expenses (due to client mix). Per-ton cash selling expenses increased 15% due to higher logistics expenses and the effects from exchange variation.
GENERAL AND ADMINISTRATIVE EXPENSES
| General and Administrative Expenses (R$ million) | 2Q20 | 2Q19 | Δ Y-o-Y | 1Q20 | Δ Q-o-Q | LTM 2Q20 |
| General and Administrative Expenses (Income Statament) | 336 | 278 | 21% | 315 | 7% | 1,215 |
| Depreciation, depletion and amortization1 | 19 | 8 | 147% | 25 | -25% | 50 |
| Cash general and administrative expenses | 317 | 270 | 17% | 290 | 9% | 1,165 |
| Sales volume | 3,013 | 2,514 | 20% | 3,124 | -4% | 12,288 |
Cash general and administrative expenses/t
(R$/ton) | 105 | 107 | -2% | 93 | 13% | 95 |
¹ Includes amortization of goodwill surplus/loss (PPA).
² Inverse effect due to the write-off of PPA on contingencies (write-off of cases initially reassessed in the business merger).
Cash general and administrative expenses increased 17% compared to 2Q19, mainly reflecting the donations and expenses related to COVID-19 pandemic mitigation measures. On a per-ton basis, the 2% decreased is explained by the higher economies of scale in the fixed costs portion of the line due to higher sales volume. Compared to 1Q20, cash general and administrative expenses were 9% higher, also due to expenses related to the COVID-19 pandemic, which were partially offset by the optimization of organizational structures and lower general expenses. On a per-ton basis, the 13% increase is explained by the same factors above and by the effects from economies of scale on expenses.
Other operating income (expenses) amounted to income of R$196 million in 2Q20, compared to income of R$171 million in 2Q19 and income of R$17 million in 1Q20. Compared to 2Q19, the variation is mainly explained by the higher result from the adjustment to fair value of biological assets, which was mostly offset by the income from judicial credits in 2Q19. Compared to 1Q20, the variation is mainly explained by the result of the adjustment to fair value of biological assets, which occurs in the second and fourth quarter of each fiscal year.
ADJUSTED EBITDA
| Consolidated | 2Q20 | 2Q19 | Δ Y-o-Y | 1Q20 | Δ Q-o-Q | LTM 2Q20 |
| Adjusted EBITDA (R$ million)¹ | 4,180 | 3,101 | 35% | 3,026 | 38% | 12,068 |
| Adjusted EBITDA¹ Margin - ex-Klabin | 52% | 49% | 4 p.p. | 44% | 8 p.p. | 43% |
| Sales Volume ex-Klabin (mil ton) | 3,013 | 2,396 | 26% | 3,086 | -2% | 11,885 |
| Adjusted EBITDA¹ ex-Klabin/ton (R$/ton) | 1,387 | 1,294 | 7% | 981 | 41% | 1,015 |
¹ Excludes non-recurring items and PPA effects.
Adjusted EBITDA increased in 2Q20 compared to 2Q19, explained by: (i) the appreciation in the average price of the USD against the BRL (+38%); (ii) the higher pulp sales volume (+25%); and (iii) the decrease in cash COGS, as detailed above. These effects were partially offset by the lower net pulp price in USD (-26%). The 7% increase in EBITDA per ton is explained by the effects from exchange rate variation, the lower production costs and higher fixed costs and expenses dilution.
Compared to 1Q20, the 38% increase in Adjusted EBITDA is mainly due to the higher average price of the USD against the BRL (+21%). The lower cash COGS and the 1% increase in average net price in USD also contributed to this positive variation, which was partially offset by the lower sales volume of pulp and paper. The 41% increase in per-ton Adjusted EBITDA is basically due the aforementioned factors, excluding volume.
FINANCIAL RESULTS
| Financial Result (R$ million) | 2Q20 | 2Q19 | Δ Y-o-Y | 1Q20 | Δ Q-o-Q |
| Financial Expenses | (1,033) | (1,086) | -5% | (1,086) | -5% |
| Interest on loans and financing (local currency) | (191) | (345) | -45% | (243) | -21% |
| Interest on loans and financing (foreign currency) | (660) | (538) | 23% | (643) | 3% |
| Capitalized interest1 | 4 | 1 | 314% | 4 | 9% |
| Other financial expenses | (187) | (205) | -9% | (204) | -8% |
| Financial Income | 82 | 150 | -45% | 121 | -32% |
| Interest on financial investments | 38 | 74 | -48% | 70 | -45% |
| Other financial income | 44 | 76 | -42% | 51 | -13% |
| Monetary and Exchange Variations | (2,930) | 758 | - | (12,420) | -76% |
| Foreign exchange variations (Debt) | (3,177) | 647 | - | (13,188) | -76% |
| Other foreign exchange variations | 247 | 112 | 121% | 768 | -68% |
| Derivative income (loss), net2 | (1,776) | 257 | - | (9,059) | -80% |
| Cash flow hedge | (679) | 408 | - | (3,361) | -80% |
| Debt hedge | (1,064) | (177) | 501% | (5,871) | -82% |
| Others3 | (33) | 26 | - | 174 | - |
| Net Financial Result | (5,657) | 79 | - | (22,444) | -75% |
¹ Capitalized interest due to construction in progress.
2 Variation in mark-to-market adjustment (2Q20: -R$10,820 million | 1Q20: -R$10,705 million), plus adjustments paid and received (2Q20 = -R$1,661 million).
³ Includes commodity hedging and embedded derivatives.
Financial expenses amounted to R$1,033 million in 2Q20, decreasing 5% compared to 1Q20 and 2Q19. Throughout 2019 and until mid-2020, the company’s interest expenses suffered impacts from the declines in its debt indexers in both local currency (CDI and TJLP) and foreign currency (Libor 3M). Part of the benefits from the decline in the indexers in foreign currency were offset by the USD appreciation.
Financial income in 2Q20 compared to 1Q20 decreased 32%, reflecting the lower interest rates. Compared to 2Q19, the reduction in the interest rates applicable to financial investments due to the cumulative decline in the Selic interest rate (425 bps in the period) and in the interest rates in the international market remunerating cash balances abroad. In both comparisons, the change in the allocation of assets from the local market to the foreign market intensified the reduction observed in financial income for the period.
Inflation adjustment and exchange variation had a negative impact of R$2,930 million on the Company’s financial result in the quarter, due to the 5% appreciation in the end-of-period price of the USD against the BRL on the foreign-denominated portion of debt (79% of the total debt), coupled with the drawdown of US$500 million from its standby credit facility in April. Bear in mind that the accounting impact from exchange variation on foreign-denominated debt has a cash impact only upon the respective maturities.
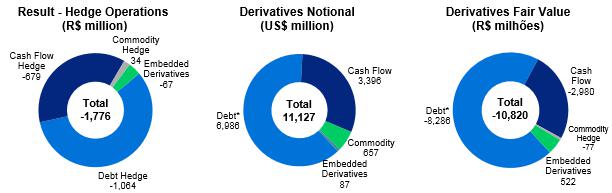
Derivative operations generated a loss of R$1,776 million in 2Q20, due to the impact from the sharp local-currency depreciation and to the volatility of market curves applicable to debt hedge and cash flow transactions. The impacts caused by the COVID-19 pandemic on the world’s economies continued throughout 2Q20, and the risk aversion trend once again affected the local currency in a context of high volatility. Year-on-year, in addition to the mentioned exchange depreciation, there also was a less significant impact caused by the variations in the Pre, Cupom and Libor rate curves on transactions. The mark-to-market adjustment of derivative instruments on June 30, 2020 generated a loss of R$10,820 million, compared to a loss of R$10,705 million on March 31, 2020, representing a net loss of R$115 million. As with exchange variation, the impact from BRL depreciation on the derivatives portfolio generates a cash impact only upon the respective maturities. The net effect on cash, which refers to the settlement of derivative operations coming due in the first quarter, was R$1,661 million (R$793 million expense from debt hedge and R$868 million in income from operating hedge and commodities).
Due to the aforementioned factors, the net financial expense was R$5,657 million in 2Q20, compared to the net financial expense of R$22,444 million in 1Q20 and the net financial income of R$79 million in 2Q19.
DERIVATIVE OPERATIONS
Suzano carries out derivative operations exclusively for hedging purposes. Note that none of the company’s hedge operations have margin calls. The following table reflects the position of derivative hedging instruments at June 30, 2020:
| Hedge1 | Notional (US$ million) | Fair value (R$ million) |
| Jun/2020 | Mar/2020 | Jun/2020 | Mar/2020 |
| Debt | 6,986 | 7,417 | (8,286) | (8,014) |
| Cash flow | 3,396 | 3,712 | (2,980) | (3,133) |
| Others2 | 745 | 763 | 445 | 442 |
| Total | 11,127 | 11,892 | (10,820) | (10,705) |
¹ Refer to note 4 of the 2Q20 Quarterly Financial Statements (ITR) for further details and fair value sensitivity analysis.
2 Includes commodity hedge and embedded derivatives.
The Company’s financial policy seeks to minimize the volatility of its cash generation and to impart greater flexibility to cash flow management. Currently, the policy stipulates that surplus dollars may be partially hedged (up to 75% of exchange variation exposure over the next 18 months) using plain vanilla instruments, such as Zero Cost Collars (ZCC) and Non-deliverable Forwards (NDF).
ZCC transactions establish minimum and maximum limits for the exchange rate that minimize adverse effects in the event of significant appreciation in the BRL. If the exchange rate is within such limits, the Company neither pays nor receives any financial adjustments. Therefore, the Company is protected in scenarios of extreme BRL appreciation. However, these transactions also limit potential gains in scenarios of extreme BRL depreciation. The characteristics allows for capturing greater benefits from export revenue in a potential scenario of USD appreciation within the range contracted.
On June 30, 2020, the outstanding notional value of operations involving forward dollar sales through ZCCs was US$3,366 million, whose maturities are distributed from July 2020 to November 2021, with an average forward rate ranging from R$4,25 to R$4.72, as disclosed in the table below. On the same date, the amount outstanding of the operations (notional) involving forward dollar sales through NDFs was US$31 million, whose maturities are distributed from July to September 2020 and with an average strike of R$4.26. In 2Q20, cash flow hedge operations resulted in a loss of R$679 million. The mark-to-market adjustment (fair value) of ZCC transactions was a loss of R$2,948 million and for NDFs was a loss of R$32 million at the end of the quarter, with the difference related to adjustments paid during 2Q20.
The following table presents a sensitivity analysis of the cash impact that the Company could experience on its cash flow hedge portfolio (ZCC and NDF) if the future exchange rate remains the same as that at end-2Q20 (R$/US$ = 5.48) in the coming quarters; as well as the projected variation in cash impact for each R$0.10 variation in the same reference exchange rate (2Q20). Note that the figures presented in the table are Company projections based on the end-of-period curves and could fluctuate depending on market conditions.
| | | | Cash adjustment (R$ million) |
Maturity (up to) | Strike Range | Notional
(US$ million) | Actual | R$ / US$ = 5.48 (1Q20)² | Sensitivity at R$ 0.10 / US$ variation (+/-)1 |
| Zero Cost Collars |
| 2Q20 | - | - | (801) | - | - |
| 3Q20 | 3.93 - 4.10 | 705 | - | (943) | (71) |
| 4Q20 | 4.12 - 4.53 | 490 | - | (446) | (49) |
| 1Q21 | 4.21 - 4.66 | 685 | - | (552) | (69) |
| 2Q21 | 4.23 - 4.70 | 810 | - | (641) | (81) |
| 3Q21 | 4.58 - 5.34 | 462 | - | (187) | (46) |
| 4Q21 | 5.09 - 6.18 | 214 | - | 0 | (21) |
| Total | 4.25 – 4.72 | 3,366 | (801) | (2,770) | |
| NDF |
| 2Q20 | - | - | (31) | - | - |
| 3Q20 | 4.26 | 30 | - | (30) | 0 |
| Total | | 30 | (31) | (30) | 0 |
¹ Note: sensitivity of adjustments for foreign exchange levels above maximum value of the strike range. ² To calculate the mark-to-market adjustment, the PTAX rate of the next to last business day for the period under analysis was adopted. |
The Company also uses currency and interest rate swaps to mitigate the effects from exchange and interest rate variations on the balance of its debt and on its cash flow. Contracts swapping different interest rates and inflation indexes may be entered into as a way to mitigate the mismatch between financial assets and liabilities.
On June 30, 2020, the Company held US$6,986 million (notional value) in swaps, distributed as shown in the table below. In 2Q20, the result of liability hedge transactions was a loss of R$1,064 million, mainly due to the BRL depreciation in the period due to the COVID-19 pandemic. The mark-to-market (fair value) adjustment of these operations generated a loss of R$8,286 million at the end of the quarter.
| | | | Notional (US$ million) | Fair value (R$ million) |
| Debt hedge | Maturity (up to) | Currency | Jun/20 | Mar/20 | Jun/20 | Mar/20 |
| Swap (PRÉ x USD) | 2024 | USD | 350 | 350 | (637) | (565) |
| Swap (CDI x USD) | 2026 | USD | 2,677 | 3,099 | (6,454) | (6,366) |
| Swap (IPCA x USD) | 2023 | USD | 121 | 121 | (173) | (161) |
| Swap (LIBOR x USD) | 2026 | USD | 3,683 | 3,683 | (1,273) | (1,139) |
| Swap (IPCA x CDI) | 2023 | BRL | 154 | 164 | 252 | 217 |
| Total | | | 6,986 | 7,418 | (8,286) | (8,014) |
1Translated at the closing exchange rate (5.20).
The following table presents a sensitivity¹ analysis of the cash impact the Company could experience on its debt hedge portfolio (swaps) if the future exchange rate remains the same as at the end of 2Q20 (R$/US$ = 5.48) in the coming quarters; as well as the projected variation in cash impact for each R$0.10 variation in the same reference exchange rate (2Q20). Note that the figures presented in the table are Company projections based on the end-of-period curves and could fluctuate depending on market conditions.
| | | Cash adjustment (R$ million) |
| Maturity (up to) | Notional
(US$
million) | Actual | R$ / US$ = 5.48 (2Q20) | Sensitivity at R$ 0.10 / US$ variation (+/-)1 |
| 2Q20 | - | (793) | | |
| 3Q20 | 110 | - | (341) | (14) |
| 4Q20 | 300 | - | (931) | (37) |
| 2021 | 333 | - | (703) | (21) |
| 2022 | 737 | - | (1,174) | (60) |
| 2023 | 2,173 | - | (615) | (50) |
| 2024 | 1,331 | - | (582) | (46) |
| 2025 | 1,156 | - | (1,373) | (90) |
| >2026 | 845 | - | (1,378) | (85) |
| Total | 6,986 | (793) | (7,096) | (403) |
¹ Sensitivity analysis considers variation only in the exchange rate (R$/US$), while other variables are presumed constant.
Other transactions involving the Company’s derivatives are related to the embedded derivative resulting from the forestry partnerships and commodity hedges (maritime fuel), as follows:
| | | | Notional (US$ million) | Fair value (R$ million) |
| Other hedges | Maturity (up to) | Index | Jun/20 | Mar/20 | Jun/20 | Mar/20 |
| Embedded derivative | 2035 | Fixed USD | USD US-CPI | 657 | 668 | 522 | 589 |
| Commodities | 2021 | Brent/VLSFO | 87 | 95 | (77) | (147) |
| Total | | | 745 | 763 | 445 | 442 |
Forestry partnership agreements and timber supply agreements signed on December 30, 2013 by Fibria Celulose S.A. are denominated in USD per cubic meter of standing timber, adjusted by U.S. inflation measured by the Consumer Price Index (CPI), which is not related to inflation in the economic environment where the forests are located and, hence, constitutes an embedded derivative. Such instrument, which is presented in the table above, consists of a swap contract with the short leg consisting of the variations in the U.S. CPI during the period of the aforementioned agreements. See note 4 of the 2Q20 Interim Financial Information for more details and for a sensitivity analysis of the fair value in the event of substantial variation in the U.S. CPI. On June 30, 2020, the outstanding amount (notional) of the operation was US$657 million. The result from the swap in 2Q20 was a loss of R$67 million. The mark-to-market adjustment (fair value) of such operations generated a gain of R$522 million at the end of the quarter.
The Company also is exposed to the international oil price, which is reflected in the logistics costs of sales to export markets. In this case, the Company analyzes the contracting of derivative financial instruments to fix the price of maritime fuel.
On June 30, 2020, the outstanding amount (notional) of the operation was US$87 million. The result from the swap in 2Q20 was a gain of R$34 million. The mark-to-market (fair value) adjustment of these operations generated a loss of R$77 million at the end of the quarter.
*Debt in reais converted to US dollar considering the closing exchange rate of the month (R$/US$ 5.4760 as of 06/30/2020).
NET INCOME (LOSS)
In 2Q20, the Company posted a net loss of R$2,053 million, compared to the net income of R$700 million in 2Q19 and the net loss of R$13,419 million in 1Q20. The variation in relation to 2Q19 is explained by the net financial loss, which in turn is due to the effects from exchange variation on liabilities and by the gain/loss from derivative transactions, with these factors partially offset by the higher operating result. Compared to 1Q20, the R$11 billion decrease in the net loss mainly reflects the positive variation in the net financial result (lower exchange variation on liabilities and derivatives) and the 87% increase in operating result due to the aforementioned factors.
INDEBTEDNESS
| Debt (R$ million) | 06/30/2020 | 06/30/2019 | Δ Y-o-Y | 03/31/2020 | Δ Q-o-Q |
| Local Currency | 16,765 | 17,221 | -3% | 18,108 | -7% |
| Short Term | 1,966 | 2,227 | -12% | 3,552 | -45% |
| Long Term | 14,799 | 14,994 | -1% | 14,556 | 2% |
| Foreign Currency | 63,863 | 43,259 | 48% | 57,674 | 11% |
| Short Term | 3,580 | 2,466 | 45% | 2,972 | 20% |
| Long Term | 60,283 | 40,793 | 48% | 54,702 | 10% |
| Gross Debt | 80,629 | 60,480 | 33% | 75,782 | 6% |
| (-) Cash | 12,687 | 7,972 | 59% | 9,739 | 30% |
| Net debt | 67,941 | 52,508 | 29% | 66,043 | 3% |
| Net debt/Adjusted EBITDA1(x) - R$ | 5.6x | 3.5x | 2.1x | 6.0x | -0.4x |
| Net debt/Adjusted EBITDA1(x) - US$ | 4.7x | 3.6x | 1.1x | 4.8x | -0.1x |
¹ Excluding non-recurring items.
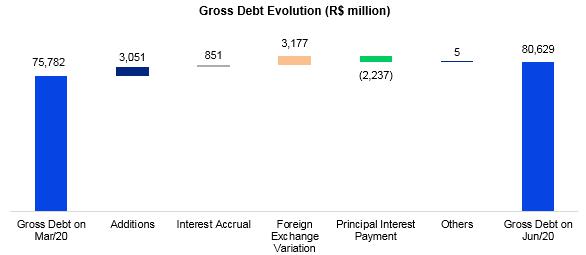
Gross debt on June 30, 2020 amounted to R$80.6 billion, composed of 93% long-term maturities and 7% short-term maturities. Debt denominated in foreign currency accounted for 79% of the Company's total liabilities, while debt denominated in local currency accounted for the remaining 21%. The percentage of gross debt denominated in foreign currency, considering the effect from debt hedge, was 95%. Gross debt increased by 6% (R$4.8 billion) compared to 1Q20, reflecting the effects from exchange variation on liabilities and the funding operations in the period, including the US$500 million drawdown of the standby credit facility and the R$400 million loan from the Brazilian Development Bank (BNDES). Compared to 2Q19, the increase in gross debt is due to the effects from exchange variation and the liability management actions in the period.
Suzano contracts debt in foreign currency debt as a natural hedge, since net operating cash generation is denominated in foreign currency (U.S. dollar) due to its prevailing status as an exporter. This structural exposure allows the Company to match loans and financing payments in USD with receivable flows from sales.
* Corresponding mainly to transaction costs (emission, fund raising, etc.) and impacts from surplus value resulting from the operation with Fibria.
On June 30, 2020, the total average cost of debt in USD was 4.5% p.a. (debt in BRL adjusted by the market swap curve), compared to 4.6% p.a. on March 31, 2020. The average term of consolidated debt at the end of the year decreased to 82 months (vs. 84 months in March 2020).
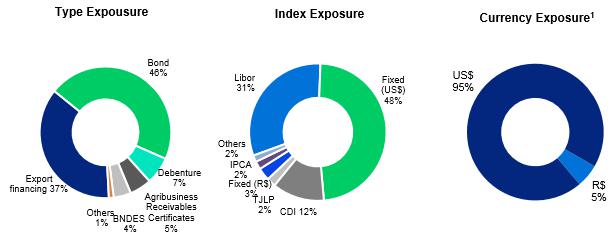
¹ Considers the portion of debt with currency swaps. The original debt was 79% denominated in USD and 21% in BRL.
Cash and cash equivalents at the end of June 30, 2020 were R$12,687 million, 78% of which were invested in foreign currency, in fixed-income short-term investments, while the local currency share was invested in government bonds and fixed income.
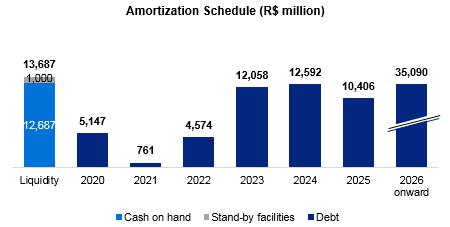
The Company maintains one untapped stand-by credit facility in the amount of R$1 billion available through 2024. This facility helps to improve the company’s liquidity conditions. As a result, the current cash position of R$12,687 million plus the facility described above amount to a readily available cash position of R$13,687 million.
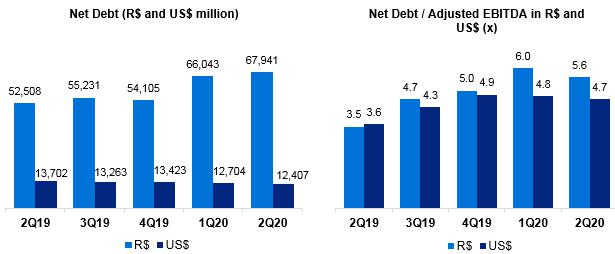
Net debt stood at R$67.9 billion (US$12.4 billion) on June 30, 2020, compared to R$66.0 billion (US$12.7 billion) on March 31, 2020. As described above, the increase in the net debt in BRL balance was due to the sharp BRL depreciation in the period.
The ratio of net debt to Adjusted EBITDA in BRL stood at 5.6 on June 30, 2020, compared to 6.0 at the end of 1Q20. The same ratio in USD, a measure established in Suzano’s financial policy, fell to 4.7 times on June 30, 2020, compared to 4.8 times at the end of 1Q20.
The breakdown of total gross debt between trade and non-trade finance on June 30, 2020 is shown below:
| | 2020 | 2021 | 2022 | 2023 | 2024 | 2025 onwards | Total |
| Trade Finance¹ | 53% | 27% | 55% | 83% | 70% | 11% | 37% |
| Non Trade Finance² | 47% | 73% | 45% | 17% | 30% | 89% | 63% |
¹ ACC, ACE, NCE, PPE
² Bonds, BNDES, CRA, Debentures, among others.
CAPITAL EXPENDITURE
In 2Q20, capital expenditures (cash basis) amounted to R$1,031 million, down 25% from 2Q19, mainly due to the lower expenses with land and forests and mill maintenance (lower expenses with projects). Compared to 1Q20, the 18% increase was mainly due to the higher expenses with forest development.
| Investiments (R$ million) | 2Q20 | 2Q19 | Δ Y-o-Y | 1Q20 | Δ Q-o-Q | LTM 2Q20 | Guidance
2020 |
| Maintenance | 808 | 875 | -8% | 690 | 17% | 3,304 | 3,508 |
| Industrial maintenance | 113 | 156 | -28% | 76 | 49% | 576 | 611 |
| Forestry maintenance | 691 | 695 | -1% | 594 | 16% | 2,619 | 2,801 |
| Others | 4 | 24 | -83% | 20 | -81% | 109 | 97 |
| Expansion and modernization | 86 | 46 | 87% | 41 | 110% | 288 | 248 |
| Land and forestry | 105 | 387 | -73% | 96 | 9% | 999 | 389 |
| Port terminals | 33 | 70 | -53% | 46 | -29% | 287 | 104 |
| Total | 1,031 | 1,377 | -25% | 873 | 18% | 4,878 | 4,249 |
OPERATING CASH GENERATION
| Operating cash flow - Consolidated (R$ million) | 2Q20 | 2Q19 | Δ Y-o-Y | 1Q20 | Δ Q-o-Q | LTM 2Q20 |
| Adjusted EBITDA1 | 4,180 | 3,101 | 35% | 3,026 | 38% | 12,068 |
| Maintenance Capex2 | (808) | (875) | -8% | (690) | 17% | (3,304) |
| Operating Cash Flow | 3,372 | 2,226 | 51% | 2,336 | 44% | 8,764 |
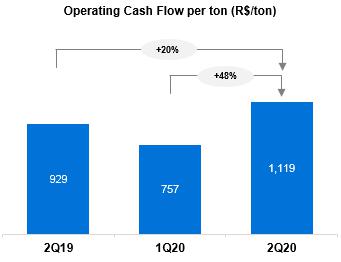
| Operating Cash Flow (R$/t)³ | 1,119 | 929 | 20% | 757 | 48% | 737 |
¹ Excludes non-recurring items and PPA effects.
² Cash basis.
³ Excludes sales volume from Klabin.
Operating cash generation, measured by Adjusted EBITDA less sustaining capex (cash basis), amounted to R$3,372 million in 2Q20. The 51% increase compared to 2Q19 reflects the higher EBITDA, as explained above. The per-ton operating cash flow performance compared to 2Q19 is primarily related to the effects from exchange variation and the lower costs, as well as the lower maintenance capex per ton. Compared to 1Q20, the 44% increase reflects the 21% appreciation in the USD against the BRL, with this effect partially offset by the higher maintenance capex. In the per ton analysis, the 48% growth is explained by the same factors.
FREE CASH FLOW
| Free Cash Flow (R$ million) | 2Q20 | 2Q19 | Δ Y-o-Y | 1Q20 | Δ Q-o-Q | LTM 2Q20 |
| Adjusted EBITDA | 4,180 | 3,101 | 35% | 3,026 | 38% | 12,068 |
| (-) Total Capex¹ | (1,077) | (1,292) | -17% | (880) | 22% | (4,163) |
| (+/-) D Working capital | 593 | (0) | - | (332) | - | 1,513 |
| (-) Net interest | (441) | (568) | -22% | (1,115) | -60% | (2,979) |
| (-) Income taxes | (34) | (94) | -64% | (29) | 17% | (49) |
| (-) Dividend payment | 0 | (602) | - | 0 | - | (5) |
| Free cash flow | 3,221 | 544 | - | 670 | 380% | 6,385 |
| (+) Capex ex-maintenance | 161 | 333 | -52% | 199 | -19% | 777 |
| (+) Dividend payment | 0 | 602 | - | 0 | - | 5 |
| Free cash flow - Adjusted | 3,381 | 1,478 | 129% | 869 | 289% | 7,167 |
| (-) Derivative cash adjustment | (1,661) | (29) | - | (173) | 862% | (1,965) |
| Free cash flow - Adjusted - after derivatives² | 1,720 | 1,449 | 19% | 696 | 147% | 5,202 |
¹ On an accrual basis.
² Free cash flow prior to dividend payments and capex ex-maintenance (accrual basis).
Free cash flow considering the adjustment for derivatives stood at R$1,720 million in 2Q20, compared to R$1,449 million in 2Q19 and R$643 million in 1Q20. The increase compared to the prior-year period is mainly due to the growth in Adjusted EBITDA, the variation in working capital and the variation in the dividend payment in the quarter. These effects were partially offset by the higher losses from the adjustment of derivatives. In working capital, the main variations were in accounts receivable (especially due to the higher volume of sales of trade receivables, a good portion of which was from the portion withheld in 1Q20) and in the line suppliers, which in turn was due to the payments made related to the agreement with Klabin. Note that the outstanding balance of said agreement was R$30 million on June 30, 2020.
Compared to 1Q20, the growth of 147% was due to the higher Adjusted EBITDA, the variation in working capital and the lower interest expenses (higher concentration of maturities in the prior quarter). These effects also were partially offset by the higher expenses with the adjustment of derivatives.
COVID-19
Suzano has been adopting preventive and mitigatory measures aligned with the guidelines established by Brazilian and international health authorities to minimize the impacts from the COVID-19 pandemic with regard to people safety and the continuity of its businesses.
The Company’s actions are based on three pillars: (1) People; (2) Society; (3) Business Continuity.
| (1) | People: to ensure the safety of its employees and contractors, Suzano has adopted a series of measures and procedures to mitigate their exposure to the novel coronavirus. The measures to protect people include the Company’s decision to maintain all direct jobs and to pay in advance 50% of the 13th salary bonus normally paid in December. |
| (2) | Society: Suzano understands its responsibility at this time to the communities in which it operates, guided by its culture driver “It’s only good for us if it’s good for the world.” Accordingly, from the onset of the outbreak to the present date, the Company has adopted a series of measures to protect the general public, including: |
| · | Donation of toilet paper, napkins and disposable diapers made by the Company to needy communities; |
| · | Donation of 159 ventilators and 1 million medical masks to federal and state governments; |
| · | Participation in the joint efforts with Positivo Tecnologia, Klabin, Flex Eletronics and Embraer to support the Brazilian company Magnamed in its delivery to the federal government of 6,500 ventilators by August 2020; |
| · | Construction of a field hospital in Teixeira de Freitas, Bahia, jointly with Veracel, which already has been delivered to the state government and was inaugurated in July 2020; |
| · | Forging a partnership with the FATEC vocational school from Capão Bonito for producing alcohol gel; |
| · | Lending of forklifts for the logistics of donations received by the Red Cross; |
| · | Ensuring the jobs of all direct employees at this time; |
| · | Ensuring for 90 days (to end-June 2020) the payment of 100% of the payroll expenses of the workers of service providers whose operations were suspended because of the pandemic, seeking to protect jobs. |
| · | Creation of a support program for small suppliers, a social program to help small farmers sell their products via a home delivery system in 38 communities assisted by Suzano’s Rural Land Development Program (“PDRT”) in 5 states, and a social program for producing 125,000 masks in local communities for donation in 5 states; |
| · | Launch of a support program for small and midsized paper clients called “We’re Together” to ensure that these companies have the financial and managerial capacity to resume operations. |
Expenditures to support the social actions sponsored by Suzano amounted to R$48 million as of June 30, 2020. It is also important to note that another R$26 million was spent to adapt our operation to the current scenario of fighting the Coronavirus (see note 29 - Results by Nature of the Interim Financial Information).
| (3) | Business continuity: to date, the company is maintaining its operations normally and has formed crisis management committees that act daily at the corporate levels and at each business unit. Suzano has a business continuity plan prepared for 100% of its operations, with various levels of contingency plans. |
The current scenario arising from the novel coronavirus also implies higher credit risk. The Company is monitoring this risk and implementing measures to mitigate it, and considers such risk adequately controlled. To date, there have been no significant financial impacts.
Due to the physical distancing measures adopted in Brazil and many other countries that entail, for instance, the closure of schools and offices, the demand for printing & writing paper has decreased. In light of this scenario, and as announced by various paper manufacturers around the world, Suzano has opted to temporarily reduce the volume of its paper production. As previously disclosed in the quarterly financial statements for the period ended March 31, 2020, the Company temporarily shut down its paper production lines at the Mucuri and Rio Verde mills. However, the operations of these mills were resumed in early June.
Lastly, it is also important to mention that due to the current scenario, the Company has undertaken and maintained intensive communication efforts to further increase interactions with its main stakeholders, striving to ensure the adequate transparency and flow of information with them in a timely manner aligned with the current social and economic situation. All key messages published to provide updates on its measures and activities in the context of Covid-19 are available on the Company’s Investor Relations website.
In addition, the Company has created a webpage with information on all its actions related to Covid-19: https://www.suzanocontraocoronavirus.com.br.
ESG
2Q20 registered important advances in Suzano’s transparency and accountability. In May, the 2019 Annual Report covering the first year after the merger with Fibria was published, which included the launch of the Indicators Center, a platform with over 250 indicators and 400 tables and charts developed to support the transparent reporting of quantitative and qualitative information on the Company’s operations and impacts. The Indicators Center also presents a webpage dedicated to the Recommendations of the Taskforce for Climate-related Financial Disclosure (TCFD), a working group created by the Financial Stability Board (FSB). In the section, Suzano reiterates its support for the TCFD and reports on its actions in accordance with the applicable Recommendations. This disclosure became one of the 14 highlights in the TCFD Knowledge Hub, which is the official webpage for announcing initiatives related to the TCFD Recommendations. Suzano is the only company in the industry (Paper and Forestry Products) and the first non-financial corporation in Latin America to be highlighted.
At the latest General and Extraordinary Shareholders’ Meeting held on May 22, 2020, in which members of the Board were elected, which now comprises 10 members, of which 7 are independent and 2 are women. For more information, see the IR website in the Corporate Governance section. It is worth mentioning that the Novo Mercado rule establishes that the Board of Directors is composed of at least 2 independent directors or 20%, whichever is greater.
SYNERGIES
On February 12, 2020, through a Material Fact notice, the Company updated its projections for the synergy gains resulting from its business combination with Fibria Celulose S.A. Suzano expects to capture, from 2019 to 2021, operating synergies estimated at between R$1,100 million and R$1,200 million per year (before taxes), and on a recurring basis after 2021, through reductions in costs, expenses and capital expenditures in the procurement, forest, industrial, logistics, sales, administrative and people areas, and also expects to capture tax synergies that result in deductions of around R$2.0 billion a year, from the merger of Fibria with Suzano. The synergies continue to be captured in line with the planning.
The estimated amount of operating synergies mentioned above does not include the costs of implementing the initiatives linked to these synergies, which remain estimated by the Company at approximately R$200 million through 2021.
TOTAL OPERATIONAL EXPENDITURES - PULP
As disclosed through a Material Fact notice dated February 13, 2020, the estimate for total operating expenditures in 2024 remains approximately R$1,300/t, and the trend for the indicator remains in line with the planning.
��
EVENTS AFTER THE REPORTING PERIOD
On August 13, 2020, in connection with the Notice to the Market disclosed on March 30, 2020, the Company informed its shareholders and the market that submitted a notice of early settlement of the standby credit facility amounting to US$500 million, withdrawn on April 1, 2020, at the cost of Libor + 1.30% p.a., with average term of 47 months and final maturity in February 2024. The settlement is scheduled for August XX, 2020 and, once made, said funds will once again be fully available as a source of additional liquidity for the Company, if necessary.
Suzano believes that, given its strong cash position at the moment, maintaining the credit facility withdrawn is no longer necessary. Also note that this settlement will make the Company’s cash management more efficient.
CAPITAL MARKETS
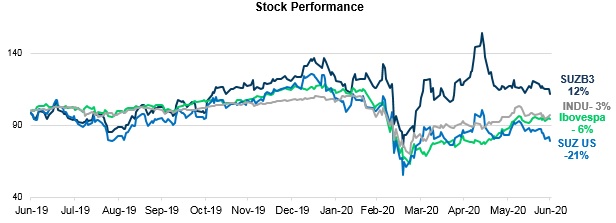
On June 30, 2020, Suzano’s stock was quoted at R$36.79/share (SUZB3) and US$6.76 (SUZ). The Company’s stock is listed on the Novo Mercado, the trading segment of the São Paulo Exchange (B3 – Brasil, Bolsa e Balcão) with the highest corporate governance standards, and also is traded on the New York Stock Exchange (NYSE) - Level II.
Source: Bloomberg.
Source: Bloomberg.
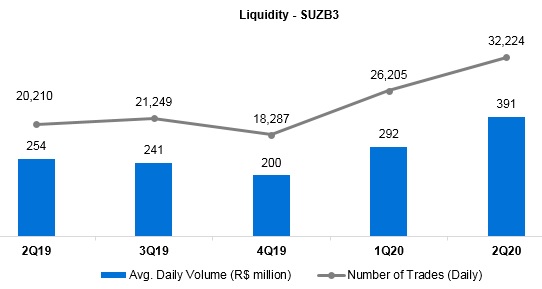
On June 30, 2020, the Company's share capital was represented by 1,361,263,584 common shares, of which 12,042,004 were held in Treasury. Suzano’s market capitalization was R$50.1 billion on June 30, 2020. In 2Q20, the free-float corresponded to 53.3% of the total capital.
Free-Float Distribution at 6/30/2020
(B3 + NYSE) | Ownership structure (6/30/2020) |
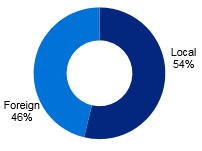 | 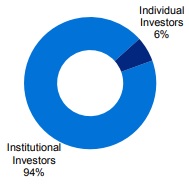 | 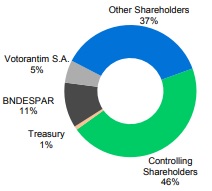 |
FIXED INCOME
| | Unit | Jun/20 | Mar/20 | Jun/19 | Δ Y-o-Y | Δ Q-o-Q |
| Fibria 2024 - Preço | USD/k | 107.46 | 97.33 | 106.37 | 1.0% | 10.4% |
| Fibria 2024 - Yield | % | 3.18 | 5.99 | 3.80 | -16.4% | -46.9% |
| Fibria 2025 - Preço | USD/k | 103.25 | 93.18 | 100.78 | 2.5% | 10.8% |
| Fibria 2025 - Yield | % | 3.22 | 5.65 | 3.84 | -16.1% | -42.9% |
| Suzano 2026 - Preço | USD/k | 109.49 | 95.62 | 109.14 | 0.3% | 14.5% |
| Suzano 2026 - Yield | % | 3.97 | 6.61 | 4.23 | -6.3% | -40.0% |
| Fibria 2027 - Preço | USD/k | 108.13 | 97.25 | 107.45 | 0.6% | 11.2% |
| Fibria 2027 - Yield | % | 4.07 | 6.00 | 4.33 | -6.0% | -32.1% |
| Suzano 2029 - Preço | USD/k | 109.06 | 93.01 | 109.08 | 0.0% | 17.3% |
| Suzano 2029 - Yield | % | 4.70 | 7.08 | 4.80 | -2.1% | -33.6% |
| Suzano 2030 - Preço | USD/k | 102.33 | 88.59 | 101.14 | 1.2% | 15.5% |
| Suzano 2030 - Yield | % | 4.69 | 6.60 | 4.86 | -3.4% | -28.9% |
| Suzano 2047 - Preço | USD/k | 110.07 | 97.37 | 113.62 | -3.1% | 13.0% |
| Suzano 2047 - Yield | % | 6.22 | 7.22 | 5.99 | 3.9% | -13.9% |
| Treasury 10 anos | % | 0.66 | 0.67 | 2.01 | -67.3% | -2.0% |
Note: Senior Notes issued with face value of 100 USD/k
RATING
| Agency | National Scale | Global Scale | Outlook |
| Fitch Ratings | AAA | BBB- | Negative |
| Standard & Poor’s | brAAA | BBB- | Negative |
| Moody’s | Aaa.br | Ba1 | Stable |
UPCOMING EVENTS
Earnings Conference Call (2Q20)
Date: August 14, 2020 (Friday)
| Portuguese (simultaneous translation) | English |
| 09:30 a.m. (Brasília) | 09:30 a.m. (Brasília) |
| 08:30 a.m. (New York) | 08:30 a.m. (New York) |
| 1:30 p.m. (London) | 1:30 p.m. (London) |
| Tel.: +55 (11) 3181-8565 | Tel.: +1 412 717-9627 |
Please connect 10 minutes before the conference call is scheduled to begin.
The conference call will be held in English, feature a slide presentation and be transmitted simultaneously via webcast. The access links will be available on the Company’s Investor Relations website. (www.suzano.com.br/ir).
If you are unable to participate, the webcast link will be available for future consultation on the Investor Relations website of Suzano S.A.
IR CONTACTS
Marcelo Bacci
Camila Nogueira
Camilla Galvão
Roberto Costa
Tel.: +55 (11) 3503-9330
ri@suzano.com.br
www.suzano.com.br/ri
APPENDICES
APPENDIX 1 – Operating Data
Revenue breakdown (R$ '000) | 2Q20 | 2Q19 | Δ Y-o-Y | 1Q20 | Δ Q-o-Q | 6M20 | 6M19 | Δ Y-o-Y |
| Exports | 7,043,721 | 5,402,282 | 30% | 5,818,754 | 21% | 12,862,475 | 9,788,075 | 31% |
| Pulp | 6,633,011 | 4,975,203 | 33% | 5,488,357 | 21% | 12,121,368 | 9,071,654 | 34% |
| Paper | 410,710 | 427,079 | -4% | 330,397 | 24% | 741,107 | 716,421 | 3% |
| Domestic Market | 951,952 | 1,262,800 | -25% | 1,162,039 | -18% | 2,113,991 | 2,576,006 | -18% |
| Pulp | 343,201 | 478,569 | -28% | 398,367 | -14% | 741,568 | 984,104 | -25% |
| Paper | 608,751 | 784,231 | -22% | 763,672 | -20% | 1,372,423 | 1,591,902 | -14% |
| Total Net Revenue | 7,995,673 | 6,665,082 | 20% | 6,980,793 | 15% | 14,976,466 | 12,364,081 | 21% |
| Pulp | 6,976,212 | 5,453,772 | 28% | 5,886,724 | 19% | 12,862,936 | 10,055,758 | 28% |
| Paper | 1,019,461 | 1,211,310 | -16% | 1,094,069 | -7% | 2,113,530 | 2,308,323 | -8% |
| | 2T20 | 2T19 | Δ Y-o-Y | 1T20 | Δ Q-o-Q | | | |
| Sales volume (‘000) | 2Q20 | 2Q19 | Δ Y-o-Y | 1Q20 | Δ Q-o-Q | 6M20 | 6M19 | Δ Y-o-Y |
| Exports | 2,710,040 | 2,126,088 | 27% | 2,711,661 | 0% | 5,421,701 | 3,730,817 | 45% |
| Pulp | 2,615,068 | 2,013,287 | 30% | 2,626,539 | 0% | 5,241,607 | 3,540,907 | 48% |
| Paper | 94,972 | 112,801 | -16% | 85,122 | 12% | 180,094 | 189,910 | -5% |
| Paperboard | 21,935 | 15,691 | 40% | 15,599 | 41% | 37,534 | 26,631 | 41% |
| Printing & Writing | 69,425 | 97,110 | -29% | 68,666 | 1% | 138,091 | 162,209 | -15% |
| Other paper1 | 3,612 | - | 0% | 857 | 321% | 4,469 | 1,070 | 318% |
| Domestic Market | 303,030 | 388,333 | -22% | 412,449 | -27% | 715,479 | 786,908 | -9% |
| Pulp | 162,540 | 200,598 | -19% | 229,758 | -29% | 392,298 | 402,060 | -2% |
| Paper | 140,490 | 187,735 | -25% | 182,691 | -23% | 323,181 | 384,848 | -16% |
| Paperboard | 27,854 | 32,866 | -15% | 28,805 | -3% | 56,659 | 63,040 | -10% |
| Printing & Writing | 81,399 | 133,459 | -39% | 122,867 | -34% | 204,266 | 278,781 | -27% |
| Other paper1 | 31,237 | 21,410 | 46% | 31,019 | 1% | 62,256 | 43,027 | 45% |
| Total Sales Volume | 3,013,070 | 2,514,422 | 20% | 3,124,110 | -4% | 6,137,180 | 4,517,725 | 36% |
| Pulp | 2,777,608 | 2,213,885 | 25% | 2,856,297 | -3% | 5,633,905 | 3,942,967 | 43% |
| Paper | 235,462 | 300,536 | -22% | 267,813 | -12% | 503,275 | 574,758 | -12% |
| Paperboard | 49,789 | 48,557 | 3% | 44,404 | 12% | 94,193 | 89,671 | 5% |
| Printing & Writing | 150,824 | 229,814 | -35% | 191,533 | -21% | 342,357 | 440,990 | -22% |
| Other paper1 | 34,849 | 22,166 | 63% | 31,876 | 9% | 66,725 | 44,097 | 51% |
| | | | | | | | | |
Average net price (R$/ton) | 2Q20 | 2Q19 | Δ Y-o-Y | 1Q20 | Δ Q-o-Q | 6M20 | 6M19 | Δ Y-o-Y |
| Exports | 2,599 | 2,541 | 2% | 2,146 | 21% | 2,372 | 2,624 | -10% |
| Pulp | 2,536 | 2,471 | 3% | 2,090 | 21% | 2,313 | 2,562 | -10% |
| Paper | 4,325 | 3,786 | 14% | 3,881 | 11% | 4,115 | 3,772 | 9% |
| Domestic Market | 3,141 | 3,252 | -3% | 2,817 | 12% | 2,955 | 3,274 | -10% |
| Pulp | 2,111 | 2,386 | -12% | 1,734 | 22% | 1,890 | 2,448 | -23% |
| Paper | 4,333 | 4,177 | 4% | 4,180 | 4% | 4,247 | 4,136 | 3% |
| Total | 2,654 | 2,651 | 0% | 2,234 | 19% | 2,440 | 2,737 | -11% |
| Pulp | 2,512 | 2,463 | 2% | 2,061 | 22% | 2,283 | 2,550 | -10% |
| Paper | 4,330 | 4,030 | 7% | 4,085 | 6% | 4,200 | 4,016 | 5% |
Average net price (US$/ton) | 2Q20 | 2Q19 | Δ Y-o-Y | 1Q20 | Δ Q-o-Q | 6M20 | 6M19 | Δ Y-o-Y |
| Exports | 482 | 648 | -26% | 481 | 0% | 482 | 682 | -29% |
| Pulp | 471 | 630 | -25% | 469 | 0% | 470 | 666 | -29% |
| Paper | 803 | 966 | -17% | 871 | -8% | 836 | 981 | -15% |
| Domestic Market | 583 | 830 | -30% | 632 | -8% | 600 | 852 | -30% |
| Pulp | 392 | 609 | -36% | 389 | 1% | 384 | 637 | -40% |
| Paper | 804 | 1,066 | -25% | 937 | -14% | 863 | 1,076 | -20% |
| Total | 493 | 676 | -27% | 501 | -2% | 496 | 712 | -30% |
| Pulp | 466 | 628 | -26% | 462 | 1% | 464 | 663 | -30% |
| Paper | 804 | 1,028 | -22% | 916 | -12% | 853 | 1,045 | -18% |
¹ Paper of other manufacturers sold by Suzano and tissue paper.
FX Rate R$/US$ | 2Q20 | 2Q19 | Δ Y-o-Y | 1Q20 | Δ Q-o-Q |
| Closing | 5.48 | 3.83 | 43% | 5.20 | 5% |
| Average | 5.39 | 3.92 | 37% | 4.46 | 21% |

APPENDIX 2 – Consolidated Statement of Income and Goodwill Amortization
Income Statement (R$ ‘000) | 2Q20 | 2Q19 | Δ Y-o-Y | 1Q20 | Δ Q-o-Q | 6M20 | 6M19 | Δ Y-o-Y |
| | | | | | | | | |
| Net Revenue | 7,995,673 | 6,665,082 | 20% | 6,980,793 | 15% | 14,976,466 | 12,364,081 | 21% |
| Cost of Goods Sold | (4,788,694) | (5,222,119) | -8% | (4,819,999) | -1% | (9,608,693) | (9,947,012) | -3% |
| Gross Debt | 3,206,979 | 1,442,963 | 122% | 2,160,794 | 48% | 5,367,773 | 2,417,069 | 122% |
| Gross Margin | 40.1% | 21.6% | 18 p.p. | 31.0% | 9 p.p. | 35.8% | 19.5% | 16 p.p. |
| | | | | | | | | |
| Operating Expense/Income | (690,805) | (559,902) | 23% | (812,330) | -15% | (1,503,135) | (1,349,196) | 11% |
| Selling Expenses | (547,098) | (456,981) | 20% | (514,936) | 6% | (1,062,034) | (898,284) | 18% |
| General and Administrative Expenses | (335,715) | (278,031) | 21% | (314,836) | 7% | (650,551) | (608,796) | 7% |
| Other Operating Income (Expenses) | 195,671 | 171,199 | 14% | 16,731 | 1070% | 212,402 | 152,315 | 39% |
| Equity Equivalence | (3,663) | 3,911 | -194% | 711 | -615% | (2,952) | 5,569 | -153% |
| EBIT | 2,516,174 | 883,061 | 185% | 1,348,464 | 87% | 3,864,638 | 1,067,873 | 262% |
| | | | | | | | | |
| Depreciation, Amortization & Depletion | 1,709,381 | 2,327,704 | -27% | 1,648,200 | 4% | 3,357,581 | 4,798,989 | -30% |
| | | | | | | | | |
| EBITDA | 4,229,218 | 3,206,854 | 32% | 2,995,953 | 41% | 7,225,171 | 5,861,293 | 23% |
| EBITDA Margin (%) | 52.9% | 48.1% | 5 p.p. | 42.9% | 10 p.p. | 48.2% | 47.4% | 1 p.p. |
| | | | | | | | | |
| Adjusted EBITDA1 | 4,179,815 | 3,100,518 | 35% | 3,026,171 | 38% | 7,206,009 | 5,861,761 | 23% |
| Adjusted EBITDA Margin1 | 52.3% | 46.5% | 6 p.p. | 43.3% | 9 p.p. | 48.1% | 47.4% | 1 p.p. |
| | | | | | | | | |
| Net Financial Result | (5,657,238) | 79,065 | - | (22,444,048) | -75% | (28,101,286) | (1,857,078) | - |
| Financial Expenses | 82,419 | 149,607 | -45% | 120,754 | -32% | 203,173 | 298,929 | -32% |
| Financial Revenues | (1,033,126) | (1,086,192) | -5% | (1,086,424) | -5% | (2,119,550) | (2,078,996) | 2% |
| Exchange Rate Variation | (2,930,209) | 758,223 | - | (12,419,586) | -76% | (15,349,795) | 302,496 | - |
| Net Proceeds Generated by Derivatives | (1,776,322) | 257,427 | - | (9,058,792) | -80% | (10,835,114) | (379,507) | - |
| Earnings Before Taxes | (3,141,064) | 962,126 | - | (21,095,584) | -85% | (24,236,648) | (789,205) | - |
| | | | | | | | | |
| Income and Social Contribution Taxes | 1,088,546 | (262,278) | - | 7,676,523 | -86% | 8,765,069 | 259,921 | - |
| | | | | | | | | |
| Net Income (Loss) | (2,052,518) | 699,848 | -393% | (13,419,061) | -85% | (15,471,579) | (529,284) | 2823% |
| Net Margin | -25.7% | 10.5% | -36 p.p. | -192.2% | 167 p.p. | -103.3% | -4.3% | -99 p.p. |
| Goodwill amortization - PPA (R$ ‘000) | 2Q20 | 2Q19 | Δ Y-o-Y | 1Q20 | Δ Q-o-Q |
| COGS | (153,832) | (1,163,925) | -87% | (152,950) | 1% |
| Selling Expenses | (206,787) | (202,085) | 2% | (206,787) | 0% |
| General and administrative expenses | 2,094 | 5,404 | -61% | (2,240) | - |
| Other operational revenues (expenses) | (5,085) | (24,888) | -80% | (8,434) | -40% |
| Financial results | 18,479 | 102,707 | -82% | 18,479 | 0% |
1 Excluding non-recurring items and PPA effects.
APPENDIX 3 – Consolidated Balance Sheet
| Assets (R$ ´000) | 06/30/2020 | 03/31/2020 | 06/30/2019 |
| | | | |
| Current Assets | | | |
| Cash and cash equivalents | 10,473,701 | 4,548,329 | 4,104,641 |
| Financial investments | 2,030,560 | 5,009,160 | 3,692,806 |
| Trade accounts receivable | 3,762,875 | 4,447,957 | 2,895,714 |
| Inventories | 4,206,778 | 4,262,511 | 7,365,938 |
| Recoverable taxes | 888,245 | 836,043 | 1,303,898 |
| Derivative financial instruments | 152,978 | 128,845 | 569,297 |
| Advance to suppliers | 106,636 | 158,740 | 127,136 |
| Other assets | 281,471 | 266,231 | 345,516 |
| Total Current Assets | 21,903,244 | 19,657,816 | 20,404,946 |
| Non-Current Assets | | | |
| Financial investments | 182,936 | 181,564 | 174,699 |
| Recoverable taxes | 712,279 | 679,779 | 478,232 |
| Deferred taxes | 10,454,646 | 9,363,252 | 1,026,457 |
| Derivative financial instruments | 925,459 | 959,549 | 823,476 |
| Advance to suppliers | 1,149,832 | 1,212,713 | 1,024,625 |
| Judicial deposits | 268,462 | 267,338 | 352,187 |
| Biological assets | 10,672,724 | 10,431,416 | 10,094,235 |
| Investments | 325,420 | 326,879 | 228,381 |
| Property, plant and equipment | 40,242,196 | 40,701,410 | 41,744,825 |
| Right of use on lease agreements | 4,199,804 | 3,956,304 | 4,245,797 |
| Intangible | 17,225,097 | 17,468,599 | 18,212,469 |
| Other assets | 231,633 | 235,810 | 201,616 |
| Total Non-Current Assets | 86,590,488 | 85,784,613 | 78,606,999 |
| | | | |
| Total Assets | 108,493,732 | 105,442,429 | 99,011,945 |
| | | | |
| Liabilities and Equity (R$ ´000) | 06/30/2020 | 03/31/2020 | 06/30/2019 |
| | | | |
| Current Liabilities | | | |
| Trade accounts payable | 2,081,533 | 2,408,286 | 3,986,488 |
| Loans, financing and debentures | 5,546,123 | 6,523,908 | 4,693,057 |
| Accounts payable for lease operations | 704,174 | 664,651 | 536,891 |
| Derivative financial instruments | 4,529,091 | 4,642,367 | 615,183 |
| Taxes payable | 274,858 | 226,565 | 245,000 |
| Payroll and charges | 380,762 | 308,756 | 370,853 |
| Liabilities for assets acquisitions and subsidiaries | 127,721 | 116,792 | 499,984 |
| Dividends payable | 4,891 | 5,714 | 9,907 |
| Other liabilities | 284,828 | 370,800 | 463,369 |
| Total Current Liabilities | 13,933,981 | 15,267,839 | 11,420,732 |
| | | | |
| Non-Current Liabilities | | | |
| Loans, financing and debentures | 75,082,454 | 69,257,752 | 55,786,677 |
| Accounts payable for lease operations | 4,469,798 | 4,062,710 | 3,822,300 |
| Derivative financial instruments | 7,369,241 | 7,150,959 | 2,031,612 |
| Liabilities for assets acquisitions and subsidiaries | 530,414 | 516,979 | 513,792 |
| Provision for judicial liabilities | 3,441,451 | 3,460,373 | 3,541,857 |
| Actuarial liabilities | 744,105 | 739,595 | 590,016 |
| Deferred taxes | 75,354 | 76,073 | 599,184 |
| Other liabilities | 235,499 | 245,272 | 276,295 |
| Total Non-Current Liabilities | 91,948,316 | 85,509,713 | 67,161,733 |
| | | | |
| Shareholders’ Equity | | | |
| Share capital | 9,235,546 | 9,235,546 | 9,235,546 |
| Capital reserves | 6,200,079 | 6,198,899 | 6,200,358 |
| Retained earnings reserves | 317,144 | 317,144 | 3,080,618 |
| Equity valuation adjustment | 2,191,704 | 2,205,836 | 2,295,169 |
| Retained loss | (15,453,035) | (13,409,659) | (498,557) |
| Total Equity | 2,491,438 | 4,547,766 | 20,313,134 |
| | | | |
| Non-controlling shareholders interests | 119,997 | 117,111 | 116,346 |
| | | | |
| Total Liabilities and Equity | 108,493,732 | 105,442,429 | 99,011,945 |
APPENDIX 4 – Consolidated Statement of Cash Flow
| Cash Flow (R$ ‘000) | 2Q20 | 2Q19 | 6M20 | 6M19 |
| | | | | |
| Cash flow from operating activities | | | | |
| Net income/(loss) for the period | (2,052,518) | 699,848 | (15,471,579) | (529,284) |
| Depreciation, depletion and amortization | 1,648,285 | 2,188,233 | 3,238,678 | 4,631,559 |
| Amortization of right of use | 53,979 | 35,930 | 93,309 | 63,889 |
| Sublease of ships | (11,365) | - | (11,365) | - |
| Interest expense on lease liabilities | 108,138 | 58,278 | 203,488 | 96,993 |
Results from sale and disposals of property, plant and equipment and biological assets, net | (13,831) | 14,792 | (9,343) | 3,504 |
| Equity equivalence | 3,663 | (3,911) | 2,952 | (5,569) |
| Exchange rate and monetary variations, net | 2,930,209 | (758,223) | 15,349,795 | (302,496) |
| Interest expenses with loans, financing and debentures, net | 846,702 | 851,550 | 1,736,775 | 1,676,115 |
| Capitalized interest | (4,137) | (810) | (7,940) | (1,417) |
| Accrual of interest on marketable securities | (15,232) | (19,006) | (74,102) | (247,053) |
| Amortization of fundraising costs | 16,018 | 128,282 | 41,268 | 159,856 |
| Derivative (gains) losses, net | 1,776,322 | (257,427) | 10,835,114 | 379,507 |
| Fair value adjustment of biological assets | (173,733) | (83,453) | (173,733) | (83,453) |
| Deferred income tax and social contribution expenses | (1,092,015) | 199,949 | (8,822,898) | (451,499) |
| Interest on employee benefits | 13,332 | 13,421 | 26,527 | 26,842 |
| Provision/ (Reversal) for judicial liabilities | (13,480) | 12,771 | (22,252) | 2,475 |
| Allowance for doubtful accounts, net | 4,728 | (17,652) | 10,250 | (9,928) |
| Provision for (reversal of) inventory losses and write-offs | 16,452 | (10,289) | 32,620 | (12,028) |
| Provision for loss of ICMS credits, net | 28,580 | 32,128 | 48,151 | 69,191 |
| Other | 7,359 | 1,428 | 12,798 | 66,655 |
| Decrease (increase) in assets | 830,437 | 352,384 | 948,814 | (115,075) |
| Trade accounts receivables | 814,715 | 733,587 | 206,570 | 1,065,488 |
| Inventories | 42,347 | (265,885) | 466,475 | (1,208,554) |
| Recoverable taxes | (86,487) | (76,777) | 114,501 | (18,032) |
| Other assets | 59,862 | (38,541) | 161,268 | 46,023 |
| Increase (decrease) in liabilities | (237,556) | (44,828) | (692,287) | (361,388) |
| Trade accounts payables | (258,727) | (75,904) | (352,975) | (817) |
| Taxes payable | 83,722 | 7,065 | 24,235 | 252,757 |
| Payroll and charges | 72,583 | 69,611 | (19,679) | (262,909) |
| Other liabilities | (135,134) | (45,600) | (343,868) | (350,419) |
| Cash provided by operations, net | 4,670,337 | 3,393,395 | 7,295,040 | 5,057,396 |
| Payment of interest with financing, loans and debentures | (515,272) | (678,936) | (1,682,413) | (1,462,681) |
| Interest received from marketable securities | 74,093 | 110,865 | 126,579 | 285,922 |
| Payment of income taxes | (33,763) | (94,280) | (62,694) | (405,257) |
| Cash provided by operating activities | 4,195,395 | 2,731,044 | 5,676,512 | 3,475,380 |
| | | | | |
| Investing activities | | | | |
| Additions to property, plant and equipment | (1,082,944) | (1,158,384) | (1,961,063) | (2,655,950) |
| Proceeds from sale of property, plant and equipment | 33,982 | 49,762 | 61,887 | 83,695 |
| Increase of capital in subsidiaries and associates | - | - | - | (11,216) |
| Marketable securities, net | 2,918,367 | 76,774 | 4,064,361 | 21,833,286 |
| Advance for acquisition of wood from operations with development | 75,501 | (85,284) | 6,544 | (212,150) |
| Acquisition of subsidiaries, net cash | - | 1 | - | (26,002,540) |
| Other investments | - | (269) | - | (269) |
| Cash used in investing activities, net | 1,944,906 | (1,117,400) | 2,171,729 | (6,965,144) |
| | | | | |
| Financing activities | | | | |
| Proceeds from loans, financing and debentures | 3,036,906 | 8,553,242 | 6,700,529 | 16,225,071 |
| Payment of derivative transactions | (1,661,453) | (29,427) | (1,834,250) | (4,662) |
| Payment of loans, financing and debentures | (1,721,392) | (8,275,951) | (6,224,940) | (12,011,492) |
| Payment of leases | (197,080) | (152,349) | (354,289) | (270,586) |
| Payment of dividends | - | (601,663) | - | (601,731) |
| Liabilities for assets acquisitions and subsidiaries | (2,832) | (1,724) | (5,670) | (3,425) |
| Other financing | - | 2,756 | - | 2,379 |
| Cash provided (used) by financing activities, net | (545,851) | (505,116) | (1,718,620) | 3,335,554 |
| | | | | |
| Exchange variation on cash and cash equivalents | 330,922 | (99,772) | 1,094,953 | (128,602) |
| | | | | |
| Increase (reduction) in cash and cash equivalents | 5,925,372 | 1,008,756 | 7,224,574 | (282,812) |
| Cash and cash equivalents at the beginning for the period | 4,548,329 | 3,095,885 | 3,249,127 | 4,387,453 |
| Cash and cash equivalents at the end for the period | 10,473,701 | 4,104,641 | 10,473,701 | 4,104,641 |
| Increase (reduction) in cash and cash equivalents | 5,925,372 | 1,008,756 | 7,224,574 | (282,812) |
APPENDIX 5 – EBITDA
| (R$ '000, except where otherwise indicated) | 2Q20 | 2Q19 | 6M20 | 6M19 |
| Net income | (2,052,518) | 699,848 | (15,471,579) | (529,284) |
| Net Financial Result | 5,657,238 | (79,065) | 28,101,286 | 1,857,078 |
| Income and Social Contribution Taxes | (1,088,546) | 262,278 | (8,765,069) | (259,921) |
| EBIT | 2,516,174 | 883,061 | 3,864,638 | 1,067,873 |
| Depreciation, Amortization and Depletion | 1,709,381 | 2,327,704 | 3,357,581 | 4,798,989 |
| EBITDA1 | 4,229,218 | 3,206,854 | 7,225,171 | 5,861,293 |
| EBITDA Margin | 52.9% | 48.1% | 48.2% | 47.4% |
| | | | | |
| Expenses with Fibria's transaction | 22 | 5,219 | 937 | 74,591 |
| PPA effect (asset write down) | 2,444 | 24,363 | 8,237 | 24,363 |
| Indemnity – FACEPA | - | 2,870 | (1,093) | 3,283 |
| Fixed asset write down | - | - | - | 1,858 |
| Judicial credits sale | - | (87,000) | - | (87,000) |
| Accruals for losses on ICMS credits | 34,707 | 31,541 | 50,072 | 66,700 |
| ICMS accrual complement | - | - | 2,632 | - |
| Expenses related to social actions to fight the Coronavirus | 25,636 | - | 26,230 | - |
| Expenses with obligations and contract cancellations | - | - | 6,008 | - |
| Adjustment of the fair value of biological assets | (173,733) | (83,453) | (173,733) | (83,453) |
| COVID-19 – Donations | 48,024 | - | 48,024 | - |
| Others | 13,527 | 128 | 13,527 | 128 |
| Adjusted EBITDA | 4,179,838 | 3,100,521 | 7,206,009 | 5,861,762 |
| Adjusted EBITDA Margin | 52.3% | 46.1% | 48.1% | 47.4% |
| | | | | |
¹ The Company's EBITDA is calculated in accordance with CVM Instruction 527 of October 4, 2012.
APPENDIX 6 – Segmented Income Statement
Segmented Financial Statement (R$ '000) | 2Q20 | 2Q19 |
| | Pulp | Paper | Non Segmented | Total Consolidated | Pulp | Paper | Non Segmented | Total Consolidated |
| | | | | | | | | |
| Net Revenue | 6,976,212 | 1,019,461 | - | 7,995,673 | 5,453,772 | 1,211,310 | - | 6,665,082 |
| Cost of Goods Sold | (4,117,353) | (671,341) | - | (4,788,694) | (4,434,657) | (787,462) | - | (5,222,119) |
| Gross Profit | 2,858,859 | 348,120 | - | 3,206,979 | 1,019,115 | 423,848 | - | 1,442,963 |
| Gross Margin | 41.0% | 34.1% | - | 40.1% | 18.7% | 35.0% | - | 21.6% |
| | | | | | | | | |
| Operating Expense/Income | (548,316) | (142,489) | - | (690,805) | (375,193) | (184,709) | - | (559,902) |
| Selling Expenses | (457,123) | (89,975) | - | (547,098) | (357,804) | (99,177) | - | (456,981) |
| General and Administrative Expenses | (236,172) | (99,543) | - | (335,715) | (190,221) | (87,810) | - | (278,031) |
| Other Operating Income (Expenses) | 153,620 | 42,051 | - | 195,671 | 172,832 | (1,633) | - | 171,199 |
| Equity Equivalence | (8,641) | 4,978 | - | (3,663) | - | 3,911 | - | 3,911 |
| EBIT | 2,310,543 | 205,631 | - | 2,516,174 | 643,922 | 239,139 | - | 883,061 |
| | | | | | | | | |
Depreciation, Amortization & Depletion | 1,586,667 | 122,714 | | 1,709,381 | 2,207,384 | 120,320 | | 2,327,704 |
| | | | | | | | | |
| EBITDA | 3,905,851 | 323,367 | - | 4,229,218 | 2,851,306 | 355,548 | - | 3,206,854 |
| EBITDA Margin | 56.0% | 31.7% | - | 52.9% | 52.3% | 29.4% | - | 48.1% |
| | | | | | | | | |
| Adjusted EBITDA1 | 3,894,309 | 285,726 | - | 4,179,845 | 2,741,375 | 359,143 | - | 3,100,518 |
| Adjusted EBITDA Margin1 | 55.8% | 28.0% | | 52.3% | 50.3% | 29.6% | | 46.5% |
| | | | | | | | | |
| Net Financial Result | - | - | (5,657,238) | (5,657,238) | - | - | 79,065 | 79,065 |
| | | | | | | | | |
| Earnings Before Taxes | 2,310,544 | 205,630 | (5,657,238) | (3,141,064) | 643,921 | 239,140 | 79,065 | 962,126 |
| | | | | | | | | |
Income and Social Contribution Taxes | - | - | 1,088,546 | 1,088,546 | - | - | (262,278) | (262,278) |
| | | | | | | | | |
| Net Income (Loss) | 2,310,544 | 205,630 | (4,568,692) | (2,052,518) | 643,921 | 239,140 | (183,213) | 699,848 |
| Net Margin | 33.1% | 20.2% | - | -25.7% | 11.8% | 19.7% | - | 10.5% |
1 Excluding non-recurring items and PPA effects.
Segmented Financial Statement (R$ '000) | 6M20 | 6M19 |
| | Pulp | Paper | Non Segmented | Total Consolidated | Pulp | Paper | Non Segmented | Total Consolidated |
| | | | | | | | | |
| Net Revenue | 12,862,936 | 2,113,530 | - | 14,976,466 | 10,055,758 | 2,308,323 | - | 12,364,081 |
| Cost of Goods Sold | (8,246,527) | (1,362,166) | - | (9,608,693) | (8,414,714) | (1,532,298) | - | (9,947,012) |
| Gross Profit | 4,616,409 | 751,364 | - | 5,367,773 | 1,641,044 | 776,025 | - | 2,417,069 |
| Gross Margin | 35.9% | 35.6% | - | 35.8% | 16.3% | 33.6% | - | 19.5% |
| | | | | | | | | |
| Operating Expense/Income | (1,179,960) | (323,175) | - | (1,503,135) | (971,699) | (377,497) | - | (1,349,196) |
| Selling Expenses | (875,343) | (186,691) | - | (1,062,034) | (712,005) | (186,279) | - | (898,284) |
| General and Administrative Expenses | (460,226) | (190,325) | - | (650,551) | (418,981) | (189,815) | - | (608,796) |
| Other Operating Income (Expenses) | 170,212 | 42,190 | - | 212,402 | 159,287 | (6,972) | - | 152,315 |
| Equity Equivalence | (14,603) | 11,651 | - | (2,952) | - | 5,569 | - | 5,569 |
| EBIT | 3,436,449 | 428,189 | - | 3,864,638 | 669,345 | 398,528 | - | 1,067,873 |
| | | | | | | | | |
Depreciation, Amortization & Depletion | 3,126,528 | 231,053 | - | 3,357,581 | 4,559,034 | 239,955 | - | 4,798,989 |
| | | | | | | | | |
| EBITDA | 6,577,580 | 647,591 | - | 7,225,171 | 5,228,379 | 632,914 | - | 5,861,293 |
| EBITDA Margin | 51.1% | 30.6% | - | 48.2% | 52.0% | 27.4% | - | 47.4% |
| | | | | | | | | |
| Adjusted EBITDA1 | 6,571,007 | 635,002 | - | 7,206,012 | 5,212,588 | 649,173 | - | 5,861,761 |
| Adjusted EBITDA Margin1 | 51.1% | 30.0% | - | 48.1% | 51.8% | 28.1% | - | 47.4% |
| | | | | | | | | |
| Net Financial Result | - | - | (28,101,286) | (28,101,286) | - | - | (1,857,078) | (1,857,078) |
| | | | | | | | | |
| Earnings Before Taxes | 3,436,449 | 428,189 | (28,101,286) | (24,236,648) | 669,347 | 398,526 | (1,857,078) | (789,205) |
| | | | | | | | | |
Income and Social Contribution Taxes | - | - | 8,765,069 | 8,765,069 | - | - | 259,921 | 259,921 |
| | | | | | | | | |
| Net Income (Loss) | 3,436,449 | 428,189 | (19,336,217) | (15,471,579) | 669,347 | 398,526 | (1,597,157) | (529,284) |
| Net Margin | 26.7% | 20.3% | - | -103.3% | 6.7% | 17.3% | - | -4.3% |
1 Excluding non-recurring items and PPA effects.
Forward-Looking Statements
This release may contain forward-looking statements. Such statements are subject to known and unknown risks and uncertainties that could cause the expectations expressed to not materialize or differ substantially from expected results. These risks include, among others, changes in future demand for the Company’s products, changes in factors affecting domestic and international product prices, changes in the cost structure, changes in the seasonal patterns of markets, changes in prices charged by competitors, foreign exchange variations, changes in the political or economic situation of Brazil, as well as emerging and international markets. The forward-looking statements were not reviewed by our independent auditors.