Exhibit 99.2

1 2Q20 Earnings Conference Call
2 This presentation contains what are considered “forward - looking statements,” as defined in Section 27 A of the 1933 Securities Act and Section 21 E of the 1934 Securities Exchange Act, as amended . Some of these forward - looking statements are identified with words such as “believe,” “may,” “could,” “would,” “possible,” “will,” “should,” “expect,” “intend,” “plan,” “anticipate,” “estimate,” “potential,” “outlook” or “continue,” as well as the negative forms of these words, other terms of similar meaning or the use of future dates . The forward - looking statements include, without limitation, statements related to the declaration or payment of dividends, implementation of the key operational and financial strategies and investment plans, guidance about future operations and factors or trends that influence the financial situation, liquidity or operational results . Such statements reflect the current view of the management and are subject to diverse risks and uncertainties . These are qualified in accordance with the inherent risks and uncertainties involving future expectations in general, and actual results could differ materially from those currently anticipated due to various risks and uncertainties . There is no guarantee that the expected events, trends or results will actually occur . The statements are based on diverse assumptions and factors, including general economic and market conditions, industry conditions and operating factors . Any changes in such assumptions or factors could cause actual results to differ materially from current expectations . Suzano does not undertake any obligation to update any such forward - looking statements as a result of new information, future events or otherwise, except as expressly required by law . All forward - looking statements in this presentation are covered in their entirety by this disclaimer . In addition, this presentation contains some financial indicators that are not recognized by the BR GAAP or IFRS . These indicators do not have a standard meaning and may not be comparable to indicators with a similar description used by other companies . We provide these indicators because we use them as measurements of Suzano's performance ; they should not be considered separately or as a replacement for other financial metrics that have been disclosed in accordance with BR GAAP or IFRS . Disclaimer
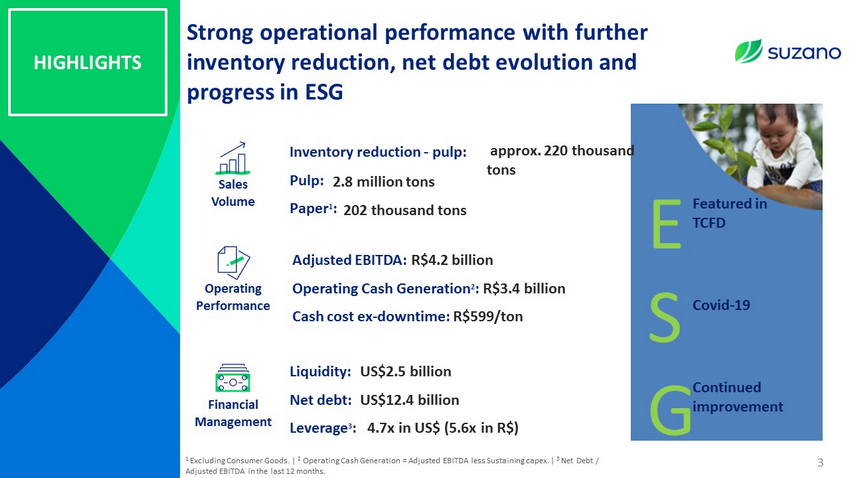
Strong operational performance with further inventory reduction, net debt evolution and progress in ESG HIGHLIGHTS Sales Volume Inventory reduction - pulp: Pulp: Paper 1 : 2.8 million tons 202 thousand tons Operating Performance Adjusted EBITDA: R$4.2 billion Operating Cash Generation 2 : R$3.4 billion Cash cost ex - downtime: R$599/ton Financial Management Liquidity: Net debt: Leverage 3 : US$2.5 billion US$12.4 billion 4.7x in US$ (5.6x in R$) 1 Excluding Consumer Goods. | 2 Operating Cash Generation = Adjusted EBITDA less Sustaining capex. | 3 Net Debt / Adjusted EBITDA in the last 12 months. Covid - 19 Continued improvement 3 E S G Featured in TCFD approx. 220 thousand tons
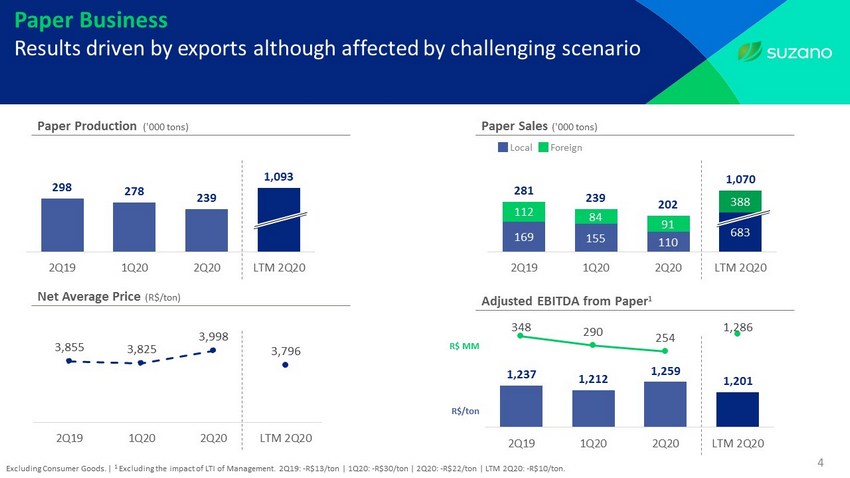
169 155 110 683 112 84 91 388 281 239 202 1,070 0 100 200 300 400 500 600 2Q19 1Q20 2Q20 LTM 2Q20 3,855 3,825 3,998 3,796 3,000 3,200 3,400 3,600 3,800 4,000 4,200 4,400 3000 3200 3400 3600 3800 4000 4200 4400 2Q19 1Q20 2Q20 LTM 2Q20 4 Paper Production ('000 tons) Paper Sales ('000 tons) Net Average P rice (R$/ton) Local Foreign Paper Business Results driven by exports although affected by challenging scenario Excluding Consumer Goods. | 1 Excluding the impact of LTI of Management. 2Q19: - R$13/ton | 1Q20: - R$30/ton | 2Q20: - R$22/ton | LTM 2Q20: - R$10/ton. 298 278 239 1,093 0 100 200 300 400 500 600 2Q19 1Q20 2Q20 LTM 2Q20 Adjusted EBITDA from Paper 1 R$/ton R$ MM 1,237 1,212 1,259 1,201 348 290 254 1,286 -200 -100 0 100 200 300 400 1,000 1,100 1,200 1,300 1,400 1,500 2Q19 1Q20 2Q20 LTM 2Q20
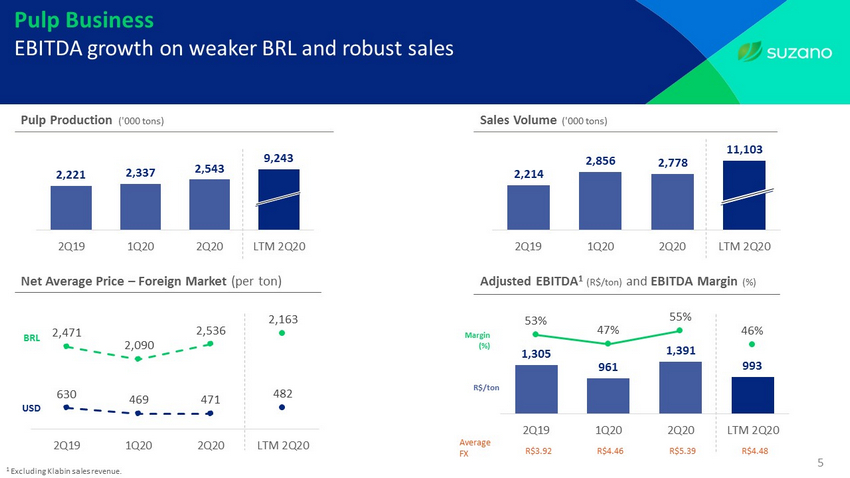
2,214 2,856 2,778 11,103 0 1,000 2,000 3,000 4,000 5,000 6,000 2Q19 1Q20 2Q20 LTM 2Q20 5 Pulp Business EBITDA growth on weaker BRL and robust sales BRL USD 1 Excluding Klabin sales revenue. Sales Volume ('000 tons) Net Average Price – Foreign Market (per ton) Pulp Production ('000 tons) 2,221 2,337 2,543 9,243 0 500 1,000 1,500 2,000 2,500 3,000 3,500 4,000 2Q19 1Q20 2Q20 LTM 2Q20 630 469 471 2,471 2,090 2,536 482 2,163 0 500 1000 1500 2000 2500 0 500 1000 1500 2000 2500 3000 2Q19 1Q20 2Q20 LTM 2Q20 R$/ton Margin (%) Average FX R$3.92 R$4.46 R$5.39 R$4.48 Adjusted EBITDA 1 (R$/ton) and EBITDA Margin (%) 1,305 961 1,391 993 53% 47% 55% 46% 0% 10% 20% 30% 40% 50% 60% 70% 0 500 1,000 1,500 2,000 2,500 2Q19 1Q20 2Q20 LTM 2Q20
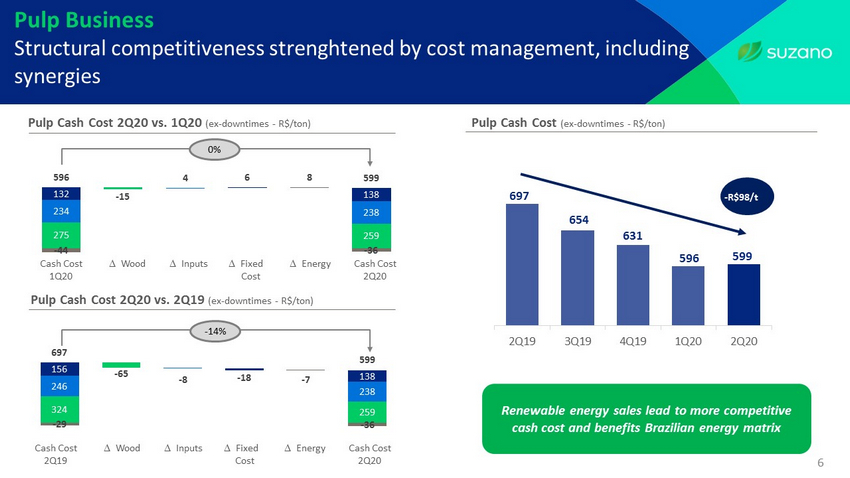
275 259 234 238 132 138 - 44 - 36 596 - 15 4 6 8 599 -200 0 200 400 600 800 1,000 Pulp Business Structural competitiveness strenghtened by cost management, including synergies - 14% Wood D D D Pulp Cash Cost 2Q20 vs. 2Q19 (ex - downtimes - R$/ton) Pulp Cash Cost 2Q20 vs. 1Q20 (ex - downtimes - R$/ton) 0 % 6 697 654 631 596 599 500 550 600 650 700 750 800 2Q19 3Q19 4Q19 1Q20 2Q20 Pulp Cash Cost (ex - downtimes - R$/ton) Renewable energy sales lead to more competitive cash cost and benefits Brazilian energy matrix - R$98/t Inputs Fixed Cost Energy Cash Cost 2Q19 Cash Cost 2Q20 Wood D D D Inputs Fixed Cost Energy Cash Cost 1Q20 Cash Cost 2Q20 324 259 246 238 156 138 - 29 - 36 697 - 65 - 8 - 18 - 7 599 -200 0 200 400 600 800 1,000
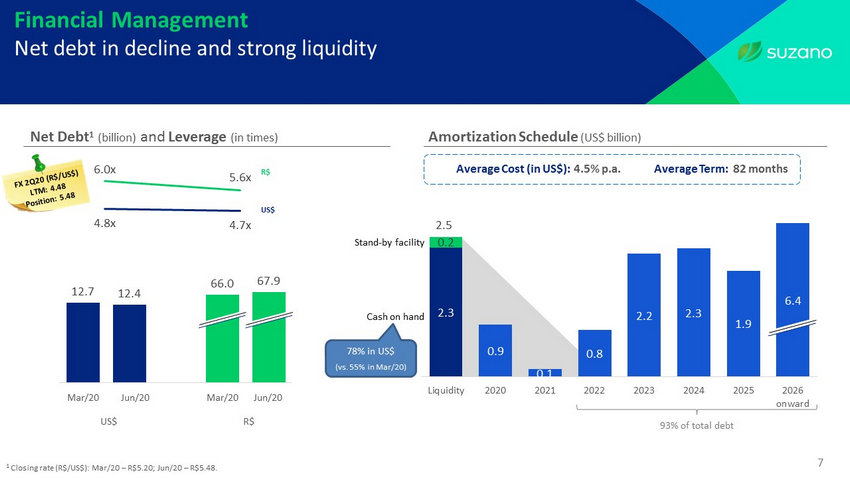
7 Financial Management Net debt in decline and strong liquidity 2.3 0.2 0.9 0.1 0.8 2.2 2.3 1.9 6.4 0.0 0.5 1.0 1.5 2.0 2.5 3.0 3.5 Liquidity 2020 2021 2022 2023 2024 2025 2026 onward 93% of total debt Stand - by facility Cash on hand 6 Average Cost (in US$): Amortization Schedule (US$ billion) 4.5% p.a. 82 months Net Debt 1 (billion) and Leverage (in times) Average Term: 1 Closing rate (R$/US$): Mar/20 – R$5.20; Jun/20 – R$5.48. 78% in US$ (vs. 55% in Mar/20) 12.7 12.4 66.0 67.9 0.0 2.0 4.0 6.0 8.0 10.0 12.0 14.0 16.0 18.0 20.0 Mar/20 Jun/20 Coluna1 Dez/192 Mar/203 Mar/20 Jun/20 Mar/20 Jun/20 6.0x 5.6x 4.8x 4.7x 3.0x 3.5x 4.0x 4.5x 5.0x 5.5x 6.0x 6.5x US$ R$ US$ R$ 2.5
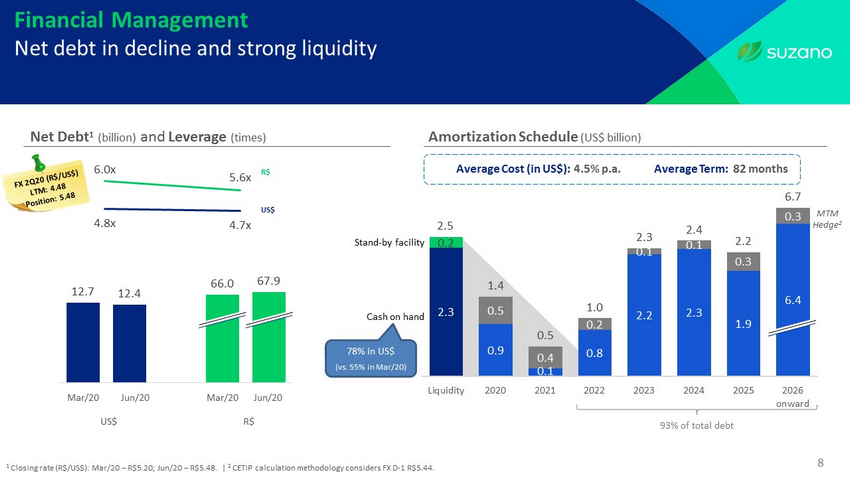
8 Financial Management Net debt in decline and strong liquidity 2.3 0.2 0.9 0.1 0.8 2.2 2.3 1.9 2.7 0.0 0.5 1.0 1.5 2.0 2.5 3.0 3.5 Liquidity 2020 2021 2022 2023 2024 2025 2026 onward 93% of total debt Stand - by facility Cash on hand 6 Average Cost (in US$): Amortization Schedule (US$ billion) 4.5% p.a. 82 months Net Debt 1 (billion) and Leverage (times) Average Term: 1 Closing rate (R$/US$): Mar/20 – R$5.20; Jun/20 – R$5.48. | 2 CETIP calculation methodology considers FX D - 1 R$5.44. 78% in US$ (vs. 55% in Mar/20) 12.7 12.4 66.0 67.9 0.0 2.0 4.0 6.0 8.0 10.0 12.0 14.0 16.0 18.0 20.0 Mar/20 Jun/20 Coluna1 Dez/192 Mar/203 Mar/20 Jun/20 Mar/20 Jun/20 6.0x 5.6x 4.8x 4.7x 3.0x 3.5x 4.0x 4.5x 5.0x 5.5x 6.0x 6.5x US$ R$ US$ R$ MTM Hedge 2 2.3 0.2 0.9 0.1 0.8 2.2 2.3 1.9 6.4 0.5 0.4 0.2 0.1 0.1 0.3 0.3 1.4 0.5 1.0 2.3 2.4 2.2 6.7 0.0 0.5 1.0 1.5 2.0 2.5 3.0 3.5 2.5
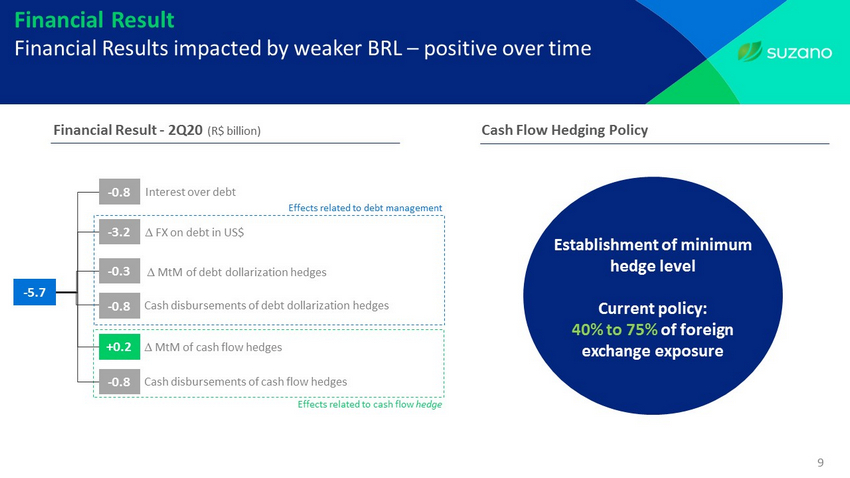
Effects related to cash flow hedge Financial Result Financial Results impacted by weaker BRL – positive over time Financial Result - 2Q20 (R$ billion) - 0.8 Interest over debt - 3.2 D FX on debt in US$ +0.2 D MtM of debt dollarization hedges - 0.8 D MtM of cash flow hedges Effects related to debt management 9 Cash disbursements of debt dollarization hedges - 0.8 Cash disbursements of cash flow hedges - 5.7 - 0.3 Cash Flow Hedging Policy Establishment of minimum hedge level Current policy: 40% to 75% of foreign exchange exposure
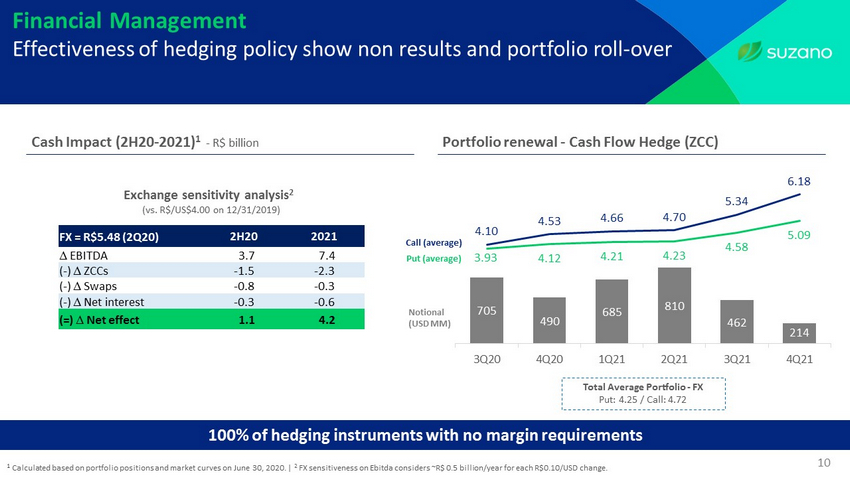
10 Financial Management Effectiveness of hedging policy show non results and portfolio roll - over 1 Calculated based on portfolio positions and market curves on June 30, 2020 . | 2 FX sensitiveness on Ebitda considers ~R$ 0.5 billion/year for each R$0.10/USD change. Cash Impact (2H20 - 2021) 1 - R$ billion Portfolio renewal - Cash Flow Hedge (ZCC) 705 490 685 810 462 214 3.93 4.12 4.21 4.23 4.58 5.09 4.10 4.53 4.66 4.70 5.34 6.18 3Q20 4Q20 1Q21 2Q21 3Q21 4Q21 Notional (USD MM) Put (average) Call (average) FX = R$5.48 (2Q20) 2H20 2021 D EBITDA 3.7 7.4 ( - ) D ZCCs - 1.5 - 2.3 ( - ) D Swaps - 0.8 - 0.3 ( - ) D Net interest - 0.3 - 0.6 (=) D Net effect 1.1 4.2 Exchange sensitivity analysis 2 (vs. R$/US$4.00 on 12/31/2019) 100% of hedging instruments with no margin requirements Total Average Portfolio - FX Put : 4.25 / Call: 4.72
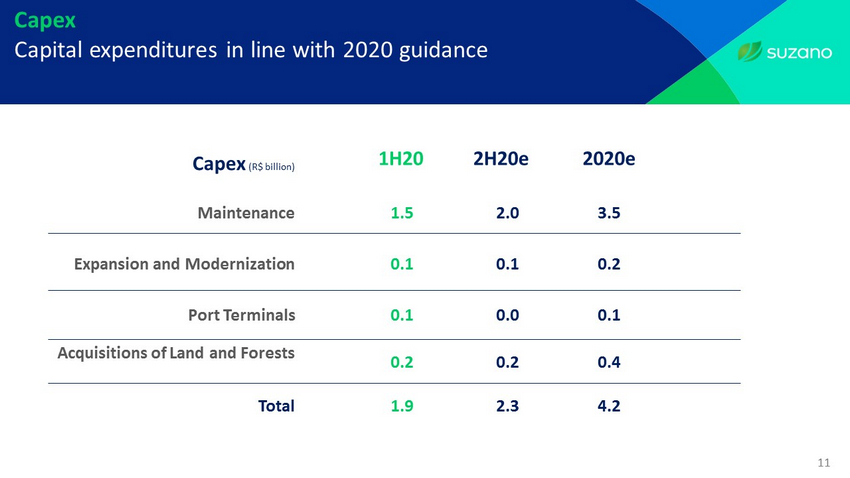
11 Capex Capital expenditures in line with 2020 guidance Maintenance Port Terminals Total Expansion and Modernization Acquisitions of Land and Forests Capex (R$ billion) 2H20e 2.0 0.0 2.3 0.1 0.2 2020e 3.5 0.1 4.2 0.2 0.4 1H20 1.5 0.1 1.9 0.1 0.2
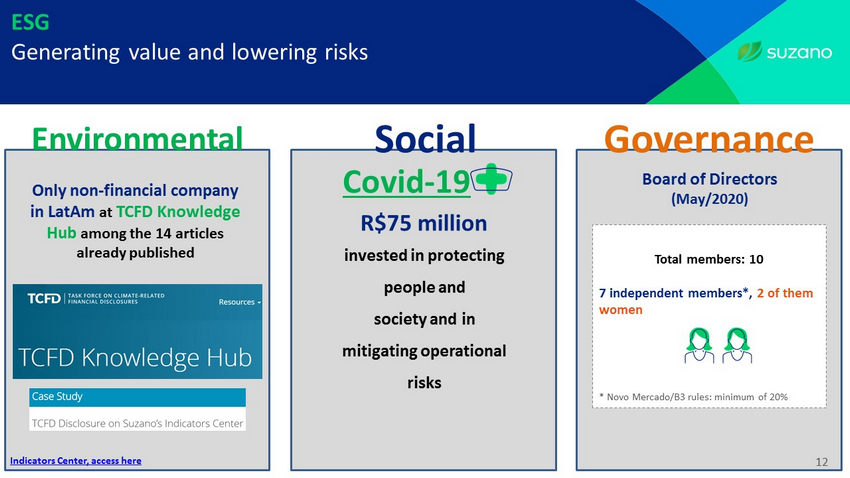
ESG Generating value and lowering risks 12 Social Governanc e Total members: 10 7 independent members*, 2 of them women * Novo Mercado/B3 rules: minimum of 20% Board of Directors (May/2020) Environment al Covid - 19 R$75 million invested in protecting people and society and in mitigating operational risks Only non - financial company in LatAm at TCFD Knowledge Hub among the 14 articles already published 12 Indicators Center, access here
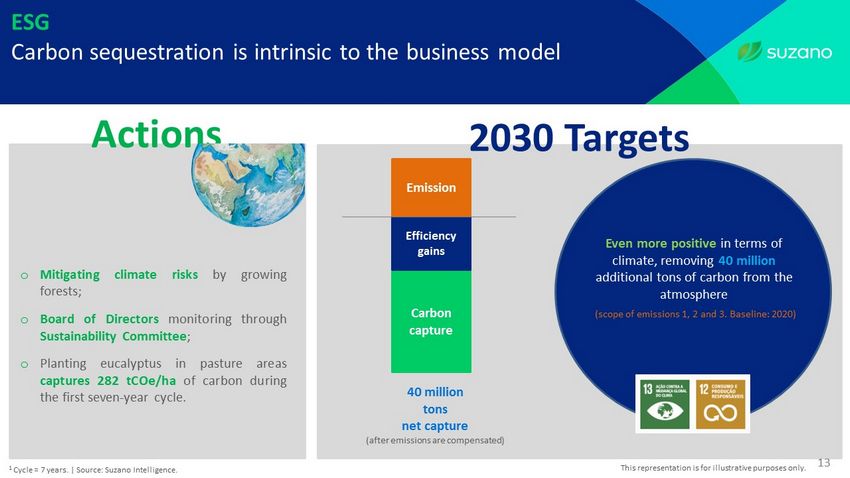
13 ESG Carbon sequestration is intrinsic to the business model o Mitigating climate risks by growing forests ; o Board of Directors monitoring through Sustainability Committee ; o Planting eucalyptus in pasture areas captures 282 tCOe/ha of carbon during the first seven - year cycle . Even more positive in terms of climate, removing 40 million additional tons of carbon from the atmosphere 2030 Targets (scope of emissions 1, 2 and 3. Baseline: 2020) 40 million tons net capture (after emissions are compensated) Carbon capture Efficiency gains Actions Emission This representation is for illustrative purposes only. 1 Cycle = 7 years. | Source: Suzano Intelligence.

Investor Relations www.suzano.com.br/ir ri@suzano.com.br Q&A