Exhibit 99.1

Strong operating performance despite the seasonal factors in the quarter, further reduction of net debt and deleverage
São Paulo, October 29, 2020. Suzano S.A. (B3: SUZB3 | NYSE: SUZ), one of the world’s largest integrated pulp and paper producers, announces today its consolidated results for the third quarter of 2020 (3Q20).
HIGHLIGHTS
| · | Pulp sales of 2,527 thousand tons (stable vs. 3Q19). |
| · | Paper sales of 319 thousand tons (+2% vs. 3Q19). |
| · | Adjusted EBITDA1 and Operating cash generation² of: R$3.8 billion and R$2.9 billion, respectively. |
| · | Adjusted EBITDA1/ton3 from pulp of R$1,339/ton (+56% vs. 3Q19). |
| · | Adjusted EBITDA1/ton4 of paper of R$1,236/ton (+1% vs. 3Q19). |
| · | Average net pulp price – export market: US$458/t (-13% vs. 3Q19). |
| · | Average net paper price5 of R$4,081/ton (+1% vs. 3Q19). |
| · | Pulp cash cost ex-downtime of R$600/ton (-8% vs. 3Q19). |
| · | Capture of operating synergies in line with planning. |
| · | Recovery of ICMS credits in Espírito Santo in the gross amount of R$146 million. |
| Financial Data (R$ million) | 3Q20 | 3Q19 | Δ Y-o-Y | 2Q20 | Δ Q-o-Q | LTM5 3Q20 | ||||||||||||||||||
| Net Revenue | 7,471 | 6,600 | 13 | % | 7,996 | -7 | % | 29,496 | ||||||||||||||||
| Adjusted EBITDA1 | 3,779 | 2,396 | 58 | % | 4,180 | -10 | % | 13,450 | ||||||||||||||||
| Adjusted EBITDA Margin1 | 51 | % | 36 | % | 15 | p.p. | 52 | % | -2 | p.p. | 46 | % | ||||||||||||
| Adjusted EBITDA Margin¹ ex- Klabin2 | 51 | % | 39 | % | 12 | p.p. | 52 | % | -2 | p.p. | 46 | % | ||||||||||||
| Net Financial Result | (4,223 | ) | (6,493 | ) | - | (5,657 | ) | - | (30,699 | ) | ||||||||||||||
| Net Income | (1,158 | ) | (3,460 | ) | - | (2,053 | ) | - | (15,455 | ) | ||||||||||||||
| Operating Cash Generation3 | 2,854 | 1,516 | 88 | % | 3,372 | -15 | % | 10,103 | ||||||||||||||||
| Net Debt /Adjusted EBITDA1 (x) - R$ | 5.1 | x | 4.7 | x | 0.4 | x | 5.6 | x | -0.5 | x | 5.1 | x | ||||||||||||
| Net Debt /Adjusted EBITDA1 (x) - US$ | 4.4 | x | 4.3 | x | 0.1 | x | 4.7 | x | -0.3 | x | 4.4 | x |
| Operational Data ('000 tons) | 3Q20 | 3Q19 | Δ Y-o-Y | 2Q20 | Δ Q-o-Q | LTM5 3Q20 | ||||||||||||||||||
| Sales | 2,846 | 2,862 | -1 | % | 3,013 | -6 | % | 12,271 | ||||||||||||||||
| Pulp | 2,527 | 2,549 | -1 | % | 2,778 | -9 | % | 11,080 | ||||||||||||||||
| Paper4 | 319 | 313 | 2 | % | 235 | 36 | % | 1,191 | ||||||||||||||||
| Production | 2,825 | 2,406 | 17 | % | 2,815 | 0 | % | 10,870 | ||||||||||||||||
| Pulp | 2,529 | 2,095 | 21 | % | 2,543 | -1 | % | 9,676 | ||||||||||||||||
| Paper4 | 296 | 311 | -5 | % | 272 | 9 | % | 1,194 |
¹Excludes non-recurring items and PPA effects. | 2 Excludes Klabin’s sales volume | 3 Considers Adjusted EBITDA less sustaining capex (cash basis). | 4 Includes the results of the Consumer Goods Unit. | 5Last 12 months.

3Q20 EARNINGS RELEASE |  |
The consolidated quarterly information has been prepared in accordance with the Securities and Exchange Commission (CVM) and Accounting Standards Committee (CPC) standards and is in compliance with International Accounting Standard (IFRS) issued by the International Accounting Standard Board (IASB). The data contained in this document was obtained from the financial information as made available to the CVM. The operating and financial information is presented based on consolidated numbers in Reais (R$). Summaries may diverge due to rounding. Non-financial data, such as volume, quantity, average price, average price, in Reais and Dollars, were not reviewed by independent auditors.
CONTENTS
| EXECUTIVE SUMMARY | 3 |
| PULP BUSINESS PERFORMANCE | 3 |
| PULP SALES VOLUME AND REVENUE | 3 |
| PULP CASH COST | 5 |
| PULP SEGMENT EBITDA | 7 |
| OPERATING CASH FLOW FROM THE PULP SEGMENT | 7 |
| PAPER BUSINESS PERFORMANCE | 8 |
| PAPER SALES VOLUME AND REVENUE¹ | 8 |
| OPERATING CASH FLOW FROM THE PAPER SEGMENT | 10 |
| ECONOMIC AND FINANCIAL PERFORMANCE | 11 |
| NET REVENUE | 11 |
| PRODUCTION | 11 |
| COST OF GOODS SOLD | 12 |
| SELLING EXPENSES | 12 |
| GENERAL AND ADMINISTRATIVE EXPENSES | 13 |
| ADJUSTED EBITDA | 13 |
| FINANCIAL INCOME | 14 |
| DERIVATIVE OPERATIONS | 15 |
| NET INCOME (LOSS) | 18 |
| INDEBTEDNESS | 18 |
| CAPITAL EXPENDITURE | 21 |
| OPERATING CASH GENERATION | 21 |
| FREE CASH FLOW | 22 |
| COVID-19 | 22 |
| ESG | 24 |
| SYNERGIES | 24 |
| TOTAL OPERATIONAL EXPENDITURES - PULP | 24 |
| EVENTS AFTER THE REPORTING PERIOD | 24 |
| CAPITAL MARKETS | 25 |
| FIXED INCOME | 26 |
| RATING | 26 |
| UPCOMING EVENTS | 27 |
| IR CONTACTS | 27 |
| APPENDICES | 28 |
| APPENDIX 1 - Operating Data | 28 |
| APPENDIX 2 - Consolidated Statement of Income and Goodwill Amortization | 30 |
| APPENDIX 3 - Consolidated Balance Sheet | 31 |
| APPENDIX 4 - Consolidated Statement of Cash Flow | 32 |
| APPENDIX 5 - EBITDA | 33 |
| APPENDIX 6 - Segmented Income Statement | 34 |
| Forward-Looking Statements | 36 |
Page 2 of 36
3Q20 EARNINGS RELEASE | |
EXECUTIVE SUMMARY
Despite the effects of the typical seasonality during this period of the year, Suzano maintained consistent results in the third quarter. In the pulp business, the highlights were the strong sales volume, stable inventories and a healthy production cash-cost in comparison with the previous quarter, once again demonstrating the continued gains in structural competitiveness, driven by the synergies resulting from the merger with Fibria. The performance of the paper business was boosted by strong growth in domestic sales, as a result of the seasonality of the period and with emphasis on the paperboard segment, after the second quarter marked by a historical decline in demand on account of the pandemic, especially in the printing & writing paper segment. The combination of healthy operating performance and the strong depreciation of average BRL against the USD fueled the 58% growth in adjusted EBITDA in relation to 3Q19 to reach R$ 3.8 billion.
As for financial management, in the third quarter the Company reduced its net debt in USD and leverage, measured by net debt/Adjusted EBITDA in the last twelve months. Its liquidity position remained solid, representing zero refinancing risk until 2022. Suzano has remained focused on financial discipline, as evident from its clear and consistent policies, and diligently plays its role of generating and sharing value in the long term.
The third quarter also witnessed progress on Environmental, Social and Governance (ESG). As part of its debt management, in September Suzano repurchased its bonds 2024, 2025 and 2026 issued by its wholly-owned subsidiary Suzano Austria GmbH ("Suzano Austria") new bonds to be placed in the international market at the principal amount of US$750 million. The new bonds have an environmental performance indicator (KPI) associated with the Company’s target to reduce greenhouse gas (GHG) emissions by 2025, which underscores Suzano’s commitment to be part of the solution to the global climate crisis and is aligned with the implementation of its Long-Term Target 2030 of reducing emissions, announced in the beginning of this year. Hence, the new bonds are classified as sustainability-linked bonds according to the principles established by the International Capital Markets Association. As a result, Suzano became the 2nd Company in the world and the 1st Company in the Americas to issue such a type of instrument, which allowed the monetization of the ESG aspect through the lower cost of funding obtained when compared to the issue of similar securities. This achievement keeps us motivated, after all it is only good for us if it is good for the world.
PULP BUSINESS PERFORMANCE
PULP SALES VOLUME AND REVENUE
The impact of COVID-19 on the global industry of pulp and paper in 3Q20 has been different in shape and intensity in the main markets. The quick resumption of economic activities in China has favored, throughout the 3Q20, the gradual boosting of demand for printing & writing paper and specialty papers and, specially, tissue. In Europe, the resumption of the demand for printing & writing paper and specialty papers has been slow but at the end of the quarter we have seen an improvement in the utilization rate of the industry assets. At the same time, the demand for tissue continued to show solid growth, above the historical average in markets such as North America and Europe, driven mainly by domestic consumption (at home) and a slight recovery in the institutional segment during holidays in the northern hemisphere. Packaging papers continued to perform positively, following the new consumption habits. In this context, Suzano's pulp sales in the 3Q20 totaled 2,527 thousand tons, practically stable when compared to the 3Q19 and a 9% below the 2Q20.
On the supply standpoint, the highlight was the increase of maintenance downtimes for pulp producers, intensified since August, which were supposed to occur in the first half of the year. The combination of a higher intensity of downtimes, the lower availability of pulp from integrated producers and the increase in the production of dissolving pulp, enabled a reduction in supply and, therefore, a better balance of the market fundamentals during the quarter.
Page 3 of 36
3Q20 EARNINGS RELEASE | |

In the quarter, pulp was sold by Suzano at a net average price of US$454/ton, down US$12/ton (-3%) from 2Q20 and US$73/ton (-14%) year-on-year, reflecting the drop in global pulp prices. Average net pulp price in the export market was US$458/ton (compared to US$471/ton in 2Q20 and US$526/ton in 3Q19).

Average net price in BRL was R$2,441/ton in 3Q20, down 3% when compared to 2Q20, however an increase of 17% when compared to 3Q19, due to the depreciation of the Brazilian real against the U.S. dollar in the period.
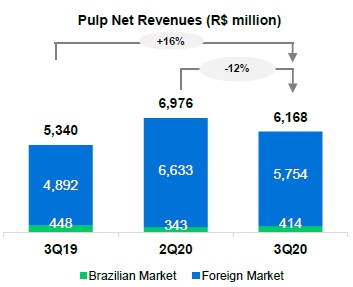
Net revenue from pulp was 16% higher than in 3Q19, mainly due to the 35% appreciation in average USD against the BRL, which was partially offset by the lower average net price in USD (-14%).
Compared to 2Q20, the 12% reduction in revenue was explained by the 9% decrease in sales and the 3% reduction in net average price in USD.
Page 4 of 36
3Q20 EARNINGS RELEASE | |
PULP CASH COST
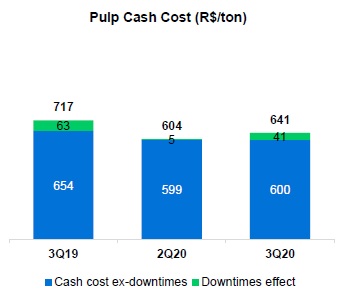
Cash cost excluding downtime in 3Q20 stood at R$600/t, decreasing R$54/ton from 3Q19 (-8%), due to: i) the lower wood cost on account of lower harvest costs, thanks to better operating performance, higher operating productivity and lower cost of diesel. Moreover, there was a decline in Company’s average supply radius, especially related to the decreases observed at Aracruz (non-utilization of Losango wood) and Maranhão, and the lower diesel costs; ii) the lower costs with energy as a result of lower price, especially of natural gas, and lower consumption, in turn resulting from optimization projects, as well as synergy and energy-efficiency gains. These effects were partially offset by the appreciation of 35% in the average USD against the BRL (impact of R$ 32/t), higher cost of chemicals, mainly due to higher consumption and lower energy sales price.
 |  |
Page 5 of 36
3Q20 EARNINGS RELEASE | |

¹Excludes the impact of maintenance and administrative downtimes.
Cash cost excluding downtime in 3Q20 remained stable in relation to 2Q20. The positive variations were observed in: i) the cost of energy, due to lower prices of natural gas and lower consumption due to greater operating stability; and ii) lower wood costs, due to the mix effect (consumption of wood with lower price), mainly in Mucuri and Maranhão Units. These positive factors were offset by: i) higher cost of chemicals, mainly due to the increase in prices of caustic soda; ii) higher fixed costs due to higher maintenance costs.
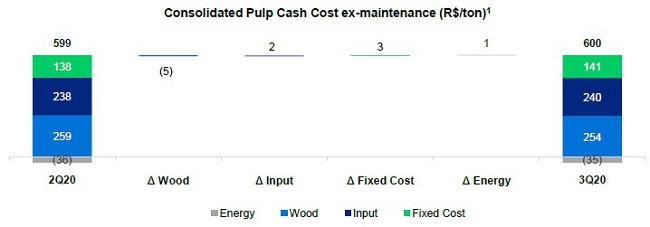
¹Excludes the impact of maintenance and administrative downtimes.

¹Based on cash cost excluding downtimes. Excludes energy sales.
Page 6 of 36
3Q20 EARNINGS RELEASE | |
PULP SEGMENT EBITDA
| Pulp segment | 3Q20 | 3Q19 | Δ Y-o-Y | 2Q20 | Δ Q-o-Q | LTM 3Q20 | |||||||||||||||||
| Adjusted EBITDA (R$ million) | 3,384 | 2,012 | 68 | % | 3,862 | -12 | % | 11,997 | |||||||||||||||
| Sales volume (k ton) | 2,527 | 2,347 | 8 | % | 2,777 | -9 | % | 10,879 | |||||||||||||||
| Pulp adjusted¹ EBITDA (R$/ton) | 1,339 | 857 | 56 | % | 1,391 | -4 | % | 1,103 |
¹ Excludes non-recurring items and PPA effects.
The 68% increase in Adjusted EBITDA from pulp in 3Q20 compared to 3Q19 mainly reflects the 35% appreciation in the average USD against the BRL, lower cash COGS (decline in cash production cost and lower impact of downtimes) and higher sales volume (+8%), which were partially offset by the lower net average pulp price in USD (-14%). The 56% increase in adjusted EBITDA per ton is mainly due to the exchange variation and the cost factor, which were partially offset by the lower average net pulp price in USD.
Compared to 2Q20, the 12% drop in adjusted EBITDA from pulp mainly reflects the 9% decrease in sales volume and lower net average price in USD (-3%). The negative impact from scheduled maintenance downtimes on cash COGS was offset by lower logistics expenses and other less significant impacts. In the case of Adjusted EBITDA per ton, price was the main factor for the 4% decline, which was partially offset by the reduction in COGS and SG&A expenses, as explained earlier.

¹ Excludes non-recurring items and PPA effects.
OPERATING CASH FLOW FROM THE PULP SEGMENT
| Operating cash flow - Pulp (R$ million) | 3Q20 | 3Q19 | Δ Y-o-Y | 2Q20 | Δ Q-o-Q | LTM 3Q20 | ||||||||||||||||||
| Adjusted EBITDA1 | 3,384 | 2,012 | 68 | % | 3,862 | -12 | % | 11,997 | ||||||||||||||||
| Maintenance Capex2 | (854 | ) | (811 | ) | 5 | % | (742 | ) | 15 | % | (3,072 | ) | ||||||||||||
| Operating Cash Flow | 2,530 | 1,201 | 111 | % | 3,120 | -19 | % | 8,925 |
¹ Excludes non-recurring items and PPA effects.
² Cash basis.
Page 7 of 36
3Q20 EARNINGS RELEASE | |

¹ Excludes sales volume related to the agreement with Klabin.
Operating cash generation per ton in the pulp segment increased 96% from 3Q19, reflecting the increase in Adjusted EBITDA per ton and the reduction in sustaining capex per ton. Compared to 2Q20, the 11% reduction was due to the lower per-ton EBITDA (as explained above) and the increase in sustaining capex per ton.
PAPER BUSINESS PERFORMANCE
The following data and analyses incorporate the joint results of the consumer goods and paper businesses.
PAPER SALES VOLUME AND REVENUE¹
According to the Forestry Industry Association (Ibá), domestic sales of printing & writing paper and paperboard decreased 7% between July and August in relation to the same period last year. From January to August 2020, sales contracted 18% in relation to 2019, reflecting the restrictive measures imposed to combat COVD-19 during the year. With the resumption of economic activity, domestic sales recovered gradually, with July and August registering a 46% growth in relation to the average of 2Q20.
Imports till August decreased 36% in relation to the same period last year. In July and August, imports decreased 62% in relation to the same period in 2019.
Domestic paperboard sales were positively affected by the resumption of diverse industrial sectors and retail consumption, as well as the accelerated changes in consumer habits at the peak of physical distancing, due to the COVID-19 pandemic. In July and August, the market expanded 22% in relation to the same period last year. As with the packaging market, the tissue market was also affected positively. According to Ibá, domestic sales in this market increased 4% from January to August in relation to the same period last year.
Suzano’s paper sales (printing & writing, paperboard and tissue) in Brazil totaled 220,000 tons in 3Q20, up 57% from 2Q20 and 4% from 3Q19, driven by higher sales of products for packaging and papers used for municipal election campaigns.
Paper sales in both the domestic and export markets in 3Q20 totaled 319,000 tons, up 36% from 2Q20 and 2% from 3Q19. Paper exports represented 31% of the total volume (vs. 40% and 33% in 2Q20 and 3Q19, respectively).
Page 8 of 36
3Q20 EARNINGS RELEASE | |
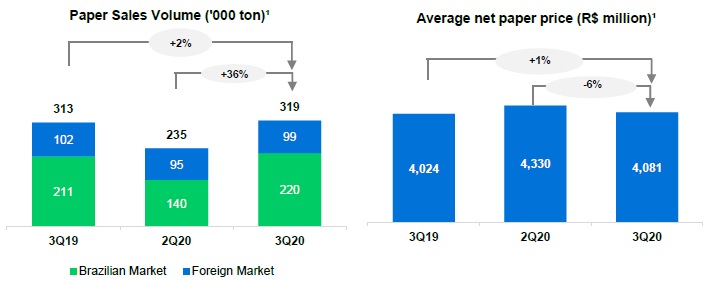
Average net price was R$4,081/ton in 3Q20, increasing R$57/ton (+1%) from 3Q19, due to the exchange rate effect on exports and a reduction of R$ 249/ton (-6%) versus 2Q20, due to the reduction in paper prices on international markets.
Net revenue from paper was R$1,302 million in 3Q20, up 28% from 2Q20, reflecting higher sales volumes in 3Q20 compared to the second quarter, which was more impacted by the COVID-19 restrictive measures.
Compared to the same period last year, net revenue from paper increased 3%.

*Includes the Consumer Goods Unit.
PAPER SEGMENT EBITDA
| Paper segment | 3Q20 | 3Q19 | Δ Y-o-Y | 2Q20 | Δ Q-o-Q | UDM 3Q20 | ||||||||||||||||||
| Adjusted EBITDA (R$ million)¹ | 394 | 385 | 3 | % | 317 | 24 | % | 1,453 | ||||||||||||||||
| Sales volume (k ton) | 319 | 313 | 2 | % | 235 | 36 | % | 1,191 | ||||||||||||||||
| Paper adjusted¹ EBITDA (R$/ton) | 1,236 | 1,229 | 1 | % | 1,348 | -8 | % | 1,220 |
¹ Excludes non-recurring items and PPA effects.
Page 9 of 36
3Q20 EARNINGS RELEASE | |
Adjusted EBITDA from paper in 3Q20 was 3% higher than in 3Q19, mainly due the 35% appreciation of the USD against the average BRL. Adjusted EBITDA was virtually stable.
Compared to 2Q20, paper Adjusted EBITDA increased 24%, mainly due to higher sales volume (+36%). In relation to per-ton EBITDA, a decrease of 8% was observed, explained by the reduction on net average price (-6%), which was partially offset by the reduction in COGS, mainly resulting from the lower effect of administrative downtimes and lower SG&A and other operating expenses.

¹ Excluding non-recurring items.
OPERATING CASH FLOW FROM THE PAPER SEGMENT
| Operating cash flow - Paper (R$ million) | 3Q20 | 3Q19 | Δ Y-o-Y | 2Q20 | Δ Q-o-Q | LTM 3Q20 | ||||||||||||||||||
| Adjusted EBITDA1 | 394 | 385 | 3 | % | 317 | 24 | % | 1,453 | ||||||||||||||||
| Maintenance Capex2 | (70 | ) | (70 | ) | 0 | % | (65 | ) | 7 | % | (275 | ) | ||||||||||||
| Operating Cash Flow | 325 | 314 | 3 | % | 252 | 29 | % | 1,178 |
¹ Excluding non-recurring items.
² Cash basis.
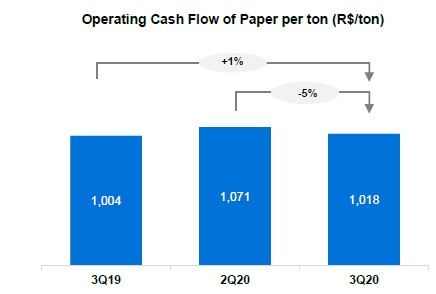
Operating cash generation per ton of paper in 3Q20 was R$1,018/t, up 1% from the previous year due to the increase in adjusted EBITDA.
Compared to 2Q20, although EBITDA was higher in 3Q20, net price was lower (-6%), resulting in a drop in per-ton cash generation (-5%).
Page 10 of 36
3Q20 EARNINGS RELEASE | |
ECONOMIC AND FINANCIAL PERFORMANCE
NET REVENUE
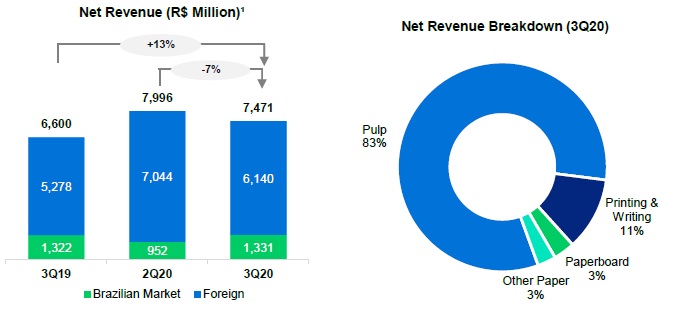
Suzano’s net revenue in 3Q20 was R$7,471 million, 82% of which came from exports (vs. 80% in 3Q19 and 88% in 2Q20). Compared to 3Q19, the 13% growth in net revenue mainly reflected the 35% appreciation in the average USD against the BRL, partially offset by the 14% decline in the average net pulp price in USD. The reduction of 7% in consolidated net revenue in 3Q20 when compared to the 2Q20 is basically explained by the 9% decrease in pulp sales. The total volume of pulp and paper sales in the quarter was 2,846 thousand tons, stable compared to the same period last year and 6% lower than 2Q20.
¹ Excludes service revenue from Portocel.
PRODUCTION
| Production (k ton) | 3Q20 | 3Q19 | Δ Y-o-Y | 2Q20 | Δ Q-o-Q | LTM 3Q20 | ||||||||||||||||||
| Market Pulp | 2,529 | 2,095 | +21 | % | 2,543 | -1 | % | 9,676 | ||||||||||||||||
| Paper | 296 | 311 | -5 | % | 272 | +9 | % | 1,194 | ||||||||||||||||
| Total | 2,825 | 2,406 | +17% | 2,815 | +0% | 10,871 |
In 3Q20, the following units underwent scheduled maintenance downtimes: lines A and C at the Aracruz Unit, line 2 of the Mucuri Unit, the Suzano Unit and the Veracel Unit. As already disclosed by the Company, given the current social scenario caused by the COVID-19 pandemic, in order to protect people and society, the Company decided to postpone most of its maintenance downtimes initially scheduled for the second half of the year. Pulp production remained stable in relation to 2Q20. The negative impact of downtimes was largely compensated by the acceleration of the production rate at the mills. Compared to the same period last year, apart from the accelerated pace of production at its pulp mills, there was a greater impact of downtimes (general maintenance and administrative) during that quarter.
Page 11 of 36
3Q20 EARNINGS RELEASE | |
Following is the calendar of Suzano’s scheduled maintenance downtimes:
| Mill - Pulp capacity | 2019 | 2020 | 2021 | |||||||||||||||||||
| 1Q19 | 2Q19 | 3Q19 | 4Q19 | 1Q20 | 2Q20 | 3Q20 | 4Q20 | 1Q21 | 2Q21 | 3Q21 | 4Q21 | |||||||||||
| Aracruz - Linha A (ES) – 590 kt | ||||||||||||||||||||||
| Aracruz - Linha B (ES) – 830 kt | ||||||||||||||||||||||
| Aracruz - Linha C (ES) – 920 kt | ||||||||||||||||||||||
| Imperatriz (MA)² – 1,650 kt | No downtime | |||||||||||||||||||||
| Jacareí (SP) – 1,100 kt | No downtime | |||||||||||||||||||||
| Limeira (SP)² – 690 kt | ||||||||||||||||||||||
| Mucuri - Linha 1 (BA)² – 580 kt | No downtime | |||||||||||||||||||||
| Mucuri - Linha 2 (BA) – 1,100 kt | ||||||||||||||||||||||
| Suzano (SP)² – 620 kt | ||||||||||||||||||||||
| Três Lagoas - Linha 1 (MS) – 1,300 kt | No downtime | |||||||||||||||||||||
| Três Lagoas - Linha 2 (MS) – 1,950 kt | No downtime | |||||||||||||||||||||
| Veracel (BA)¹ – 560 kt | ||||||||||||||||||||||
¹ Veracel is a joint operation between Suzano (50%) and Stora Enso (50%) with total annual capacity of 1,120 thousand tons.
² Includes integrated capacities and fluff.
COST OF GOODS SOLD
| COGS (R$ million) | 3Q20 | 3Q19 | Δ Y-o-Y | 2Q20 | Δ Q-o-Q | LTM 3Q20 | ||||||||||||||||||
| COGS | 4,474 | 4,986 | -10 | % | 4,789 | -7 | % | 19,893 | ||||||||||||||||
| Depreciation, depletion and amortization | 1,399 | 1,265 | 11 | % | 1,462 | -4 | % | 5,792 | ||||||||||||||||
| Cash COGS | 3,075 | 3,721 | -17 | % | 3,327 | -8 | % | 14,101 | ||||||||||||||||
| Sales volume | 2,846 | 2,862 | -1 | % | 3,013 | -6 | % | 12,271 | ||||||||||||||||
| Cash COGS/ton (R$/ton) | 1,081 | 1,300 | -17 | % | 1,104 | -2 | % | 1,149 | ||||||||||||||||
¹ Includes amortization of goodwill surplus/loss (PPA)
Cash COGS in 3Q20 totaled R$3,075 million, or R$1,081/ton. Compared to 3Q19, cash COGS declined 17%, mainly due to lower production cost (especially in pulp, explained by the factors detailed in the cash cost analysis, as well as the lower impact from downtimes) and the absence of Klabin’s pulp sales. These effects were partially offset by the 35% appreciation in the average USD against the BRL. On a per-ton basis, the 17% reduction is also explained by the same factors.
Compared to 2Q20, cash COGS decreased 8% mainly due to lower sales volume (-6%). On a per-ton basis, the indicator was 2% lower than in the previous quarter due to lower selling expenses and the mill/region mix.
SELLING EXPENSES
| Selling expenses (R$ million) | 3Q20 | 3Q19 | Δ Y-o-Y | 2Q20 | Δ Q-o-Q | LTM 3Q20 | ||||||||||||||||||
| Selling expenses | 523 | 469 | 12 | % | 547 | -4 | % | 2,123 | ||||||||||||||||
| Depreciation, depletion and amortization1 | 241 | 229 | 5 | % | 227 | 6 | % | 935 | ||||||||||||||||
| Cash selling expenses | 282 | 240 | 18 | % | 320 | -12 | % | 1,188 | ||||||||||||||||
| Sales volume | 2,846 | 2,862 | -1 | % | 3,013 | -6 | % | 12,271 | ||||||||||||||||
| Cash selling expenses/ton (R$/ton) | 99 | 84 | 18 | % | 106 | -7 | % | 97 |
¹ Includes amortization of goodwill surplus/loss (PPA)
Cash selling expenses increased 18% from 3Q19, mainly due to the 35% appreciation of the average USD against the BRL and higher logistics expenses, especially in the paper segment. On a per-ton basis, cash selling expenses increased 18% mainly due to the effect of exchange rate variation on expenses in foreign currency.
Page 12 of 36
3Q20 EARNINGS RELEASE | |
When compared to 2Q20, the 12% reduction in cash selling expenses is mainly explained by lower sales volume. Per-ton cash selling expenses decreased 7%, due to lower logistics expenses in the pulp segment in the export market.
GENERAL AND ADMINISTRATIVE EXPENSES
| General and Administrative Expenses (R$ million) | 3Q20 | 3Q19 | Δ Y-o-Y | 2Q20 | Δ Q-o-Q | LTM 3Q20 | ||||||||||||||||||
| General and Administrative Expenses | 313 | 279 | 12 | % | 336 | -7 | % | 1,249 | ||||||||||||||||
| Depreciation, depletion and amortization1 | 10 | 13 | -23 | % | 19 | -47 | % | 47 | ||||||||||||||||
| Cash general and administrative expenses | 303 | 266 | 14 | % | 317 | -4 | % | 1,202 | ||||||||||||||||
| Sales volume | 2,846 | 2,862 | -1 | % | 3,013 | -6 | % | 12,271 | ||||||||||||||||
| Cash general and administrative expenses/t (R$/ton) | 106 | 93 | 14 | % | 105 | 1 | % | 98 | ||||||||||||||||
¹ Includes amortization of goodwill surplus/loss (PPA).
² Inverse effect due to the write-off of PPA on contingencies (write-off of cases initially reassessed in the business combination).
Compared to 3Q19, the 14% increase in cash general and administrative expenses is mainly due to the increase in personnel expenses. On a per-ton basis, there was an increase of 14% due to the same factors.
Compared to 2Q20, cash general and administrative expenses decreased 4% due to lower expenses related to the COVID-19 pandemic in the previous quarter, partially offset by higher personnel expenses. On a per-ton basis, the 1% increase is explained by the same factors and by the lower dilution of fixed expenses.
Other operating income (expenses) amounted to an expense of R$4 million in 3Q20, compared to an income of R$116 million in 3Q18 and income of R$196 million in 2Q20. Compared to 3Q19, the variation is mainly explained by the R$128 million credit generated by excluding ICMS from the PIS and COFINS calculation base in that quarter. Compared to 2Q20, the variation is mainly explained by the result of the adjustment to fair value of biological assets, which occurred in the second and fourth quarter of each fiscal year.
ADJUSTED EBITDA
| Consolidated | 3Q20 | 3Q19 | Δ Y-o-Y | 2Q20 | Δ Q-o-Q | LTM 3Q20 | ||||||||||||||||||
| Adjusted EBITDA (R$ million)¹ | 3,779 | 2,396 | 58 | % | 4,180 | -10 | % | 13,450 | ||||||||||||||||
| Adjusted EBITDA¹ Margin - ex-Klabin | 51 | % | 39 | % | 12 | p.p. | 52 | % | -2 | p.p. | 46 | % | ||||||||||||
| Sales Volume ex-Klabin (k ton) | 2,846 | 2,661 | 7 | % | 3,013 | -6 | % | 12,070 | ||||||||||||||||
| Adjusted EBITDA¹ ex-Klabin/ton (R$/ton) | 1,328 | 901 | 47 | % | 1,387 | -4 | % | 1,114 | ||||||||||||||||
¹ Excludes non-recurring items and PPA effects.
The increase in Adjusted EBITDA in 3Q20 compared to 3Q19 is explained by: (i) the appreciation in the average USD against the BRL (+35%); (ii) the decrease in cash COGS, as detailed above; and (iii) the higher sales volume ex-Klabin. These effects were partially offset by the lower net pulp price in USD (-14%) and higher SG&A, as explained above. The 47% increase in per-ton EBITDA is explained by the exchange variation and lower production costs, which were partially offset by the increase in SG&A.
Compared to 2Q20, the 10% drop in Adjusted EBITDA was mainly due to lower pulp sales (-6%) and lower net average pulp price in USD (-14%). The 4% decline in per-ton adjusted EBITDA is basically due to the price factor.
Page 13 of 36
3Q20 EARNINGS RELEASE | |
FINANCIAL INCOME
| Financial Result (R$ million) | 3Q20 | 3Q19 | Δ Y-o-Y | 2Q20 | Δ Q-o-Q | |||||||||||||||
| Financial Expenses | (1,365 | ) | (1,058 | ) | 29 | % | (1,033 | ) | 32 | % | ||||||||||
| Interest on loans and financing (local currency) | (171 | ) | (355 | ) | -52 | % | (191 | ) | -11 | % | ||||||||||
| Interest on loans and financing (foreign currency) | (1,007 | ) | (597 | ) | 69 | % | (660 | ) | 53 | % | ||||||||||
| Capitalized interest1 | 2 | 0 | - | 4 | -53 | % | ||||||||||||||
| Other financial expenses | (190 | ) | (106 | ) | 79 | % | (187 | ) | 2 | % | ||||||||||
| Financial Income | 58 | 108 | -46 | % | 82 | -29 | % | |||||||||||||
| Interest on financial investments | 20 | 91 | -78 | % | 38 | -49 | % | |||||||||||||
| Other financial income | 39 | 17 | 128 | % | 44 | -12 | % | |||||||||||||
| Monetary and Exchange Variations | (1,645 | ) | (3,685 | ) | - | (2,930 | ) | - | ||||||||||||
| Foreign exchange variations (Debt) | (1,851 | ) | (3,627 | ) | - | (3,177 | ) | -42 | % | |||||||||||
| Other foreign exchange variations | 206 | (58 | ) | -455 | % | 247 | -16 | % | ||||||||||||
| Derivative income (loss), net2 | (1,271 | ) | (1,857 | ) | - | (1,776 | ) | -28 | % | |||||||||||
| Cash flow hedge | (459 | ) | (654 | ) | - | (679 | ) | -32 | % | |||||||||||
| Debt hedge | (766 | ) | (1,246 | ) | -39 | % | (1,064 | ) | -28 | % | ||||||||||
| Others3 | (46 | ) | 43 | - | (33 | ) | 39 | % | ||||||||||||
| Net Financial Result | (4,223 | ) | (6,493 | ) | - | (5,657 | ) | - | ||||||||||||
¹ Capitalized interest due to construction in progress.
² Variation in mark-to-market adjustment (3Q20:-R$10,778 million | 2Q20:-R$10,820 million), plus adjustments paid and received (3Q20: -R$1,288 million).
³ Includes commodity hedging and embedded derivatives.
Financial expenses totaled R$1,365 million in 3Q20, up 32% from 2Q20 and 29% from 3Q19. When compared to 3Q19, there was an impact of interest expenses in foreign currency as a result of expenses related to the repurchase of Senior Notes issued by Suzano's foreign subsidiaries, whose amount totaled US$69 million (equivalent on the payment date to R$366 million). This effect was partially offset by decrease in debt indexes, both in national currency (CDI) and in foreign currency (Libor 3M). When compared to 2Q20, the variation is explained by the same factors.
Financial income decreased 46% compared to 3Q19 and 29% compared to 2Q20. When compared to 3Q19, the variation was due to the reduction in interest rates that remunerate the company's cash, mainly in foreign currency, where most of the cash and cash equivalents are concentrated. When compared to 2Q20, in addition to the decrease in interest rates mentioned, it is worth noting the reduction in cash position, impacted by the advance payment of RCF (US$500 million).
Inflation adjustment and exchange variation had a negative impact of R$1,645 million on the Company’s financial result in the quarter, due to the 3% appreciation in the end-of-period rate of the USD against the BRL especially on the foreign currency portion of debt (79% of total debt). Note that the accounting impact from exchange variation on foreign currency debt has a cash impact only on the respective maturities.
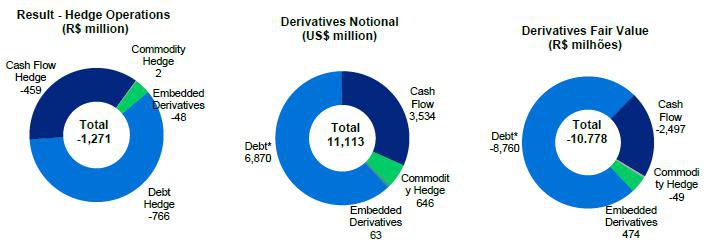
Derivative operations generated a loss of R$1,271 million in 3Q20, due to weaker BRL and the volatility of market curves applicable to debt hedge and cash flow transactions. The impacts of the COVID-19 pandemic on economies around the world continued throughout 3Q20, and the risk aversion trend once again affected the local currency in a scenario of high volatility. There also was a significant impact caused by the increase in the Pre, Cupom and Libor rate curves on transactions. The mark-to-market adjustment of derivative instruments on September 30, 2020 generated a loss of R$10,778 million, compared to a loss of R$ 10,820 million from the mark-to-market adjustment on June 30, 2020, representing a positive variation of R$42 million. As with exchange variation on the debt, the impact of BRL depreciation on the derivatives portfolio generates a cash impact only upon the respective maturities. The net effect on cash, which refers to the settlement of operations coming due in the third quarter, was negative in the amount of R$1,313 million (R$ 346 million expense from debt hedge and R$ 967 million from operating hedge and commodities).
Due to the aforementioned factors, the net financial expense was R$4,223 million in 3Q20, compared to the net financial expense of R$5,657 million and R$ 6,493 million in 2Q20 and 3Q19, respectively.
Page 14 of 36
3Q20 EARNINGS RELEASE | |
DERIVATIVE OPERATIONS
Suzano carries out derivative operations exclusively for hedging purposes. Note that none of the company’s hedge operations has margin calls. The following table reflects the position of derivative hedging instruments at September 30, 2020:
| Notional (US$ million) | Fair value (R$ million) | |||||||||||||||
| Hedge1 | Sep/2020 | Jun/2020 | Sep/2020 | Jun/2020 | ||||||||||||
| Debt | 6,870 | 6,986 | (8,706 | ) | (8,286 | ) | ||||||||||
| Cash Flow | 3,535 | 3,396 | (2,497 | ) | (2,980 | ) | ||||||||||
| Others2 | 709 | 745 | 425 | 445 | ||||||||||||
| Total | 11,114 | 11,127 | (10,778 | ) | (10,821 | ) | ||||||||||
¹ Refer to note 4 of the 3Q20 Quarterly Financial Statements (ITR) for further details and fair value sensitivity analysis.
² Includes commodity hedge and embedded derivatives.
The Company’s financial policy seeks to minimize the volatility of its cash generation and to impart greater flexibility to cash flow management. Currently, the policy stipulates that surplus dollars may be partially hedged (up to 75% of exchange variation exposure over the next 18 months) using plain vanilla instruments such as Zero Cost Collars (ZCC) and Non-Deliverable Forwards (NDF).
ZCC transactions establish minimum and maximum limits for the exchange rate that minimize adverse effects in the event of significant appreciation in the BRL. If the exchange rate is within such limits, the Company neither pays nor receives any financial adjustments. Therefore, the Company is protected in scenarios of extreme BRL appreciation. However, these transactions also limit potential gains in scenarios of extreme BRL depreciation. This characteristic allows for capturing greater benefits from export revenue in a potential scenario of USD appreciation within the range contracted.
On September 30, 2020, the outstanding notional value of operations involving forward dollar sales through ZCCs was US$3,446 million, whose maturities are distributed from October 2020 to March 2022, with an average forward rate ranging from R$4.54 to R$5.16. On the same date, the amount outstanding of the operations (notional) involving forward dollar sales through NDFs was US$89 million, whose maturities are distributed between October 2020 and March 2020 and with an average strike of R$5.36. In 3Q20, cash flow hedge operations resulted in a loss of R$459 million. The mark-to-market adjustment (fair value) of ZCC transactions was a loss of R$2,467 million and for NDFs was a loss of R$30 million at the end of the quarter, with the difference between the fair value of the third quarter and the financial result related to adjustments paid during 3Q20.
The following table presents a sensitivity analysis of the cash impact that the Company could have on its cash flow hedge portfolio (ZCC and NDF) if the future exchange rate remains the same as that at end of September (R$/US$ = 5.64) in the coming quarters; as well as the projected variation in cash impact for each R$0.10 variation at the same reference exchange rate (3Q20). Note that the figures presented in the table are Company projections based on the end-of-period curves and could fluctuate depending on market conditions.
Page 15 of 36
3Q20 EARNINGS RELEASE | |
| Cash adjustment (R$ million) | ||||||||||||||||||||
| Maturity (up to) | Strike Range | Notional (US$ million) | Actual | R$ / US$ = 5.64 (3Q20)² | Sensitivity at R$ 0.10 / US$ variation (+/-)1 | |||||||||||||||
| Zero Cost Collars | ||||||||||||||||||||
| 3Q20 | - | - | (913 | ) | - | - | ||||||||||||||
| 4Q20 | 4.19 – 4.63 | 522 | - | (550 | ) | (52 | ) | |||||||||||||
| 1Q21 | 4.27 – 4.76 | 736 | - | (690 | ) | (74 | ) | |||||||||||||
| 2Q21 | 4.27 – 4.75 | 840 | - | (796 | ) | (83 | ) | |||||||||||||
| 3Q21 | 4.75 – 5.54 | 617 | - | (236 | ) | (62 | ) | |||||||||||||
| 4Q21 | 5.18 – 6.15 | 485 | - | - | (46 | ) | ||||||||||||||
| 1Q22 | 5.25 – 6.05 | 245 | - | - | (25 | ) | ||||||||||||||
| Total | 4.54 – 5.16 | 3,446 | (913 | ) | (2,272 | ) | (342 | ) | ||||||||||||
| NDF | ||||||||||||||||||||
| 3Q20 | - | - | (29 | ) | - | - | ||||||||||||||
| 4Q20 | 77.47³ | 9 | - | - | 0 | |||||||||||||||
| 1Q21 | - | - | - | - | 0 | |||||||||||||||
| 2Q21 | - | - | - | - | 0 | |||||||||||||||
| 3Q21 | 5.33 | 50 | - | (6 | ) | (5 | ) | |||||||||||||
| 4Q21 | - | - | - | 0 | 0 | |||||||||||||||
| 1Q22 | 5.42 | 30 | - | (1 | ) | (3 | ) | |||||||||||||
| Total | 5.36 | 89 | (29 | ) | (7 | ) | (8 | ) | ||||||||||||
¹ Note: sensitivity of adjustments for foreign exchange levels above maximum value of the strike range.
² To calculate the mark-to-market adjustment, the PTAX rate of the next to last business day for the period under analysis was adopted.
³ NDF with strike in ARS (argentine peso) at Stenfar.
The Company also uses currency and interest rate swaps to mitigate the effects from exchange and interest rate variations on the balance of its debt and on its cash flow. Contracts swapping different interest rates and inflation indexes may be entered to mitigate the mismatch between financial assets and liabilities.
On September 30, 2020, the Company held US$6,870 million (notional value) in swaps, distributed as shown in the table below. In 3Q20, the result of liability hedge transactions was a loss of R$766 million, mainly due to the BRL depreciation in the period due to the COVID-19 pandemic. The mark-to-market (fair value) of such operations was negative by R$8,706 million at the end of the quarter, the difference between the change in fair value occurring in the third quarter and the financial result related to adjustments paid in the course of 3Q20.
| Notional (US$ million) | Fair value (R$ million) | ||||||||||||||||||||
| Debt Hedge | Maturity (up to) | Currency | Sep/2020 | Jun/2020 | Sep/2020 | Jun/2020 | |||||||||||||||
| Swap (PRÉ x USD) | 2024 | USD | 350 | 350 | (719 | ) | (637 | ) | |||||||||||||
| Swap (CDI x USD) | 2026 | USD | 2,567 | 2,677 | (6,792 | ) | (6,454 | ) | |||||||||||||
| Swap (IPCA x USD) | 2023 | USD | 121 | 121 | (195 | ) | (173 | ) | |||||||||||||
| Swap (LIBOR x USD) | 2026 | USD | 3,683 | 3,683 | (1,252 | ) | (1,273 | ) | |||||||||||||
| Swap (IPCA x CDI) | 2023 | BRL | 149 | ¹ | 154 | 252 | 252 | ||||||||||||||
| Total | 6.870 | 6.986 | (8.706 | ) | (8.285 | ) | |||||||||||||||
1Translated at the closing exchange rate (5.64).
The following table presents a sensitivity¹ analysis of the cash impact that the Company could have on its debt hedge portfolio (swaps) if the future exchange rate remains the same as that at end-3Q20 (R$/US$ = 5.64) in the coming quarters; as well as the projected variation in cash impact for each R$0.10 variation at the same reference exchange rate (3Q20). Note that the figures presented in the table are Company projections based on the end-of-period curves and could fluctuate depending on market conditions.
Page 16 of 36
3Q20 EARNINGS RELEASE | |
| Cash adjustment (R$ million) | |||||||||||||||||
| Maturity (up to) | Notional (US$ million) | Actual | R$ / US$ = 5.64 (3Q20) | Sensitivity at R$ 0.10 / US$ variation (+/-)1 | |||||||||||||
| 3Q20 | - | (346 | ) | - | - | ||||||||||||
| 4Q20 | 300 | - | (992 | ) | (37 | ) | |||||||||||
| 2021 | 333 | - | (725 | ) | (21 | ) | |||||||||||
| 2022 | 737 | - | (1,206 | ) | (60 | ) | |||||||||||
| 2023 | 2,167 | - | (616 | ) | (50 | ) | |||||||||||
| 2024 | 1,331 | - | (599 | ) | (46 | ) | |||||||||||
| 2025 | 1,156 | - | (1,475 | ) | (90 | ) | |||||||||||
| >2026 | 845 | - | (1,493 | ) | (82 | ) | |||||||||||
| Total | 6,870 | (346 | ) | (7,106 | ) | (386 | ) | ||||||||||
¹ Sensitivity analysis considers variation only in the exchange rate (R$/US$), while other variables are presumed constant.
Other transactions involving the Company’s derivatives are related to the embedded derivative resulting from the forestry partnerships and commodity hedges (maritime fuel), as follows:
| Maturity | Notional (US$ million) | Fair Value (R$ million) | |||||||||||||||||||
| Other hedges1 | (up to) | Index | Sep/2020 | Jun/2020 | Sep/2020 | Jun/2020 | |||||||||||||||
| Embedded derivative | 2035 | Fixed USD | USD US-CPI | 646 | 657 | 474 | 522 | |||||||||||||||
| Commodities | 2021 | Brent/VLSFO | 63 | 87 | (49 | ) | (77 | ) | |||||||||||||
| Total | 709 | 744 | 425 | 445 | |||||||||||||||||
1In 3Q20 there was a cash disbursement of R$25 million related to commodities derivatives.
Forestry partnership agreements and timber supply agreements signed on December 30, 2013 by Fibria Celulose S.A. are denominated in USD per cubic meter of standing timber, adjusted by U.S. inflation measured by the Consumer Price Index (CPI), which is not related to inflation in the economic environment where the forests are located and, hence, constitutes an embedded derivative. Such instrument, which is presented in the table above, consists of a swap contract with the short leg consisting of the variations in the US-CPI during the period of the aforementioned agreements. See note 4 of the 3Q20 Financial Statements for more details and for a sensitivity analysis of the fair value in the event of substantial variation in the US-CPI. On September 30, 2020, the outstanding amount (notional) of the operation was US$646 million. The result from the swap in 3Q20 was a loss of R$48 million. The mark-to-market adjustment (fair value) of such operations generated a gain of R$474 million at the end of the quarter.
The Company also is exposed to the international oil price, which is reflected in the logistics costs of sales to export markets. In this case, the Company analyzes the contracting of derivative financial instruments to fix the price of maritime fuel.
On September 30, 2020, the outstanding amount (notional) of the operation was US$63 million. The result from the swap in 3Q20 was a gain of R$2 million. The mark-to-market (fair value) adjustment of these operations generated a loss of R$49 million at the end of the quarter.
Page 17 of 36
3Q20 EARNINGS RELEASE | |
*Debt in BRL translated into USD at the closing exchange rate of the month (R$/US$ 5.64 on 09/30/2020).
NET INCOME (LOSS)
In 3Q20, the Company posted net loss of R$1,158 million, compared to net loss of R$3,460 million in 3Q19 and net loss of R$2,053 million in 2Q20. The variation in relation to 3Q19 is explained by the lower financial loss, which in turn is due to the effects from exchange variation on liabilities, the gain/loss from derivative transactions, and the higher operating result. Compared to 2Q20, the R$859 million decrease in net loss mainly reflects the positive variation in the net financial result (lower exchange variation on liabilities and derivatives), which was partially offset by the reduction in operating results due to the above-mentioned factors.
INDEBTEDNESS
| Debt (R$ million) | 09/30/2020 | 09/30/2019 | Δ Y-o-Y | 06/30/2020 | Δ Q-o-Q | |||||||||||||||
| Local Currency | 16,359 | 17,278 | -5 | % | 16,765 | -2 | % | |||||||||||||
| Short Term | 1,651 | 2,620 | -37 | % | 1,966 | -16 | % | |||||||||||||
| Long Term | 14,709 | 14,658 | 0 | % | 14,799 | -1 | % | |||||||||||||
| Foreign Currency | 62,131 | 46,743 | 33 | % | 63,863 | -3 | % | |||||||||||||
| Short Term | 2,673 | 2,472 | 8 | % | 3,580 | -25 | % | |||||||||||||
| Long Term | 59,458 | 44,271 | 34 | % | 60,283 | -1 | % | |||||||||||||
| Gross Debt | 78,490 | 64,021 | 23 | % | 80,629 | -3 | % | |||||||||||||
| (-) Cash | 9,758 | 8,790 | 11 | % | 12,687 | -23 | % | |||||||||||||
| Net debt | 68,731 | 55,231 | 24 | % | 67,941 | 1 | % | |||||||||||||
| Net debt/Adjusted EBITDA1(x) - R$ | 5.1 | x | 4.7 | x | 0.4 p.p. | 5.6 | x | -0.5 p.p. | ||||||||||||
| Net debt/Adjusted EBITDA1(x) - US$ | 4.4 | x | 4.3 | x | 0.1 p.p. | 4.7 | x | -0.3 p.p. | ||||||||||||
1 Excluding non-recurring items.
On September 30, 2020, gross debt was R$78.5 billion, composed of 94% long-term maturities and 6% short-term maturities. Debt denominated in foreign currency accounted for 79% of the Company's total liabilities, while debt denominated in local currency accounted for the remaining 21%. The percentage of gross debt denominated in foreign currency, considering the effect from debt hedge, was 94%. Gross debt declined 3% from 2Q20 (R$2.1 billion), due to settlements related to Liability Management (such as CRAs and ACCs) and the repayment of the revolving credit of US$ 500 million. Also regarding debt management operations, worth mentioning the partial repurchase of US$690 million of bonds 2024, 2025 and 2026 and the issue by its wholly-owned subsidiary Suzano Austria GmbH ("Suzano Austria") of new securities debt for placing on the international market in the principal amount of US$750 million characterized as “Sustainability-Linked Bonds”, with the cost (coupon) associated with the sustainability goal.
.
Page 18 of 36
3Q20 EARNINGS RELEASE | |
Suzano contracts debt in foreign currency debt as a natural hedge, since net operating cash generation is denominated in foreign currency (U.S. dollar) due to its prevailing status as an exporter. This structural exposure allows the Company to match loans and financing payments in USD with receivable flows from sales.

* Corresponding mainly to transaction costs (emission, funding etc.) and impacts from surplus value resulting from the operation with Fibria.
On September 30, 2020, the average cost of debt in U.S. dollar was 4.5% p.a. (considering debt in BRL adjusted by the market swap curve) as against 4.5% on June 31, 2020. The average term of consolidated debt at the end of the period was 84 months (vs. 82 months in June 2020).
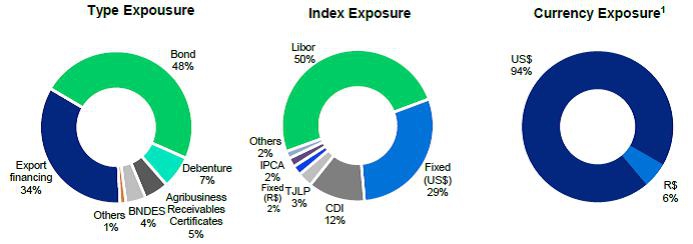
¹ Considers the portion of debt with currency swaps. The original debt was 79% denominated in USD and 21% in BRL.
Cash and cash equivalents at the end of September 30, 2020 were R$9,758 million, 59% of which were invested in foreign currency, in fixed-income short-term investments, while the local currency share was invested in government bonds and fixed income, remunerated at a percentage of the DI rate.
The company has two standby credit facilities totaling R$3,820 million – one in Brazilian real of R$1 billion available until 2021 and another one of US$500 million available until 2024. These facilities help improve the company's liquidity position and can be withdrawn during times of uncertainty, such as during the first half of the year, as a result of the COVID-19 pandemic outbreak. As a result, the current cash position of R$9,758 million plus the facilities described above amount to a readily available cash position of R$13,578 million.
Page 19 of 36
3Q20 EARNINGS RELEASE | |
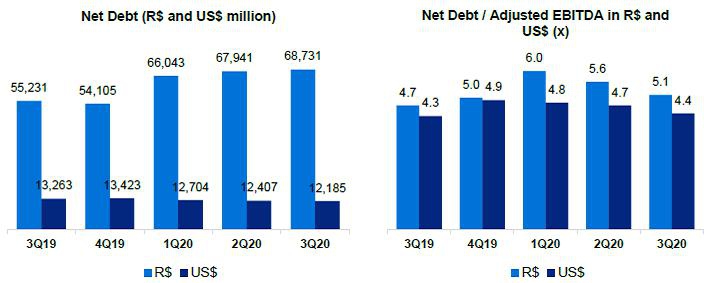
On September 30, 2020, net debt stood at R$68.7 billion (US$12.2 billion), compared to R$67.9 billion (US$12.4 billion) on June 30, 2020. As informed earlier, the increase in net debt in BRL is due to the depreciation of the Brazilian currency in the period.
The ratio of net debt to Adjusted EBITDA in BRL stood at 5.1x on September 30, 2020 (vs 5.6x at 2Q20). The same ratio in USD (a measure established in Suzano’s financial policy) fell to 4.4x on September 30, 2020 (vs. 4.7x at 2Q20).

The breakdown of total gross debt between trade and non-trade finance on September 30, 2020 is shown below:
| 2020 | 2021 | 2022 | 2023 | 2024 | 2025 onwards | Total | ||||||||||||||||||||||
| Trade Finance¹ | 63 | % | 23 | % | 56 | % | 84 | % | 72 | % | 11 | % | 34 | % | ||||||||||||||
| Non Trade Finance² | 37 | % | 77 | % | 44 | % | 16 | % | 28 | % | 89 | % | 66 | % | ||||||||||||||
¹ ACC, ACE, NCE, PPE
² Bonds, BNDES, CRA, Debentures, among others.
Page 20 of 36
3Q20 EARNINGS RELEASE | |
CAPITAL EXPENDITURE
In 3Q20, capital expenditures (cash basis) totaled R$1,167 million, down 27% from 3Q19, mainly due to lower expenses with land and forests, port terminals and mill maintenance (lower expenses with projects), which were partially offset by higher volume of timber purchases, the 35% appreciation of the U.S. dollar against the Brazilian real, and higher production. Compared to 2Q20, the 13% increase was mainly due to higher expenses with forest development, industrial projects and forest and land acquisitions.
| Investiments (R$ million) | 3Q20 | 3Q19 | Δ Y-o-Y | 2Q20 | Δ Q-o-Q | LTM 3Q20 | Guidance 2020 | |||||||||||||||||||||
| Maintenance | 924 | 881 | 5 | % | 808 | 14 | % | 3,347 | 3,508 | |||||||||||||||||||
| Industrial maintenance | 149 | 211 | -29 | % | 113 | 32 | % | 514 | 611 | |||||||||||||||||||
| Forestry maintenance | 745 | 630 | 18 | % | 691 | 8 | % | 2,734 | 2,801 | |||||||||||||||||||
| Others | 31 | 40 | -24 | % | 4 | 679 | % | 99 | 97 | |||||||||||||||||||
| Expansion and modernization | 55 | 69 | -20 | % | 86 | -36 | % | 274 | 248 | |||||||||||||||||||
| Land and forestry | 163 | 541 | -70 | % | 105 | 55 | % | 621 | 389 | |||||||||||||||||||
| Port terminals | 25 | 102 | -76 | % | 33 | -24 | % | 210 | 104 | |||||||||||||||||||
| Total | 1,167 | 1,593 | -27 | % | 1,031 | 13 | % | 4,452 | 4,249 |
OPERATING CASH GENERATION
| Operating cash flow - Consolidated (R$ million) | 3Q20 | 3Q19 | Δ Y-o-Y | 2Q20 | Δ Q-o-Q | LTM 3T20 | ||||||||||||||||||
| Adjusted EBITDA1 | 3,779 | 2,396 | 58 | % | 4,180 | -10 | % | 13,450 | ||||||||||||||||
| Maintenance Capex2 | (924 | ) | (881 | ) | 5 | % | (808 | ) | 14 | % | (3,338 | ) | ||||||||||||
| Operating Cash Flow | 2,854 | 1,515 | 88 | % | 3,372 | -15 | % | 10,112 | ||||||||||||||||
| Operating Cash Flow (R$/ton) | 1,003 | 570 | 76 | % | 1,119 | -10 | % | 957 |
¹ Excludes non-recurring items and PPA effects.
² Cash basis.
³ Excludes sales volume from Klabin.
Operating cash generation, measured by Adjusted EBITDA less sustaining capex (cash basis), amounted to R$2,854 million in 3Q20. The 88% increase compared to 3Q19 mainly reflects the higher EBITDA, as explained above, which was partially offset by the increase in sustaining capex. The increase in operating cash generation per ton compared to 3Q19 is largely related to EBITDA growth per ton. The 15% drop in relation to 2Q20 is related to the decline in EBITDA mentioned earlier and higher sustaining capex. On a per-ton basis, the 10% decrease is also due to the same factors.

Page 21 of 36
3Q20 EARNINGS RELEASE | |
FREE CASH FLOW
| Free Cash Flow (R$ million) | 3Q20 | 3Q19 | Δ Y-o-Y | 2Q20 | Δ Q-o-Q | LTM 3Q20 | ||||||||||||||||||
| Adjusted EBITDA | 3,779 | 2,396 | 58 | % | 4,180 | -10 | % | 13,450 | ||||||||||||||||
| (-) Total Capex¹ | (1,226 | ) | (1,088 | ) | 13 | % | (1,077 | ) | 13 | % | (4,312 | ) | ||||||||||||
| (+/-) D Working capital | 1,290 | 1,653 | - | 593 | - | 1,150 | ||||||||||||||||||
| (-) Net interest | (1,560 | ) | (831 | ) | 88 | % | (441 | ) | 253 | % | (3,708 | ) | ||||||||||||
| (-) Income taxes | (67 | ) | 69 | -198 | % | (34 | ) | 100 | % | (185 | ) | |||||||||||||
| (-) Dividend payment | 0 | (0 | ) | - | - | - | (5 | ) | ||||||||||||||||
| Free cash flow | 2,215 | 2,199 | - | 3,221 | -31 | % | 6,390 | |||||||||||||||||
| (+) Capex ex-maintenance | 163 | 68 | 139 | % | 138 | 18 | % | 651 | ||||||||||||||||
| (+) Dividend payment | 0 | 0 | - | 0 | - | 5 | ||||||||||||||||||
| Free cash flow - Adjusted | 2,378 | 2,268 | 5 | % | 3,381 | -29 | % | 7,046 | ||||||||||||||||
| (-) Derivative cash adjustment | (1,313 | ) | (51 | ) | - | (1,661 | ) | -21 | % | (3,227 | ) | |||||||||||||
| Free cash flow - Adjusted - after derivatives | 1,065 | 2,216 | -52 | % | 1,720 | -37 | % | 3,819 | ||||||||||||||||
¹ On an accrual basis.
² Free cash flow prior to dividend payments and capex ex-maintenance (accrual basis).
Free cash flow considering the adjustment for derivatives stood at R$1,065 million in 3Q20, compared to R$2,216 million in 3Q19 and R$1,691 million in 2Q20. The decline in comparison with the same period last year was mainly due to the higher loss on derivative operations, increase in interest payments (of 2024, 2025 and 2026 bonds tender offer, exchange rate variation and bond 2030 retap) and the decline in working capital (notably the inventory drawdowns in 3Q19), which were partially offset by the growth in adjusted EBITDA.
Compared to 2Q20, the 37% decline was chiefly due to the increase in interest payments (higher concentration of bond payments and payments related to the partial repurchase of Senior Notes 2024, 2025 and 2026) and the 10% decline in Adjusted EBITDA. These effects were partially offset by the increase in working capital and lower payments resulting from the adjustment of derivatives. As for working capital, it is worth highlighting the increase in accounts receivable, caused by the reduction in sales volume and lower pulp prices.
COVID-19
Suzano has been adopting preventive and mitigatory measures aligned with the guidelines established by Brazilian and international health authorities to minimize the impacts from the COVID-19 pandemic with regard to people safety and the continuity of its businesses.
The Company’s actions are based on three pillars: (1) People; (2) Society; (3) Business Continuity.
| (1) | People: to ensure the safety of its employees and contractors, Suzano has adopted a series of measures and procedures to mitigate their exposure to the novel coronavirus. The measures to protect people include the Company’s decision to maintain all direct jobs and to pay in advance 50% of the 13th salary bonus normally paid in December. |
| (2) | Society: Suzano understands its responsibility at this time to the communities in which it operates, guided by its culture driver “It’s only good for us if it’s good for the world.” Accordingly, from the onset of the outbreak to the present date, the Company has adopted a series of measures to protect the general public, including: |
| · | Donation of toilet paper, napkins and disposable diapers made by the Company to needy communities; |
| · | Donation of 159 ventilators and 1 million medical masks to federal and state governments; |
Page 22 of 36
3Q20 EARNINGS RELEASE | |
| · | Participation in the joint efforts with Positivo Tecnologia, Klabin, Flex Eletronics and Embraer to support the Brazilian company Magnamed in its delivery to the federal government of 6,500 ventilators by August 2020; |
| · | Construction of a field hospital in Teixeira de Freitas, Bahia, jointly with Veracel, which already has been delivered to the state government and was inaugurated in July 2020; |
| · | Partnership with the FATEC vocational school in Capão Bonito to produce hand sanitizer; |
| · | Forklifts lent to transport the donations received by the Red Cross |
| · | Maintenance of all direct jobs at the moment |
| · | Ensuring for 90 days (to end-June 2020) the payment of 100% of the payroll expenses of the workers of service providers whose operations were suspended because of the pandemic, seeking to protect jobs. |
| · | Creation of a support program for small suppliers, a social program to help small farmers sell their products via a home delivery system in 38 communities assisted by Suzano’s Rural Land Development Program (“PDRT”) in 5 states, and a social program for producing 125,000 masks in local communities for donation in 5 states; |
| · | Launch of a support program for small and midsized paper clients called “We’re Together” to ensure that these companies have the financial and managerial capacity to resume operations. |
Expenditures to support the social actions sponsored by Suzano totaled R$49 million as of September 30, 2020. Also important noting is that another R$81 million was spent to adapt our operations to the current scenario of combating the coronavirus (see note 29 - Result by Nature of the ITR).
| (3) | Business continuity: to date, the company is maintaining its operations normally and has formed crisis management committees that act daily at the corporate levels and at each business unit. Suzano has a business continuity plan prepared for 100% of its operations, with various levels of contingency plans. |
The current scenario arising from the novel coronavirus also implies higher credit risk. The Company is monitoring this risk and implementing measures to mitigate it, and considers such risk adequately controlled. To date, there have been no significant financial impacts.
Due to the physical distancing measures adopted in Brazil and many other countries that entail, for instance, the closure of schools and offices, the demand for printing & writing paper has decreased. In light of this scenario, and as announced by various paper manufacturers around the world, Suzano has opted to temporarily reduce the volume of its paper production. As previously disclosed in the quarterly financial statements for the period ended March 31, 2020, the Company temporarily shut down its paper production lines at the Mucuri and Rio Verde mills. However, the operations of these mills were resumed in early July 2020.
Lastly, it is also important to mention that due to the current scenario, the Company has undertaken and maintained intensive communication efforts to further increase interactions with its main stakeholders, striving to ensure the adequate transparency and flow of information with them in a timely manner aligned with the current social and economic situation. All key messages published to provide updates on its measures and activities in the context of COVID-19 are available on the Company’s Investor Relations website.
In addition, the Company has created a webpage with information on all its actions related to COVID-19: https://www.suzanocontraocoronavirus.com.br
Page 23 of 36
3Q20 EARNINGS RELEASE | |
ESG
Suzano made significant advances in its ESG agenda in 3Q20. In July, it published the new version of the Wood Supply Policy, which underlines its commitment to zero deforestation for 100% of the wood supply. The Policy also clarifies that all the wood used in the production comes from planted forests either in its own areas or at third-party areas, and all plantations follow the strict principles established in the document as well as internationally recognized forest certification guidelines. The Policy also describes Suzano's relations with the diverse stakeholders involved in planting, harvesting and transporting wood in order to ensure social legitimacy for the business relationship. This Wood Supply Policy and other policies, such as the Human Rights Policy, are available at Company’s Investor Relations website.
In September, Suzano became the first company in Americas, emerging markets and the pulp & paper sector to issue bonds in the international market linked to the achievement of sustainability targets. Suzano’s Sustainability-Linked Bonds (SLB) have coupon linked to environmental performance indicator, related to greenhouse gas intensity reduction target for the Company up to 2025. This issue underscores Suzano's commitment to be a part of the solution to the global climate crisis and evolves in convergence to the implementation of its 2030 long-term goal of reducing GHG emissions published in February 2020. Suzano's SLB issue was the second in the world to be carried out in this format. It was also the first global operation to publish a Framework in line with the Sustainability-Linked Bond Principles, laid down by the International Capital Markets Association (ICMA) and the first to seek an independent third-party opinion, provided by ISS-ESG. More information about the scope of sustainability associated with the new bonds is available in the Sustainability-Linked Securities Framework available on the Company's Investor Relations website.
SYNERGIES
On February 12, 2020, through a Material Fact notice, the Company updated its projections for the synergy gains resulting from its business combination with Fibria Celulose S.A. Suzano expects to capture, from 2019 to 2021, operating synergies estimated at between R$1,100 million and R$1,200 million per year (before taxes), and on a recurring basis after 2021, through reductions in costs, expenses and capital expenditures in the procurement, forest, industrial, logistics, sales, administrative and people areas, and also expects to capture tax synergies that result in deductions of around R$2.0 billion a year. The synergies continue to be captured in line with the planning.
The estimated amount of operating synergies mentioned above does not include the costs of implementing the initiatives linked to these synergies, which remain estimated by the Company at approximately R$200 million through 2021.
TOTAL OPERATIONAL EXPENDITURES - PULP
As disclosed through a Material Fact notice dated February 13, 2020, the estimate for total operating expenditures in 2024 remains approximately R$1,300/t, and the trend for the indicator remains in line with the planning.
EVENTS AFTER THE REPORTING PERIOD
On October 6, 2020, the Company informed its shareholders and the market of the closure of the secondary offering of 150,217,425 common shares, without par value, issued by Suzano and held by BNDES Participações S.A. (BNDESPAR), including 13,180,000 shares in the form of American Depositary Shares (“ADS”), at a price per share of R$46.00, totaling R$6.9 billion and a price per share in the form of ADS, at US$8.15 per ADS.
Page 24 of 36
3Q20 EARNINGS RELEASE | |
CAPITAL MARKETS
On September 30, 2020, Suzano’s stock was quoted at R$45.55/share (SUZB3) and US$8.17/share (SUZ). The Company’s stock is listed on the Novo Mercado, the listing segment of the São Paulo Exchange (B3) with the highest corporate governance standards, and is also traded on the New York Stock Exchange (NYSE) - Level II.
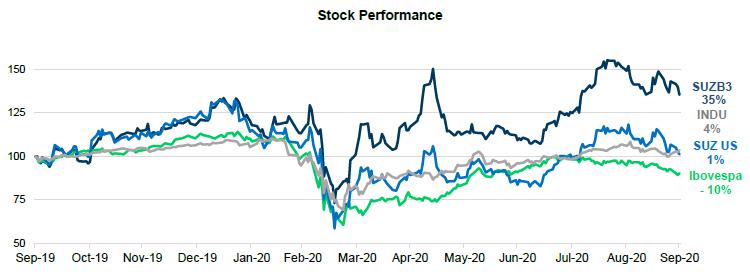
Source: Bloomberg.

Source: Bloomberg.
On September 30, 2020, the Company's share capital was represented by 1,361,263,584 common shares, of which 12,042,004 were held in Treasury. Suzano’s market capitalization stood at R$62.0 billion on September 30, 2020. In 3Q20, the free-float corresponded to 53.3% of the total capital.
Page 25 of 36
3Q20 EARNINGS RELEASE | |
| Free Float distribution 09/30/2020 (B3 + NYSE) | Ownership structure (09/30/2020) |
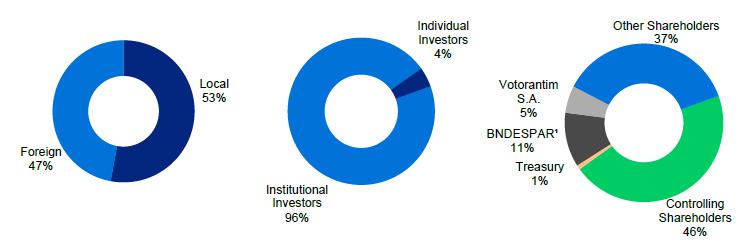
1The BNDES Secondary Offering Public Offering was concluded on October 6, 2020.
FIXED INCOME
| Unity | Sep/20 | Jun/20 | Sep/19 | Δ Y-o-Y | Δ Q-o-Q | |||||||||||||||||
| Suzano 2021 – Price | USD/k | - | - | 103.76 | - | - | ||||||||||||||||
| Suzano 2021 – Yield | % | - | - | 2.92 | - | - | ||||||||||||||||
| Fibria 2024 – Price | USD/k | 110.3 | 107.5 | 106.9 | 3.2 | % | 2.6 | % | ||||||||||||||
| Fibria 2024 – Yield | % | 2.3 | 3.2 | 3.6 | -37.3 | % | -28.8 | % | ||||||||||||||
| Fibria 2025 – Price | USD/k | 106.2 | 103.3 | 102.1 | 4.1 | % | 2.9 | % | ||||||||||||||
| Fibria 2025 – Yield | % | 2.5 | 3.2 | 3.6 | -31.0 | % | -23.8 | % | ||||||||||||||
| Suzano 2026 – Price | USD/k | 114.6 | 109.5 | 110.6 | 3.6 | % | 4.6 | % | ||||||||||||||
| Suzano 2026 – Yield | % | 3.0 | 4.0 | 3.9 | -24.4 | % | -24.7 | % | ||||||||||||||
| Fibria 2027 – Price | USD/k | 113.4 | 108.1 | 107.7 | 5.3 | % | 4.9 | % | ||||||||||||||
| Fibria 2027 – Yield | % | 3.1 | 4.1 | 4.3 | -26.4 | % | -23.0 | % | ||||||||||||||
| Suzano 2029 – Price | USD/k | 114.1 | 109.1 | 108.8 | 4.9 | % | 4.6 | % | ||||||||||||||
| Suzano 2029 – Yield | % | 4.0 | 4.7 | 4.8 | -17.2 | % | -15.2 | % | ||||||||||||||
| Suzano 2030 – Price | USD/k | 108.0 | 102.3 | 102.5 | 5.3 | % | 5.5 | % | ||||||||||||||
| Suzano 2030 – Yield | % | 4.0 | 4.7 | 4.7 | -15.4 | % | -15.5 | % | ||||||||||||||
| Suzano 2047 – Price | USD/k | 100.3 | - | - | - | - | ||||||||||||||||
| Suzano 2047 – Yield | % | 3.7 | - | - | - | - | ||||||||||||||||
| Treasury 10 years | % | 118.5 | 110.1 | 114.7 | 3.3 | % | 7.6 | % | ||||||||||||||
Note: Senior Notes issued with face value of 100 USD/k
RATING
| Agency | National Scale | Global Scale | Outlook | |||
| Fitch Ratings | AAA | BBB- | Negative | |||
| Standard & Poor’s | brAAA | BBB- | Negative | |||
| Moody’s | Aaa.br | Ba1 | Stable |
Page 26 of 36
3Q20 EARNINGS RELEASE | |
UPCOMING EVENTS
Earnings Conference Call (3Q20)
Date: October 30, 2020 (Friday)
| Portuguese (simultaneous translation) | English |
| 10:00 a.m. (Brasilia) | 10:00 a.m. (Brasília) |
| 9:00 a.m. (New York) | 9:00 a.m. (New York) |
| 2:00 p.m. (London) | 2:00 p.m. (London) |
| Tel.: +55 (11) 3181-8565 | Tel.: +1 412 717-9627 |
Please connect 10 minutes before the conference call is scheduled to begin.
The conference call will be held in English and feature a presentation, with a simultaneous webcast. The access links will be available on the Company’s Investor Relations website. (www.suzano.com.br/ri).
If you are unable to participate, the webcast link will be available for future consultation on the Investor Relations website of Suzano S.A.
IR CONTACTS
Marcelo Bacci
Camila Nogueira
Camilla Galvão
Mariana Dutra
Roberto Costa
Tel.: +55 (11) 3503-9330
ri@suzano.com.br
www.suzano.com.br/ri
Page 27 of 36
3Q20 EARNINGS RELEASE | |
APPENDICES
APPENDIX 1 - Operating Data
Revenue breakdown (R$ '000) | 3Q20 | 3Q19 | Δ Y-o-Y | 2Q20 | Δ Q-o-Q | 9M20 | 9M19 | Δ Y-o-Y | ||||||||||||||||||||||||
| Exports | 6,140,197 | 5,277,949 | 16 | % | 7,043,721 | -13 | % | 19,002,672 | 15,066,030 | 26 | % | |||||||||||||||||||||
| Pulp | 5,753,923 | 4,892,176 | 18 | % | 6,633,011 | -13 | % | 17,875,291 | 13,963,834 | 28 | % | |||||||||||||||||||||
| Paper | 386,274 | 385,774 | 0 | % | 410,710 | -6 | % | 1,127,381 | 1,102,196 | 2 | % | |||||||||||||||||||||
| Domestic Market | 1,330,638 | 1,321,963 | 1 | % | 951,952 | 40 | % | 3,444,629 | 3,897,960 | -12 | % | |||||||||||||||||||||
| Pulp | 414,431 | 448,042 | -8 | % | 343,201 | 21 | % | 1,155,999 | 1,432,137 | -19 | % | |||||||||||||||||||||
| Paper | 916,207 | 873,921 | 5 | % | 608,751 | 51 | % | 2,288,630 | 2,465,823 | -7 | % | |||||||||||||||||||||
| Total Net Revenue | 7,470,835 | 6,599,909 | 13 | % | 7,995,673 | -7 | % | 22,447,301 | 18,963,990 | 18 | % | |||||||||||||||||||||
| Pulp | 6,168,354 | 5,340,215 | 16 | % | 6,976,212 | -12 | % | 19,031,290 | 15,395,971 | 24 | % | |||||||||||||||||||||
| Paper | 1,302,481 | 1,259,695 | 3 | % | 1,019,461 | 28 | % | 3,416,011 | 3,568,019 | -4 | % |
| Sales volume (‘000) | 3Q20 | 3Q19 | Δ Y-o-Y | 2Q20 | Δ Q-o-Q | 9M20 | 9M19 | Δ Y-o-Y | ||||||||||||||||||||||||
| Exports | 2,432,865 | 2,442,076 | 0 | % | 2,710,040 | -10 | % | 7,854,566 | 6,172,894 | 27 | % | |||||||||||||||||||||
| Pulp | 2,334,152 | 2,340,238 | 0 | % | 2,615,068 | -11 | % | 7,575,759 | 5,881,145 | 29 | % | |||||||||||||||||||||
| Paper | 98,713 | 101,838 | -3 | % | 94,972 | 4 | % | 278,807 | 291,749 | -4 | % | |||||||||||||||||||||
| Paperboard | 15,204 | 17,673 | -14 | % | 21,935 | -31 | % | 52,738 | 44,304 | 19 | % | |||||||||||||||||||||
| Printing & Writing | 82,347 | 83,712 | -2 | % | 69,425 | 19 | % | 220,438 | 245,922 | -10 | % | |||||||||||||||||||||
| Other paper1 | 1,162 | 453 | 157 | % | 3,612 | -68 | % | 5,631 | 1,523 | 270 | % | |||||||||||||||||||||
| Domestic Market | 412,826 | 420,143 | -2 | % | 303,030 | 36 | % | 1,128,305 | 1,207,051 | -7 | % | |||||||||||||||||||||
| Pulp | 192,415 | 208,929 | -8 | % | 162,540 | 18 | % | 584,713 | 610,989 | -4 | % | |||||||||||||||||||||
| Paper | 220,411 | 211,214 | 4 | % | 140,490 | 57 | % | 543,592 | 596,062 | -9 | % | |||||||||||||||||||||
| Paperboard | 37,362 | 32,173 | 16 | % | 27,854 | 34 | % | 94,021 | 95,214 | -1 | % | |||||||||||||||||||||
| Printing & Writing | 152,069 | 150,248 | 1 | % | 81,399 | 87 | % | 356,335 | 429,028 | -17 | % | |||||||||||||||||||||
| Other paper1 | 30,980 | 28,793 | 8 | % | 31,237 | -1 | % | 93,236 | 71,820 | 30 | % | |||||||||||||||||||||
| Total Sales Volume | 2,845,691 | 2,862,219 | -1 | % | 3,013,070 | -6 | % | 8,982,871 | 7,379,945 | 22 | % | |||||||||||||||||||||
| Pulp | 2,526,567 | 2,549,167 | -1 | % | 2,777,608 | -9 | % | 8,160,472 | 6,492,134 | 26 | % | |||||||||||||||||||||
| Paper | 319,124 | 313,052 | 2 | % | 235,462 | 36 | % | 822,399 | 887,811 | -7 | % | |||||||||||||||||||||
| Paperboard | 52,566 | 49,846 | 5 | % | 49,789 | 6 | % | 146,759 | 139,518 | 5 | % | |||||||||||||||||||||
| Printing & Writing | 234,416 | 233,960 | 0 | % | 150,824 | 55 | % | 576,773 | 674,950 | -15 | % | |||||||||||||||||||||
| Other paper1 | 32,142 | 29,246 | 10 | % | 34,849 | -8 | % | 98,867 | 73,343 | 35 | % |
Average net price (R$/ton) | 3Q20 | 3Q19 | Δ Y-o-Y | 2Q20 | Δ Q-o-Q | 9M20 | 9M19 | Δ Y-o-Y | ||||||||||||||||||||||||
| Exports | 2,524 | 2,161 | 17 | % | 2,599 | -3 | % | 2,419 | 2,441 | -1 | % | |||||||||||||||||||||
| Pulp | 2,465 | 2,090 | 18 | % | 2,536 | -3 | % | 2,360 | 2,374 | -1 | % | |||||||||||||||||||||
| Paper | 3,913 | 3,788 | 3 | % | 4,325 | -10 | % | 4,044 | 3,778 | 7 | % | |||||||||||||||||||||
| Domestic Market | 3,223 | 3,146 | 2 | % | 3,141 | 3 | % | 3,053 | 3,229 | -5 | % | |||||||||||||||||||||
| Pulp | 2,154 | 2,144 | 0 | % | 2,111 | 2 | % | 1,977 | 2,344 | -16 | % | |||||||||||||||||||||
| Paper | 4,157 | 4,138 | 0 | % | 4,333 | -4 | % | 4,210 | 4,137 | 2 | % | |||||||||||||||||||||
| Total | 2,625 | 2,306 | 14 | % | 2,654 | -1 | % | 2,499 | 2,570 | -3 | % | |||||||||||||||||||||
| Pulp | 2,441 | 2,095 | 17 | % | 2,512 | -3 | % | 2,332 | 2,371 | -2 | % | |||||||||||||||||||||
| Paper | 4,081 | 4,024 | 1 | % | 4,330 | -6 | % | 4,154 | 4,019 | 3 | % |
Page 28 of 36
3Q20 EARNINGS RELEASE | |
Average net price (US$/ton) | 3Q20 | 3Q19 | Δ Y-o-Y | 2Q20 | Δ Q-o-Q | 9M20 | 9M19 | Δ Y-o-Y | ||||||||||||||||||||||||
| Exports | 469 | 544 | -14 | % | 583 | -20 | % | 477 | 628 | -24 | % | |||||||||||||||||||||
| Pulp | 458 | 526 | -13 | % | 569 | -20 | % | 465 | 611 | -24 | % | |||||||||||||||||||||
| Paper | 727 | 954 | -24 | % | 971 | -25 | % | 797 | 972 | -18 | % | |||||||||||||||||||||
| Domestic Market | 599 | 792 | -24 | % | 704 | -15 | % | 601 | 831 | -28 | % | |||||||||||||||||||||
| Pulp | 400 | 540 | -26 | % | 473 | -15 | % | 390 | 603 | -35 | % | |||||||||||||||||||||
| Paper | 773 | 1,042 | -26 | % | 972 | -20 | % | 829 | 1,064 | -22 | % | |||||||||||||||||||||
| Total | 488 | 581 | -16 | % | 595 | -18 | % | 492 | 661 | -26 | % | |||||||||||||||||||||
| Pulp | 454 | 528 | -14 | % | 563 | -19 | % | 459 | 610 | -25 | % | |||||||||||||||||||||
| Paper | 759 | 1,014 | -25 | % | 971 | -22 | % | 818 | 1,034 | -21 | % |
¹ Paper of other manufacturers sold by Suzano and tissue paper,
| FX Rate R$/US$ | 3T20 | 3T19 | Δ Y-o-Y | 2T20 | Δ Q-o-Q | |||||||||||||||
| Closing | 5.64 | 4.16 | 35 | % | 5.48 | 3 | % | |||||||||||||
| Average | 5.38 | 3.97 | 35 | % | 5.39 | 0 | % |
Page 29 of 36
3Q20 EARNINGS RELEASE | |
APPENDIX 2 - Consolidated Statement of Income and Goodwill Amortization
Income Statement (R$ ‘000) | 3Q20 | 3Q19 | Δ Y-o-Y | 2Q20 | Δ Q-o-Q | 9M20 | 9M19 | Δ Y-o-Y | ||||||||||||||||||||||||
| Net Revenue | 7,470,835 | 6,599,909 | 13 | % | 7,995,673 | -7 | % | 22,447,301 | 18,963,990 | 18 | % | |||||||||||||||||||||
| Cost of Goods Sold | (4,473,994 | ) | (4,986,414 | ) | -10 | % | (4,788,694 | ) | -7 | % | (14,082,687 | ) | (14,933,426 | ) | -6 | % | ||||||||||||||||
| Gross Debt | 2,996,841 | 1,613,495 | 86 | % | 3,206,979 | -7 | % | 8,364,614 | 4,030,564 | 108 | % | |||||||||||||||||||||
| Gross Margin | 40,1 | % | 24,4 | % | 16 p,p, | 40,1 | % | 0 p,p, | 37,3 | % | 21,3 | % | 16 p,p, | |||||||||||||||||||
| Operating Expense/Income | (829,110 | ) | (616,180 | ) | 35 | % | (690,805 | ) | 20 | % | (2,332,245 | ) | (1,965,376 | ) | 19 | % | ||||||||||||||||
| Selling Expenses | (522,594 | ) | (469,014 | ) | 11 | % | (547,098 | ) | -4 | % | (1,584,628 | ) | (1,367,298 | ) | 16 | % | ||||||||||||||||
| General and Administrative Expenses | (312,735 | ) | (278,976 | ) | 12 | % | (335,715 | ) | -7 | % | (963,286 | ) | (887,772 | ) | 9 | % | ||||||||||||||||
| Other Operating Income (Expenses) | (4,135 | ) | 116,132 | -104 | % | 195,671 | -102 | % | 208,267 | 268,447 | -22 | % | ||||||||||||||||||||
| Equity Equivalence | 10,354 | 15,678 | -34 | % | (3,663 | ) | -383 | % | 7,402 | 21,247 | -65 | % | ||||||||||||||||||||
| EBIT | 2,167,731 | 997,315 | 117 | % | 2,516,174 | -14 | % | 6,032,369 | 2,065,188 | 192 | % | |||||||||||||||||||||
| Depreciation, Amortization & Depletion | 1,653,560 | 1,514,089 | 9 | % | 1,709,381 | -3 | % | 5,011,119 | 6,313,082 | -21 | % | |||||||||||||||||||||
| EBITDA | 3,810,937 | 2,495,726 | 53 | % | 4,229,218 | -10 | % | 11,036,086 | 8,357,023 | 32 | % | |||||||||||||||||||||
| EBITDA Margin (%) | 51,0 | % | 37,8 | % | 13 p,p, | 52,9 | % | -2 p,p, | 49,2 | % | 44,1 | % | 5 p,p, | |||||||||||||||||||
| Adjusted EBITDA1 | 3,778,534 | 2,396,425 | 58 | % | 4,179,838 | -10 | % | 10,984,519 | 8,258,187 | 33 | % | |||||||||||||||||||||
| Adjusted EBITDA Margin1 | 50,6 | % | 36,3 | % | 14 p,p, | 52,3 | % | -2 p,p, | 48,9 | % | 43,5 | % | 5 p,p, | |||||||||||||||||||
| Net Financial Result | (4,222,644 | ) | (6,493,278 | ) | -35 | % | (5,657,238 | ) | -25 | % | (32,323,930 | ) | (8,350,355 | ) | 287 | % | ||||||||||||||||
| Financial Expenses | 58,413 | 108,143 | -46 | % | 82,419 | -29 | % | 261,586 | 393,374 | -34 | % | |||||||||||||||||||||
| Financial Revenues | (1,365,381 | ) | (1,058,484 | ) | 29 | % | (1,033,126 | ) | 32 | % | (3,484,931 | ) | (3,123,771 | ) | 12 | % | ||||||||||||||||
| Exchange Rate Variation | (1,644,611 | ) | (3,685,540 | ) | -55 | % | (2,930,209 | ) | -44 | % | (16,994,406 | ) | (3,383,054 | ) | 402 | % | ||||||||||||||||
| Net Proceeds Generated by Derivatives | (1,271,065 | ) | (1,857,397 | ) | -32 | % | (1,776,322 | ) | -28 | % | (12,106,179 | ) | (2,236,904 | ) | 441 | % | ||||||||||||||||
| Earnings Before Taxes | (2,054,913 | ) | (5,495,963 | ) | -63 | % | (3,141,064 | ) | -35 | % | (26,291,561 | ) | (6,285,167 | ) | 318 | % | ||||||||||||||||
| Income and Social Contribution Taxes | 897,206 | 2,035,728 | -56 | % | 1,088,546 | -18 | % | 9,662,275 | 2,295,649 | 321 | % | |||||||||||||||||||||
| Net Income (Loss) | (1,157,707 | ) | (3,460,235 | ) | -67 | % | (2,052,518 | ) | -44 | % | (16,629,286 | ) | (3,989,518 | ) | 317 | % | ||||||||||||||||
| Net Margin | -15,5 | % | -52,4 | % | 37 p,p, | -25,7 | % | 10 p,p, | -74,1 | % | -21,0 | % | -53 p,p, |
| Goodwill amortization - PPA (R$ ‘000) | 3Q20 | 3Q19 | Δ Y-o-Y | 2Q20 | Δ Q-o-Q | |||||||||||||||
| COGS | (126,165 | ) | (180,036 | ) | -30 | % | (153,704 | ) | -18 | % | ||||||||||
| Selling Expenses | (206,474 | ) | (206,700 | ) | 0 | % | (207,107 | ) | 0 | % | ||||||||||
| General and administrative expenses | 10,620 | 794 | - | 2,287 | - | |||||||||||||||
| Other operational revenues (expenses) | (14,686 | ) | (6,820 | ) | - | (5,085 | ) | - | ||||||||||||
| Financial results | (1,303 | ) | (31,143 | ) | - | 18,479 | -107 | % |
1 Excluding non-recurring items and PPA effects,
Page 30 of 36
3Q20 EARNINGS RELEASE | |
APPENDIX 3 - Consolidated Balance Sheet
| Assets (R$ ´000) | 09/30/2020 | 06/30/2020 | 09/30/2019 | |||||||||
| Current Assets | ||||||||||||
| Cash and cash equivalents | 7,247,184 | 10,473,701 | 3,714,646 | |||||||||
| Financial investments | 2,327,353 | 2,030,560 | 4,897,585 | |||||||||
| Trade accounts receivable | 3,036,769 | 3,762,875 | 2,058,731 | |||||||||
| Inventories | 4,245,766 | 4,206,778 | 6,258,364 | |||||||||
| Recoverable taxes | 874,152 | 888,245 | 1,235,668 | |||||||||
| Derivative financial instruments | 209,970 | 152,978 | 239,161 | |||||||||
| Advance to suppliers | 102,765 | 106,636 | 138,127 | |||||||||
| Other assets | 479,903 | 281,471 | 279,096 | |||||||||
| Total Current Assets | 18,523,862 | 21,903,244 | 18,821,378 | |||||||||
| Non-Current Assets | ||||||||||||
| Financial investments | 183,893 | 182,936 | 177,453 | |||||||||
| Recoverable taxes | 748,584 | 712,279 | 557,373 | |||||||||
| Deferred taxes | 11,399,116 | 10,454,646 | 3,083,218 | |||||||||
| Derivative financial instruments | 922,225 | 925,459 | 677,305 | |||||||||
| Advance to suppliers | 1,071,249 | 1,149,832 | 1,100,257 | |||||||||
| Judicial deposits | 266,214 | 268,462 | 338,971 | |||||||||
| Biological assets | 10,759,599 | 10,672,724 | 10,280,967 | |||||||||
| Investments | 336,929 | 325,420 | 279,263 | |||||||||
| Property, plant and equipment | 39,736,484 | 40,242,196 | 41,500,872 | |||||||||
| Right of use on lease agreements | 4,242,105 | 4,199,804 | 4,359,907 | |||||||||
| Intangible | 17,014,465 | 17,225,097 | 17,968,738 | |||||||||
| Other assets | 235,309 | 231,633 | 201,374 | |||||||||
| Total Non-Current Assets | 86,916,172 | 86,590,488 | 80,525,698 | |||||||||
| Total Assets | 105,440,034 | 108,493,732 | 99,347,076 | |||||||||
| Liabilities and Equity (R$ ´000) | 09/30/2020 | 06/30/2020 | 09/30/2019 | |||||||||
| Current Liabilities | ||||||||||||
| Trade accounts payable | 2,157,286 | 2,081,533 | 3,325,724 | |||||||||
| Loans, financing and debentures | 4,323,325 | 5,546,123 | 5,091,236 | |||||||||
| Accounts payable for lease operations | 629,329 | 704,174 | 587,910 | |||||||||
| Derivative financial instruments | 4,117,393 | 4,529,091 | 1,111,477 | |||||||||
| Taxes payable | 315,080 | 274,858 | 212,378 | |||||||||
| Payroll and charges | 478,732 | 380,762 | 439,615 | |||||||||
| Liabilities for assets acquisitions and subsidiaries | 102,013 | 127,721 | 92,098 | |||||||||
| Dividends payable | 4,888 | 4,891 | 9,904 | |||||||||
| Other liabilities | 292,387 | 284,828 | 310,540 | |||||||||
| Total Current Liabilities | 12,420,433 | 13,933,981 | 11,180,882 | |||||||||
| Non-Current Liabilities | ||||||||||||
| Loans, financing and debentures | 74,166,284 | 75,082,454 | 58,929,307 | |||||||||
| Accounts payable for lease operations | 4,662,805 | 4,469,798 | 3,946,474 | |||||||||
| Derivative financial instruments | 7,792,461 | 7,369,241 | 2,865,034 | |||||||||
| Liabilities for assets acquisitions and subsidiaries | 429,357 | 530,414 | 463,835 | |||||||||
| Provision for judicial liabilities | 3,403,233 | 3,441,451 | 3,495,447 | |||||||||
| Actuarial liabilities | 747,984 | 744,105 | 592,467 | |||||||||
| Deferred taxes | 74,736 | 75,354 | 589,148 | |||||||||
| Other liabilities | 286,951 | 235,499 | 248,223 | |||||||||
| Total Non-Current Liabilities | 91,563,811 | 91,948,316 | 71,129,935 | |||||||||
| Shareholders’ Equity | ||||||||||||
| Share capital | 9,235,546 | 9,235,546 | 9,235,546 | |||||||||
| Capital reserves | 6,201,165 | 6,200,079 | 6,201,676 | |||||||||
| Retained earnings reserves | 317,144 | 317,144 | 3,081,740 | |||||||||
| Equity valuation adjustment | 2,180,733 | 2,191,704 | 2,348,132 | |||||||||
| Retained loss | (16,599,888 | ) | (15,453,035 | ) | (3,947,403 | ) | ||||||
| Total Equity | 1,334,700 | 2,491,438 | 16,919,691 | |||||||||
| Non-controlling shareholders interests | 121,090 | 119,997 | 116,568 | |||||||||
| Total Liabilities and Equity | 105,440,034 | 108,493,732 | 99,347,076 |
Page 31 of 36
3Q20 EARNINGS RELEASE | |
APPENDIX 4 - Consolidated Statement of Cash Flow
| Cash Flow (R$ ‘000) | 3Q20 | 3Q19 | 9M20 | 9M19 | ||||||||||||
| Cash flow from operating activities | ||||||||||||||||
| Net income/(loss) for the period | (1,157,707 | ) | (3,460,234 | ) | (16,629,286 | ) | (3,989,518 | ) | ||||||||
| Depreciation, depletion and amortization | 1,633,305 | 1,505,201 | 4,871,983 | 6,136,760 | ||||||||||||
| Amortization of right of use | 33,492 | 43,036 | 126,801 | 106,925 | ||||||||||||
| Sublease of ships | (11,956 | ) | - | (23,321 | ) | - | ||||||||||
| Interest expense on lease liabilities | 80,742 | 56,068 | 284,230 | 153,061 | ||||||||||||
| Results from sale and disposals of property, plant and equipment and biological assets, net | 10,839 | 22,777 | 1,496 | 26,281 | ||||||||||||
| Equity equivalence | (10,354 | ) | (15,678 | ) | (7,402 | ) | (21,247 | ) | ||||||||
| Exchange rate and monetary variations, net | 1,644,611 | 3,685,550 | 16,994,406 | 3,383,054 | ||||||||||||
| Interest expenses with loans, financing and debentures, net | 785,989 | 855,140 | 2,522,764 | 2,531,255 | ||||||||||||
| Interest expense with bond repurchases | 391,390 | - | 391,390 | - | ||||||||||||
| Capitalized interest | (1,951 | ) | (1,535 | ) | (9,891 | ) | (2,952 | ) | ||||||||
| Accrual of interest on marketable securities | (8,505 | ) | (43,250 | ) | (82,607 | ) | (290,303 | ) | ||||||||
| Amortization of fundraising costs | 31,248 | 12,947 | 72,516 | 172,803 | ||||||||||||
| Derivative (gains) losses, net | 1,271,065 | 1,857,397 | 12,106,179 | 2,236,904 | ||||||||||||
| Fair value adjustment of biological assets | - | - | (173,733 | ) | (83,453 | ) | ||||||||||
| Deferred income tax and social contribution expenses | (944,676 | ) | (2,066,142 | ) | (9,767,574 | ) | (2,517,641 | ) | ||||||||
| Tax credit – Gain on tax action | - | (128,115 | ) | - | (128,115 | ) | ||||||||||
| Interest on employee benefits | 13,279 | 11,920 | 39,806 | 38,762 | ||||||||||||
| Provision (reversal) of judicial liabilities, net | 9,494 | (24,333 | ) | (12,758 | ) | (21,858 | ) | |||||||||
| Allowance for doubtful accounts, net | (5,040 | ) | (4,436 | ) | 5,210 | (14,364 | ) | |||||||||
| Provision for (reversal of) inventory losses and write-offs | (61,338 | ) | 42,818 | (28,718 | ) | 30,790 | ||||||||||
| Provision for loss of ICMS credits, net | (141,526 | ) | 18,305 | (93,375 | ) | 87,496 | ||||||||||
| Other | 13,115 | (73,516 | ) | 25,913 | (6,861 | ) | ||||||||||
| Decrease (increase) in assets | 927,038 | 2,077,625 | 1,875,852 | 1,962,550 | ||||||||||||
| Trade accounts receivables | 809,670 | 949,806 | 1,016,240 | 2,015,294 | ||||||||||||
| Inventories | 93,542 | 864,625 | 560,017 | (343,929 | ) | |||||||||||
| Recoverable taxes | 147,884 | 155,818 | 262,385 | 137,786 | ||||||||||||
| Other assets | (124,058 | ) | 107,376 | 37,210 | 153,399 | |||||||||||
| Increase (decrease) in liabilities | 362,967 | (732,125 | ) | (329,320 | ) | (1,093,513 | ) | |||||||||
| Trade accounts payables | 154,281 | (725,711 | ) | (198,694 | ) | (726,528 | ) | |||||||||
| Taxes payable | 111,414 | 10,905 | 135,649 | 263,662 | ||||||||||||
| Payroll and charges | 97,972 | 66,863 | 78,293 | (196,046 | ) | |||||||||||
| Other liabilities | (700 | ) | (84,182 | ) | (344,568 | ) | (434,601 | ) | ||||||||
| Cash provided by operations, net | 4,865,521 | 3,639,420 | 12,160,561 | 8,696,816 | ||||||||||||
| Payment of interest with financing, loans and debentures | (1,200,748 | ) | (899,650 | ) | (2,883,161 | ) | (2,362,331 | ) | ||||||||
| Payment of interest on bonds repurchase | (378,382 | ) | - | (378,382 | ) | - | ||||||||||
| Interest received from marketable securities | 19,572 | 68,614 | 146,151 | 354,536 | ||||||||||||
| Payment of income taxes | (67,402 | ) | 68,777 | (130,096 | ) | (336,480 | ) | |||||||||
| Cash provided by operating activities | 3,238,561 | 2,877,161 | 8,915,073 | 6,352,541 | ||||||||||||
| Investing activities | ||||||||||||||||
| Additions to property, plant and equipment | (1,226,298 | ) | (1,088,202 | ) | (3,187,361 | ) | (3,744,152 | ) | ||||||||
| Proceeds from sale of property, plant and equipment | 26,927 | 70,044 | 88,814 | 153,739 | ||||||||||||
| Increase of capital in subsidiaries and associates | - | (34,640 | ) | - | (45,856 | ) | ||||||||||
| Marketable securities, net | (308,816 | ) | (1,405,165 | ) | 3,755,545 | 20,428,121 | ||||||||||
| Advance for acquisition of wood from operations with development | 81,334 | (82,012 | ) | 87,878 | (294,162 | ) | ||||||||||
| Acquisition of subsidiaries, net cash | - | - | - | (26,002,540 | ) | |||||||||||
| Dividends received | 753 | - | 753 | - | ||||||||||||
| Other investments | - | 4 | - | (265 | ) | |||||||||||
| Cash used in investing activities, net | (1,426,100 | ) | (2,539,971 | ) | 745,629 | (9,505,115 | ) | |||||||||
| Financing activities | ||||||||||||||||
| Proceeds from loans, financing and debentures | 3,882,643 | 90,839 | 10,583,172 | 16,315,910 | ||||||||||||
| Payment of derivative transactions | (1,313,206 | ) | (51,335 | ) | (3,147,456 | ) | (55,997 | ) | ||||||||
| Payment of loans, financing and debentures | (7,527,204 | ) | (238,030 | ) | (13,752,144 | ) | (12,249,522 | ) | ||||||||
| Payment of leases | (222,838 | ) | (154,711 | ) | (577,127 | ) | (425,297 | ) | ||||||||
| Payment of dividends | - | (4 | ) | - | (601,735 | ) | ||||||||||
| Liabilities for assets acquisitions and subsidiaries | (145,512 | ) | (466,971 | ) | (151,182 | ) | (470,396 | ) | ||||||||
| Other financing | - | 2,196 | - | 4,575 | ||||||||||||
| Cash provided (used) by financing activities, net | (5,326,117 | ) | (818,016 | ) | (7,044,737 | ) | 2,517,538 | |||||||||
| Exchange variation on cash and cash equivalents | 287,139 | 90,831 | 1,382,092 | (37,771 | ) | |||||||||||
| Increase (reduction) in cash and cash equivalents | (3,226,517 | ) | (389,995 | ) | 3,998,057 | (672,807 | ) | |||||||||
| Cash and cash equivalents at the beginning for the period | 10,473,701 | 4,104,641 | 3,249,127 | 4,387,453 | ||||||||||||
| Cash and cash equivalents at the end for the period | 7,247,184 | 3,714,646 | 7,247,184 | 3,714,646 | ||||||||||||
| Increase (reduction) in cash and cash equivalents | (3,226,517 | ) | (389,995 | ) | 3,998,057 | (672,807 | ) |
Page 32 of 36
3Q20 EARNINGS RELEASE | |
APPENDIX 5 - EBITDA
| (R$ '000, except where otherwise indicated) | 3Q20 | 3Q19 | 9M20 | 9M19 | ||||||||||||
| Net income | (1,157,707 | ) | (3,460,235 | ) | (16,629,286 | ) | (3,989,518 | ) | ||||||||
| Net Financial Result | 4,222,644 | 6,493,278 | 32,323,930 | 8,350,355 | ||||||||||||
| Income and Social Contribution Taxes | (897,206 | ) | (2,035,728 | ) | (9,662,275 | ) | (2,295,649 | ) | ||||||||
| EBIT | 2,167,731 | 997,315 | 6,032,369 | 2,065,188 | ||||||||||||
| Depreciation, Amortization and Depletion | 1,653,560 | 1,514,089 | 5,011,119 | 6,313,082 | ||||||||||||
| EBITDA1 | 3,810,937 | 2,495,726 | 11,036,086 | 8,357,023 | ||||||||||||
| EBITDA Margin | 51,0 | % | 37,8 | % | 49,2 | % | 44,1 | % | ||||||||
| Expenses with Fibria's transaction | (4 | ) | 1,355 | 933 | 75,946 | |||||||||||
| PPA effect (asset write down) | 12,806 | 505 | 21,043 | 24,868 | ||||||||||||
| Indemnity – FACEPA | - | - | (1,093 | ) | - | |||||||||||
| Accruals for losses on ICMS credits | (134,111 | ) | 17,357 | (91,892 | ) | 84,056 | ||||||||||
| ICMS accrual complement | 176 | - | 2,808 | - | ||||||||||||
| Expenses related to social actions to fight the Coronavirus | 55,024 | - | 81,254 | - | ||||||||||||
| Expenses with obligations and contract cancellations | - | - | 6,008 | - | ||||||||||||
| Adjustment of the fair value of biological assets | - | - | (173,733 | ) | (83,453 | ) | ||||||||||
| Provision for loss of PIS and COFINS | 3,211 | - | 11,063 | - | ||||||||||||
| COVID-19 – Donations | 530 | - | 48,553 | - | ||||||||||||
| ITBI Provision and Fees | - | - | 10,529 | - | ||||||||||||
| Project Mucuri Closure | 30,684 | - | 30,684 | - | ||||||||||||
| Judicial credits sale | - | - | - | (87,000 | ) | |||||||||||
| Exclusion of ICMS on PIS and COFINS base | - | (128,115 | ) | - | (128,115 | ) | ||||||||||
| Others | (719 | ) | 9,597 | 2,276 | 14,862 | |||||||||||
| Adjusted EBITDA | 3,778,534 | 2,396,425 | 10,984,519 | 8,258,187 | ||||||||||||
| Adjusted EBITDA Margin | 50,6 | % | 36,3 | % | 48,9 | % | 43,5 | % |
1 The Company's EBITDA is calculated in accordance with CVM Instruction 527 of October 4, 2012,
Page 33 of 36
3Q20 EARNINGS RELEASE | |
APPENDIX 6 - Segmented Income Statement
| Segmented Financial Statement (R$ '000) | 3Q20 | 3Q19 | ||||||||||||||||||||||||||||||
| Pulp | Paper | Non | Total | Pulp | Paper | Non | Total | |||||||||||||||||||||||||
| Net Revenue | 6,168,354 | 1,302,481 | - | 7,470,835 | 5,340,215 | 1,259,694 | - | 6,599,909 | ||||||||||||||||||||||||
| Cost of Goods Sold | (3,592,529 | ) | (881,465 | ) | - | (4,473,994 | ) | (4,166,295 | ) | (820,119 | ) | - | (4,986,414 | ) | ||||||||||||||||||
| Gross Profit | 2,575,825 | 421,016 | - | 2,996,841 | 1,173,920 | 439,575 | - | 1,613,495 | ||||||||||||||||||||||||
| Gross Margin | 41,8 | % | 32,3 | % | - | 40,1 | % | 22,0 | % | 34,9 | % | - | 24,4 | % | ||||||||||||||||||
| Operating Expense/Income | (635,221 | ) | (193,889 | ) | - | (829,110 | ) | (559,831 | ) | (184,464 | ) | 128,115 | (616,180 | ) | ||||||||||||||||||
| Selling Expenses | (427,581 | ) | (95,013 | ) | - | (522,594 | ) | (372,734 | ) | (96,280 | ) | - | (469,014 | ) | ||||||||||||||||||
| General and Administrative Expenses | (219,793 | ) | (92,942 | ) | - | (312,735 | ) | (187,439 | ) | (91,537 | ) | - | (278,976 | ) | ||||||||||||||||||
| Other Operating Income (Expenses) | (10,739 | ) | 6,604 | - | (4,135 | ) | (6,065 | ) | (5,918 | ) | 128,115 | 116,132 | ||||||||||||||||||||
| Equity Equivalence | 22,892 | (12,538 | ) | - | 10,354 | 6,407 | 9,271 | - | 15,678 | |||||||||||||||||||||||
| EBIT | 1,940,604 | 227,127 | - | 2,167,731 | 614,089 | 255,111 | 128,115 | 997,315 | ||||||||||||||||||||||||
| Depreciation, Amortization & Depletion | 1,508,897 | 144,663 | - | 1,653,560 | 1,377,539 | 136,550 | - | 1,514,089 | ||||||||||||||||||||||||
| EBITDA | 3,426,609 | 384,328 | - | 3,810,937 | 1,985,221 | 382,390 | 128,115 | 2,495,726 | ||||||||||||||||||||||||
| EBITDA Margin | 55,6 | % | 29,5 | % | - | 51,0 | % | 37,2 | % | 30,4 | % | - | 37,8 | % | ||||||||||||||||||
| Adjusted EBITDA1 | 3,384,057 | 394,477 | - | 3,778,534 | 2,011,755 | 384,670 | - | 2,396,425 | ||||||||||||||||||||||||
| Adjusted EBITDA Margin1 | 54,9 | % | 30,3 | % | - | 50,6 | % | 37,7 | % | 30,5 | % | - | 36,3 | % | ||||||||||||||||||
| Net Financial Result | - | - | (4,222,644 | ) | (4,222,644 | ) | - | - | (6,493,278 | ) | (6,493,278 | ) | ||||||||||||||||||||
| Earnings Before Taxes | 1,940,604 | 227,127 | (4,222,644 | ) | (2,054,913 | ) | 614,088 | 255,112 | (6,365,163 | ) | (5,495,963 | ) | ||||||||||||||||||||
| Income and Social Contribution Taxes | - | - | 897,206 | 897,206 | - | - | 2,035,728 | 2,035,728 | ||||||||||||||||||||||||
| Net Income (Loss) | 1,940,604 | 227,127 | (3,325,438 | ) | (1,157,707 | ) | 614,088 | 255,112 | (4,329,435 | ) | (3,460,235 | ) | ||||||||||||||||||||
| Net Margin | 31,5 | % | 17,4 | % | - | -15,5 | % | 11,5 | % | 20,3 | % | - | -52,4 | % | ||||||||||||||||||
1 Excluding non-recurring items and PPA effects,
Page 34 of 36
3Q20 EARNINGS RELEASE | |
| Segmented Financial Statement (R$ '000) | 9M20 | 9M19 | ||||||||||||||||||||||||||||||
| Pulp | Paper | Non | Total | Pulp | Paper | Non | Total | |||||||||||||||||||||||||
| Net Revenue | 19,031,290 | 3,416,011 | - | 22,447,301 | 15,395,971 | 3,568,019 | - | 18,963,990 | ||||||||||||||||||||||||
| Cost of Goods Sold | (11,839,056 | ) | (2,243,631 | ) | - | (14,082,687 | ) | (12,581,007 | ) | (2,352,419 | ) | - | (14,933,426 | ) | ||||||||||||||||||
| Gross Profit | 7,192,234 | 1,172,380 | - | 8,364,614 | 2,814,964 | 1,215,600 | - | 4,030,564 | ||||||||||||||||||||||||
| Gross Margin | 37,8 | % | 34,3 | % | - | 37,3 | % | 18,3 | % | 34,1 | % | - | 21,3 | % | ||||||||||||||||||
| Operating Expense/Income | (1,815,181 | ) | (517,064 | ) | - | (2,332,245 | ) | (1,532,136 | ) | (561,355 | ) | 128,115 | (1,965,376 | ) | ||||||||||||||||||
| Selling Expenses | (1,302,925 | ) | (281,703 | ) | - | (1,584,628 | ) | (1,084,740 | ) | (282,558 | ) | - | (1,367,298 | ) | ||||||||||||||||||
| General and Administrative Expenses | (680,019 | ) | (283,267 | ) | - | (963,286 | ) | (606,419 | ) | (281,353 | ) | - | (887,772 | ) | ||||||||||||||||||
| Other Operating Income (Expenses) | 159,473 | 48,794 | - | 208,267 | 153,222 | (12,890 | ) | 128,115 | 268,447 | |||||||||||||||||||||||
| Equity Equivalence | 8,290 | (888 | ) | - | 7,402 | 5,801 | 15,446 | - | 21,247 | |||||||||||||||||||||||
| EBIT | 5,377,053 | 655,316 | - | 6,032,369 | 1,282,828 | 654,245 | 128,115 | 2,065,188 | ||||||||||||||||||||||||
| Depreciation, Amortization & Depletion | 4,635,402 | 375,717 | - | 5,011,119 | 5,936,578 | 376,504 | - | 6,313,082 | ||||||||||||||||||||||||
| EBITDA | 10,004,165 | 1,031,921 | - | 11,036,086 | 7,213,605 | 1,015,303 | 128,115 | 8,357,023 | ||||||||||||||||||||||||
| EBITDA Margin | 52,6 | % | 30,2 | % | - | 49,2 | % | 46,9 | % | 28,5 | % | - | 44,1 | % | ||||||||||||||||||
| Adjusted EBITDA1 | 9,955,041 | 1,029,478 | - | 10,984,519 | 7,217,238 | 1,040,949 | - | 8,258,187 | ||||||||||||||||||||||||
| Adjusted EBITDA Margin1 | 52,3 | % | 30,1 | % | - | 48,9 | % | 46,9 | % | 29,2 | % | - | 43,5 | % | ||||||||||||||||||
| Net Financial Result | - | - | (32,323,930 | ) | (32,323,930 | ) | - | - | (8,350,355 | ) | (8,350,355 | ) | ||||||||||||||||||||
| Earnings Before Taxes | 5,377,053 | 655,316 | (32,323,930 | ) | (26,291,561 | ) | 1,282,829 | 654,244 | (8,222,240 | ) | (6,285,167 | ) | ||||||||||||||||||||
| Income and Social Contribution Taxes | - | - | 9,662,275 | 9,662,275 | - | - | 2,295,649 | 2,295,649 | ||||||||||||||||||||||||
| Net Income (Loss) | 5,377,053 | 655,316 | (22,661,655 | ) | (16,629,286 | ) | 1,282,829 | 654,244 | (5,926,591 | ) | (3,989,518 | ) | ||||||||||||||||||||
| Net Margin | 28,3 | % | 19,2 | % | - | -74,1 | % | 8,3 | % | 18,3 | % | - | -21,0 | % | ||||||||||||||||||
1 Excluding non-recurring items and PPA effects,
Page 35 of 36
3Q20 EARNINGS RELEASE | |
Forward-Looking Statements
This release may contain forward-looking statements, Such statements are subject to known and unknown risks and uncertainties that could cause the expectations expressed to not materialize or differ substantially from expected results, These risks include, among others, changes in future demand for the Company’s products, changes in factors affecting domestic and international product prices, changes in the cost structure, changes in the seasonal patterns of markets, changes in prices charged by competitors, foreign exchange variations, changes in the political or economic situation of Brazil, as well as emerging and international markets, The forward-looking statements were not reviewed by our independent auditors.
Page 36 of 36