Exhibit 99.1

1 3Q20 Earnings Conference Call

2 This presentation contains what are considered “forward - looking statements,” as defined in Section 27 A of the 1933 Securities Act and Section 21 E of the 1934 Securities Exchange Act, as amended . Some of these forward - looking statements are identified with words such as “believe,” “may,” “could,” “would,” “possible,” “will,” “should,” “expect,” “intend,” “plan,” “anticipate,” “estimate,” “potential,” “outlook” or “continue,” as well as the negative forms of these words, other terms of similar meaning or the use of future dates . The forward - looking statements include, without limitation, statements related to the declaration or payment of dividends, implementation of the key operational and financial strategies and investment plans, guidance about future operations and factors or trends that influence the financial situation, liquidity or operational results . Such statements reflect the current view of the management and are subject to diverse risks and uncertainties . These are qualified in accordance with the inherent risks and uncertainties involving future expectations in general, and actual results could differ materially from those currently anticipated due to various risks and uncertainties . There is no guarantee that the expected events, trends or results will actually occur . The statements are based on diverse assumptions and factors, including general economic and market conditions, industry conditions and operating factors . Any changes in such assumptions or factors could cause actual results to differ materially from current expectations . Suzano does not undertake any obligation to update any such forward - looking statements as a result of new information, future events or otherwise, except as expressly required by law . All forward - looking statements in this presentation are covered in their entirety by this disclaimer . In addition, this presentation contains some financial indicators that are not recognized by the BR GAAP or IFRS . These indicators do not have a standard meaning and may not be comparable to indicators with a similar description used by other companies . We provide these indicators because we use them as measurements of Suzano's performance ; they should not be considered separately or as a replacement for other financial metrics that have been disclosed in accordance with BR GAAP or IFRS . Disclaimer

Consistent delivery of solid results amidst an adverse market scenario HIGHLIGHTS Pulp : Paper 1 : Pulp inventory : stable vs. 2Q20 2.5 million tons 290 thousand tons Liquidity : Net Debt : Leverage 3 : US$2.4 billion US$12.2 billion 4.4x in US$ (5.1x in R$) 1 Excluding Consumer Goods. | 2 Operating Cash Generation = Adjusted EBITDA less Sustaining capex. | 3 Net Debt / Adjusted EBITDA in the last 12 months. 3 Sustainability Linked Bonds issuance : US$750 million BNDESPAR Offering : liquidity increase Sales Volume Operating Performance Financial Management Adjusted EBITDA: R$3.8 billion Operating Cash Generation 2 : R$2.9 billion Cash cost ex - downtime : R$600/ ton

4 286 239 266 1,073 0 100 200 300 400 500 600 3Q19 2Q20 3Q20 LTM 3Q20 Paper Production ('000 tons) 187 110 193 689 101 91 98 384 288 202 290 1,073 0 100 200 300 400 500 600 3Q19 2Q20 3Q20 LTM 3Q20 Paper Sales ('000 tons) Net Average P rice (R$/ton) Local Foreign Paper and Packaging Business Packaging markets and seasonal factors favor a recovery in Brazilian sales volume and EBITDA Excluding Consumer Goods. | 1 Excluding the impact of LTI of Management . 3Q19: - R$ 37/ ton | 2Q20: - R$ 22/ ton | 3Q20: - R$ 43/ ton | LTM 3Q20: - R$ 31/ton. Adjusted EBITDA from Paper 1 3,808 3,998 3,815 3,798 1,000 1,500 2,000 2,500 3,000 3,500 4,000 4,500 3000 4000 5000 6000 7000 8000 9000 10000 3Q19 2Q20 3Q20 LTM 3Q20 1,202 1,259 1,223 346 254 355 -200 -100 0 100 200 300 400 500 1,000 1,100 1,200 1,300 1,400 1,500 1,600 3Q19 2Q20 3Q20 R$/ ton R$ MM 1,207 1,295 -10 40 90 140 190 240 290 340 390 1,000 1,100 1,200 1,300 1,400 1,500 LTM 3Q20

5 Pulp Business Strong production and sales despite market conditions, seasonal factors and maintenance downtimes 2,549 2,778 2,527 11,080 0 1,000 2,000 3,000 4,000 5,000 6,000 3Q19 2Q20 3Q20 LTM 3Q20 526 471 458 2,090 2,536 2,465 465 2,249 0 500 1000 1500 2000 2500 0 500 1000 1500 2000 2500 3000 3Q19 2Q20 3Q20 LTM 3Q20 BRL USD 1 Excluding Klabin sales revenue. 2,095 2,543 2,529 9,676 0 500 1,000 1,500 2,000 2,500 3,000 3,500 4,000 3Q19 2Q20 3Q20 LTM 3Q20 Sales Volume ('000 tons) Net Average Price – Foreign Market (per ton) Pulp Production ('000 tons) 857 1,391 1,339 1,103 41% 55% 55% 49% 0% 10% 20% 30% 40% 50% 60% 70% 0 500 1,000 1,500 2,000 2,500 3Q19 2Q20 3Q20 LTM 3Q20 R$/ ton Margin (%) Average FX R$ 3.97 R$ 5.39 R$ 5.38 R$ 4.84 Adjusted EBITDA 1 (R$/ton) and EBITDA Margin (%)

654 631 596 599 600 500 550 600 650 700 750 800 3Q19 4Q19 1Q20 2Q20 3Q20 327 302 275 259 254 0 200 400 600 800 1,000 1,200 Pulp Business Long term competitiveness reinforced by wood cost structural reduction Pulp Cash Cost 3Q20 vs. 3Q19 (ex - downtimes - R$/ton) Pulp Cash Cost 3Q20 vs. 2 Q20 (ex - downtimes - R$/ton) 259 254 238 240 138 141 - 36 - 35 599 - 5 2 3 1 600 -200 0 200 400 600 800 1,000 Custo Caixa 2T20 Madeira Insumos Custo Fixo Energia Custo Caixa 3T20 0% 6 D D D Pulp Cash Cost (ex - downtimes - R$/ton) - R$54/t - R$73/t Wood Inputs Fixed Cost Energy Cash Cost 2 Q20 Cash Cost 3 Q20 327 - 73 254 234 - 26 240 132 9 141 - 39 4 - 35 654 32 600 -200 0 200 400 600 800 1,000 Custo Caixa 3T19 Madeira Insumos Custo Fixo Energia Efeito câmbio Custo Caixa 3T20 - 8% Cash Cost 3Q20 Fixed Cost Energy Exchange Rate Wood Cash Cost 3Q19 Inputs Wood Others

1.7 0.7 0.6 0.2 0.8 2.2 1.5 1.6 6.9 0.3 0.5 0.2 0.1 0.2 0.4 0.3 0.9 0.7 1.0 2.3 1.7 2.0 7.2 0.0 0.5 1.0 1.5 2.0 2.5 3.0 3.5 Liquidity 2020 2021 2022 2023 2024 2025 2026 onward 7 Financial Management Financial discipline – accelerated deleverage and nominal USD net debt decline 94% of total debt Stand - by facilities Cash on hand 6 Amortization Schedule (US$ billion) 4.5% p.a . 84 months Net Debt 1 (billion) and Leverage (in times) Average Term : 1 CETIP calculation methodology considers FX D - 1 R$ 5.65. 59% in US$ (vs. 78% in Jun /20) 13.3 12.4 12.2 55.2 67.9 68.7 0.0 2.0 4.0 6.0 8.0 10.0 12.0 14.0 16.0 18.0 20.0 Set/19 Jun/20 Set/20 Coluna1 Set/192 Jun/203 Set/204 Sep /19 4.7x 5.6x 5.1x 4.3x 4.7x 4.4x 3.0x 3.5x 4.0x 4.5x 5.0x 5.5x 6.0x Em US$ Em R$ US$ R$ MTM Hedge 1 Jun /20 Sep /20 Sep /19 Jun /20 Sep /20 R$/US$ 4.16 5.64 2.4 - 1.1 +13.5 Average Cost (in US$):

8 Financial Management Operational hedging roll - overs reaffirm policy effectiveness Portfolio renewal - Cash Flow Hedge (ZCC) 522 736 840 617 485 245 4.19 4.27 4.27 4.75 5.18 5.25 4.63 4.76 4.75 5.54 6.15 6.05 4Q20 1Q21 2Q21 3Q21 4Q21 1Q22 Notional (USD MM) Put ( average ) Call ( average ) Effects related to cash flow hedge Financial Result - 3Q20 (R$ billion) - 1.2 Interest over debt - 1.9 D FX on debt in US$ +0.5 D MtM of debt dollarization hedges - 0.9 D MtM of cash flow hedges Effects related to debt management Cash disbursements of debt dollarization hedges - 0.3 Cash disbursements of cash flow hedges - 4.2 - 0.4 12/31/19: 09/30/20: 3.98 4.31 4.54 5.16 Total Average Portfolio Put / Call Put / Call
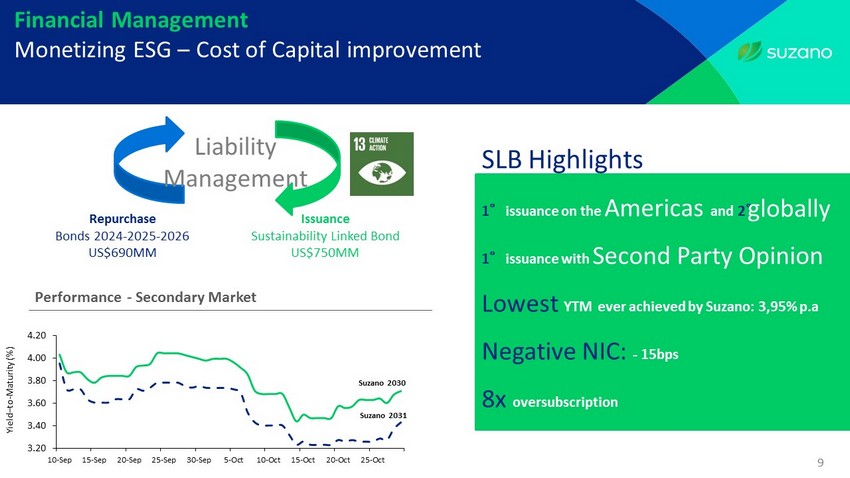
9 Financial Management Monetizing ESG – Cost of Capital improvement Repurchase Bonds 2024 - 2025 - 2026 US$690MM Liability Manageme nt Issuance Sustainability Linked Bond US$750MM Performance - Secondary Market 1 ° issuance on the Americas and 2 ° 1 ° issuance with Second Party Opinion Lowest YTM ever achieved by Suzano : 3 , 95 % p . a Negative NIC : - 15 bps 8 x oversubscription SLB Highlights global ly Yield – to - Maturity (%) Suzano 2031 Suzano 2030 3.20 3.40 3.60 3.80 4.00 4.20 10-Sep 15-Sep 20-Sep 25-Sep 30-Sep 5-Oct 10-Oct 15-Oct 20-Oct 25-Oct

10 Takeaways 3Q20 Recurring structural efficiency gains reinforcing long term competitiveness Strong cash generation , resilient to adverse market scenarios V shaped recovery on Paper and Packaging, driven by seasonality and packaging demand Successful pulp business commercial strategy, keeping inventories at low levels despite seasonal factors and solid production Commitment to financial discipline Monetizing ESG

Investor Relations www.suzano.com.br/ir ir@suzano.com.br Q&A