Exhibit 99.1

Strong resilience in 2020 despite adverse scenario
São Paulo, February 10, 2021. Suzano S.A. (B3: SUZB5 | NYSE: SUZ), one of the world’s largest integrated pulp and paper producers, announces today its consolidated results for the fourth quarter of 2020 (4Q20).
HIGHLIGHTS
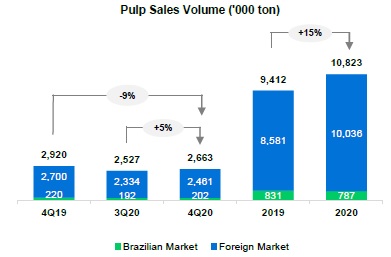
| · | Pulp sales of 2,663 thousand tons (-9% vs. 4Q19). |
| · | Decrease in pulp inventories by approximately 1 million tons in 2020. |
| · | Paper sales of 354 thousand tons (-4% vs. 4Q19). |
| · | Adjusted EBITDA1 and Operating cash generation²: R$4.0 billion and R$3.0 billion, respectively. |
| · | Adjusted EBITDA1/ton3 from pulp of R$1,326 /ton (+79% vs. 4Q19). |
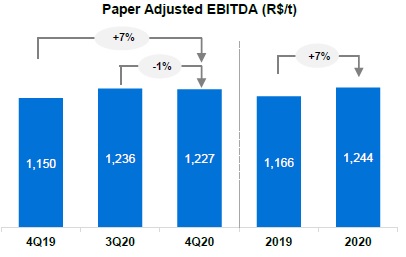
| · | Adjusted EBITDA1/ton4 from paper of R$1,227/ton (+7% vs. 4Q19). |
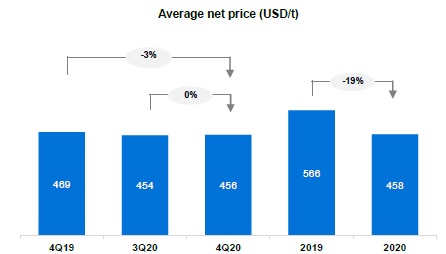
| · | Average net pulp price – export market: US$459/t (-2% vs. 4Q19). |
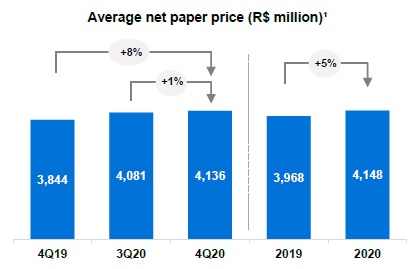
| · | Average net paper price4 of R$4,136/ton (+8% vs. 4Q19). |
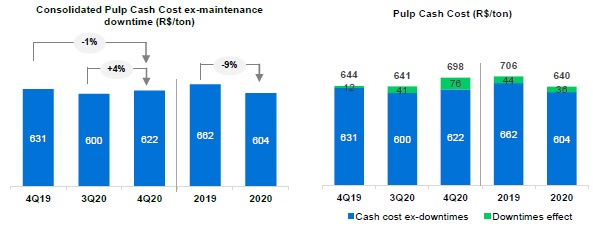
| · | Pulp cash cost ex-downtime of R$622/ton (-1% vs. 4Q19). |
| · | Capture of operating synergies completed and ahead of schedule. |
| · | Deleveraging plan 100% executed. |
| Financial Data (R$ million) | | 4Q20 | | | 4Q19 | | | ΔY-o-Y | | | | 3Q20 | | | ΔQ-o-Q | | | | 2020 | | | | 2019 | | | | ΔY-o-Y | |
| Net Revenue | | 8,013 | | | | 7,049 | | | | 14 | % | | | 7,471 | | | | 7 | % | | | 30,460 | | | | 26,013 | | | | 17 | % |
| Adjusted EBITDA1 | | 3,965 | | | | 2,465 | | | | 61 | % | | | 3,779 | | | | 5 | % | | | 14,949 | | | | 10,724 | | | | 39 | % |
| Adjusted EBITDA Margin1 | | 49 | % | | | 35 | % | | | 15 p.p. | | | | 51 | % | | | -1 p.p. | | | | 49 | % | | | 41 | % | | | 8 p.p. | |
| Adjusted EBITDA Margin¹ ex- Klabin2 | | 49 | % | | | 37 | % | | | 13 p.p. | | | | 51 | % | | | -1 p.p. | | | | 49 | % | | | 43 | % | | | 6 p.p. | |
| Net Financial Result | | 6,238 | | | | 1,624 | | | | 284 | % | | | (4,223 | ) | | | - | | | | (26,086 | ) | | | (6,726 | ) | | | - | |
| Net Income | | 5,914 | | | | 1,175 | | | | 403 | % | | | (1,158 | ) | | | - | | | | (10,715 | ) | | | (2,815 | ) | | | - | |
| Operating Cash Generation3 | | 2,981 | | | | 1,540 | | | | 93 | % | | | 2,854 | | | | 4 | % | | | 11,543 | | | | 7,063 | | | | 63 | % |
| Net Debt /Adjusted EBITDA1 (x) - R$ | | 4.3 x | | | | 5.0 x | | | | -0.7 x | | | | 5.1 x | | | | -0.8 x | | | | 4.3 x | | | | 5.0 x | | | | -0.7 x | |
| Net Debt /Adjusted EBITDA1 (x) - US$ | | 4.3 x | | | | 4.9 x | | | | -0.6 x | | | | 4.4 x | | | | -0.1 x | | | | 4.3 x | | | | 4.9 x | | | | -0.6 x | |
| Operational Data ('000 tons) | | 4Q20 | | | 4Q19 | | | ΔY-o-Y | | | | 3Q20 | | | ΔQ-o-Q | | | | 2020 | | | | 2019 | | | | ΔY-o-Y | |
| Sales | | 3,017 | | | | 3,288 | | | | -8 | % | | | 2,846 | | | | 6 | % | | | 12,000 | | | | 10,668 | | | | 12 | % |
| Pulp | | 2,663 | | | | 2,920 | | | | -9 | % | | | 2,527 | | | | 5 | % | | | 10,823 | | | | 9,412 | | | | 15 | % |
| Paper4 | | 354 | | | | 369 | | | | -4 | % | | | 319 | | | | 11 | % | | | 1,177 | | | | 1,256 | | | | -6 | % |
| Production | | 2,700 | | | | 2,586 | | | | 4 | % | | | 2,825 | | | | -4 | % | | | 10,984 | | | | 9,997 | | | | 10 | % |
| Pulp | | 2,391 | | | | 2,267 | | | | 5 | % | | | 2,529 | | | | -5 | % | | | 9,800 | | | | 8,757 | | | | 12 | % |
| Paper4 | | 309 | | | | 319 | | | | -3 | % | | | 296 | | | | 5 | % | | | 1,184 | | | | 1,240 | | | | -4 | % |
¹Excludes non-recurring items and PPA effects. | 2Excludes Klabin’s sales volume. | 3Considers Adjusted EBITDA less sustaining capex (cash basis). | 4Includes the results of the Consumer Goods Unit. | 5Last 12 months.

The consolidated quarterly information has been prepared in accordance with the Securities and Exchange Commission (CVM) and Accounting Standards Committee (CPC) standards and is in compliance with International Accounting Standard (IFRS) issued by the International Accounting Standard Board (IASB). The data contained in this document was obtained from the financial information as made available to the CVM. The operating and financial information is presented based on consolidated numbers in Reais (R$). Summaries may diverge due to rounding. Non-financial data, such as volume, quantity, average price, average price, in Reais and Dollars, were not reviewed by independent auditors.
CONTENTS
| | |
| EXECUTIVE SUMMARY | 3 |
| PULP BUSINESS PERFORMANCE | 3 |
| PULP SALES VOLUME AND REVENUE | 3 |
| PULP CASH COST | 5 |
| PULP SEGMENT EBITDA | 7 |
| OPERATING CASH FLOW FROM THE PULP SEGMENT | 8 |
| PAPER BUSINESS PERFORMANCE | 9 |
| PAPER SALES VOLUME AND REVENUE¹ | 9 |
| OPERATING CASH FLOW FROM THE PAPER SEGMENT | 11 |
| ECONOMIC AND FINANCIAL PERFORMANCE | 12 |
| NET REVENUE | 12 |
| PRODUCTION | 13 |
| COST OF GOODS SOLD | 13 |
| SELLING EXPENSES | 14 |
| GENERAL AND ADMINISTRATIVE EXPENSES | 14 |
| ADJUSTED EBITDA | 15 |
| FINANCIAL INCOME | 15 |
| DERIVATIVE OPERATIONS | 16 |
| NET INCOME (LOSS) | 19 |
| DEBT | 19 |
| CAPITAL EXPENDITURE | 21 |
| OPERATING CASH GENERATION | 22 |
| FREE CASH FLOW | 23 |
| COVID-19 | 23 |
| ESG | 25 |
| SYNERGIES | 25 |
| TOTAL OPERATIONAL EXPENDITURE - PULP | 26 |
| EVENTS AFTER THE REPORTING PERIOD | 26 |
| CAPITAL MARKETS | 26 |
| FIXED INCOME | 28 |
| RATINGS | 28 |
| UPCOMING EVENTS | 29 |
| IR CONTACTS | 29 |
| APPENDICES | 30 |
| APPENDIX 1 - Operating Data | 30 |
| APPENDIX 2 – Consolidated Statement of Income and Goodwill Amortization | 32 |
| APPENDIX 3 – Consolidated Balance Sheet | 33 |
| APPENDIX 4 – Consolidated Statement of Cash Flow | 34 |
| APPENDIX 5 - EBITDA | 35 |
| APPENDIX 6 - Segmented Income Statement | 36 |
| Forward-Looking Statements | 38 |
EXECUTIVE SUMMARY
Despite the adverse market scenario, with pulp prices below their average of the last ten years, Suzano showed strong resilience and delivered important results in the year, evidenced, for example, by the expressive cash generation; the reduction of approximately 1 million tons of pulp inventories; for the execution of 100% of the deleveraging plan; and the 9% reduction in the cash cost of pulp production, mainly due to the synergies arising from the business combination with Fibria Celulose S.A. that occurred in January 2019.
The capture of these operational synergies was above planned and totaled, in the period from 2019 to 2020, on a recurring basis, the total of R$1.3 billion per year (before taxation). The amount was the result of a reduction in costs, expenses and capital investments from the supply, forestry, industrial, logistics, commercial, administrative and personnel areas.
Regarding financial management, the Company throughout 2020 reduced its net debt in USD and leverage, as measured by Net Debt/Adjusted EBITDA of the past twelve months. Its liquidity position remained solid, representing zero refinancing risk until 2022. Suzano remains focused on financial discipline, evidenced by clear and consistent policies over time, and believes that this way, it diligently exercises its role of generating and sharing long-term value.
On the ESG front, results in the fourth quarter of 2020 reiterated the progress of environmental, social and governance issues at Suzano. In November, the company was selected to be part of the select 2020-2021 portfolio of the Dow Jones Sustainability Index - Emerging Markets (DJSI Emerging Markets). In addition to Suzano, only ten other Brazilian companies are part of the new portfolios that are part of the DJSI family of indices. In early December, we were also selected to be part of the B3 Corporate Sustainability Index (ISE) portfolio of 2021. The portfolio announced is made up of 46 shares, from 39 companies, and will be valid between January 4 and December 30, 2021.
PULP BUSINESS PERFORMANCE
PULP SALES VOLUME AND REVENUE
The last quarter of 2020 was positive for the global pulp and paper industry in general, despite the uncertainties arising from the impact of the pandemic on the economy. The increasing number of cases of coronavirus infection and the resumption of lockdown adoption in some regions of Europe and North America did not have the same negative impact on the demand for pulp as seen previously in the first half of the year. The production of graphic papers in China has heated up with the entry of new capacities and the operating rate of the printing & writing mills in North America and Europe has recovered from the low levels observed most part of the year, following the seasonally warmer demand in the last months of the year. The other paper segments, especially those related to consumer goods, continued to perform well on a global level, with a strong emphasis on the consumption of toilet paper, which continued with the strong behavior as in previous months, mainly in North America.
The fourth quarter of 2020 was marked by supply reductions, mainly among softwood pulp producers who, due to extended production downtimes and the replacement of production with unbleached pulp or dissolving pulp, offered lower volumes to the market than in previous quarters. These movements, which also had problems on the logistical side, related to the restricted availability of containers and congestion at ports, associated with a strong demand, supported the global price increases announced for both hardwood and softwood pulp. During 2020, supply levels remained relatively balanced, with over 2 million tons of pulp unexpectedly withdrawn from the market offsetting the increase in production by some producers and temporary conversions of integrated capacities of dissolving pulp to market pulp.
In the last quarter of 2020, Suzano’s pulp sales totaled 2,663 thousand tons, up 5% from 3Q20 and down 9% in relation to 4Q19. In 2020, the company sold 10,823 thousand tons, 15% more than in 2019.
In the quarter, pulp was sold by Suzano at the average net price of US$456/ton, stable in relation to 3Q20 and down US$13/ton (-3%) from 4Q19, reflecting the drop in global pulp prices. Average net pulp price in the export market in 4Q20 was US$459/ton (compared to US$458/ton in 3Q20 and US$471/ton in 4Q19).
Average net price in BRL was R$2,459/ton in 4Q20, up 1% and 27% when compared to 3Q20 and 4Q19, respectively, due to the depreciation of the Brazilian real against the U.S. dollar in the period and the price variations in the export market since the end of 2019.
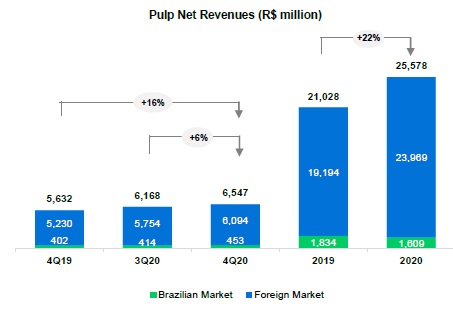
Net revenue from pulp was 16% higher than in 4Q19, mainly due to the 31% increase in average USD in relation to BRL, which was partially offset by lower average net price in USD (-3%).
Compared to 3Q20, the 6% increase in revenue was driven by the 5% growth in sales, better price and higher average exchange rate during the final months of the year.
PULP CASH COST
Cash cost excluding downtime in 4Q20 stood at R$622/t, decreasing R$9/ton from 4Q19 (-1%), due to: i) the lower wood cost on account of lower harvest costs, thanks to better operating performance, higher operating productivity and lower cost of diesel. Moreover, there was a decline in the consolidated average supply radius, mainly due to the decline registered in Aracruz (non-utilization of Losango wood) and Maranhão, as well as lower diesel costs; ii) lower costs with energy as a result of lower price, specially natural gas and synergies in supplies. These effects were partially offset by the 31% jump in average USD against the BRL (an impact of R$25/t), higher chemical costs mainly due to higher consumption and price increase (especially of chlorine dioxide), and higher fixed costs due to the concentration of scheduled maintenance downtimes and the consequent increase in expenses with materials and routine services.
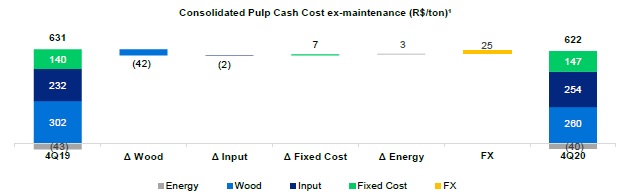
¹Excludes the impact of maintenance and administrative downtimes.
Cash cost excluding downtime in 4Q20 was 4% higher than in 3Q20, due to: i) greater spending on energy due to increased consumption and higher prices, especially of natural gas; ii) higher fixed costs due to the increase in maintenance costs; and iii) higher wood costs, due to greater share of third-party wood and higher harvest costs (due to the higher maintenance intensity of machinery that typically occur in the last quarter of the year). These negative factors were partially offset by higher revenue from energy sales due to the price factor.
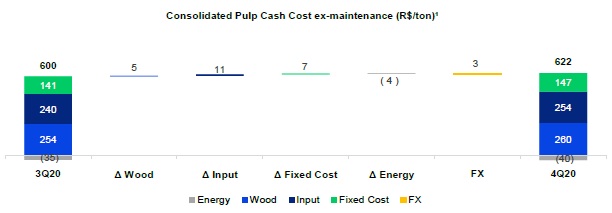
¹Excludes the impact of maintenance and administrative downtimes.
Cash cost excluding downtime in 2020 decreased 9% from 2019, due to lower wood and input costs (which were offset by the 31% increase in average USD vs. BRL) as well as fixed costs.
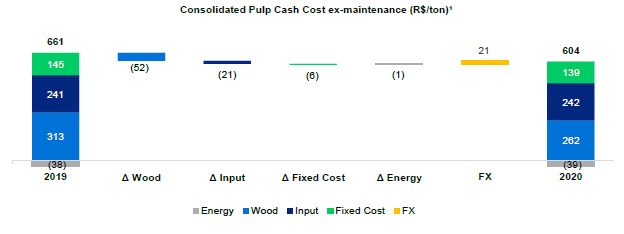
¹Based on cash cost excluding downtimes. Excludes energy sales.
PULP SEGMENT EBITDA
| Pulp segment | | | 4Q20 | | | 4Q19 | | | ΔY-o-Y | | | | 3Q20 | | | ΔQ-o-Q | | | | 2020 | | | | 2019 | | | | ΔY-o-Y | |
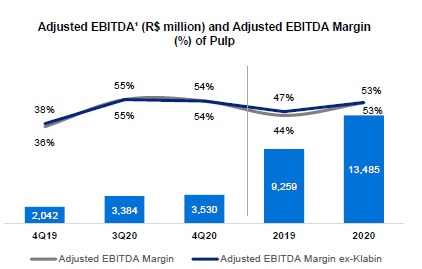
| Adjusted EBITDA (R$ million) | | | 3,530 | | | | 2,041 | | | | 73 | % | | | 3,384 | | | | 4 | % | | | 13,485 | | | | 9,259 | | | | 46 | % |
| Sales volume (k ton) | | | 2,663 | | | | 2,757 | | | | -3 | % | | | 2,527 | | | | 5 | % | | | 10,785 | | | | 8,873 | | | | 22 | % |
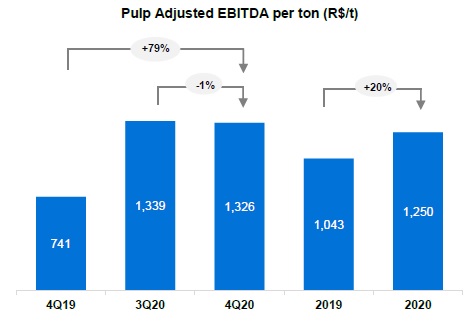
| Pulp adjusted¹ EBITDA (R$/ton) | | | 1,326 | | | | 741 | | | | 79 | % | | | 1,339 | | | | -1 | % | | | 1,250 | | | | 1,043 | | | | 20 | % |
¹ Excludes non-recurring items and PPA effects.
The 73% increase in Adjusted EBITDA from pulp in 4Q20 compared to 4Q19 mainly reflects the 31% increase in average USD against the BRL and lower cash COGS (in turn, due to non-recurring existing adjustments in 4Q19, absence of Klabin's sales volumes and turnover effect on inventories), which was partially offset by lower sales (-9%), higher SG&A expenses and lower net average pulp price in USD (-3%). The 79% increase in adjusted EBITDA per ton is explained mainly by the FX depreciation and the cost factor, partially offset by the increase in administrative and selling expenses, and by the decrease in the average net pulp price in USD.
Compared to 3Q20, the 4% increase in adjusted EBITDA from pulp mainly reflects the 5% increase in sales volume and lower net average price. These effects were partially offset by higher administrative and selling expenses Adjusted EBITDA per ton remained practically stable.
¹ Excludes non-recurring items and PPA effects.
OPERATING CASH FLOW FROM THE PULP SEGMENT
| Segmento de Celulose (R$ milhões) | | | 4Q20 | | | 4Q19 | | | ΔY-o-Y | | | 3Q20 | | | ΔQ-o-Q | | | 2020 | | | 2019 | | | ΔY-o-Y | |
| Adjusted EBITDA1 | | | 3,530 | | | 2,041 | | | 73 | % | | 3,384 | | | 4 | % | | 13,485 | | | 9,259 | | | 46 | % |
| Maintenance Capex2 | | | (894 | ) | | (842 | ) | | 6 | % | | (854 | ) | | 5 | % | | (3,124 | ) | | (3,343 | ) | | -7 | % |
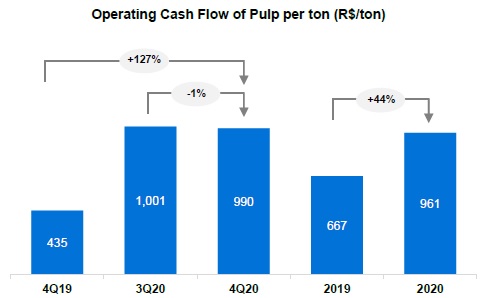
| Operating Cash Flow | | | 2,636 | | | 1,200 | | | 120 | % | | 2,530 | | | 4 | % | | 10,361 | | | 5,916 | | | 75 | % |
¹ Excludes non-recurring items and PPA effects.
² Cash basis.
¹ Excludes sales volume related to the agreement with Klabin.
Operating cash generation per ton in the pulp segment increased 127% from 4Q19, reflecting the increase in Adjusted EBITDA per ton. Compared to 3Q20, the 1% reduction was due to the increase in sustaining capex per ton and the decrease in EBITDA per ton (as explained above).
PAPER BUSINESS PERFORMANCE
The following data and analyses incorporate the joint results of the consumer goods and paper businesses.
PAPER SALES VOLUME AND REVENUE¹
According to published data by Forestry Industry Association (Ibá), the demand in the printing & writing segment decreased by 16% in 4Q20 compared to 4Q19, accumulating a decrease of 24% in 2020 in relation to year 2019. Driven by the high demand for packaging in the domestic market, demand in Brazil for paperboard grew by 17% in 4Q20 compared to the same quarter of the previous year, ending the year 2020 with an increase of 7% in comparison to 2019.
Consolidating both markets (accessible market Suzano), there is a reduction of 8% in 4Q20 compared to 4Q19, and a decrease of 16% in demand compared to 2019. Even in face of this challenging scenario, we have observed since July 2020 a gradual recovery demand in the domestic market, with greater emphasis on the paperboard line.
Like the packaging market, the tissue market was also positively impacted in 2020. For that market, also reported by Ibá, demand in Brazil grew 2% in November compared to the same period last year.
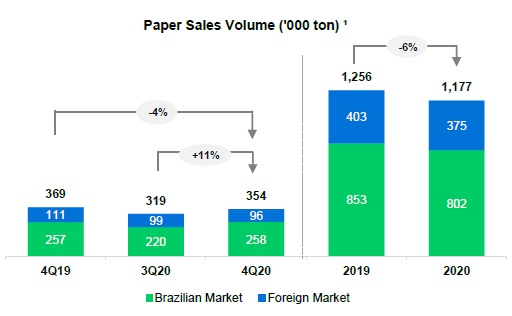
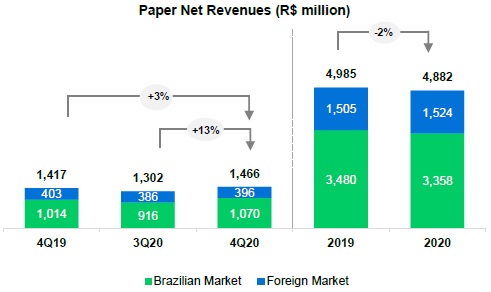
Suzano's paper sales (printing and writing, paperboard and tissue) in Brazil totaled 258 thousand tons in 4Q20, an increase of 17% compared to 3Q20, given the pace of recovery in domestic sales, driven by the packaging market, as well as well as the seasonality of the market. In relation to 4Q19, sales remained stable.
Suzano's total paper sales in Brazil accumulated a 6% drop in 2020 compared to 2019, mainly due to the market retraction in 2Q20, during the period of greatest decrease in local demand, as a result of the isolation to contain the COVID-19 pandemic.
Paper sales in the international markets decreased by 3% compared to 3Q20, and by 14% compared to 4Q19, and represented 27% of the volume sold in the last quarter of 2020.
¹Includes the Consumer Goods unit.
The average net price was R$4,136/ton in 4Q20, showing an increase of R$292/ton (+8%) compared to 4Q19, due to price gains in the domestic market (+4%), and in exchange rate effect on export prices. In comparison to 3Q20, the increase of R$55/ton (+1%) was due to the recovery of prices in both the domestic and international markets (in US$), in addition to exchange rate effect on exports.
Net revenue from paper in 4Q20 was R$1,466 million, up 3% from 4Q19, mainly higher sales prices in the period. Compared to 3Q20, the 13% increase was due to the higher sales volume in the period.
PAPER SEGMENT EBITDA
| Paper segment | | | 4Q20 | | | 4Q19 | | | ΔY-o-Y | | | 3Q20 | | | ΔQ-o-Q | | | 2020 | | | 2019 | | | ΔY-o-Y | |
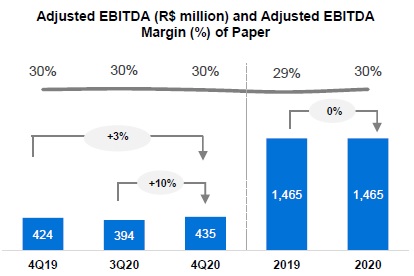
| Adjusted EBITDA (R$ million)¹ | | | 435 | | | 424 | | | 3 | % | | 394 | | | 10 | % | | 1,465 | | | 1,465 | | | 0 | % |
| Sales volume (k ton) | | | 354 | | | 369 | | | -4 | % | | 319 | | | 11 | % | | 1,177 | | | 1,256 | | | -6 | % |
| Paper adjusted¹ EBITDA (R$/ton) | | | 1,227 | | | 1,150 | | | 7 | % | | 1,236 | | | -1 | % | | 1,244 | | | 1,166 | | | 7 | % |
¹ Excludes non-recurring items and PPA effects.
Adjusted EBITDA from paper in 4Q20 was 3% higher than in 4Q19, mainly explained by the higher prices in the period, and reaching one of the highest historical levels.
Compared to 3Q20, Adjusted EBITDA from paper grew 10%, mainly due to higher sales volume as well as higher realized prices in 4Q20. EBITDA per ton remained practically stable.
OPERATING CASH FLOW FROM THE PAPER SEGMENT
| Operating cash flow - Paper (R$ million) | | | 4Q20 | | | 4Q19 | | | ΔY-o-Y | | | 3Q20 | | | ΔQ-o-Q | | | 2020 | | | 2019 | | | ΔY-o-Y | |
| Adjusted EBITDA1 | | | 435 | | | 424 | | | 3 | % | | 394 | | | 10 | % | | 1,465 | | | 1,465 | | | 0 | % |
| Maintenance Capex2 | | | (90 | ) | | (83 | ) | | 9 | % | | (70 | ) | | 29 | % | | (282 | ) | | (318 | ) | | -11 | % |
| Operating Cash Flow | | | 345 | | | 341 | | | 1 | % | | 324 | | | 6 | % | | 1,183 | | | 1,147 | | | 3 | % |
¹ Excluding non-recurring items.
² Cash basis.

Operating cash generation per ton of paper in 4Q20 was R$974/t, up 5% from the previous year, due to the increase in adjusted EBITDA per ton.
Compared to 3Q20, operating cash generation per ton decreased 4% mainly due to the increase in sustaining capex, which in turn was due to the higher concentration of expenses in 4Q20 given contingency measures taken in the previous quarters to postpone and reduce costs due to pandemic.
ECONOMIC AND FINANCIAL PERFORMANCE
NET REVENUE
Suzano’s net revenue in 4Q20 was R$8,013 million, 81% of which came from exports (vs. 80% in 4Q19 and 82% in 3Q20). Compared to 4Q19, the 14% growth in net revenue mainly reflected the 31% increase in average USD against the BRL, partially offset by the 8% decline in sales volume and average net pulp price in USD. The 7% increase in consolidated net revenue in 4Q20 compared to 3Q20 is basically due to the 6% increase in total sales, which came to 3,017 thousand tons.
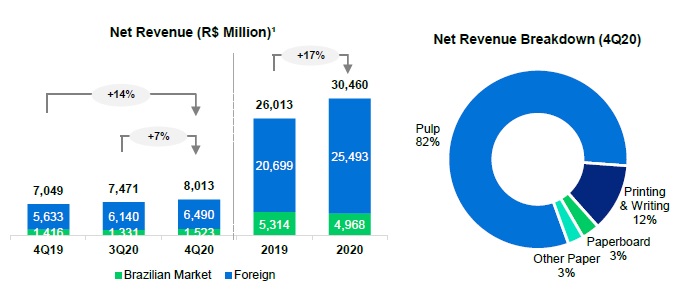
¹ Excludes service revenue from Portocel.
PRODUCTION
| Production (k ton) | | | 4Q20 | | | | 4Q19 | | | | ΔY-o-Y | | | | 3Q20 | | | | ΔQ-o-Q | | | | 2020 | | | | 2019 | | | | ΔY-o-Y | |
| Market Pulp | | | 2,391 | | | | 2,267 | | | | +5 | % | | | 2,529 | | | | -5 | % | | | 9,800 | | | | 8,757 | | | | +12 | % |
| Paper | | | 309 | | | | 319 | | | | -3 | % | | | 296 | | | | +5 | % | | | 1,184 | | | | 1,240 | | | | -5 | % |
| Total | | | 2,700 | | | | 2,586 | | | | +4 | % | | | 2,825 | | | | -4 | % | | | 10,984 | | | | 9,997 | | | | +10 | % |
In 4Q20, the following units underwent scheduled maintenance downtimes: Imperatriz and Jacareí Units, Line 1 of the Mucuri Unit and Lines 1 and 2 of the Três Lagoas Unit. As already disclosed by the Company, given the social scenario caused by the COVID-19 pandemic, in order to protect people and society, the Company decided to postpone most of its maintenance downtimes to the second half of the year. Pulp production decreased 5% in relation to 3Q20 due to higher impact of downtimes. Compared to the same period last year, the increase was due to the accelerated pace of production at pulp mills, which was partially offset by the impact of scheduled maintenance downtimes.
Following is the calendar of Suzano’s scheduled maintenance downtimes:
| | 2019 | | | 2020 | | | 2021 |
| Mill - Pulp capacity | | | 1Q19 | | | | 2Q19 | | | | 3Q19 | | | | 4Q19 | | | | 1Q20 | | | | 2Q20 | | | | 3Q20 | | | | 4Q20 | | | 1Q21 | | | 2Q21 | | | | 3Q21 | | | 4Q21 | |
| Aracruz - Linha A (ES) – 590 kt | | | | | | | | | | | | | | | | | | | | | | | | | | | | | | | | | | | | | | | | | | | | | |
| Aracruz - Linha B (ES) – 830 kt | | | | | | | | | | | | | | | | | | | | | | | | | | | | | | | | | | | | | | | | | | | | | |
| Aracruz - Linha C (ES) – 920 kt | | | | | | | | | | | | | | | | | | | | | | | | | | | | | | | | | | | | | | | | | | | | | |
| Imperatriz (MA)² – 1,650 kt | | | | | | | | | | | | | | | | | | | | | | | | | | | | | | | | | | No downtime | |
| Jacareí (SP) – 1,100 kt | | | | | | | | | | | | | | | | | | | | | | | | | | | | | | | | | | No downtime | |
| Limeira (SP)² – 690 kt | | | | | | | | | | | | | | | | | | | | | | | | | | | | | | | | | | | | | | | | | | | | | |
| Mucuri - Line 1 (BA)² – 580 kt | | | | | | | | | | | | | | | | | | | | | | | | | | | | | | | | | | No downtime | |
| Mucuri - Line 2 (BA) – 1,100 kt | | | | | | | | | | | | | | | | | | | | | | | | | | | | | | | | | | | | | | | | | | | | | |
| Suzano (SP)² – 620 kt | | | | | | | | | | | | | | | | | | | | | | | | | | | | | | | | | | | | | | | | | | | | | |
| Três Lagoas - Linha 1 (MS) – 1,300 kt | | | | | | | | | | | | | | | | | | | | | | | | | | | | | | | | | | No downtime | |
| Três Lagoas - Linha 2 (MS) – 1,950 kt | | | | | | | | | | | | | | | | | | | | | | | | | | | | | | | | | | No downtime | |
| Veracel (BA)¹ – 560 kt | | | | | | | | | | | | | | | | | | | | | | | | | | | | | | | | | | | | | | | | | | | | | |
¹ Veracel is a joint operation between Suzano (50%) and Stora Enso (50%) with total annual capacity of 1,120 thousand tons.
² Includes integrated capacities and fluff.
COST OF GOODS SOLD
| COGS (R$ million) | | | 4Q20 | | | | 4Q19 | | | | ΔY-o-Y | | | | 3Q20 | | | | ΔQ-o-Q | | | | 2020 | | | | 2019 | | | | ΔY-o-Y | |
| COGS | | | 4,884 | | | | 5,810 | | | | -16 | % | | | 4,474 | | | | 9 | % | | | 18,966 | | | | 20,743 | | | | -9 | % |
| Depreciation, depletion and amortization | | | 1,531 | | | | 1,549 | | | | -1 | % | | | 1,399 | | | | 9 | % | | | 5,773 | | | | 7,135 | | | | -19 | % |
| Cash COGS | | | 3,353 | | | | 4,261 | | | | -21 | % | | | 3,076 | | | | 9 | % | | | 13,193 | | | | 13,608 | | | | -3 | % |
| Sales volume | | | 3,017 | | | | 3,288 | | | | -8 | % | | | 2,846 | | | | 6 | % | | | 12,000 | | | | 10,668 | | | | 12 | % |
| Cash COGS/ton (R$/ton) | | | 1,111 | | | | 1,296 | | | | -14 | % | | | 1,081 | | | | 3 | % | | | 1,099 | | | | 1,276 | | | | -14 | % |
¹ Includes amortization of goodwill surplus/loss (PPA)
Cash COGS in 4Q20 totaled R$3,353 million, or R$1,111/ton. Compared to 4Q19, cash COGS declined 21%, mainly due to lower sales volume, the absence of Klabin’s pulp sales, the inventory turnover effect, and due to the non-recurring adjustments that occurred in 4Q19, partially offset by the 31% increase in USD against the BRL. On a per-ton basis, the 14% reduction is also explained by the same factors above.
Compared to 3Q20, cash COGS increased 9% mainly due to higher sales volume (+6%) and higher pulp costs (higher production cost and greater impact of scheduled maintenance downtimes). On a per-ton basis, the indicator was 3% higher than in the previous quarter due to production cost.
SELLING EXPENSES
| Selling expenses (R$ million) | | | 4Q20 | | | | 4Q19 | | | | ΔY-o-Y | | | | 3Q20 | | | | ΔQ-o-Q | | | | 2020 | | | | 2019 | | | | ΔY-o-Y | |
| Selling expenses | | | 590 | | | | 538 | | | | 10 | % | | | 523 | | | | 13 | % | | | 2,175 | | | | 1,905 | | | | 14 | % |
| Depreciation, depletion and amortization1 | | | 205 | | | | 233 | | | | -12 | % | | | 241 | | | | -15 | % | | | 906 | | | | 905 | | | | 0 | % |
| Cash selling expenses | | | 385 | | | | 305 | | | | 26 | % | | | 282 | | | | 37 | % | | | 1,269 | | | | 1,001 | | | | 27 | % |
| Sales volume | | | 3,017 | | | | 3,288 | | | | -8 | % | | | 2,846 | | | | 6 | % | | | 12,000 | | | | 10,668 | | | | 12 | % |
| Cash selling expenses/ton (R$/ton) | | | 128 | | | | 93 | | | | 38 | % | | | 99 | | | | 29 | % | | | 106 | | | | 94 | | | | 13 | % |
¹ Includes amortization of goodwill surplus/loss (PPA)
Cash selling expenses increased 26% from 4Q19, mainly due to the 31% increase in average USD against the BRL, as well as higher logistics expenses arising from sales mix (higher share from North America), partially offset by the reduction in sales volume. On a per-ton basis, cash selling expenses increased 38% mainly due to the effect of exchange rate variation on expenses in foreign currency and sales mix.
When compared to 3Q20, the 37% increase in expenses with cash base sales is mainly explained by the higher logistics service (sales mix with higher share from North America) and higher sales volume. Expenses on cash basis sales per ton increased 29%, due to sales mix.
GENERAL AND ADMINISTRATIVE EXPENSES
General and Administrative Expenses (R$ million) | | | 4Q20 | | | | 4Q19 | | | | ΔY-o-Y | | | | 3Q20 | | | | ΔQ-o-Q | | | | 2020 | | | | 2019 | | | | ΔY-o-Y | |
| General and Administrative Expenses | | | 480 | | | | 286 | | | | 68 | % | | | 313 | | | | 53 | % | | | 1,443 | | | | 1,173 | | | | 23 | % |
| Depreciation, depletion and amortization1 | | | 24 | | | | (7)² | | | | - | | | | 10 | | | | 140 | % | | | 78 | | | | 26 | | | | 199 | % |
| Cash general and administrative expenses | | | 456 | | | | 293 | | | | 56 | % | | | 303 | | | | 51 | % | | | 1,365 | | | | 1,147 | | | | 19 | % |
| Sales volume | | | 3,017 | | | | 3,288 | | | | -8 | % | | | 2,846 | | | | 6 | % | | | 12,000 | | | | 10,668 | | | | 12 | % |
| Cash general and administrative expenses/t (R$/ton) | | | 151 | | | | 89 | | | | 70 | % | | | 106 | | | | 42 | % | | | 114 | | | | 108 | | | | 6 | % |
¹ Includes amortization of goodwill surplus/loss (PPA).
² Inverse effect due to the write-off of PPA on contingencies (write-off of cases initially reassessed in the business combination).
Compared to 4Q19, the 56% increase in cash general and administrative expenses is mainly due to the increase in personnel expenses (variable compensation). The same analysis explains the increase of 70% on a per-ton basis.
Compared to 3Q20, cash general and administrative expenses increased 51% due to higher personnel expenses (variable compensation) and third-party services. On a per-ton basis, the 42% increase is explained by the same factors.
Other operating income (expenses) amounted to an income of R$323 million in 4Q20, compared to an income of R$137 million in 4Q19 and expense of R$4 million in 3Q20. Compared to 4Q19, the variation is mainly explained by the higher result from the adjustment to fair value of biological assets and higher gains from asset divestments. Compared to 3Q20, the variation is mainly explained by the result of the adjustment to fair value of biological assets, which occurs in the second and fourth quarter of each fiscal year, as well as higher gains from asset divestments.
ADJUSTED EBITDA
| Consolidated | | 4Q20 | | | 4Q19 | | | ΔY-o-Y | | | 3Q20 | | | ΔQ-o-Q | | | 2020 | | | 2019 | | | ΔY-o-Y | |
| Adjusted EBITDA (R$ million)¹ | | 3,965 | | | 2,465 | | | 61 | % | | 3,779 | | | 5 | % | | 14,949 | | | 10,724 | | | 39 | % |
| Adjusted EBITDA¹ Margin - ex-Klabin | | 49 | % | | 37 | % | | 13 p.p. | | | 51 | % | | -1 p.p. | | | 49 | % | | 43 | % | | 6 p.p. | |
| Sales Volume ex-Klabin (k ton) | | 3,017 | | | 3,125 | | | -3 | % | | 2,846 | | | 6 | % | | 11,962 | | | 10,130 | | | 18 | % |
| Adjusted EBITDA¹ ex-Klabin/ton (R$/ton) | | 1,314 | | | 789 | | | 67 | % | | 1,328 | | | -1 | % | | 1,250 | | | 1,059 | | | 18 | % |
¹ Excludes non-recurring items and PPA effects.
Adjusted EBITDA in 4Q20 was higher than in 4Q19 due to the increase in average USD against the BRL (+31%) and the decrease in cash COGS, as detailed above. These effects were partially offset by higher SG&A, lower sales volume and the 3% decrease in net pulp price in USD, as explained above. The 67% increase in per-ton EBITDA is explained by exchange variation and lower production costs, which were partially offset by the increase in SG&A and lower pulp price.
Compared to 3Q20, the 5% increase in Adjusted EBITDA was mainly due to the 6% increase in total sales volume and higher net average price of pulp and paper (+1%), which were partially offset by the increase in SG&A. Per-ton adjusted EBITDA remained practically stable.
FINANCIAL INCOME
| Financial Result (R$ million) | | | 4Q20 | | | 4Q19 | | | ΔY-o-Y | | | | 3Q20 | | | | ΔQ-o-Q | | | | 2020 | | | | 2019 | | | | ΔY-o-Y | |
| Financial Expenses | | | (974 | ) | | (1,055 | ) | | -8 | % | | | (1,365 | ) | | | -29 | % | | | (4,459 | ) | | | (4,179 | ) | | | 7 | % |
| Interest on loans and financing (local currency) | | | (169 | ) | | (324 | ) | | -48 | % | | | (171 | ) | | | -1 | % | | | (774 | ) | | | (1,444 | ) | | | -46 | % |
| Interest on loans and financing (foreign currency) | | | (594 | ) | | (557 | ) | | 7 | % | | | (1,007 | ) | | | -41 | % | | | (2,904 | ) | | | (2,140 | ) | | | 36 | % |
| Capitalized interest1 | | | 1 | | | 2 | | | | | | | 2 | | | | | | | | 11 | | | | 4 | | | | | |
| Other financial expenses | | | (212 | ) | | (176 | ) | | 20 | % | | | (190 | ) | | | 11 | % | | | (792 | ) | | | (599 | ) | | | 32 | % |
| Financial Income | | | 66 | | | 100 | | | -34 | % | | | 58 | | | | 13 | % | | | 327 | | | | 493 | | | | -34 | % |
| Interest on financial investments | | | 19 | | | 87 | | | -78 | % | | | 20 | | | | -4 | % | | | 147 | | | | 392 | | | | -63 | % |
| Other financial income | | | 47 | | | 13 | | | 263 | % | | | 39 | | | | 21 | % | | | 181 | | | | 101 | | | | 78 | % |
| Monetary and Exchange Variations | | | 4,464 | | | 1,418 | | | - | | | | (1,645 | ) | | | - | | | | (12,531 | ) | | | (1,965 | ) | | | 538 | % |
| Foreign exchange variations (Debt) | | | 4,850 | | | 1,522 | | | - | | | | (1,851 | ) | | | | | | | (13,365 | ) | | | (1,764 | ) | | | | |
| Other foreign exchange variations | | | (387 | ) | | (104 | ) | | 271 | % | | | 206 | | | | | | | | 835 | | | | (201 | ) | | | | |
| Derivative income (loss), net2 | | | 2,683 | | | 1,161 | | | - | | | | (1,271 | ) | | | | | | | (9,423 | ) | | | (1,075 | ) | | | 776 | % |
| Cash flow hedge | | | 1,331 | | | 474 | | | - | | | | (459 | ) | | | | | | | (3,170 | ) | | | 153 | | | | | |
| Debt hedge | | | 1,430 | | | 731 | | | 96 | % | | | (766 | ) | | | | | | | (6,271 | ) | | | (1,255 | ) | | | 400 | % |
| Others3 | | | (78 | ) | | (44 | ) | | - | | | | (46 | ) | | | 70 | % | | | 17 | | | | 27 | | | | -36 | % |
| Net Financial Result | | | 6,238 | | | 1,624 | | | - | | | | (4,223 | ) | | | - | | | | (26,086 | ) | | | (6,726 | ) | | | - | |
¹ Capitalized interest due to construction in progress.
2 Variation in mark-to-market adjustment (4Q20: -R$6,776 million | 3Q20: -R$10,778 million), plus adjustments paid and received (4Q20 = -R$1,318 million).
³ Includes commodity hedging and embedded derivatives.
Financial expenses totaled R$974 million in 4Q20, down 8% and 29% from 4Q19 and 3Q20, respectively. Compared to 4Q19, apart from the decline in debt indices in the BRL, such as CDI, SELIC and TJLP, there was debts maturing during the course of 2020, the CRAs being the highest one, in the amount of R$2.8 billion, which basically explains the decrease in interest expense in local currency. In relation to the increase in interest rates in foreign currency, the fall in Libor and the reduction in bond interest ended up offset by the appreciation of the average USD vs. BRL. Compared to 3Q20, the reduction was due to the financial expenses in the previous quarter, related to the partial repurchase of Senior Notes 2024, 2025 and 2026 amounting to R$391 million.
Financial income decreased 34% in relation to 4Q19 and increased 13% when compared to 3Q20. The year-on-year comparison, the decrease is due mostly to the reduction in interest rates that remunerate the company’s cash position. In relation to 3Q20, the increase was due to the greater accounting impact of the amortization of surplus value, resulting from the merger of Fibria.
Inflation adjustment and exchange variation had a positive impact of R$4,464 million on the Company’s quarterly financial result due to the appreciation in the closing rate of the BRL against the USD of 8% on the foreign currency portion of debt (80% of total debt). Note that the accounting impact from exchange variation on foreign currency debt has a cash impact only on the respective maturities.
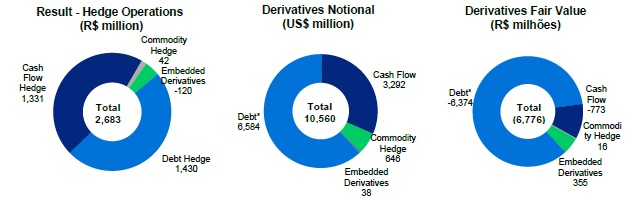
Derivative operations generated an income of R$2,683 million in 4Q20, due to stronger BRL and the volatility of market curves applicable to debt hedge and cash flow transactions. There was also a negative impact caused by the variations in the Pre, Cupom and Libor rate curves on transactions, as a result of the higher instability scenario. The mark-to-market adjustment of derivatives on December 31, 2020 generated a loss of R$6,776 million, compared to a loss of R$10,778 million on September 30, 2020, representing a positive variation of R$4,002 million. Note that the impact of BRL variation vs. the USD on the derivatives portfolio generates a cash impact only upon the respective maturities. The net effect on cash, which refers to the maturity of derivative operations in the fourth quarter, was negative in the amount of R$1,318 million (R$901 million expense from debt hedge and R$394 million expense from operating hedge and R$23 million related to commodities).
Due to the aforementioned factors, net financial income in 4Q20 was R$6,238 million, compared to net financial income of R$1,624 million in 4Q19 and net financial expense of R$4,223 million in 3Q20.
DERIVATIVE OPERATIONS
Suzano carries out derivative operations exclusively for hedging purposes. The following table reflects the position of derivative hedging instruments on December 31, 2020:
| | | Notional (US$ million) | | | | Fair value (R$ million) | |
| Hedge1 | | | Dec/2020 | | | | Sep/2020 | | | | Dec/2020 | | | | Sep/2020 | |
| Debt | | | 6,584 | | | | 6,870 | | | | (6,374 | ) | | | (8,706 | ) |
| Cash Flow | | | 3,292 | | | | 3,535 | | | | (773 | ) | | | (2,497 | ) |
| Others2 | | | 684 | | | | 709 | | | | 371 | | | | 425 | |
| Total | | | 10,560 | | | | 11,114 | | | | (6,776 | ) | | | (10,778 | ) |
| ¹ | Refer to note 4 of the 2020 Financial Statements (DFP) for more details and fair value sensitivity analyses. |
| ² | Includes commodity hedge and embedded derivatives. |
The Company’s financial policy seeks to minimize the volatility of its cash generation and to impart greater flexibility to cash flow management. Currently, the policy stipulates that surplus dollars may be partially hedged (up to 75% of exchange variation exposure over the next 18 months) using plain vanilla instruments, such as Zero Cost Collars (ZCC) and Non-deliverable Forwards (NDF).
ZCC transactions establish minimum and maximum limits for the exchange rate that minimize adverse effects in the event of significant appreciation in the BRL. If the exchange rate is within such limits, the Company neither pays nor receives any financial adjustments. Therefore, the Company is protected in scenarios of extreme BRL appreciation. However, these transactions also limit potential gains in scenarios of extreme BRL depreciation. This characteristic allows for capturing greater benefits from export revenue in a potential scenario of USD appreciation within the range contracted.
On December 31, 2020, the outstanding notional value of operations involving forward USD sales through ZCCs was US$3,212 million, whose maturities are distributed between January 2021 and June 2022, with an average forward rate ranging from R$4.68 to R$5.34. On the same date, the outstanding notional value of operations involving forward USD sales through NDFs was US$80 million, whose maturities are distributed between October 2021 and March 2022 and with an average strike of R$5.36. In 4Q20, cash flow hedge operations resulted in a gain of R$1,331 million. The mark-to-market adjustment (fair value) of ZCC transactions was a loss of R$781 million and for NDFs was a gain of R$8 million at the end of the quarter.
The following table presents a sensitivity analysis of the cash impact that the Company could have on its cash flow hedge portfolio (ZCC and NDF) if the future exchange rate remains the same as that at end of 4Q20 (R$/US$ = 5.20) in the coming quarters; as well as the projected variation in cash impact for each R$0.10 variation on the same reference exchange rate (4Q20). Note that the figures presented in the table are Company projections based on the end-of-period curves and could fluctuate depending on market conditions.
| | | | | | | | | | | | Cash adjustment (R$ million) | |
| Maturity (up to) | | | Strike Range | | | | Notional
(US$ million) | | | | Actual | | | | R$ / US$ = 5.20 (4Q20)² | | | | Sensitivity at R$0.10 / US$ variation (+/-)1 | |
| | | | | | | | Zero Cost Collars | | | | | | | | | |
| 4Q20 | | | - | | | | - | | | | (393 | ) | | | - | | | | - | |
| 1Q21 | | | 4.27 - 4.76 | | | | 736 | | | | - | | | | (397 | ) | | | (74 | ) |
| 2Q21 | | | 4.27 - 4.75 | | | | 840 | | | | - | | | | (468 | ) | | | (84 | ) |
| 3Q21 | | | 4.75 - 5.54 | | | | 617 | | | | - | | | | (120 | ) | | | (62 | ) |
| 4Q21 | | | 5.21 - 6.15 | | | | 568 | | | | - | | | | 48 | | | | (57 | ) |
| 1Q22 | | | 5.37 - 6.11 | | | | 401 | | | | - | | | | 78 | | | | (40 | ) |
| 2Q22 | | | 5.09 - 6.06 | | | | 50 | | | | - | | | | 0 | | | | (5 | ) |
| Total | | | 4.68 – 5.34 | | | | 3,212 | | | | (393 | ) | | | (859 | ) | | | (322 | ) |
| | | | | | | | | | | | | | | | | | | | | |
| NDF |
| 4Q20 | | | - | | | | - | | | | (1 | ) | | | - | | | | - | |
| 1Q21 | | | - | | | | - | | | | - | | | | - | | | | 0 | |
| 2Q21 | | | - | | | | - | | | | - | | | | - | | | | (5 | ) |
| 3Q21 | | | 5.33 | | | | 50 | | | | - | | | | 7 | | | | 0 | |
| 4Q21 | | | - | | | | - | | | | - | | | | - | | | | (3 | ) |
| 1Q22 | | | 5.42 | | | | 30 | | | | - | | | | 7 | | | | 0 | |
| 2Q22 | | | - | | | | - | | | | - | | | | - | | | | 0 | |
| Total | | | 5.36 | | | | 80 | | | | (1 | ) | | | 14 | | | | (8 | ) |
¹ Note: sensitivity of adjustments for foreign exchange levels above maximum value of the strike.
² To calculate the mark-to-market adjustment, the PTAX rate of the penultimate business day for the period under analysis.
The Company also uses currency and interest rate swaps to mitigate the effects from exchange and interest rate variations on the balance of its debt and on its cash flow. Contracts swapping different interest rates and inflation indexes may be entered as a way to mitigate the mismatch between financial assets and liabilities.
On December 31, 2020, the Company held US$6,584 million (notional value) in swaps, distributed as shown in the table below. In 4Q20, the result of liability hedge transactions was a gain of R$1,430 million, mainly due to BRL appreciation in the period. The mark-to-market (fair value) of such operations was negative by R$6,374 million at the end of the quarter.
| | | | | | | | | | | | Notional (US$ million) | | | | Fair value (R$ million) | |
| Debt Hedge | | | Maturity (up to) | | | | Currency | | | | Dec/2020 | | | | Sep/2020 | | | | Dec/2020 | | | | Sep/2020 | |
| Swap (PRÉ x USD) | | | 2024 | | | | USD | | | | 350 | | | | 350 | | | | (508 | ) | | | (719 | ) |
| Swap (CDI x USD) | | | 2026 | | | | USD | | | | 2,267 | | | | 2,567 | | | | (4,977 | ) | | | (6,792 | ) |
| Swap (IPCA x USD) | | | 2023 | | | | USD | | | | 121 | | | | 121 | | | | (115 | ) | | | (195 | ) |
| Swap (LIBOR x USD) | | | 2026 | | | | USD | | | | 3,683 | | | | 3,683 | | | | (1,059 | ) | | | (1,252 | ) |
| Swap (IPCA x CDI) | | | 2023 | | | | BRL | | | | 162¹ | | | | 149 | | | | 286 | | | | 252 | |
| Total | | | | | | | | | | | 6,584 | | | | 6,870 | | | | (6,374 | ) | | | (8,706 | ) |
¹ Translated at the closing exchange rate (5.20).
The following table presents a sensitivity analysis of the cash impact that the Company could have on its liability hedge portfolio (swaps) if the future exchange rate remains the same as that at the end of 4Q20 (R$/US$ = 5.20) in the coming quarters; as well as the projected variation in cash impact for each R$ 0.10 variation on the same reference exchange rate (4Q20). Note that the figures presented in the table are Company projections based on the end-of-period curves and could fluctuate depending on market conditions.
| | | | | | | | Cash adjustment (R$ million) | |
| Maturity (up to) | | | Notional
(US$
million) | | | | Actual | | | | R$ / US$ = 5.20 (4Q20) | | | | Sensitivity at
R$0.10 / US$
variation (+/-)1 | |
| 4Q20 | | | | | | | (901 | ) | | | | | | | | |
| 2021 | | | 333 | | | | - | | | | (685 | ) | | | (21 | ) |
| 2022 | | | 737 | | | | - | | | | (1,016 | ) | | | (60 | ) |
| 2023 | | | 2,180 | | | | - | | | | (454 | ) | | | (50 | ) |
| 2024 | | | 1,331 | | | | - | | | | (489 | ) | | | (46 | ) |
| 2025 | | | 1,156 | | | | - | | | | (1,157 | ) | | | (90 | ) |
| >2026 | | | 845 | | | | - | | | | (1,151 | ) | | | (83 | ) |
| Total | | | 6,584 | | | | (901 | ) | | | (4,951 | ) | | | (350 | ) |
¹ Sensitivity analysis considers variation only in the exchange rate (R$/US$), while other variables are presumed constant.
Other transactions involving the Company’s derivatives are related to the embedded derivative resulting from the forestry partnerships and commodity hedges (maritime fuel), as follows.
| | | | | | | | Notional
(US$ million) | | | | Fair value
(R$ million) | | | | Cash adjustment
(R$ million) | |
| Other hedges | | Maturity
(up to) | | Index | | | Dec/2020 | | | | Sep/2020 | | | | Dec/2020 | | | | Sep/2020 | | | | 4Q20 | | | | 3Q20 | |
| Embedded derivative | | 2035 | | Fixed USD | USD US-CPI | | | 646 | | | | 646 | | | | 355 | | | | 474 | | | | - | | | | - | |
| Commodities | | 2021 | | Brent/VLSFO | | | 38 | | | | 63 | | | | 16 | | | | (49 | ) | | | (23 | ) | | | (25 | ) |
| Total | | | | | | | 684 | | | | 709 | | | | 371 | | | | 425 | | | | (23 | ) | | | (25 | ) |
Forestry partnership agreements and timber supply agreements signed on December 30, 2013 by Fibria Celulose S.A. are denominated in USD per cubic meter of standing timber, adjusted by U.S. inflation measured by the Consumer Price Index (CPI), which is not related to inflation in the economic environment where the forests are located and, hence, constitutes an embedded derivative. This instrument, which is presented in the table above, consists of a swap contract with the short leg consisting of the variations in the US-CPI during the period of the agreements mentioned below. See note 4 of the 4Q20 Financial Statements for more details and for a sensitivity analysis of the fair value in case of a sharp rise in the U.S. CPI. On December 31, 2020, the outstanding (notional) value of the operation was US$646 million. The result from the swap in 4Q20 was a loss of R$120 million. The mark-to-market adjustment (fair value) of such operations generated a gain of R$355 million at the end of the quarter.
The Company is also exposed to international oil prices, which is reflected in the logistics costs involved in exports. In this case, the Company analyzes the contracting of derivative financial instruments to hedge the price of maritime fuel.
On December 30, 2020, the outstanding (notional) value of the operation was US$38 million. The result from this swap in 4Q20 was a gain of R$42 million. The mark-to-market (fair value) adjustment of these operations generated a gain of R$16 million at the end of the quarter.
* Debt in BRL translated into USD at the closing exchange rate of the month (R$/US$5.20 on 12/31/2020).
NET INCOME (LOSS)
In 4Q20 the Company posted net income of R$5,914 million, compared to net income of R$1,175 million in 4Q19 and a net loss of R$1,158 million in 3Q20. The growth in relation to 4Q19 is due to better financial result which, in turn, is due to the effects from exchange variation on debt and the results from derivative transactions, as well as higher operating income. Compared to 3Q20, the increase of R$7,072 million in net income mainly reflects the growth in financial income (positive exchange variation on debt and derivatives).
DEBT
| Debt (R$ million) | | 12/31/2020 | | | 12/31/2019 | | | Δ Y-o-Y | | | 09/30/2020 | | | Δ Q-o-Q | |
| Local Currency | | | 14,740 | | | | 18,185 | | | | -19 | % | | | 16,359 | | | | -10 | % |
| Short Term | | | 541 | | | | 3,563 | | | | -85 | % | | | 1,651 | | | | -67 | % |
| Long Term | | | 14,199 | | | | 14,622 | | | | -3 | % | | | 14,709 | | | | -3 | % |
| Foreign Currency | | | 58,160 | | | | 45,500 | | | | 28 | % | | | 62,131 | | | | -6 | % |
| Short Term | | | 1,503 | | | | 2,665 | | | | -44 | % | | | 2,673 | | | | -44 | % |
| Long Term | | | 56,657 | | | | 42,835 | | | | 32 | % | | | 59,458 | | | | -5 | % |
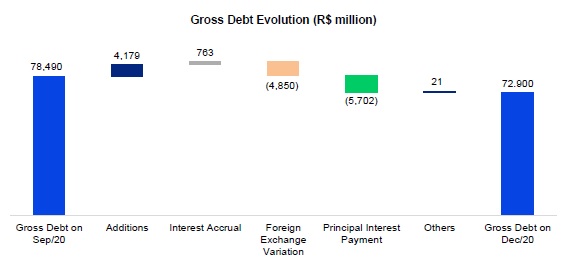
| Gross Debt | | | 72,900 | | | | 63,685 | | | | 14 | % | | | 78,490 | | | | -7 | % |
| (-) Cash | | | 9,232 | | | | 9,579 | | | | -4 | % | | | 9,758 | | | | -5 | % |
| Net debt | | | 63,668 | | | | 54,106 | | | | 18 | % | | | 68,731 | | | | -7 | % |
| Net debt/Adjusted EBITDA1(x) - R$ | | | 4.3 | x | | | 5.0 | x | | | -0.7 | x | | | 5.1 | x | | | -0.8 | x |
| Net debt/Adjusted EBITDA1(x) - US$ | | | 4.3 | x | | | 4.9 | x | | | -0.6 | x | | | 4.4 | x | | | -0.1 | x |
¹ Excluding non-recurring items.
On December 31, 2020, gross debt was R$72.9 billion, composed of 97% long-term maturities and 3% short-term maturities. Debt denominated in foreign currency accounted for 80% of the Company's total debt, while debt denominated in local currency accounted for the remaining 20%. The percentage of gross debt denominated in foreign currency, considering the effect of debt hedge, was 95%. Gross debt declined 7% from 3Q20 (R$5.6 billion) due to settlements related to Liability Management and the effect of exchange variation on debt in the period.
Suzano contracts debt in foreign currency debt as a natural hedge, since net operating cash generation is denominated in foreign currency (U.S. dollar) due to its predominant status as an exporter. This structural exposure allows the Company to match loans and financing payments in USD with receivable flows from sales.
*Corresponding mainly to transaction costs (issue, funding etc.) and impacts from surplus value resulting from the operation with Fibria.
On December 31, 2020, the average cost of debt in U.S. dollar was 4.5% p.a. (considering debt in BRL adjusted by the market swap curve) as against 4.5% p.a. on September 30, 2020. The average term of consolidated debt at the end of the year was 86 months (84 months in September 2020).
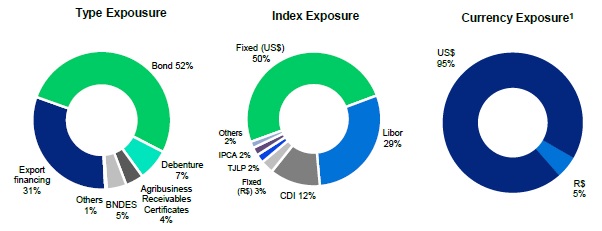
¹ Considers the portion of debt with currency swaps. The original debt was 80% denominated in USD and 20% in BRL.
Cash and cash equivalents on December 31, 2020 were R$9,232 million, 70% of which were invested in foreign currency in fixed-income and short-term investments, and the portion in local currency was invested in government and fixed-income bonds, remunerated at a percentage of the DI rate.
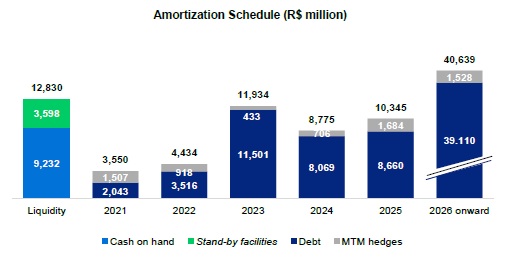
The company has two standby untapped credit facilities totaling R$3,598 million – one in Brazilian real for R$1 billion and available until 2021 and another for US$500 million available until 2024. These facilities help improve the company's liquidity position and can be withdrawn during times of uncertainty, such as during the first half of the year, when the COVID-19 pandemic broke out. As a result, the current cash position of R$9,232 million plus the facilities described above amount to a readily available cash position of R$12,830 million.
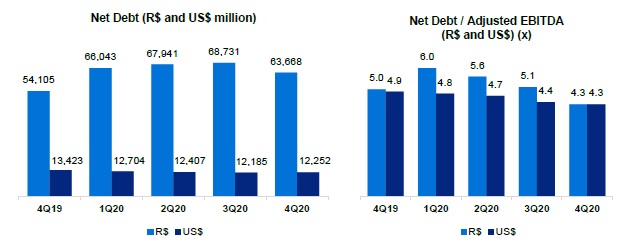
On December 31, 2020, net debt stood at R$63.7 billion (US$12.3 billion), compared to R$68.7 billion (US$12.2 billion) on September 30, 2020. The biggest impact on net debt in local currency came from the exchange variation during the period.
The ratio of net debt to Adjusted EBITDA in BRL stood at 4.3x on December 31, 2020 (vs. 5.1x in 4Q19). The same ratio in USD (a measure established in Suzano’s financial policy) fell to 4.3x on December 31, 2020 (vs. 4.4x in 3Q20).
The breakdown of gross debt between trade and non-trade finance on December 31, 2020 is shown below:
| | | 2021 | | | 2022 | | | 2023 | | | 2024 | | | 2025 | | | 2026 onwards | | | Total | |
| Trade Finance¹ | | | 40 | % | | | 45 | % | | | 83 | % | | | 73 | % | | | 45 | % | | | 3 | % | | | 31 | % |
| Non-Trade Finance² | | | 60 | % | | | 55 | % | | | 17 | % | | | 27 | % | | | 55 | % | | | 97 | % | | | 69 | % |
¹ ACC, ACE, NCE, PPE
² Bonds, BNDES, CRA, Debentures, among others.
CAPITAL EXPENDITURE
In 4Q20, capital expenditure (cash basis) totaled R$1,173 million, down 15% from the same period in 2019, mainly due to lower expenses with land, forests and port terminals (lower spending on the Vértere project), partially offset by higher industrial maintenance expenses and the 31% increase in USD against the BRL. Compared to 3Q20, capex remained stable, with higher maintenance expenses, which were offset by lower investment in land and forests.
Capex 2020 remained in line with the guidance previously disclosed by the Company. For 2021, the Management approved a Capital Budget of R$4.9 billion, with R$4.0 billion allocated to industrial and forest maintenance.
| Investments (R$ million) | | 4Q20 | | | 4Q19 | | | Δ Y-o-Y | | | 3Q20 | | | Δ Q-o-Q | | | 2020 | | | 2019 | | | Δ Y-o-Y | | | Guidance 2021 | |
| Maintenance | | 984 | | | 925 | | | 6 | % | | 924 | | | 6 | % | | 3,406 | | | 3,661 | | | -7 | % | | 4,038 | |
| Industrial maintenance | | 271 | | | 177 | | | 53 | % | | 149 | | | 82 | % | | 608 | | | 711 | | | -15 | % | | 829 | |
| Forestry maintenance | | 686 | | | 703 | | | -3 | % | | 745 | | | -8 | % | | 2,716 | | | 2,815 | | | -4 | % | | 3,076 | |
| Others | | 28 | | | 44 | | | -38 | % | | 31 | | | -10 | % | | 83 | | | 135 | | | -39 | % | | 133 | |
| Expansion and modernization | | 80 | | | 92 | | | -14 | % | | 55 | | | 44 | % | | 242 | | | 287 | | | -15 | % | | 240 | |
| Land and forestry | | 70 | | | 130 | | | -46 | % | | 152 | | | -54 | % | | 365 | | | 868 | | | -58 | % | | 426 | |
| Port terminals | | 17 | | | 106 | | | -84 | % | | 25 | | | -32 | % | | 120 | | | 369 | | | -67 | % | | 152 | |
| Others | | 22 | | | 127 | | | -83 | % | | 11 | | | 111 | % | | 91 | | | 594 | | | -85 | % | | 79 | |
| Total | | 1,173 | | | 1,380 | | | -15 | % | | 1,167 | | | 0 | % | | 4,225 | | | 5,778 | | | -27 | % | | 4,935 | |
OPERATING CASH GENERATION
| (R$ million) | | 4Q20 | | | 4Q19 | | | Δ Y-o-Y | | | 3Q20 | | | Δ Q-o-Q | | | 2020 | | | 2019 | | | Δ Y-o-Y | |
| Adjusted EBITDA1 | | 3,965 | | | 2,465 | | | 61 | % | | 3,779 | | | 5 | % | | 14,949 | | | 10,724 | | | 39 | % |
| Maintenance Capex2 | | (984 | ) | | (925 | ) | | 6 | % | | (924 | ) | | 6 | % | | (3,406 | ) | | (3,661 | ) | | -7 | % |
| Operating Cash Flow | | 2,981 | | | 1,540 | | | 93 | % | | 2,854 | | | 4 | % | | 11,543 | | | 7,063 | | | 63 | % |
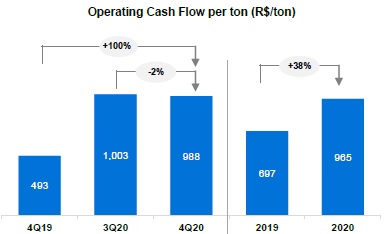
| Operating Cash Flow (R$/ton) | | 988 | | | 493 | | | 100 | % | | 1,003 | | | -2 | % | | 965 | | | 697 | | | 38 | % |
1 Excludes non-recurring items and PPA effects.
2 Cash basis.
3 Excludes sales volume from Klabin.
Operating cash generation, measured by Adjusted EBITDA less sustaining capex (cash basis), amounted to R$2,981 million in 4Q20. The 93% increase from 4Q19 reflects the higher EBITDA, as explained above, which was partially offset by the increase in sustaining capex. The increase in operating cash generation per ton compared to 4Q19 is related to EBITDA growth per ton. The 4% increase in relation to 3Q20 is related to the increase in EBITDA mentioned earlier, partially offset by higher sustaining capex. On a per-ton basis, the 2% decrease is due to the lower adjusted EBITDA per ton.
FREE CASH FLOW
| Free Cash Flow (R$ million) | | 4Q20 | | | 4Q19 | | | Δ Y-o-Y | | | 3Q20 | | | Δ Q-o-Q | | | 2020 | | | 2019 | | | Δ Y-o-Y | |
| Adjusted EBITDA | | 3,965 | | | 2,465 | | | 61 | % | | 3,779 | | | 5 | % | | 14,949 | | | 10,724 | | | 39 | % |
| (-) Total Capex¹ | | (1,710 | ) | | (1,124 | ) | | 52 | % | | (1,226 | ) | | 39 | % | | (4,898 | ) | | (4,868 | ) | | 1 | % |
| (+/-) D Working capital | | 717 | | | (514 | ) | | - | | | 1,290 | | | - | | | 2,264 | | | 468 | | | 383 | % |
| (-) Net interest | | (321 | ) | | (592 | ) | | -46 | % | | (1,560 | ) | | -79 | % | | (3,436 | ) | | (2,600 | ) | | 32 | % |
| (-) Income taxes | | (58 | ) | | (55 | ) | | 5 | % | | (67 | ) | | -14 | % | | (188 | ) | | (392 | ) | | -52 | % |
| (-) Dividend payment | | - | | | (5 | ) | | - | | | - | | | - | | | - | | | (607 | ) | | - | |
| Free cash flow | | 2.592 | | | 175 | | | - | | | 2,215 | | | 17 | % | | 8,690 | | | 2,725 | | | 219 | % |
| (+) Capex ex-maintenance | | 259 | | | 216 | | | 20 | % | | 163 | | | 76 | % | | 784 | | | 1,418 | | | -45 | % |
| (+) Dividend payment | | - | | | 5 | | | - | | | 0 | | | - | | | 0 | | | 607 | | | - | |
| Free cash flow - Adjusted | | 2.851 | | | 396 | | | 620 | % | | 2,378 | | | 21 | % | | 9,474 | | | 4,749 | | | 99 | % |
| (-) Derivative cash adjustment | | (1,318 | ) | | (79 | ) | | - | | | (1,313 | ) | | 0 | % | | (4,466 | ) | | (135 | ) | | - | |
| Free cash flow - Adjusted - after derivatives | | 1,533 | | | 317 | | | 384 | % | | 1,065 | | | 46 | % | | 5,009 | | | 4,614 | | | 9 | % |
1 On an accrual basis.
2 Free cash flow prior to dividend payments and capex ex-maintenance (accrual basis).
Free cash flow considering the adjustment for derivatives stood at R$1,533 million in 4Q20, compared to R$317 million in 4Q19 and R$1,050 million in 3Q20. The year-on-year increase was mainly due to higher adjusted EBITDA and the positive variation of working capital (notably for the taxes recoverable and accounts payable lines) and reduction of net interest, partially offset by the higher loss on derivative operations and higher sustaining capex.
Compared to 3Q20, the 46% increase was due to the significant decline in interest payments (lower concentration of bond payments and payments related to the partial repurchase of Senior Notes 2024, 2025 and 2026 in the previous quarter) and the 5% growth in Adjusted EBITDA. These effects were partially offset by the negative variation in working capital (especially in the accounts receivable line, which was impacted by the drop in volume sold and the lower pulp price in 3Q20) and higher sustaining capex. As for working capital, it is worth highlighting the decrease in accounts receivable caused by higher sales volume.
COVID-19
Suzano has been taking preventive and mitigatory measures aligned with the guidelines established by Brazilian and international health authorities to minimize the impacts from the COVID-19 pandemic regarding people safety and the continuity of its businesses.
The Company’s actions are based on three pillars: (1) People; (2) Society; (3) Business Continuity.
| (1) | People: to ensure the safety of its employees and contractors, Suzano adopted a series of measures and procedures to mitigate their exposure to the new coronavirus. The measures to protect people include the Company’s decision to maintain all direct jobs and to pay in advance 50% of the 13th salary bonus to all employees. |
| (2) | Society: Suzano understands its responsibility at this time to the communities in which it operates, guided by its culture driver “It’s only good for us if it’s good for the world.” Accordingly, from the onset of the outbreak to the present date, the Company has adopted a series of measures to protect society, including: |
| · | Donation of toilet paper, napkins and disposable diapers made by the Company to needy communities. |
| · | Donation of 159 ventilators and 1 million medical masks to federal and state governments. |
| · | Participation in the joint effort with Positivo Tecnologia, Klabin, Flextronics and Embraer to support the Brazilian company Magnamed in manufacturing ventilators, which were delivered to the Brazilian government. Suzano invested R$9 million in this action. |
| · | Construction of a field hospital in Teixeira de Freitas, Bahia, jointly with Veracel, which has already been delivered to the state government and was inaugurated in July 2020. |
| · | Partnership with the FATEC vocational school in Capão Bonito to produce hand sanitizer. |
| · | Forklifts lent to transport the donations received by the Red Cross. |
| · | Maintenance of all direct jobs. |
| · | Ensuring for 90 days (until end-June 2020) the payment of 100% of the payroll expenses of the workers of service providers whose operations were suspended because of the pandemic, in order to protect jobs. |
| · | Creation of a support program for small suppliers, a social program to help small farmers sell their products via a home delivery system in 38 communities assisted by Suzano’s Rural Land Development Program (“PDRT”) in 5 states, and a social program for producing 125,000 masks in local communities for donation in 5 states. |
| · | Launch of a support program for small and midsized paper clients called “We’re Together” to ensure that these companies have the financial and managerial capacity to resume operations. |
Expenditures to support the social actions implemented by Suzano totaled R$49 million as of December 31, 2020. Also, important noting is that another R$136 million was spent to adapt our operations to the current scenario of combating the coronavirus (see note 30 - Result by Nature of Financial Statements).
| (3) | Business continuity: to date, the company is maintaining its operations normally and has set up a crisis management committee that continues functioning. |
The pulp and paper industry was recognized by the World Health Organization (WHO) and diverse countries as a producer of essential goods for society. Hence, to meet the responsibility arising from the essential nature of its business, Suzano took measures to ensure, to the maximum extent possible, that it maintains its operations normally and meets its clients’ requirements by increasing the level of wood and raw material inventories at plants and expanding its finished product inventory, besides reaching out to its clients to minimize any risks of stockout at plants along the logistics chain and guarantee the sale of their products.
The current scenario arising from the novel coronavirus also implies higher credit risk, especially among its paper clients. Therefore, the Company has been monitoring this risk and implementing measures to mitigate it. To date, there have been no significant financial impacts.
Due to the physical distancing measures adopted in Brazil and many other countries that entail, for instance, the closure of schools and offices, demand for printing & writing paper has decreased. In light of this scenario, and as announced by various paper producers around the world, Suzano decided to temporarily reduce the volume of its paper production. As previously disclosed in the quarterly financial statements for the period ended March 31, 2020, the Company temporarily shut down its paper production lines at the Mucuri and Rio Verde Mills. However, operations resumed at these mills in early July 2020.
Lastly, it is important to mention that in light of the current scenario, the Company has undertaken and maintained intensive communication efforts to further increase interactions with its main stakeholders in order to ensure adequate transparency and flow of information with them in a timely manner aligned with the current social and economic situation. All key updates on its measures and activities in the context of COVID-19 are available on the Company’s Investor Relations website.
The Company has also created a webpage with information on all its actions related to COVID-19: https://www.suzanocontraocoronavirus.com.br
ESG
The 4Q20 results reaffirm the advances made by Suzano on its ESG agenda, referring to the more active participation in external evaluation processes from 2020 onwards. In November, the company was included in the select 2020-2021 portfolio of the Dow Jones Sustainability Emerging Markets Index (DJSI Emerging Markets). Apart from Suzano, only 10 other Brazilian companies have been included in the new portfolios underlying the DJSI indices.
In November, Suzano informed its shareholders and the market in general that the additional issue of debt securities was launched and priced under the scope of “3.750% Senior Notes due 2031” (Sustainability-Linked Bonds - SLB), in the principal amount of US$500 million with a yield of 3.100% per year (one of the lowest rates in Suzano's history in foreign borrowings) and a coupon of 3.750% per year, to be paid semi-annually, as of January 15, 2021, and maturing in January 15, 2031. The Notes have an environmental performance indicator (KPI) associated with a goal of reducing the intensity of greenhouse gas (GHG) emissions by the Company by 2025, evidencing Suzano's commitment as part of the solution to the global climate crisis and in convergence to the implementation of its Long Term 2030 emission reduction target published this year.
In early December, Suzano had also been included in the portfolio of the Corporate Sustainability Index of B3 in 2021. ISE tracks the performance of listed corporations based on the aspects of corporate sustainability, social justice, environmental balance and corporate governance. The portfolio announced consists of 46 stocks of 39 companies and is valid from January 4 to December 30, 2021.
In December, Suzano was also B rated in the Climate, Water and Forests questionnaires prepared by CDP, a non-profit organization considered a global reference in environmental impact reporting and management. CDP’s assessment considers the scope of disclosure, awareness and management of environmental risks, as well as implementation of best practices related to environmental leadership.
These results underscore the company’s relentless commitment to generating value sustainably in the long term besides demonstrating the integration and company-wide inclusion of the ESG agenda in Suzano’s business model.
SYNERGIES
In 2020, the Company concluded the curve of capture of operating synergies arising from the business combination with Fibria Celulose S.A. The synergies captured, on a recurring basis from 2021, exceeded plans, totaling R$1,317 million per year (before taxes) through reductions in costs, expenses and capex in the supplies, forestry, industrial, logistics, sales, administrative and personnel areas. As for tax synergies, the company maintains the perspective of achieving deductions of around R$2.0 billion a year.
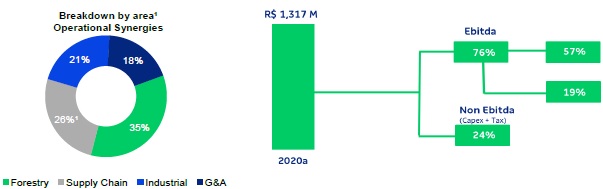
1Does not include tax synergies. Supply Chain includes logistical / commercial synergies.
The estimated amount of operating synergies includes the costs of implementing the initiatives linked to these synergies, which totaled R$60 million, therefore, below the R$200 million previously estimated by the Company.
TOTAL OPERATIONAL EXPENDITURE - PULP
As disclosed through a Material Fact notice on February 13, 2020, the estimated total operating expenditure in 2024 remains at approximately R$1,300/t, and the trend for the indicator remains as planned, considering the exchange and monetary assumptions used.
EVENTS AFTER THE REPORTING PERIOD
Conclusion of Sale of Land and Forests
On January 5, 2021, the Company announced to its shareholders and the market that it concluded the transaction with Bracell SP Celulose Ltda. and Turvinho Participações Ltda., disclosed by it through a Notice to the Market on November 20, 2020, receiving the purchase price of R$1,056 million pursuant to the agreement for the Purchase and Sale of Timber, Commitment to Purchase and Sale of Rural Properties and Other Covenants, with the condition precedent signed by the parties.
The transaction is aligned with the Company’s deleveraging plan announced to the market and underscores the financial discipline adopted by Suzano in implementing its Debt Policy.
Early Debt Settlement
On February 9, 2021, the Company prepaid a financing contract with BNDES, in the principal amount of R$ 1,454 million, with original maturity in May 2026 and monthly interest rate indexed to SELIC + 3% p.a. and TJLP + 2% and transaction cost in the amount of R$30 million.
CAPITAL MARKETS
On October 6, 2020, the Company informed its shareholders and the market in general the closing of the public offering for the secondary distribution of 150,217,425 shares issued by Suzano and held by BNDES Participações SA - BNDESPAR, including 13,180,000 Shares in the form of American Depositary Shares (“ADSs”), at a price per share of R$46.00, totaling R$6.9 billion.
On December 31, 2020, Suzano’s stock was quoted at R$58.54/share (SUZB3) and US$11.18/share (SUZ). The Company’s stock is listed on the Novo Mercado, the listing segment of the São Paulo Stock Exchange (B3 – Brasil, Bolsa e Balcão) with the highest corporate governance standards, and on the New York Stock Exchange (NYSE) - Level II.
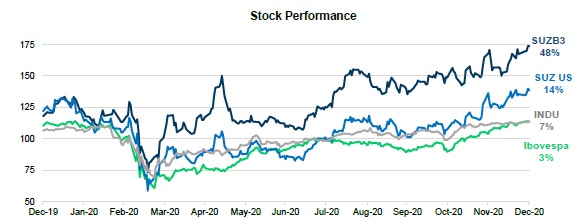
Source: Bloomberg.
Source: Bloomberg.
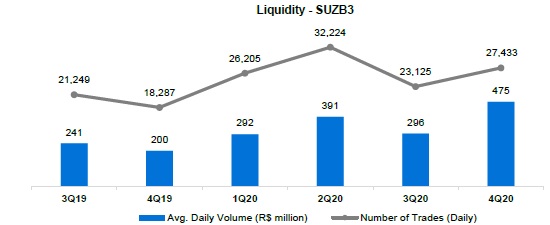
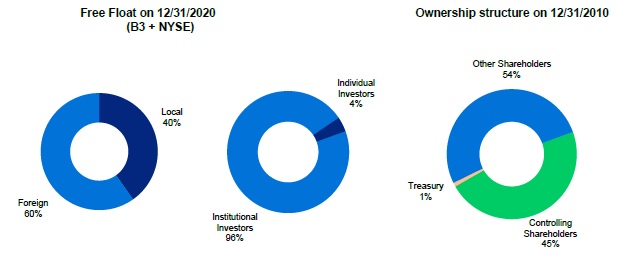
On December 31, 2020, the Company's share capital was represented by 1,361,263,584 common shares, of which 12,042,004 were held in Treasury. Suzano’s market capitalization stood at R$79.0 billion on December 31, 2020. In 4Q20, free float corresponded to 53% of the total capital.
FIXED INCOME
| | | Unity | | | Dec/20 | | | Sep/20 | | | Dec/19 | | | Δ Y-o-Y | | | Δ Q-o-Q | |
| Suzano 2021 – Price | | | USD/k | | | | - | | | | - | | | | 103.59 | | | | - | | | | - | |
| Suzano 2021 – Yield | | | % | | | | - | | | | - | | | | 2.41 | | | | - | | | | - | |
| Fibria 2024 – Price | | | USD/k | | | | 110.47 | | | | 110.29 | | | | 108.45 | | | | 1.9 | % | | | 0.2 | % |
| Fibria 2024 – Yield | | | % | | | | 2.01 | | | | 2.27 | | | | 3.16 | | | | -36.5 | % | | | -11.4 | % |
| Fibria 2025 – Price | | | USD/k | | | | 107.46 | | | | 106.24 | | | | 103.59 | | | | 3.7 | % | | | 1.1 | % |
| Fibria 2025 – Yield | | | % | | | | 2.06 | | | | 2.46 | | | | 3.22 | | | | -36.1 | % | | | -16.1 | % |
| Suzano 2026 – Price | | | USD/k | | | | 117.63 | | | | 114.58 | | | | 112.02 | | | | 5.0 | % | | | 2.7 | % |
| Suzano 2026 – Yield | | | % | | | | 2.33 | | | | 2.99 | | | | 3.66 | | | | -36.4 | % | | | -21.9 | % |
| Fibria 2027 – Price | | | USD/k | | | | 114.48 | | | | 113.39 | | | | 109.64 | | | | 4.4 | % | | | 1.0 | % |
| Fibria 2027 – Yield | | | % | | | | 2.87 | | | | 3.14 | | | | 3.92 | | | | -26.8 | % | | | -8.5 | % |
| Suzano 2029 – Price | | | USD/k | | | | 120.44 | | | | 114.10 | | | | 111.01 | | | | 8.5 | % | | | 5.6 | % |
| Suzano 2029 – Yield | | | % | | | | 3.10 | | | | 3.98 | | | | 4.50 | | | | -31.1 | % | | | -22.1 | % |
| Suzano 2030 – Price | | | USD/k | | | | 113.78 | | | | 107.97 | | | | 102.57 | | | | 10.9 | % | | | 5.4 | % |
| Suzano 2030 – Yield | | | % | | | | 3.23 | | | | 3.97 | | | | 4.68 | | | | -31.0 | % | | | -18.6 | % |
| Suzano 2031 – Price | | | USD/k | | | | 106.68 | | | | 100.31 | | | | - | | | | - | | | | 6.3 | % |
| Suzano 2031 – Yield | | | % | | | | 2.98 | | | | 3.71 | | | | - | | | | - | | | | -19.9 | % |
| Suzano 2047 – Price | | | USD/k | | | | 134.32 | | | | 118.48 | | | | 117.66 | | | | 14.2 | % | | | 13.4 | % |
| Suzano 2047 – Yield | | | % | | | | 4.71 | | | | 5.65 | | | | 5.71 | | | | -17.6 | % | | | -16.6 | % |
| Treasury 10 years | | | % | | | | 0.91 | | | | 0.69 | | | | 1.92 | | | | -52.4 | % | | | 33.3 | % |
Note: Senior Notes issued with face value of 100 USD/k
RATINGS
| Agency | | National Scale | | Global Scale | | | Outlook | |
| Fitch Ratings | | AAA | | BBB- | | | Negative | |
| Standard & Poor’s | | brAAA | | BBB- | | | Negative | |
| Moody’s | | Aaa.br | | Ba1 | | | Stable | |
UPCOMING EVENTS
Earnings Conference Call (4Q20)
Date: February 11, 2021 (Friday)
| Portuguese (simultaneous translation) | English |
| 10:00 a.m. (Brasília) | 10:00 a.m. (Brasília) |
| 8:00 a.m. (New York) | 8:00 a.m. (New York) |
| 1:00 p.m. (London) | 1:00 p.m. (London) |
| Tel: +55 (11) 3181-8565 | Tel: +1 412 717-9627 |
Please connect 10 minutes before the conference call is scheduled to begin.
The conference call will be held in English and feature a presentation, with a simultaneous webcast. The access links will be available on the Company’s Investor Relations website (www.suzano.com.br/ir).
If you are unable to participate, the webcast link will be available for future consultation on the Investor Relations website of Suzano S.A.
IR CONTACTS
Marcelo Bacci
Camila Nogueira
Camilla Galvão
Mariana Dutra
Roberto Costa
Tel.: +55 (11) 3503-9330
ri@suzano.com.br
www.suzano.com.br/ir
APPENDICES
APPENDIX 1 - Operating Data
Revenue
breakdown
(R$ '000) | | | 4Q20 | | | | 4Q19 | | | | ΔY-o-Y | | | | 3Q20 | | | | ΔQ-o-Q | | | | 2020 | | | | 2019 | | | | ΔY-o-Y | |
| Exports | | | 6,489,970 | | | | 5,632,705 | | | | 15 | % | | | 6,140,197 | | | | 6 | % | | | 25,492,642 | | | | 20,698,735 | | | | 23 | % |
| Pulp | | | 6,093,525 | | | | 5,229,916 | | | | 17 | % | | | 5,753,923 | | | | 6 | % | | | 23,968,816 | | | | 19,193,750 | | | | 25 | % |
| Paper | | | 396,445 | | | | 402,789 | | | | -2 | % | | | 386,274 | | | | 3 | % | | | 1,523,826 | | | | 1,504,985 | | | | 1 | % |
| Domestic Market | | | 1,523,006 | | | | 1,416,255 | | | | 8 | % | | | 1,330,638 | | | | 14 | % | | | 4,967,635 | | | | 5,314,215 | | | | -7 | % |
| Pulp | | | 453,450 | | | | 401,800 | | | | 13 | % | | | 414,431 | | | | 9 | % | | | 1,609,449 | | | | 1,833,936 | | | | -12 | % |
| Paper | | | 1,069,556 | | | | 1,014,455 | | | | 5 | % | | | 916,207 | | | | 17 | % | | | 3,358,186 | | | | 3,480,279 | | | | -4 | % |
| Total Net Revenue | | | 8,012,976 | | | | 7,048,960 | | | | 14 | % | | | 7,470,835 | | | | 7 | % | | | 30,460,277 | | | | 26,012,950 | | | | 17 | % |
| Pulp | | | 6,546,975 | | | | 5,631,716 | | | | 16 | % | | | 6,168,354 | | | | 6 | % | | | 25,578,265 | | | | 21,027,686 | | | | 22 | % |
| Paper | | | 1,466,001 | | | | 1,417,244 | | | | 3 | % | | | 1,302,481 | | | | 13 | % | | | 4,882,012 | | | | 4,985,264 | | | | -2 | % |
| Sales volume (‘000) | | | 4Q20 | | | | 4Q19 | | | | ΔY-o-Y | | | | 3Q20 | | | | ΔQ-o-Q | | | | 2020 | | | | 2019 | | | | ΔY-o-Y | |
| Exports | | | 2,556,991 | | | | 2,810,850 | | | | -9 | % | | | 2,432,865 | | | | 5 | % | | | 10,411,557 | | | | 8,983,744 | | | | 16 | % |
| Pulp | | | 2,460,736 | | | | 2,699,547 | | | | -9 | % | | | 2,334,152 | | | | 5 | % | | | 10,036,495 | | | | 8,580,692 | | | | 17 | % |
| Paper | | | 96,255 | | | | 111,303 | | | | -14 | % | | | 98,713 | | | | -2 | % | | | 375,062 | | | | 403,052 | | | | -7 | % |
| Paperboard | | | 10,078 | | | | 17,915 | | | | -44 | % | | | 15,204 | | | | -34 | % | | | 62,816 | | | | 62,219 | | | | 1 | % |
| Printing & Writing | | | 83,130 | | | | 92,640 | | | | -10 | % | | | 82,347 | | | | 1 | % | | | 303,568 | | | | 338,562 | | | | -10 | % |
| Other paper1 | | | 3,047 | | | | 748 | | | | 307 | % | | | 1,162 | | | | 162 | % | | | 8,678 | | | | 2,271 | | | | 282 | % |
| Domestic Market | | | 460,135 | | | | 477,322 | | | | -4 | % | | | 412,826 | | | | 11 | % | | | 1,588,440 | | | | 1,684,374 | | | | -6 | % |
| Pulp | | | 201,908 | | | | 219,973 | | | | -8 | % | | | 192,415 | | | | 5 | % | | | 786,621 | | | | 830,962 | | | | -5 | % |
| Paper | | | 258,227 | | | | 257,349 | | | | 0 | % | | | 220,411 | | | | 17 | % | | | 801,819 | | | | 853,412 | | | | -6 | % |
| Paperboard | | | 44,916 | | | | 34,996 | | | | 28 | % | | | 37,362 | | | | 20 | % | | | 138,937 | | | | 130,210 | | | | 7 | % |
| Printing & Writing | | | 182,526 | | | | 190,773 | | | | -4 | % | | | 152,069 | | | | 20 | % | | | 538,861 | | | | 619,802 | | | | -13 | % |
| Other paper1 | | | 30,785 | | | | 31,580 | | | | -3 | % | | | 30,980 | | | | -1 | % | | | 124,021 | | | | 103,400 | | | | 20 | % |
| Total Sales Volume | | | 3,017,126 | | | | 3,288,172 | | | | -8 | % | | | 2,845,691 | | | | 6 | % | | | 11,999,997 | | | | 10,668,118 | | | | 12 | % |
| Pulp | | | 2,662,644 | | | | 2,919,520 | | | | -9 | % | | | 2,526,567 | | | | 5 | % | | | 10,823,116 | | | | 9,411,654 | | | | 15 | % |
| Paper | | | 354,482 | | | | 368,652 | | | | -4 | % | | | 319,124 | | | | 11 | % | | | 1,176,881 | | | | 1,256,464 | | | | -6 | % |
| Paperboard | | | 54,994 | | | | 52,911 | | | | 4 | % | | | 52,566 | | | | 5 | % | | | 201,753 | | | | 192,429 | | | | 5 | % |
| Printing & Writing | | | 265,656 | | | | 283,413 | | | | -6 | % | | | 234,416 | | | | 13 | % | | | 842,429 | | | | 958,364 | | | | -12 | % |
| Other paper1 | | | 33,832 | | | | 32,328 | | | | 5 | % | | | 32,142 | | | | 5 | % | | | 132,699 | | | | 105,671 | | | | 26 | % |
Average net price
(R$/ton) | | | 4Q20 | | | | 4Q19 | | | | ΔY-o-Y | | | | 3Q20 | | | | ΔQ-o-Q | | | | 2020 | | | | 2019 | | | | ΔY-o-Y | |
| Exports | | | 2,538 | | | | 2,004 | | | | 27 | % | | | 2,524 | | | | 1 | % | | | 2,448 | | | | 2,304 | | | | 6 | % |
| Pulp | | | 2,476 | | | | 1,937 | | | | 28 | % | | | 2,465 | | | | 0 | % | | | 2,388 | | | | 2,237 | | | | 7 | % |
| Paper | | | 4,119 | | | | 3,619 | | | | 14 | % | | | 3,913 | | | | 5 | % | | | 4,063 | | | | 3,734 | | | | 9 | % |
| Domestic Market | | | 3,310 | | | | 2,967 | | | | 12 | % | | | 3,223 | | | | 3 | % | | | 3,127 | | | | 3,155 | | | | -1 | % |
| Pulp | | | 2,246 | | | | 1,827 | | | | 23 | % | | | 2,154 | | | | 4 | % | | | 2,046 | | | | 2,207 | | | | -7 | % |
| Paper | | | 4,142 | | | | 3,942 | | | | 5 | % | | | 4,157 | | | | 0 | % | | | 4,188 | | | | 4,078 | | | | 3 | % |
| Total | | | 2,656 | | | | 2,144 | | | | 24 | % | | | 2,625 | | | | 1 | % | | | 2,538 | | | | 2,438 | | | | 4 | % |
| Pulp | | | 2,459 | | | | 1,929 | | | | 27 | % | | | 2,441 | | | | 1 | % | | | 2,363 | | | | 2,234 | | | | 6 | % |
| Paper | | | 4,136 | | | | 3,844 | | | | 8 | % | | | 4,081 | | | | 1 | % | | | 4,148 | | | | 3,968 | | | | 5 | % |
| Average net price (US$/ton) | | | 4Q20 | | | | 4Q19 | | | | ΔY-o-Y | | | | 3Q20 | | | | ΔQ-o-Q | | | | 2020 | | | | 2019 | | | | ΔY-o-Y | |
| Exports | | | 470 | | | | 486 | | | | -3 | % | | | 469 | | | | 0 | % | | | 474 | | | | 583 | | | | -19 | % |
| Pulp | | | 459 | | | | 470 | | | | -2 | % | | | 458 | | | | 0 | % | | | 463 | | | | 566 | | | | -18 | % |
| Paper | | | 763 | | | | 878 | | | | -13 | % | | | 728 | | | | 5 | % | | | 787 | | | | 945 | | | | -17 | % |
| Domestic Market | | | 613 | | | | 720 | | | | -15 | % | | | 599 | | | | 2 | % | | | 606 | | | | 799 | | | | -24 | % |
| Pulp | | | 416 | | | | 443 | | | | -6 | % | | | 400 | | | | 4 | % | | | 397 | | | | 559 | | | | -29 | % |
| Paper | | | 767 | | | | 957 | | | | -20 | % | | | 773 | | | | -1 | % | | | 812 | | | | 1,032 | | | | -21 | % |
| Total | | | 492 | | | | 520 | | | | -5 | % | | | 488 | | | | 1 | % | | | 492 | | | | 617 | | | | -20 | % |
| Pulp | | | 455 | | | | 468 | | | | -3 | % | | | 454 | | | | 0 | % | | | 458 | | | | 566 | | | | -19 | % |
| Paper | | | 766 | | | | 933 | | | | -18 | % | | | 759 | | | | 1 | % | | | 804 | | | | 1,005 | | | | -20 | % |
¹ Paper of other manufacturers sold by Suzano and tissue paper.
| FX Rate R$/US$ | | | 4Q20 | | | | 4Q19 | | | | ΔY-o-Y | | | | 3Q20 | | | | ΔQ-o-Q | | | | 2020 | | | | 2019 | | | | ΔY-o-Y | |
| Closing | | | 5.20 | | | | 4.03 | | | | 29 | % | | | 5.64 | | | | -8 | % | | | 5.20 | | | | 4.03 | | | | 29 | % |
| Average | | | 5.40 | | | | 4.12 | | | | 31 | % | | | 5.38 | | | | 0 | % | | | 5.16 | | | | 3.95 | | | | 31 | % |
APPENDIX 2 – Consolidated Statement of Income and Goodwill Amortization
Income Statement (R$ ‘000) | | | 4Q20 | | | | 4Q19 | | | | ΔY-o-Y | | | | 3Q20 | | | | ΔQ-o-Q | | | | 2020 | | | | 2019 | | | | ΔY-o-Y | |
| Net Revenue | | | 8,012,976 | | | | 7,048,960 | | | | 14 | % | | | 7,470,835 | | | | 7 | % | | | 30,460,277 | | | | 26,012,950 | | | | 17 | % |
| Cost of Goods Sold | | | (4,883,644 | ) | | | (5,810,056 | ) | | | -16 | % | | | (4,473,994 | ) | | | 9 | % | | | (18,966,331 | ) | | | (20,743,482 | ) | | | -9 | % |
| Gross Debt | | | 3,129,332 | | | | 1,238,904 | | | | 153 | % | | | 2,996,841 | | | | 4 | % | | | 11,493,946 | | | | 5,269,468 | | | | 118 | % |
| Gross Margin | | | 39.1 | % | | | 17.6 | % | | | 21 p.p. | | | | 40.1 | % | | | -1 p.p. | | | | 37.7 | % | | | 20.3 | % | | | 17 p.p. | |
| | | | | | | | | | | | | | | | | | | | | | | | | | | | | | | | | |
| Operating Expense/Income | | | (718,307 | ) | | | (675,514 | ) | | | 6 | % | | | (829,110 | ) | | | -13 | % | | | (3,050,552 | ) | | | (2,640,890 | ) | | | 16 | % |
| Selling Expenses | | | (590,024 | ) | | | (537,981 | ) | | | 10 | % | | | (522,594 | ) | | | 13 | % | | | (2,174,652 | ) | | | (1,905,279 | ) | | | 14 | % |
| General and Administrative Expenses | | | (479,906 | ) | | | (285,586 | ) | | | 68 | % | | | (312,735 | ) | | | 53 | % | | | (1,443,192 | ) | | | (1,173,358 | ) | | | 23 | % |
| Other Operating Income (Expenses) | | | 322,883 | | | | 137,307 | | | | 135 | % | | | (4,135 | ) | | | -7909 | % | | | 531,150 | | | | 405,754 | | | | 31 | % |
| Equity Equivalence | | | 28,740 | | | | 10,746 | | | | 167 | % | | | 10,354 | | | | 178 | % | | | 36,142 | | | | 31,993 | | | | 13 | % |
| EBIT | | | 2,411,025 | | | | 563,390 | | | | 328 | % | | | 2,167,731 | | | | 11 | % | | | 8,443,394 | | | | 2,628,578 | | | | 221 | % |
| | | | | | | | | | | | | | | | | | | | | | | | | | | | | | | | | |
| Depreciation, Amortization & Depletion | | | 1,761,660 | | | | 1,778,853 | | | | -1 | % | | | 1,653,560 | | | | 7 | % | | | 6,772,780 | | | | 8,091,952 | | | | -16 | % |
| | | | | | | | | | | | | | | | | | | | | | | | | | | | | | | | | |
| EBITDA | | | 4,172,685 | | | | 2,342,243 | | | | 78 | % | | | 3,821,291 | | | | 9 | % | | | 15,216,174 | | | | 10,720,530 | | | | 42 | % |
| EBITDA Margin (%) | | | 52.1 | % | | | 33.2 | % | | | 19 p.p. | | | | 51.1 | % | | | 1 p.p. | | | | 50.0 | % | | | 41.2 | % | | | 9 p.p. | |
| | | | | | | | | | | | | | | | | | | | | | | | | | | | | | | | | |
| Adjusted EBITDA1 | | | 3,964,926 | | | | 2,465,383 | | | | 61 | % | | | 3,778,534 | | | | 5 | % | | | 14,949,489 | | | | 10,723,570 | | | | 39 | % |
| Adjusted EBITDA Margin1 | | | 49.5 | % | | | 35.0 | % | | | 15 p.p. | | | | 50.6 | % | | | -1 p.p. | | | | 49.1 | % | | | 41.2 | % | | | 8 p.p. | |
| | | | | | | | | | | | | | | | | | | | | | | | | | | | | | | | | |
| Net Financial Result | | | 6,238,407 | | | | 1,624,574 | | | | 284 | % | | | (4,222,644 | ) | | | -248 | % | | | (26,085,523 | ) | | | (6,725,781 | ) | | | 288 | % |
| Financial Expenses | | | 65,889 | | | | 99,872 | | | | -34 | % | | | 58,413 | | | | 13 | % | | | 327,475 | | | | 493,246 | | | | -34 | % |
| Financial Revenues | | | (974,494 | ) | | | (1,055,077 | ) | | | -8 | % | | | (1,365,381 | ) | | | -29 | % | | | (4,459,425 | ) | | | (4,178,848 | ) | | | 7 | % |
| Exchange Rate Variation | | | 4,463,515 | | | | 1,418,127 | | | | 215 | % | | | (1,644,611 | ) | | | -371 | % | | | (12,530,891 | ) | | | (1,964,927 | ) | | | 538 | % |
| Net Proceeds Generated by Derivatives | | | 2,683,497 | | | | 1,161,652 | | | | 131 | % | | | (1,271,065 | ) | | | -311 | % | | | (9,422,682 | ) | | | (1,075,252 | ) | | | 776 | % |
| Earnings Before Taxes | | | 8,649,432 | | | | 2,187,964 | | | | 295 | % | | | (2,054,913 | ) | | | -521 | % | | | (17,642,129 | ) | | | (4,097,203 | ) | | | 331 | % |
| | | | | | | | | | | | | | | | | | | | | | | | | | | | | | | | | |
| Income and Social Contribution Taxes | | | (2,735,081 | ) | | | (1,013,188 | ) | | | 170 | % | | | 897,206 | | | | -405 | % | | | 6,927,194 | | | | 1,282,461 | | | | 440 | % |
| | | | | | | | | | | | | | | | | | | | | | | | | | | | | | | | | |
| Net Income (Loss) | | | 5,914,351 | | | | 1,174,776 | | | | 403 | % | | | (1,157,707 | ) | | | -611 | % | | | (10,714,935 | ) | | | (2,814,742 | ) | | | 281 | % |
| Net Margin | | | 73.8 | % | | | 16.7 | % | | | 57 p.p. | | | | -15.5 | % | | | 89 p.p. | | | | -35.2 | % | | | -10.8 | % | | | -24 p.p. | |
| Goodwill amortization - PPA (R$ ‘000) | | | 4Q20 | | | | 4Q19 | | | | ΔY-o-Y | | | | 3Q20 | | | | ΔQ-o-Q | |
| COGS | | | (2,668 | ) | | | (138,646 | ) | | | -98 | % | | | (126,165 | ) | | | -98 | % |
| Selling Expenses | | | (206,310 | ) | | | (206,700 | ) | | | 0 | % | | | (206,474 | ) | | | 0 | % |
| General and administrative expenses | | | (1,191 | ) | | | 21,436 | | | | - | | | | 10,620 | | | | - | |
| Other operational revenues (expenses) | | | (5,380 | ) | | | (121 | ) | | | - | | | | (14,686 | ) | | | -63 | % |
| Financial results | | | 20,756 | | | | (108,357 | ) | | | - | | | | (1,303 | ) | | | - | |
1 Excluding non-recurring items and PPA effects.
APPENDIX 3 – Consolidated Balance Sheet
| Assets (R$ ’000) | | 31/12/2020 | | | 30/09/2020 | | | 31/12/2019 | |
| Current Assets | | | | | | | | | | | | |
| Cash and cash equivalents | | | 6,835,057 | | | | 7,247,184 | | | | 3,249,127 | |
| Financial investments | | | 2,212,079 | | | | 2,327,353 | | | | 6,150,631 | |
| Trade accounts receivable | | | 2,915,206 | | | | 3,036,769 | | | | 3,035,817 | |
| Inventories | | | 4,009,335 | | | | 4,245,766 | | | | 4,685,595 | |
| Recoverable taxes | | | 406,850 | | | | 874,152 | | | | 997,201 | |
| Derivative financial instruments | | | 484,043 | | | | 209,970 | | | | 260,273 | |
| Advance to suppliers | | | 43,162 | | | | 102,765 | | | | 170,481 | |
| Non-current assets held for sale | | | 313,338 | | | | - | | | | - | |
| Other assets | | | 738,924 | | | | 479,903 | | | | 335,112 | |
| Total Current Assets | | | 17,957,994 | | | | 18,523,862 | | | | 18,884,237 | |
| Non-Current Assets | | | | | | | | | | | | |
| Financial investments | | | 184,778 | | | | 183,893 | | | | 179,703 | |
| Recoverable taxes | | | 834,575 | | | | 748,584 | | | | 708,914 | |
| Deferred taxes | | | 8,677,002 | | | | 11,399,116 | | | | 2,134,040 | |
| Derivative financial instruments | | | 857,377 | | | | 922,225 | | | | 838,699 | |
| Advance to suppliers | | | 1,015,115 | | | | 1,071,249 | | | | 1,087,149 | |
| Judicial deposits | | | 257,789 | | | | 266,214 | | | | 268,672 | |
| Biological assets | | | 11,161,210 | | | | 10,759,599 | | | | 10,571,499 | |
| Investments | | | 359,071 | | | | 336,929 | | | | 322,446 | |
| Property, plant and equipment | | | 39,156,890 | | | | 39,736,484 | | | | 41,120,945 | |
| Right of use on lease agreements | | | 4,344,078 | | | | 4,242,105 | | | | 3,850,237 | |
| Intangible | | | 16,759,528 | | | | 17,014,465 | | | | 17,712,803 | |
| Other assets | | | 235,341 | | | | 235,309 | | | | 228,881 | |
| Total Non-Current Assets | | | 83,842,754 | | | | 86,916,172 | | | | 79,023,988 | |
| | | | | | | | | | | | | |
| Total Assets | | | 101,800,748 | | | | 105,440,034 | | | | 97,908,225 | |
| Liabilities and Equity (R$ ´000) | | 31/12/2020 | | | 30/09/2020 | | | 31/12/2019 | |
| Current Liabilities | | | | | | | | | | | | |
| Trade accounts payable | | | 2,361,098 | | | | 2,157,286 | | | | 2,376,459 | |
| Loans, financing and debentures | | | 2,043,386 | | | | 4,323,325 | | | | 6,227,951 | |
| Accounts payable for lease operations | | | 620,177 | | | | 629,329 | | | | 656,844 | |
| Derivative financial instruments | | | 1,991,118 | | | | 4,117,393 | | | | 893,413 | |
| Taxes payable | | | 170,482 | | | | 315,080 | | | | 307,639 | |
| Payroll and charges | | | 492,728 | | | | 478,732 | | | | 400,435 | |
| Liabilities for assets acquisitions and subsidiaries | | | 101,515 | | | | 102,013 | | | | 94,414 | |
| Dividends payable | | | 6,232 | | | | 4,888 | | | | 5,720 | |
| Other liabilities | | | 386,087 | | | | 292,387 | | | | 516,320 | |
| Total Current Liabilities | | | 8,172,823 | | | | 12,420,433 | | | | 11,479,195 | |
| | | | | | | | | | | | | |
| Non-Current Liabilities | | | | | | | | | | | | |
| Loans, financing and debentures | | | 70,856,496 | | | | 74,166,284 | | | | 57,456,375 | |
| Accounts payable for lease operations | | | 4,571,583 | | | | 4,662,805 | | | | 3,327,226 | |
| Derivative financial instruments | | | 6,126,282 | | | | 7,792,461 | | | | 2,024,500 | |
| Liabilities for assets acquisitions and subsidiaries | | | 400,713 | | | | 429,357 | | | | 447,201 | |
| Provision for judicial liabilities | | | 3,255,955 | | | | 3,403,233 | | | | 3,512,477 | |
| Actuarial liabilities | | | 785,045 | | | | 747,984 | | | | 736,179 | |
| Deferred taxes | | | 570 | | | | 74,736 | | | | 578,875 | |
| Other liabilities | | | 293,903 | | | | 286,951 | | | | 258,228 | |
| Total Non-Current Liabilities | | | 86,290,547 | | | | 91,563,811 | | | | 68,341,061 | |
| | | | | | | | | | | | | |
| Shareholders’ Equity | | | | | | | | | | | | |
| Share capital | | | 9,235,546 | | | | 9,235,546 | | | | 9,235,546 | |
| Capital reserves | | | 10,612 | | | | 6,419,430 | | | | 6,416,864 | |
| Retained earnings reserves | | | (218,265 | ) | | | (218,265 | ) | | | (218,265 | ) |
| Equity valuation adjustment | | | - | | | | 317,144 | | | | 317,144 | |
| Retained loss | | | 2,129,944 | | | | 2,180,733 | | | | 2,221,341 | |
| Total Equity | | | (3,926,015 | ) | | | (16,599,888 | ) | | | - | |
| Shareholders’ Equity | | | 7,231,822 | | | | 1,334,700 | | | | 17,972,630 | |
| | | | | | | | | | | | | |
| Non-controlling shareholders interests | | | 105,556 | | | | 121,090 | | | | 115,339 | |
| | | | | | | | | | | | | |
| Total Liabilities and Equity | | | 101,800,748 | | | | 105,440,034 | | | | 97,908,225 | |
APPENDIX 4 – Consolidated Statement of Cash Flow
| Cash Flow (R$ ‘000) | | | 4Q20 | | | 4Q19 | | | 2020 | | | | 2019 | |
| Cash flow from operating activities | | | | | | | | | | | | | | | | |
| Net income/(loss) for the period | | | 5,914,351 | | | | 1,174,776 | | | | (10,714,935 | ) | | | (2,814,742 | ) |
| Depreciation, depletion and amortization | | | 1,693,458 | | | | 1,762,015 | | | | 6,565,441 | | | | 7,898,775 | |
| Amortization of right of use | | | 59,967 | | | | 47,292 | | | | 186,768 | | | | 154,217 | |
| Sublease of ships | | | (12,520 | ) | | | - | | | | (35,841 | ) | | | - | |
| Interest expense on lease liabilities | | | 113,516 | | | | 73,042 | | | | 397,746 | | | | 226,103 | |
| Results from sale and disposals of property and biological assets, net | | | (55,303 | ) | | | 51,649 | | | | (53,807 | ) | | | 77,930 | |
| Equity equivalence | | | (28,740 | ) | | | (10,746 | ) | | | (36,142 | ) | | | (31,993 | ) |
| Exchange rate and monetary variations, net | | | (4,463,515 | ) | | | (1,418,127 | ) | | | 12,530,891 | | | | 1,964,927 | |
| Interest expenses with loans, financing and debentures, net | | | 763,490 | | | | 831,764 | | | | 3,286,254 | | | | 3,363,019 | |
| Interest expense with bond repurchases | | | - | | | | - | | | | 391,390 | | | | - | |
| Capitalized interest | | | (745 | ) | | | (1,261 | ) | | | (10,636 | ) | | | (4,213 | ) |
| Accrual of interest on marketable securities | | | (12,261 | ) | | | (101,715 | ) | | | (94,868 | ) | | | (392,018 | ) |
| Amortization of fundraising costs | | | 29,225 | | | | 13,004 | | | | 101,741 | | | | 185,807 | |
| Derivative (gains) losses, net | | | (2,683,497 | ) | | | (1,161,652 | ) | | | 9,422,682 | | | | 1,075,252 | |
| Fair value adjustment of biological assets | | | (292,751 | ) | | | (101,946 | ) | | | (466,484 | ) | | | (185,399 | ) |
| Deferred income tax and social contribution expenses | | | 2,658,454 | | | | 989,070 | | | | (7,109,120 | ) | | | (1,528,571 | ) |
| Tax credit – Gain on tax action | | | - | | | | - | | | | - | | | | (128,115 | ) |
| Interest on employee benefits | | | 13,286 | | | | 5,734 | | | | 53,092 | | | | 44,496 | |
| Provision (reversal) of judicial liabilities, net | | | 14,046 | | | | 48,665 | | | | 1,288 | | | | 26,807 | |
| Allowance for doubtful accounts, net | | | 812 | | | | 2,078 | | | | 6,022 | | | | (12,286 | ) |
| Provision for (reversal of) inventory losses and write-offs | | | 94,393 | | | | 76,479 | | | | 65,675 | | | | 107,269 | |
| Provision for loss of ICMS credits, net | | | 11,082 | | | | 41,787 | | | | (82,293 | ) | | | 129,283 | |
| Impairment of non-financial assets | | | 45,435 | | | | - | | | | 45,435 | | | | - | |
| Other | | | 9,539 | | | | (49,656 | ) | | | 35,452 | | | | (56,517 | ) |
| Decrease (increase) in assets | | | 374,383 | | | | 117,802 | | | | 2,250,235 | | | | 2,080,352 | |
| Trade accounts receivables | | | (131,789 | ) | | | (1,023,818 | ) | | | 884,451 | | | | 991,476 | |
| Inventories | | | 91,186 | | | | 1,217,349 | | | | 651,203 | | | | 873,420 | |
| Recoverable taxes | | | 397,545 | | | | 104,148 | | | | 659,930 | | | | 241,934 | |
| Other assets | | | 17,441 | | | | (179,877 | ) | | | 54,651 | | | | (26,478 | ) |
| Increase (decrease) in liabilities | | | 342,744 | | | | (518,555 | ) | | | 13,424 | | | | (1,612,068 | ) |
| Trade accounts payables | | | 339,174 | | | | (829,169 | ) | | | 140,480 | | | | (1,555,697 | ) |
| Taxes payable | | | (88,437 | ) | | | (22,791 | ) | | | 47,212 | | | | 240,871 | |
| Payroll and charges | | | 13,985 | | | | (38,902 | ) | | | 92,278 | | | | (234,948 | ) |
| Other liabilities | | | 78,022 | | | | 372,307 | | | | (266,546 | ) | | | (62,294 | ) |
| Cash provided by operations, net | | | 4,588,849 | | | | 1,871,499 | | | | 16,749,410 | | | | 10,568,315 | |
| Payment of interest with financing, loans and debentures | | | (361,788 | ) | | | (615,626 | ) | | | (3,244,949 | ) | | | (2,977,957 | ) |
| Payment of interest on bonds repurchase | | | - | | | | - | | | | (378,382 | ) | | | - | |
| Interest received from marketable securities | | | 40,702 | | | | 23,268 | | | | 186,853 | | | | 377,804 | |
| Payment of income taxes | | | (58,200 | ) | | | (55,245 | ) | | | (188,296 | ) | | | (391,725 | ) |
| Cash provided by operating activities | | | 4,209,563 | | | | 1,223,896 | | | | 13,124,636 | | | | 7,576,437 | |
| Investing activities | | | | | | | | | | | | | | | | |
| Additions to property, plant and equipment | | | (1,710,499 | ) | | | (1,124,275 | ) | | | (4,897,860 | ) | | | (4,868,427 | ) |
| Proceeds from sale of property, plant and equipment | | | 94,690 | | | | 44,905 | | | | 183,504 | | | | 198,644 | |
| Increase of capital in subsidiaries and associates | | | - | | | | - | | | | - | | | | (45,856 | ) |
| Marketable securities, net | | | 85,948 | | | | (1,049,228 | ) | | | 3,841,493 | | | | 19,378,893 | |
| Advance for acquisition of wood from operations with development | | | 47,815 | | | | (61,285 | ) | | | 135,693 | | | | (355,447 | ) |
| Acquisition of subsidiaries, net cash | | | - | | | | - | | | | - | | | | (26,002,540 | ) |
| Dividends received | | | - | | | | - | | | | 753 | | | | - | |
| Other investments | | | - | | | | (21 | ) | | | - | | | | (286 | ) |
| Cash used in investing activities, net | | | (1,482,046 | ) | | | (2,189,904 | ) | | | (736,417 | ) | | | (11,695,019 | ) |
| | | | | | | | | | | | | | | | | |
| Financing activities | | | | | | | | | | | | | | | | |
| Proceeds from loans, financing and debentures | | | 4,178,624 | | | | 2,677,927 | | | | 14,761,796 | | | | 18,993,837 | |
| Payment of derivative transactions | | | (1,318,184 | ) | | | (79,452 | ) | | | (4,465,640 | ) | | | (135,449 | ) |
| Payment of loans, financing and debentures | | | (5,340,666 | ) | | | (1,745,186 | ) | | | (19,092,810 | ) | | | (13,994,708 | ) |
| Payment of leases | | | (247,118 | ) | | | (219,774 | ) | | | (824,245 | ) | | | (645,071 | ) |
| Payment of dividends | | | - | | | | (4,897 | ) | | | - | | | | (606,632 | ) |
| Sale of treasury shares to meet stock-based compensation plan | | | - | | | | (879 | ) | | | - | | | | (879 | ) |
| Liabilities for assets acquisitions and subsidiaries | | | (13,058 | ) | | | (9,084 | ) | | | (164,240 | ) | | | (479,480 | ) |
| Other financing | | | - | | | | 5,616 | | | | - | | | | 10,191 | |
| Cash provided (used) by financing activities, net | | | (2,740,402 | ) | | | 624,271 | | | | (9,785,139 | ) | | | 3,141,809 | |
| | | | | | | | | | | | | | | | | |
| Exchange variation on cash and cash equivalents | | | (399,242 | ) | | | (123,782 | ) | | | 982,850 | | | | (161,553 | ) |
| | | | | | | | | | | | | | | | | |
| Increase (reduction) in cash and cash equivalents | | | (412,127 | ) | | | (465,519 | ) | | | 3,585,930 | | | | (1,138,326 | ) |
| Cash and cash equivalents at the beginning for the period | | | 7,247,184 | | | | 3,714,646 | | | | 3,249,127 | | | | 4,387,453 | |
| Cash and cash equivalents at the end for the period | | | 6,835,057 | | | | 3,249,127 | | | | 6,835,057 | | | | 3,249,127 | |
| Increase (reduction) in cash and cash equivalents | | | (412,127 | ) | | | (465,519 | ) | | | 3,585,930 | | | | (1,138,326 | ) |
APPENDIX 5 - EBITDA
| (R$ '000, except where otherwise indicated) | | | 4Q20 | | | 4Q19 | | | 2020 | | | | 2019 | |
| Net income | | | 5,914,351 | | | | 1,174,776 | | | | (10,714,935 | ) | | | (2,814,742 | ) |
| Net Financial Result | | | (6,238,407 | ) | | | (1,624,574 | ) | | | 26,085,523 | | | | 6,725,781 | |
| Income and Social Contribution Taxes | | | 2,735,081 | | | | 1,013,188 | | | | (6,927,194 | ) | | | (1,282,461 | ) |
| EBIT | | | 2,411,025 | | | | 563,390 | | | | 8,443,394 | | | | 2,628,578 | |
| Depreciation, Amortization and Depletion | | | 1,761,660 | | | | 1,778,853 | | | | 6,772,780 | | | | 8,091,952 | |
| EBITDA1 | | | 4,172,685 | | | | 2,342,243 | | | | 15,216,174 | | | | 10,720,530 | |
| EBITDA Margin | | | 52.1 | % | | | 33.2 | % | | | 49.9 | % | | | 41.2 | % |
| | | | | | | | | | | | | | | | | |
| Expenses with Fibria's transaction | | | 59 | | | | 3,924 | | | | 992 | | | | 79,870 | |
| PPA effect (Asset disposal) | | | 5,290 | | | | 9,123 | | | | 26,378 | | | | 33,991 | |
| Indemnity – FACEPA | | | - | | | | - | | | | (1,093 | ) | | | - | |
| Accruals for losses on ICMS credits | | | 10,075 | | | | 97,061 | | | | (81,818 | ) | | | 181,117 | |
| ICMS accrual complement | | | - | | | | - | | | | 2,808 | | | | | |
| Contract renegotiation | | | - | | | | 45,723 | | | | - | | | | 45,723 | |
| Losango Project Adjustments | | | - | | | | 57,764 | | | | - | | | | 57,764 | |
| Fair value adjustment (others) | | | - | | | | (32,705 | ) | | | - | | | | (32,705 | ) |
| Labor lawsuits provision | | | - | | | | 32,178 | | | | - | | | | 32,178 | |
| Expenses related to social actions to fight the Coronavirus | | | 54,852 | | | | - | | | | 136,100 | | | | - | |
| Expenses with obligations and contract cancellations | | | - | | | | - | | | | 6,008 | | | | - | |
| Adjustment of the fair value of biological assets | | | (292,750 | ) | | | (101,946 | ) | | | (466,483 | ) | | | (185,399 | ) |
| Losses for PIS/COFINS provision | | | - | | | | 21,132 | | | | 11,063 | | | | 21,132 | |
| COVID-19 - Donations | | | 32 | | | | - | | | | 48,590 | | | | - | |
| ITBI Provision and Fees | | | - | | | | - | | | | 10,529 | | | | - | |
| Project Mucuri 5.1 Closure | | | (1,005 | ) | | | - | | | | 29,679 | | | | - | |
| Equity Interest | | | (28,740 | ) | | | (10,746 | ) | | | (36,142 | ) | | | (31,993 | ) |
| Sale of judicial credits | | | - | | | | 390 | | | | - | | | | (86,610 | ) |
| Fiscal credits (PIS/COFINS calculation base) | | | - | | | | - | | | | - | | | | (128,115 | ) |
| Impairment of non-financial assets | | | 45,435 | | | | - | | | | 45,435 | | | | - | |
| Others | | | (1,008 | ) | | | 1,241 | | | | 1,269 | | | | 16,087 | |
| Adjusted EBITDA | | | 3,964,926 | | | | 2,465,383 | | | | 14,949,489 | | | | 10,723,570 | |
| Adjusted EBITDA Margin | | | 50.6 | % | | | 36.3 | % | | | 48.9 | % | | | 43.5 | % |
¹ The Company's EBITDA is calculated in accordance with CVM Instruction 527 of October 4, 2012.
APPENDIX 6 - Segmented Income Statement
| | | 4Q20 | | | 4Q19 | |
| Segmented Financial Statement (R$ '000) | | Pulp | | | Paper | | | Non
Segmented | | | Total
Consolidated | | | Pulp | | | Paper | | | Non
Segmented | | | Total
Consolidated | |
| Net Revenue | | | 6,546,975 | | | | 1,466,001 | | | | | | | | 8,012,976 | | | | 5,631,716 | | | | 1,417,244 | | | | | | | | 7,048,960 | |
| Cost of Goods Sold | | | (3,915,873 | ) | | | (967,771 | ) | | | | | | | (4,883,644 | ) | | | (4,859,010 | ) | | | (951,046 | ) | | | | | | | (5,810,056 | ) |
| Gross Profit | | | 2,631,102 | | | | 498,230 | | | | - | | | | 3,129,332 | | | | 772,706 | | | | 466,198 | | | | - | | | | 1,238,904 | |
| Gross Margin | | | 40.2 | % | | | 34.0 | % | | | | | | | 39.1 | % | | | 13.7 | % | | | 32.9 | % | | | | | | | 17.6 | % |
| | | | | | | | | | | | | | | | | | | | | | | | | | | | | | | | | |
| Operating Expense/Income | | | (594,303 | ) | | | (124,004 | ) | | | - | | | | (718,307 | ) | | | (557,552 | ) | | | (117,962 | ) | | | - | | | | (675,514 | ) |
| Selling Expenses | | | (467,110 | ) | | | (122,914 | ) | | | | | | | (590,024 | ) | | | (419,438 | ) | | | (118,543 | ) | | | | | | | (537,981 | ) |
| General and Administrative Expenses | | | (336,076 | ) | | | (143,830 | ) | | | | | | | (479,906 | ) | | | (200,354 | ) | | | (85,232 | ) | | | | | | | (285,586 | ) |
| Other Operating Income (Expenses) | | | 230,705 | | | | 92,178 | | | | | | | | 322,883 | | | | 56,355 | | | | 80,952 | | | | | | | | 137,307 | |
| Equity Equivalence | | | (21,822 | ) | | | 50,562 | | | | | | | | 28,740 | | | | 5,885 | | | | 4,861 | | | | | | | | 10,746 | |
| EBIT | | | 2,036,799 | | | | 374,226 | | | | - | | | | 2,411,025 | | | | 215,154 | | | | 348,236 | | | | - | | | | 563,390 | |
| | | | | | | | | | | | | | | | | | | | | | | | | | | | | | | | | |
| Depreciation, Amortization& Depletion | | | 1,596,972 | | | | 164,688 | | | | | | | | 1,761,660 | | | | 1,639,056 | | | | 139,797 | | | | | | | | 1,778,853 | |
| | | | | | | | | | | | | | | | | | | | | | | | | | | | | | | | | |
| EBITDA | | | 3,633,771 | | | | 538,914 | | | | - | | | | 4,172,685 | | | | 1,854,210 | | | | 488,033 | | | | - | | | | 2,342,243 | |
| EBITDA Margin | | | 55.5 | % | | | 36.8 | % | | | - | | | | 52.1 | % | | | 32.9 | % | | | 34.4 | % | | | - | | | | 33.2 | % |
| | | | | | | | | | | | | | | | | | | | | | | | | | | | | | | | | |
| Adjusted EBITDA1 | | | 3,529,835 | | | | 435,091 | | | | - | | | | 3,964,926 | | | | 2,041,559 | | | | 423,824 | | | | - | | | | 2,465,383 | |
| Adjusted EBITDA Margin1 | | | 53.9 | % | | | 29.7 | % | | | - | | | | 49.5 | % | | | 36.3 | % | | | 29.9 | % | | | | | | | 35.0 | % |
| | | | | | | | | | | | | | | | | | | | | | | | | | | | | | | | | |
| Net Financial Result | | | - | | | | - | | | | 6,238,407 | | | | 6,238,407 | | | | - | | | | - | | | | 1,624,575 | | | | 1,624,574 | |
| | | | | | | | | | | | | | | | | | | | | | | | | | | | | | | | | |
| Earnings Before Taxes | | | 2,036,799 | | | | 374,226 | | | | 6,238,407 | | | | 8,649,432 | | | | 215,151 | | | | 348,238 | | | | 1,624,575 | | | | 2,187,964 | |
| | | | | | | | | | | | | | | | | | | | | | | | | | | | | | | | | |
Income and Social Contribution
Taxes | | | - | | | | - | | | | (2,735,081 | ) | | | (2,735,081 | ) | | | - | | | | - | | | | (1,013,188 | ) | | | (1,013,188 | ) |
| | | | | | | | | | | | | | | | | | | | | | | | | | | | | | | | | |
| Net Income (Loss) | | | 2,036,799 | | | | 374,226 | | | | 3,503,326 | | | | 5,914,351 | | | | 215,151 | | | | 348,238 | | | | 611,387 | | | | 1,174,776 | |
| Net Margin | | | 31.1 | % | | | 25.5 | % | | | - | | | | 73.8 | % | | | 3.8 | % | | | 24.6 | % | | | - | | | | 16.7 | % |
1 Excluding non-recurring items and PPA effects.
| Segmented Financial Statement (R$ '000) | | 2020 | | | 2019 | |
| | | Pulp | | | Paper | | | Non Segmented | | | Total Consolidated | | | Pulp | | | Paper | | | Non Segmented | | | Total Consolidated | |
| Net Revenue | | | 25,578,265 | | | | 4,882,012 | | | | | | | | 30,460,277 | | | | 21,027,686 | | | | 4,985,264 | | | | | | | | 26,012,950 | |
| Cost of Goods Sold | | | (15,754,930 | ) | | | (3,211,401 | ) | | | | | | | (18,966,331 | ) | | | (17,440,018 | ) | | | (3,303,464 | ) | | | | | | | (20,743,482 | ) |
| Gross Profit | | | 9,823,335 | | | | 1,670,611 | | | | - | | | | 11,493,946 | | | | 3,587,668 | | | | 1,681,800 | | | | - | | | | 5,269,468 | |
| Gross Margin | | | 38.4 | % | | | 34.2 | % | | | | | | | 37.7 | % | | | 17.1 | % | | | 33.7 | % | | | | | | | 20.3 | % |
| | | | | | | | | | | | | | | | | | | | | | | | | | | | | | | | | |
| Operating Expense/Income | | | (2,409,483 | ) | | | (641,069 | ) | | | - | | | | (3,050,552 | ) | | | (2,089,286 | ) | | | (679,719 | ) | | | 128,115 | | | | (2,640,890 | ) |
| Selling Expenses | | | (1,770,036 | ) | | | (404,616 | ) | | | | | | | (2,174,652 | ) | | | (1,503,775 | ) | | | (401,504 | ) | | | | | | | (1,905,279 | ) |
| General and Administrative Expenses | | | (1,016,093 | ) | | | (427,099 | ) | | | | | | | (1,443,192 | ) | | | (806,774 | ) | | | (366,584 | ) | | | | | | | (1,173,358 | ) |
| Other Operating Income (Expenses) | | | 390,178 | | | | 140,972 | | | | | | | | 531,150 | | | | 209,577 | | | | 68,062 | | | | 128,115 | | | | 405,754 | |
| Equity Equivalence | | | (13,532 | ) | | | 49,674 | | | | | | | | 36,142 | | | | 11,686 | | | | 20,307 | | | | | | | | 31,993 | |
| EBIT | | | 7,413,852 | | | | 1,029,542 | | | | - | | | | 8,443,394 | | | | 1,498,382 | | | | 1,002,081 | | | | 128,115 | | | | 2,628,578 | |
| | | | | | | | | | | | | | | | | | | | | | | | | | | | | | | | | |
| Depreciation, Amortization& Depletion | | | 6,232,376 | | | | 540,404 | | | | | | | | 6,772,780 | | | | 7,575,630 | | | | 516,322 | | | | | | | | 8,091,952 | |
| | | | | | | | | | | | | | | | | | | | | | | | | | | | | | | | | |
| EBITDA | | | 13,646,230 | | | | 1,569,944 | | | | - | | | | 15,216,174 | | | | 9,074,012 | | | | 1,518,403 | | | | 128,115 | | | | 10,720,530 | |
| EBITDA Margin | | | 53.4 | % | | | 32.2 | % | | | - | | | | 50.0 | % | | | 43.2 | % | | | 30.5 | % | | | - | | | | 41.2 | % |
| | | | | | | | | | | | | | | | | | | | | | | | | | | | | | | | | |
| Adjusted EBITDA1 | | | 13,484,920 | | | | 1,464,569 | | | | - | | | | 14,949,489 | | | | 9,259,198 | | | | 1,464,372 | | | | - | | | | 10,723,570 | |
| Adjusted EBITDA Margin1 | | | 52.7 | % | | | 30.0 | % | | | | | | | 49.1 | % | | | 44.0 | % | | | 29.4 | % | | | | | | | 41.2 | % |
| | | | | | | | | | | | | | | | | | | | | | | | | | | | | | | | | |
| Net Financial Result | | | - | | | | - | | | | (26,085,523 | ) | | | (26,085,523 | ) | | | - | | | | - | | | | (6,725,781 | ) | | | (6,725,781 | ) |
| | | | | | | | | | | | | | | | | | | | | | | | | | | | | | | | | |
| Earnings Before Taxes | | | 7,413,852 | | | | 1,029,542 | | | | (26,085,523 | ) | | | (17,642,129 | ) | | | 1,498,382 | | | | 1,002,081 | | | | (6,597,666 | ) | | | (4,097,203 | ) |
| | | | | | | | | | | | | | | | | | | | | | | | | | | | | | | | | |
Income and Social Contribution
Taxes | | | - | | | | - | | | | 6,927,194 | | | | 6,927,194 | | | | - | | | | - | | | | 1,282,461 | | | | 1,282,461 | |
| | | | | | | | | | | | | | | | | | | | | | | | | | | | | | | | | |
| Net Income (Loss) | | | 7,413,852 | | | | 1,029,542 | | | | (19,158,329 | ) | | | (10,714,935 | ) | | | 1,498,382 | | | | 1,002,081 | | | | (5,315,205 | ) | | | (2,814,742 | ) |
| Net Margin | | | 29.0 | % | | | 21.1 | % | | | | | | | -35.2 | % | | | 7.1 | % | | | 20.1 | % | | | | | | | -10.8 | % |
1 Excluding non-recurring items and PPA effects.
Forward-Looking Statements
This release may contain forward-looking statements. Such statements are subject to known and unknown risks and uncertainties that could cause the expectations expressed to not materialize or differ substantially from expected results. These risks include, among others, changes in future demand for the Company’s products, changes in factors affecting domestic and international product prices, changes in the cost structure, changes in the seasonal patterns of markets, changes in prices charged by competitors, foreign exchange variations, changes in the political or economic situation of Brazil, as well as emerging and international markets. The forward-looking statements were not reviewed by our independent auditors.