Exhibit 99.1

1 4Q20 Earnings Conference Call
2 This presentation contains what are considered “forward - looking statements,” as defined in Section 27 A of the 1933 Securities Act and Section 21 E of the 1934 Securities Exchange Act, as amended . Some of these forward - looking statements are identified with words such as “believe,” “may,” “could,” “would,” “possible,” “will,” “should,” “expect,” “intend,” “plan,” “anticipate,” “estimate,” “potential,” “outlook” or “continue,” as well as the negative forms of these words, other terms of similar meaning or the use of future dates . The forward - looking statements include, without limitation, statements related to the declaration or payment of dividends, implementation of the key operational and financial strategies and investment plans, guidance about future operations and factors or trends that influence the financial situation, liquidity or operational results . Such statements reflect the current view of the management and are subject to diverse risks and uncertainties . These are qualified in accordance with the inherent risks and uncertainties involving future expectations in general, and actual results could differ materially from those currently anticipated due to various risks and uncertainties . There is no guarantee that the expected events, trends or results will actually occur . The statements are based on diverse assumptions and factors, including general economic and market conditions, industry conditions and operating factors . Any changes in such assumptions or factors could cause actual results to differ materially from current expectations . Suzano does not undertake any obligation to update any such forward - looking statements as a result of new information, future events or otherwise, except as expressly required by law . All forward - looking statements in this presentation are covered in their entirety by this disclaimer . In addition, this presentation contains some financial indicators that are not recognized by the BR GAAP or IFRS . These indicators do not have a standard meaning and may not be comparable to indicators with a similar description used by other companies . We provide these indicators because we use them as measurements of Suzano's performance ; they should not be considered separately or as a replacement for other financial metrics that have been disclosed in accordance with BR GAAP or IFRS . Disclaimer
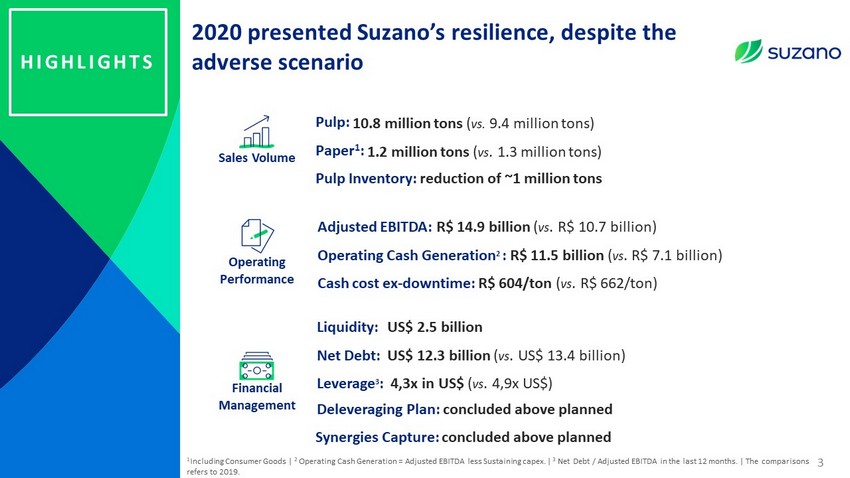
2020 presented Suzano’s resilience, despite the adverse scenario HIGHLIGHTS Sales Volume Pulp: Paper 1 : Pulp Inventory : reduction of ~1 million tons Operating Performance Adjusted EBITDA: R$ 14.9 billion ( vs . R$ 10.7 billion ) Operating Cash Generation 2 : R$ 11.5 billion ( vs . R$ 7.1 billion ) Cash cost ex - downtime : R$ 604/ ton ( vs . R$ 662/ ton ) Financial Management Liquidity : Net Debt : Leverage 3 : US$ 2.5 billion US$ 12.3 billion ( vs . US$ 13.4 billion ) 4,3x in US$ ( vs . 4,9x US$) 1 In cluding Consumer Goods | 2 Operating Cash Generation = Adjusted EBITDA less Sustaining capex. | 3 Net Debt / Adjusted EBITDA in the last 12 months. | The comparisons refers to 2019. 3 Synergies Capture: concluded above planned Deleveraging Plan : concluded above planned 10.8 million tons ( vs. 9.4 million tons) 1.2 million tons ( vs . 1.3 million tons)
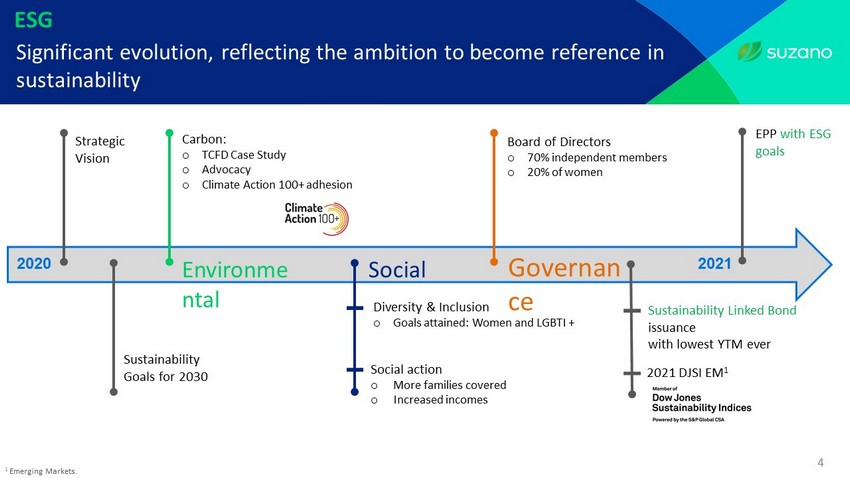
4 ESG Sustainability Goals for 2030 Strategic Vision Sustainability Linked Bond issuance with lowest YTM ever Carbon : o TCFD Case Study o Advocacy o Climate Action 100+ adhesion Diversity & Inclusion o Goals attained: Women and LGBTI + Board of Directors o 70% independent members o 20% of women Environme ntal Governan ce Social Social action o More families covered o Increased incomes 1 Emerging Markets . Significant evolution, reflecting the ambition to become reference in sustainability 2021 DJSI EM 1 EPP with ESG goals 2021 2020
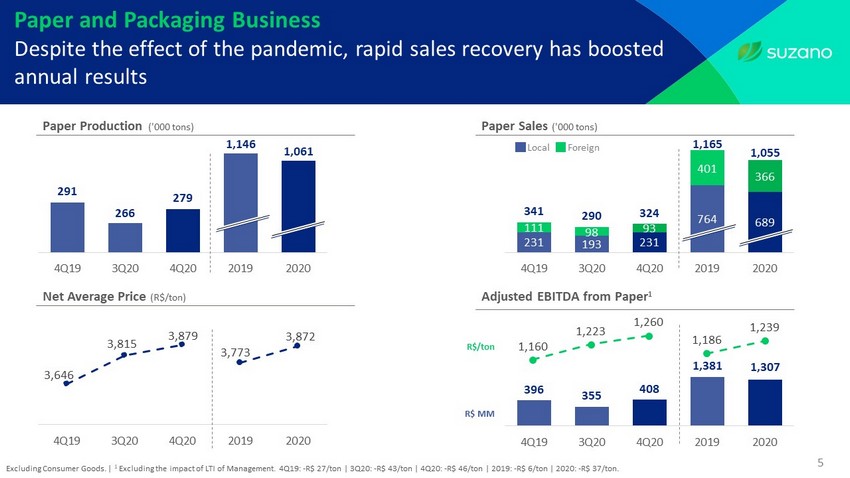
1,160 1,223 1,260 1,186 1,239 1,061 291 266 279 1,146 -150 50 250 450 650 850 1,050 1,250 4Q19 3Q20 4Q20 2019 2020 5 Paper Production ('000 tons) 231 193 231 764 689 111 98 93 401 366 341 290 324 1,165 -150 50 250 450 650 850 1,050 4Q19 3Q20 4Q20 2019 2020 Paper Sales ('000 tons) Net Average P rice (R$/ton) Local Foreign 3,646 3,815 3,879 3,773 3,872 3,400 3,500 3,600 3,700 3,800 3,900 0 0.2 0.4 0.6 0.8 1 1.2 1.4 1.6 1.8 2 4Q19 3Q20 4Q20 2019 2020 Paper and Packaging Business Despite the effect of the pandemic, rapid sales recovery has boosted annual results Excluding Consumer Goods . | 1 Excluding the impact of LTI of Management . 4Q19: - R$ 27/ ton | 3Q20: - R$ 43/ ton | 4Q20: - R$ 46/ ton | 2019: - R$ 6/ ton | 2020: - R$ 37/ton. Adjusted EBITDA from Paper 1 R$/ ton 1,055 1,307 396 355 408 1,381 0 500 1,000 1,500 2,000 2,500 3,000 4Q19 3Q20 4Q20 2019 2020 R$ MM
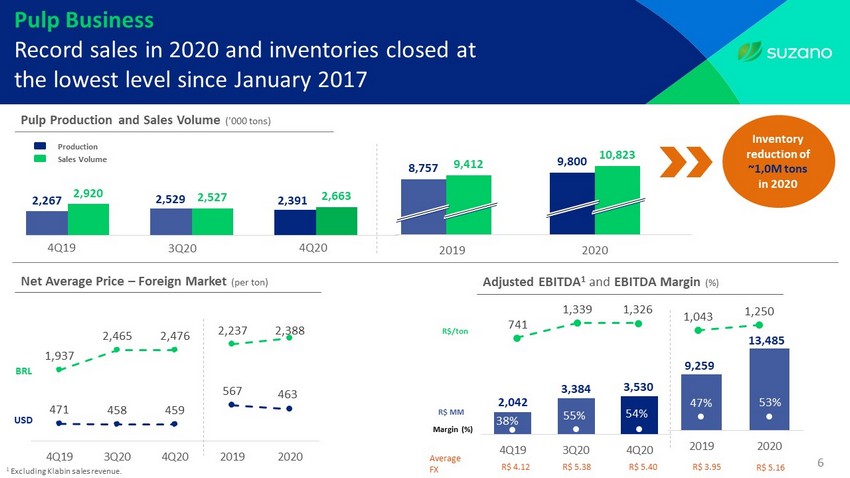
2,042 3,384 3,530 38% 55% 54% -100% 400% 900% 1400% 1900% 2400% 2900% 3400% 0 1,000 2,000 3,000 4,000 5,000 6,000 7,000 8,000 9,000 10,000 4Q19 3Q20 4Q20 6 Pulp Business Record sales in 2020 and inventories closed at the lowest level since January 2017 471 458 459 1,937 2,465 2,476 567 2,237 2,388 -400 100 600 1100 1600 2100 2600 0 500 1000 1500 2000 2500 3000 4Q19 3Q20 4Q20 2019 2020 BRL USD 1 Excluding Klabin sales revenue . 2,267 2,529 2,391 2,920 2,527 2,663 0 1,000 2,000 3,000 4,000 5,000 6,000 7,000 4Q19 3Q20 4Q20 Net Average Price – Foreign Market (per ton) Pulp Production and Sales Volume ( '000 tons ) 9,259 13,485 47% 53% -4 1 6 11 16 21 26 31 0 2,000 4,000 6,000 8,000 10,000 12,000 14,000 16,000 2019 2020 R$ MM R$/ ton Average FX R$ 4.12 R$ 5.38 R$ 5.40 R$ 3.95 Adjusted EBITDA 1 and EBITDA Margin (%) 463 R$ 5.16 Production Sales Volume 4Q19 3Q20 4Q20 Margin (%) 8,757 9,800 9,412 10,823 -1,000 1,000 3,000 5,000 7,000 9,000 11,000 2019 2020 2019 2020 Inventory reduction of ~1,0M tons in 2020 741 1,339 1,326 1,043 1,250
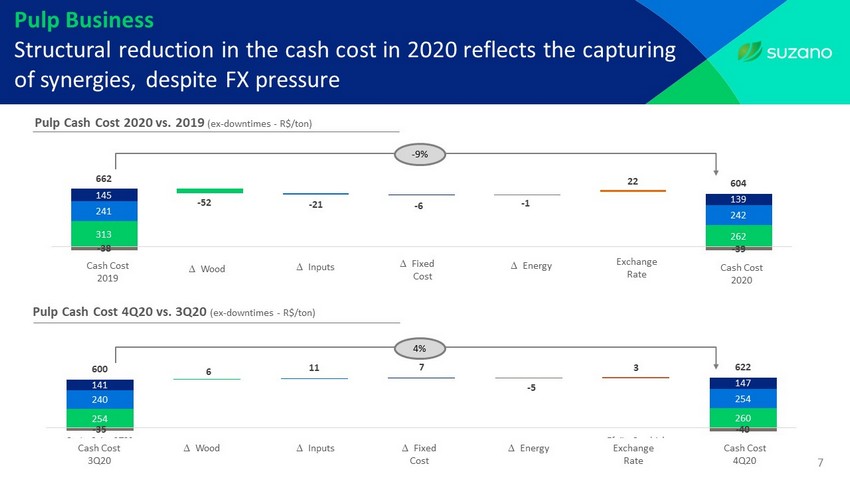
Pulp Business Structural reduction in the cash cost in 2020 reflects the capturing of synergies, despite FX pressure 313 - 52 262 241 - 21 242 145 - 6 139 - 38 - 1 - 39 662 22 604 -200 0 200 400 600 800 1,000 Custo Caixa 2019 Madeira Insumos Custo Fixo Energia Efeito câmbio Custo Caixa 2020 - 9% Pulp Cash Cost 2020 vs. 2019 (ex - downtimes - R$/ton) 7 Cash Cost 2019 Cash Cost 2020 Inputs Fixed Cost Energy Wood Exchange Rate Pulp Cash Cost 4Q20 vs. 3Q20 (ex - downtimes - R$/ton) 254 260 240 254 141 147 - 35 - 40 600 6 11 7 - 5 3 622 -200 0 200 400 600 800 1,000 Custo Caixa 3T20 Madeira Insumos Custo Fixo Energia Efeito Cambial Custo Caixa 4T20 Wood D D D Inputs Fixed Cost Energy Cash Cost 3Q20 Cash Cost 4Q20 4% Exchange Rate

Financial Management Liability management and continuous leverage reduction demonstrate financial discipline 8 Stand - by facilities Cash on hand 6 Average Cost (in US$): Amortization Schedule (US$ billion) 4.5% p.y . 86 months Net Debt (billion) and Leverage (in times) Average Term : 1 CETIP calculation methodology considers FX D - 1 R$ 5.20. | 2 Considers PTAX of R$ 5.42. 70% in US$ (vs. 59% in Sep /20) 13.4 12.2 12.3 54.1 68.7 63.7 0.0 2.0 4.0 6.0 8.0 10.0 12.0 14.0 16.0 18.0 20.0 Dez/19 Set/20 Dez/20 Coluna1 Dez/192 Set/202 Dez/204 Dec /19 5.0x 5.1x 4.3x 4.9x 4.4x 4.3x 3.00x 3.500x 4.00x 4.500x 5.00x 5.500x In US$ In R$ In US$ In R$ Sep /20 Dec /20 Dec /19 Sep /20 Dec /20 R$/US$ 4.03 5.20 - 1.1 +9.6 1.8 0.7 0.3 0.5 0.6 1.5 1.6 7.5 0.3 0.2 0.1 0.1 0.3 0.3 0.0 0.5 1.0 1.5 2.0 2.5 3.0 3.5 4.0 4.5 5.0 Liquidity 2021 2022 2023 2024 2025 2026 onward 90% total debt MTM Hedge 1 2.5 7.8 2.0 1.7 2.3 0.9 0.7 LM EPP = US$ 1.57 bi LM BNDES = US$ 0.27 bi 2
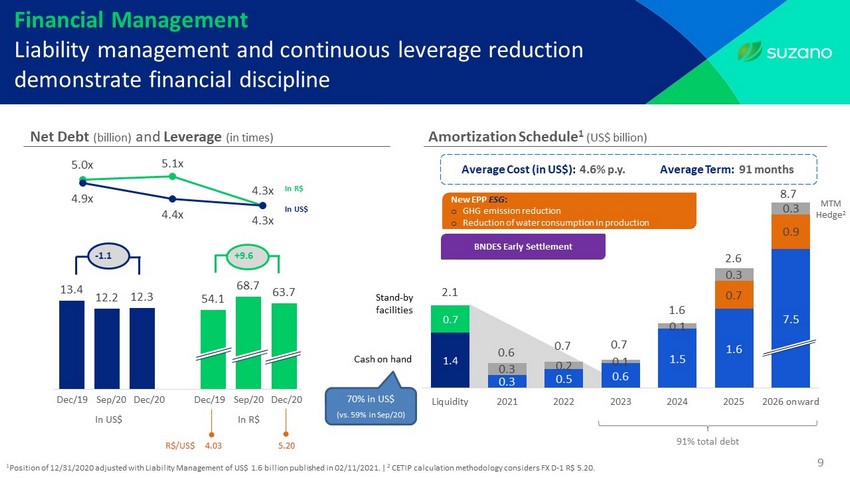
13.4 12.2 12.3 54.1 68.7 63.7 0.0 2.0 4.0 6.0 8.0 10.0 12.0 14.0 16.0 18.0 20.0 Dez/19 Set/20 Dez/20 Coluna1 Dez/192 Set/202 Dez/204 9 Financial Management Liability management and continuous leverage reduction demonstrate financial discipline 6 1 Position of 12/31/2020 adjusted with Liability Management of US$ 1.6 billion published in 02/11/2021. | 2 CETIP calculation methodology considers FX D - 1 R$ 5.20. Net Debt (billion) and Leverage (in times) Dec /19 In US$ In R$ In US$ In R$ Sep /20 Dec /20 Dec /19 Sep /20 Dec /20 R$/US$ 4.03 5.20 - 1.1 +9.6 Stand - by facilities Cash on hand 70% in US$ (vs. 59% in Sep /20) 6 Average Cost (in US$): Amortization Schedule 1 (US$ billion) 4.6% p.y . 91 months Average Term : 1.4 0.7 0.3 0.5 0.6 1.5 1.6 7.5 0.7 0.9 0.3 0.2 0.1 0.1 0.3 0.3 0.0 0.5 1.0 1.5 2.0 2.5 3.0 3.5 4.0 4.5 5.0 Liquidity 2021 2022 2023 2024 2025 2026 onward 8.7 2.6 0.7 New EPP ESG : o GHG emission reduction o Reduction of water consumption in production MTM Hedge 2 1.6 2.1 0.6 0.7 BNDES Early Settlement 91% total debt 5.0x 5.1x 4.3x 4.9x 4.4x 4.3x 3.00x 3.500x 4.00x 4.500x 5.00x 5.500x
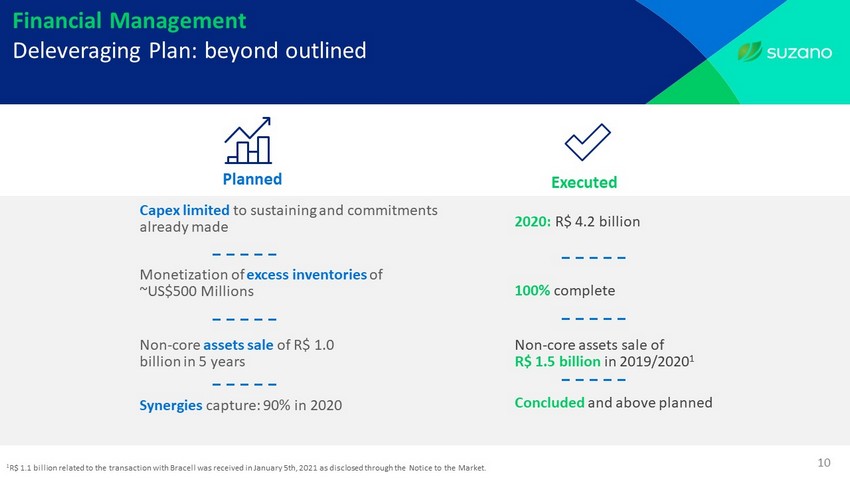
10 Financial Management Deleveraging Plan: beyond outlined Capex limited to sustaining and commitments already made Non - core assets sale of R$ 1.5 billion in 2019/2020 1 Non - core assets sale of R$ 1.0 billion in 5 years C oncluded and above planned Synergies capture: 90% in 2020 100% complete Monetization of excess inventories of ~US$500 Millions 2020: R$ 4.2 b illion Planned Executed 1 R$ 1.1 billion related to the transaction with Bracell was received in January 5th, 2021 as disclosed through the Notice to the Market.
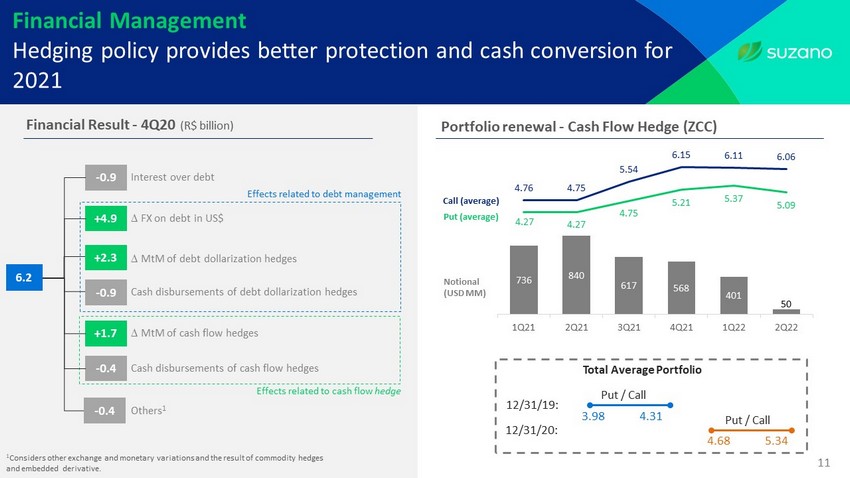
11 Financial Management Hedging policy provides better protection and cash conversion for 2021 Portfolio renewal - Cash Flow Hedge (ZCC) 736 840 617 568 401 50 4.27 4.27 4.75 5.21 5.37 5.09 4.76 4.75 5.54 6.15 6.11 6.06 1Q21 2Q21 3Q21 4Q21 1Q22 2Q22 Notional (USD MM) Put ( average ) Call ( average ) Financial Result - 4Q20 (R$ billion) - 0.9 +4.9 +1.7 - 0.4 - 0.9 6.2 +2.3 12/31/19: 12/31/20: 3.98 4.31 4.68 5.34 Total Average Portfolio Put / Call Put / Call Effects related to cash flow hedge Interest over debt D FX on debt in US$ D MtM of debt dollarization hedges D MtM of cash flow hedges Effects related to debt management Cash disbursements of debt dollarization hedges Cash disbursements of cash flow hedges Others 1 1 Considers other exchange and monetary variations and the result of commodity hedges and embedded derivative. - 0.4
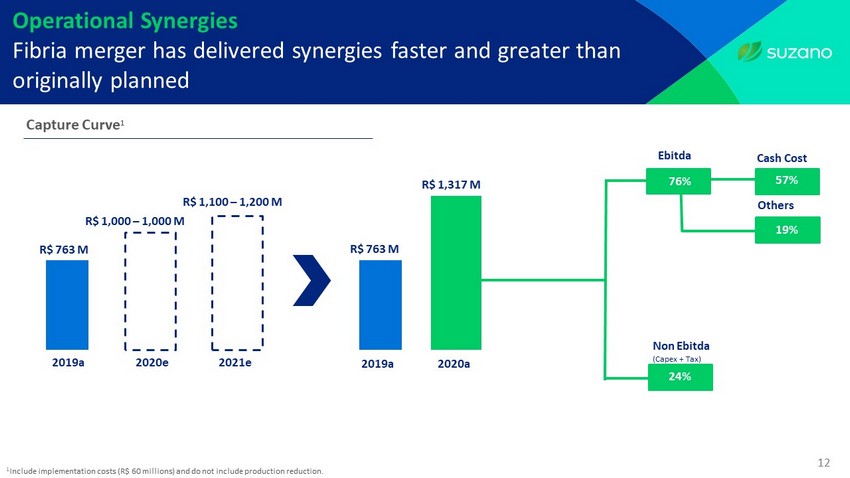
2019a R$ 763 M 2020e 2021e R$ 1,000 – 1,000 M R$ 1,100 – 1,200 M R$ 1,317 M 2020a 2019a Operational Synergies Fibria merger has delivered synergies faster and greater than originally planned R$ 763 M Ebitda Non Ebitda ( Capex + Tax ) Cash Cost Others 57% 19% 24% 76% 1 Include implementation costs (R$ 60 millions ) and do not include production reduction . 12 Capture Curve 1
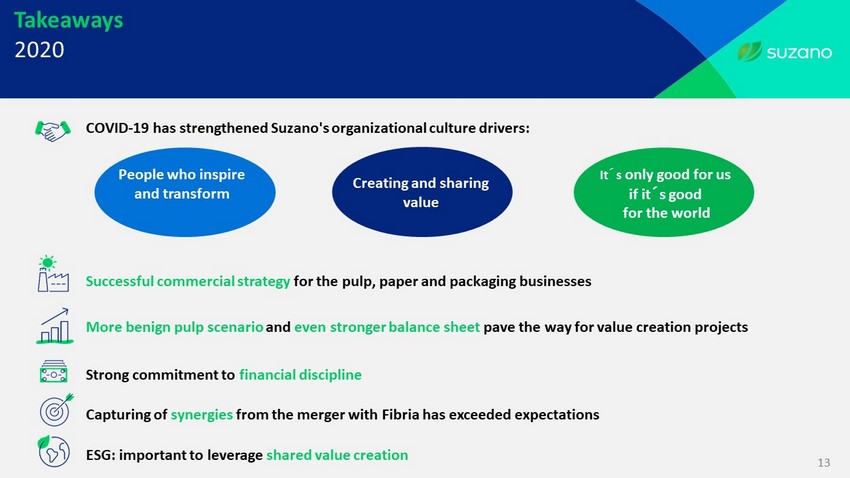
13 Takeaways 2020 COVID - 19 has strengthened Suzano's organizational culture drivers: Successful commercial strategy for the pulp, paper and packaging businesses Strong commitment to financial discipline Capturing of synergies from the merger with Fibria has exceeded expectations ESG: important to leverage shared value creation People who inspire and transform Creating and sharing value It ´ s only good for us if it ´ s good for the world More benign pulp scenario and even stronger balance sheet pave the way for value creation projects

Investor Relations www.suzano.com.br/ir ir@suzano.com.br Q&A