Exhibit 99.1

Adjusted EBITDA is the highest since 3Q186
Leverage in USD decreases to 3.8 times
São Paulo, May 12, 2021. Suzano S.A. (B3: SUZB3 | NYSE: SUZ), one of the world’s largest integrated pulp and paper producers, announces today its consolidated results for the 1st quarter of 2021 (1Q21).
HIGHLIGHTS
| • | Pulp sales of 2,653 thousand tons (-7% vs. 1Q20). |
| • | Paper sales of 291 thousand tons (+9% vs. 1Q20). |
| • | Adjusted EBITDA1 and Operating cash generation²: R$4.9 billion and R$3.9 billion, respectively. |
| • | Adjusted EBITDA1/ton3 from pulp of R$1,683/ton (+75% vs. 1Q20). |
| • | Adjusted EBITDA1/ton4 from paper of R$1,368/ton (+15% vs. 1Q20). |
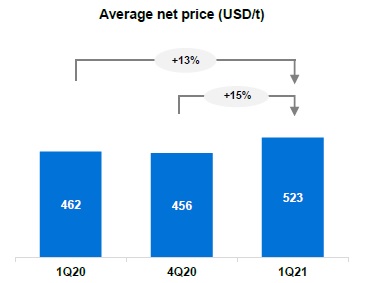
| • | Average net pulp price – export market: US$532/t (+14% vs. 1Q20). |
| • | Average net paper price4 of R$4,448/ton (+9% vs. 1Q20). |
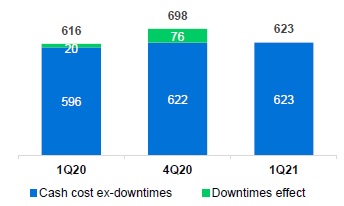
| • | Pulp cash cost ex-downtime of R$623/ton (+4% vs. 1Q20). |
| • | Leverage in USD decreased to 3.8 times. |
| • | Company obtains investment grade from Moody's, Fitch and S&P, revising the rating outlook to stable. |
| Financial Data (R$ million) | 1Q21 | 4Q20 | Δ Q-o-Q | 1Q20 | Δ Y-o-Y | LTM5 1Q21 |
| Net Revenue | 8,889 | 8,013 | 11% | 6,981 | 27% | 32,369 |
| Adjusted EBITDA1 | 4,864 | 3,965 | 23% | 3,026 | 61% | 16,788 |
| Adjusted EBITDA Margin1 | 55% | 49% | 5 p.p. | 43% | 11 p.p. | 52% |
| Adjusted EBITDA Margin¹ ex- Klabin3 | 55% | 49% | 5 p.p. | 44% | 8 p.p. | 52% |
| Net Financial Result | (8,667) | 6,238 | - | (22,444) | - | (12,309) |
| Net Income | (2,755) | 5,914 | - | (13,419) | - | (51) |
| Operating Cash Generation2 | 3,866 | 2,981 | 30% | 2,336 | 65% | 13,073 |
| Net Debt /Adjusted EBITDA1 (x) - R$ | 3.9 x | 4.3 x | -0.4 x | 6.0 x | -2.1 x | 3.9 x |
| Net Debt /Adjusted EBITDA1 (x) - US$ | 3.8 x | 4.3 x | -0.5 x | 4.8 x | -1.0 x | 3.8 x |
| Operational Data ('000 tons) | 1Q21 | 4Q20 | Δ Q-o-Q | 1Q20 | Δ Y-o-Y | LTM5 1Q21 |
| Sales | 2,944 | 3,017 | -2% | 3,124 | -6% | 11,820 |
| Pulp | 2,653 | 2,663 | 0% | 2,856 | -7% | 10,620 |
| Paper4 | 291 | 354 | -18% | 268 | 9% | 1,200 |
¹Excludes non-recurring items. | 2Excludes Klabin’s sales volume. | 3Considers Adjusted EBITDA less sustaining capex (cash basis). | 4Includes the results of Consumer Goods Unit. | 5Last 12 months. | 6Pro-forma.

1Q21 EARNINGS RELEASE |  |
The consolidated quarterly information has been prepared in accordance with the Securities and Exchange Commission (CVM) and Accounting Standards Committee (CPC) standards and is in compliance with International Accounting Standard (IFRS) issued by the International Accounting Standard Board (IASB). The data contained in this document was obtained from the financial information as made available to the CVM. The operating and financial information is presented based on consolidated numbers in Reais (R$). Summaries may diverge due to rounding. Non-financial data, such as volume, quantity, average price, average price, in Reais and Dollars, were not reviewed by independent auditors.
CONTENTS
| EXECUTIVE SUMMARY | 3 |
| PULP BUSINESS PERFORMANCE | 3 |
| PULP SALES VOLUME AND REVENUE | 3 |
| PULP CASH COST | 5 |
| PULP SEGMENT EBITDA | 6 |
| OPERATING CASH FLOW FROM THE PULP SEGMENT | 7 |
| PAPER BUSINESS PERFORMANCE | 8 |
| PAPER SALES VOLUME AND REVENUE¹ | 8 |
| OPERATING CASH FLOW FROM THE PAPER SEGMENT | 10 |
| ECONOMIC AND FINANCIAL PERFORMANCE | 10 |
| NET REVENUE | 10 |
| MAINTENANCE DOWNTIMES SCHEDULE | 11 |
| COST OF GOODS SOLD | 11 |
| SELLING EXPENSES | 11 |
| GENERAL AND ADMINISTRATIVE EXPENSES | 12 |
| ADJUSTED EBITDA | 12 |
| FINANCIAL RESULTS | 13 |
| DERIVATIVE OPERATIONS | 14 |
| NET INCOME (LOSS) | 17 |
| DEBT | 17 |
| CAPITAL EXPENDITURE | 19 |
| OPERATING CASH GENERATION | 20 |
| FREE CASH FLOW | 21 |
| COVID-19 | 21 |
| ESG | 23 |
| TOTAL OPERATIONAL EXPENDITURE - PULP | 23 |
| CAPITAL MARKETS | 23 |
| FIXED INCOME | 25 |
| RATINGS | 25 |
| UPCOMING EVENTS | 26 |
| IR CONTACTS | 26 |
| APPENDICES | 27 |
| APPENDIX 1 - Operating Data | 27 |
| APPENDIX 2 – Consolidated Statement of Income and Goodwill Amortization | 29 |
| APPENDIX 3 – Consolidated Balance Sheet | 30 |
| APPENDIX 4 – Consolidated Statement of Cash Flow | 31 |
| APPENDIX 5 - EBITDA | 32 |
| APPENDIX 6 - Segmented Income Statement | 33 |
| Forward-Looking Statements | 34 |
| Page 2 of 34 | |
1Q21 EARNINGS RELEASE | |
EXECUTIVE SUMMARY
The quarter was marked by the recovery of the pulp market and a significant improvement in market fundamentals, which drove the continuous recovery of prices, mainly in China and that will gradually be reflected in the Company's results. The pulp production cash cost, remained stable in relation to the previous quarter, which again shows the company's discipline in cost management. The paper business witnessed a gradual recovery in domestic demand, with growth in both the printing and writing and paperboard segments. These factors combined with the weaker BRL contributed to the adjusted EBITDA in the quarter reaching R$4.9 billion and operating cash generation of R$3.9 billion, being the highest levels since 3Q18, considering the pro-forma data of Suzano and former Fibria.
As for financial management, the Company once again reduced its net debt in USD and leverage, as measured by net debt/adjusted EBITDA in the last twelve months. Its liquidity position remained solid, representing zero refinancing risk until 2023. Suzano remains focused on financial discipline, which is evident from the clear and consistent policies implemented over time, and believes that, by doing so, it diligently plays its role of generating and sharing value in the long term. In this context, associated with prices recovery in the pulp market, in March, the Company also obtained the Investment Grade from Moody’s and the stable outlook with the 3 most important credit risk agencies in the world, with a rating of Baa3/Stable (Moody’s) and BBB- / Stable (S&P and Fitch).
On the ESG front, Suzano continued to work on several important initiatives. The company contracted a new export prepayment line in the form of a sustainability-linked loan (SLL) of US$1.57 billion, with performance indicators (KPIs) linked to targets for reducing greenhouse gas emissions and the industrial use of water. As for Long-Term Targets, for the first time the Company is preparing to report its achievements in 2020 when it publishes in May its Annual Sustainability Report with the indicators center. Finally, on June 25, the Company will hold its first ESG Call to further move forward on such an important agenda with its investors. On that event, we will take another step in our commitment to society and the planet by spreading the word a new Long-Term Target related to biodiversity.
PULP BUSINESS PERFORMANCE
PULP SALES VOLUME AND REVENUE
1Q21 was marked by strong demand for pulp in all the regions, accompanying the positive performance of the paper segments. Tissue consumption remained stable, driven by the sustained higher consumption of domestic use products to the detriment of corporate use products (“away-from-home”). Production of packaging paper remained high, especially that of paperboard and special papers, more notably decorative papers, with plants operating at full capacity, driven by higher spending on non-durable consumer goods, increased e-commerce penetration and the latent movement about the replacement of plastic. Demand for printing papers remained strong as well, enabling the Printing and Writing paper plants to maintain their operating rates high in the closing months of 2020, when demand is seasonally high.
In addition, the widening gap between softwood and hardwood pulp prices continued to drive a significant shift in the use of these fibers. According to PIX/FOEX, the difference between softwood and hardwood pulp prices at the end of the quarter was US$165/t in Europe and US$230/t in China.
On the supply side, the combination of unscheduled downtimes caused by severe winter in the Northern Hemisphere, technical problems at the plants in Europe and the continuation of logistics problems since the end of 2020 related to the limited availability of containers and traffic congestion at ports, contributed to the imbalance in market fundamentals, resulting in a generalized feeling of a market squeeze, particularly for softwood pulp.
In the first quarter of 2021, Suzano’s pulp sales totaled 2,653 thousand tons, stable in relation to 4Q20 and down 7% in relation to 1Q20.
| Page 3 of 34 | |
1Q21 EARNINGS RELEASE | |
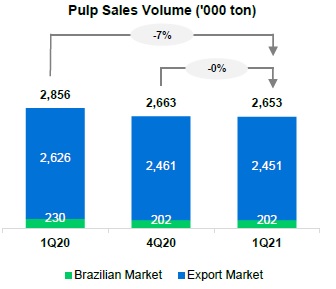
In the quarter, pulp was sold by Suzano at an average net price of US$523/ton, up US$67/t (+15%) from 4Q20 and US$61/ton (+13%) from 1Q20, reflecting the adjustment in global pulp prices. Average net pulp price in the export market was US$532/ton (compared to US$459/ton in 4Q20 and US$469/ton in 1Q20).
Average net price in BRL was R$2,862/ton in 1Q21, up 16% and 39% from 4Q20 and 1Q20, respectively, due to the depreciation of the BRL against the USD in the period and the price variations in the international market since the end of 2020.
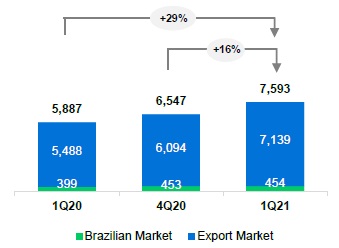
Net revenue from pulp was 16% higher than in 4Q20, mainly due to the higher net price in USD (+15%). Compared to 1Q20, revenue increased 29% thanks to better prices and the appreciation of the average USD compared to the BRL (+23%), despite the lower sales volume.
| Page 4 of 34 | |
1Q21 EARNINGS RELEASE | |
Pulp Net Revenues (R$ million)
PULP CASH COST
Cash cost excluding downtime in 1Q21 was R$623/t, stable in relation to 4Q20, due to: i) higher cost of wood due to the; and greater average radius of market wood, higher harvest and transportation costs due to higher diesel prices; ii) higher cost of chemicals due to higher consumption. These effects were offset by: i) lower fixed costs due to the absence of scheduled maintenance downtimes and the consequent reduction in expenses with materials and routine services; and ii) lower consumption of energy (especially natural gas and oil). The positive impact of the exchange rate, against the movement observed in the quarter, is related to the turnover effect of input inventories, which results from a delay of approximately one month between acquisition and consumption.
Consolidated Pulp Cash Cost ex- maintenance | Pulp Cash Cost (R$/ton) |
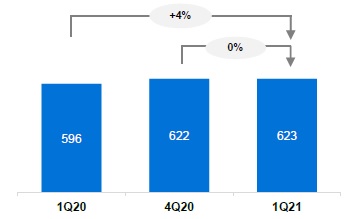 |  |
Consolidated Pulp Cash Cost ex-maintenance (R$/ton)1

¹Excludes the impact of maintenance and administrative downtimes.
| Page 5 of 34 | |
1Q21 EARNINGS RELEASE | |
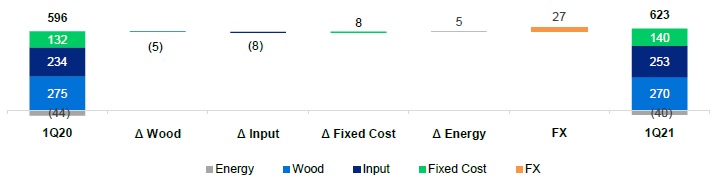
Cash cost excluding downtime in 1Q21 was 4% higher than in 1Q20, due to: i) the 23% appreciation in average USD against BRL (impact of R$27/t); ii) higher fixed costs due to the postponement of maintenance activities on account of the COVID-19 pandemic, partially offset by the higher production volume; and iii) decline in revenue from energy sales due to lower prices. These effects were partially offset by the lower cost of inputs, mainly due to the decline in energy prices (especially natural gas), despite the higher price of chemicals (mainly chlorine dioxide) and higher consumption, as well as lower wood prices, in turn due to lower transport costs, due to the reduction of the average distance in sections with higher logistics cost.
Consolidated Pulp Cash Cost ex-maintenance (R$/ton)1
¹Excludes the impact of maintenance and administrative downtimes.
| Cash Cost 1Q20¹ | Cash Cost 1Q19¹ |
 |  |
¹Based on cash cost excluding downtimes. Excludes energy sales.
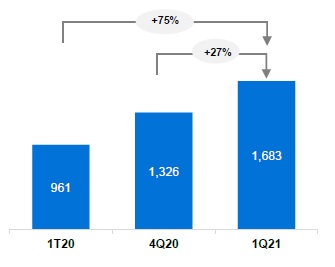
PULP SEGMENT EBITDA
| Pulp segment | 1Q21 | 4Q20 | Δ Q-o-Q | 1Q20 | Δ Y-o-Y | LTM 1Q21 |
| Adjusted EBITDA (R$ million) | 4,466 | 3,530 | 27% | 2,709 | 65% | 15,242 |
| Sales volume (k ton) | 2,653 | 2,663 | 0% | 2,818 | -6% | 10,620 |
| Pulp adjusted¹ EBITDA (R$/ton) | 1,683 | 1,326 | 27% | 961 | 75% | 1,435 |
¹ Excludes non-recurring items and PPA effects.
The 27% increase in Adjusted EBITDA from pulp in 1Q21 compared to 4Q20 mainly reflects the higher net average price in USD (15%), appreciation of average USD against BRL (1%) and lower administrative expenses, partially offset by higher cash COGS (in turn due to the increase in Brent on logistics costs, the effect of the turn on inventories and the appreciation of the average USD vs. the BRL). The 27% increase in EBITDA per ton is explained by the same factors.
| Page 6 of 34 | |
1Q21 EARNINGS RELEASE | |
Compared to 1Q20, the 65% increase in Adjusted EBITDA from pulp mainly reflects the 23% appreciation of average USD against BRL and 13% increase in average net price, which was partially offset by lower sales and higher SG&A expenses. Adjusted EBITDA per ton was 75% higher due to price and exchange factors, partially offset by the higher SG&A (in turn due to the increase in Brent, the appreciation of the average USD vs. the BRL and higher personnel expenses).
Adjusted EBITDA¹ (R$ million) and Adjusted EBITDA Margin (%) of Pulp | Pulp Adjusted EBITDA (R$/ton) |
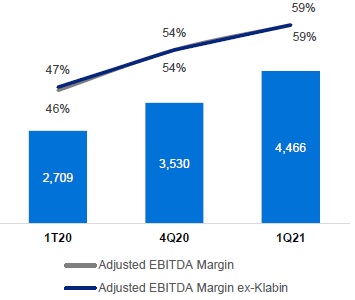 |  |
¹ Excludes non-recurring items and PPA effects.
OPERATING CASH FLOW FROM THE PULP SEGMENT
| Operating cash flow - Pulp (R$ million) | 1Q21 | 4Q20 | Δ Q-o-Q | 1Q20 | Δ Y-o-Y | LTM 1Q21 |
| Adjusted EBITDA1 | 4,466 | 3,530 | 27% | 2,709 | 65% | 15,242 |
| Maintenance Capex2 | (938) | (894) | 5% | (633) | 48% | (3,429) |
| Operating Cash Flow | 3,528 | 2,636 | 34% | 2,076 | 70% | 11,813 |
¹ Excludes non-recurring items and PPA effects.
² Cash basis.
Operating Cash Flow of Pulp per ton1 (R$/ton)
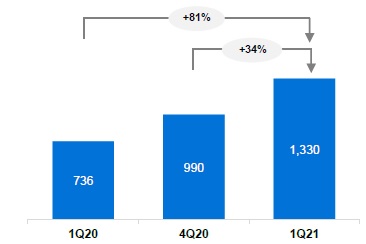
¹ Excludes sales volume related to the agreement with Klabin.
Operating cash generation per ton in the pulp segment increased 34% in 1Q21 from 4Q20, reflecting the increase in Adjusted EBITDA per ton. Compared to 1Q20, the 81% increase was also due to the increase in EBITDA per ton (as explained earlier), partially offset by the 48% increase in sustaining capex.
| Page 7 of 34 | |
1Q21 EARNINGS RELEASE | |
PAPER BUSINESS PERFORMANCE
The following data and analyses incorporate the joint results of the consumer goods and paper businesses.
PAPER SALES VOLUME AND REVENUE¹
According to data published by the Forestry Industry Association (Ibá), demand from the printing and writing in Brazil grew 13% in 1Q21 compared to 1Q20.
Driven by the high domestic demand for packaging paper, demand for paperboard in Brazil grew 25% in the 1Q21 compared to the same quarter in 2020. Consolidating both markets segments (Suzano accessible paper market), demand increased 17% in the 1Q21 compared to the same period in 2020. These numbers underline the trend of a gradual recovery of demand in the domestic market since July 2020, mainly fueled by the cardboard line, where the strong growth in demand in the period was due to a movement of restocking in the packaging production chain.
Even in the face of this recovery scenario, the current scenario of the pandemic in Brazil and new measures of socioeconomic restriction are risk factors for this recovery.
Suzano’s paper sales (printing and writing, paperboard and tissue) in Brazil totaled 201,000 tons in 1Q21, down 22% from 4Q20, due to the demand seasonality of these periods. Compared to 1Q20, domestic paper sales increased 10%, in line with the demand growth from the segment in the period. In 1Q21, we noticed growth in the demand for and the use of uncoated papers in applications such as the core, and as coating in these paper boxes. This phenomenon was due to the exponential growth of e-commerce in Brazil combined with the limited supply of paper shavings. We estimate that this application accounted for 12% of the domestic demand for P&W papers in 1Q21.
Likewise, due to seasonality, Suzano’s total paper sales declined 18% in 1Q21 compared to 4Q20. In relation to 1Q20, total paper sales grew 9%.
Paper sales in the international markets decreased 6% from 4Q20 but increased 6% from 1Q20. This volume corresponds to 31% of total sales volume in 1Q21.
| Paper Sales Volume ('000 ton)¹ | Average net paper price (R$/ton)¹ |
 | 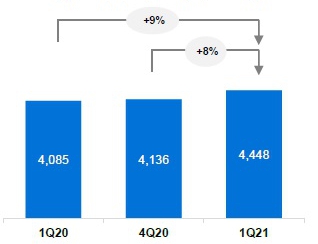 |
1Includes the Consumer Goods Unit.
Average net price stood at R$4,448/ton in 1Q21, increasing R$363/ton (+9%) from 1Q20, due to higher prices in the domestic market and the exchange rate effect on exports. Compared to 4Q20, the increase of R$312/ton (+8%) was due to the recovery in prices in both the domestic and export markets (in US$), as well as the exchange rate effect on exports.
| Page 8 of 34 | |
1Q21 EARNINGS RELEASE |  |
Net revenue from paper was R$1,296 million in 1Q21, up 18% from 1Q20, mainly reflecting the higher prices and sales pickup in the period. Compared to 4Q20, the 12% decrease was the result of the year-end seasonality, partially offset by the higher average net price.
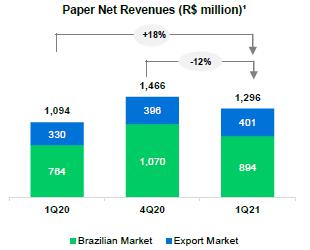
1Includes the Consumer Goods Unit.
PAPER SEGMENT EBITDA
| Paper segment | 1Q21 | 4Q20 | Δ Q-o-Q | 1Q20 | Δ Y-o-Y | LTM 1Q21 |
| Adjusted EBITDA (R$ million) | 399 | 435 | -8% | 318 | 25% | 1,545 |
| Sales volume (k ton) | 291 | 354 | -18% | 268 | 9% | 1,200 |
| Paper adjusted¹ EBITDA (R$/ton) | 1,368 | 1,227 | 11% | 1,186 | 15% | 1,288 |
¹ Excludes non-recurring items and PPA effects.
Adjusted EBITDA from paper in 1Q21 was R$399 million, down 8% from 4Q20, due to the seasonality of sales (decrease of 18% on volume sold). In the per ton comparison, however, the increase was due to the higher price, lower SG&A (lower personnel expenses) and appreciation of the average USD vs. the BRL.
In relation to 1Q20, Adjusted EBITDA from paper grew 25%, mainly due to higher sales (+23 thousand tons) and prices, and the 23% appreciation of average USD vs. BRL.
 |  |
| Page 9 of 34 | |
1Q21 EARNINGS RELEASE | |
OPERATING CASH FLOW FROM THE PAPER SEGMENT
| Operating cash flow - Paper (R$ million) | 1Q21 | 4Q20 | Δ Q-o-Q | 1Q20 | Δ Y-o-Y | LTM 1Q21 |
| Adjusted EBITDA1 | 399 | 435 | -8% | 318 | 25% | 1,545 |
| Maintenance Capex2 | (61) | (90) | -32% | (57) | 6% | (286) |
| Operating Cash Flow | 338 | 345 | -2% | 260 | 30% | 1,260 |
¹ Excluding non-recurring items.
² Cash basis.
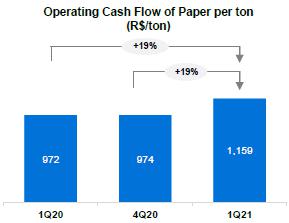
Operating cash generation per ton of paper in 1Q21 was R$1,159/t, up 19% from 4Q20 and 1Q20, due to the increase in adjusted EBITDA per ton.
ECONOMIC AND FINANCIAL PERFORMANCE
NET REVENUE
Suzano’s net revenue in 1Q21 was R$8,889 million, 85% of which came from exports (vs. 81% in 4Q20 and 83% in 1Q20). Compared to 4Q20, the 11% growth in net revenue was due to the higher net average price of pulp in USD and the 1% increase in average USD against the BRL, which was partially offset by the 2% decline in pulp sales volume. The 27% growth in consolidated net revenue in 1Q21 compared to 1Q20 is explained by the 23% increase in average USD vs. BRL and the 13% increase in net average pulp price in USD, which was partially offset by the 6% decline in pulp and paper sales volume.
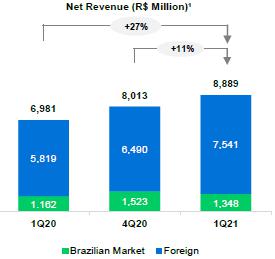 |  |
¹ Excludes service revenue from Portocel.
| Page 10 of 34 | |
1Q21 EARNINGS RELEASE | |
MAINTENANCE DOWNTIMES SCHEDULE
| Mill – Pulp Capacity | 2020 | 2021 | 2022 | ||||||||||||||
| 1Q20 | 2Q20 | 3Q20 | 4Q20 | 1Q21 | 2Q21 | 3Q21 | 4Q21 | 1Q22 | 2Q22 | 3Q22 | 4Q22 | ||||||
| Aracruz - Mill A (ES) – 590 kt | No downtime | ||||||||||||||||
| Aracruz - Mill B (ES) – 830 kt | No downtime | ||||||||||||||||
| Aracruz - Mill C (ES) – 920 kt | No downtime | ||||||||||||||||
| Imperatriz (MA)² – 1,650 kt | No downtime | ||||||||||||||||
| Jacareí (SP) – 1,100 kt | No downtime | ||||||||||||||||
| Limeira (SP)² – 690 kt | |||||||||||||||||
| Mucuri - Mill 1 (BA)² – 600 kt | No downtime | ||||||||||||||||
| Mucuri - Mill 2 (BA) – 1,130 kt | No downtime | ||||||||||||||||
| Suzano (SP)² – 520 kt | No downtime | ||||||||||||||||
| Três Lagoas - Mill 1 (MS) – 1,300 kt | No downtime | ||||||||||||||||
| Três Lagoas - Mill 2 (MS) – 1,950 kt | No downtime | ||||||||||||||||
| Veracel (BA)¹ – 560 kt | No downtime | ||||||||||||||||
¹ Veracel is a joint operation between Suzano (50%) and Stora Enso (50%) with total annual capacity of 1,120 thousand tons.
² Includes integrated capacities and fluff.
COST OF GOODS SOLD
| COGS (R$ million) | 1Q21 | 4Q20 | Δ Q-o-Q | 1Q20 | Δ Y-o-Y | LTM 1Q21 |
| COGS (Income statement) | 4,845 | 4,884 | -1% | 4,820 | 1% | 18,991 |
| Depreciation, depletion and amortization | 1,504 | 1,531 | -2% | 1,381 | 9% | 5,896 |
| Cash COGS | 3,341 | 3,353 | 0% | 3,439 | -3% | 13,096 |
| Sales volume | 2,944 | 3,017 | -2% | 3,124 | -6% | 11,820 |
| Cash COGS/ton (R$/ton) | 1,135 | 1,111 | 2% | 1,101 | 3% | 1,108 |
¹ Includes amortization of goodwill surplus/loss (PPA).
Cash COGS in 1Q21 totaled R$3,341 million, or R$1,135/ton. Compared to 4Q20, cash COGS remained stable due to higher Brent prices on logistic costs, higher production cost on paper business, the effect of inventories turnover and the appreciation of the average USD vs the BRL, despite the lower sales volume and absence of scheduled downtimes. On a per-ton basis, the 2% increase results from higher Brent prices and the foreign exchange effect.
Compared to 1Q20, cash COGS decreased 3%, mainly due to lower sales (-6%), partially offset by higher costs connected with higher prices of Brent on logistics costs, higher pulp and paper cash cost production and the 23% increase in average USD vs. BRL on freight. On a per-ton basis, cash COGS was 3% higher than in 1Q20 due to the price factor of Brent on logistics costs, production cost (pulp and paper) and exchange effect.
SELLING EXPENSES
| Selling expenses (R$ million) | 1Q21 | 4Q20 | Δ Q-o-Q | 1Q20 | Δ Y-o-Y | LTM 1Q21 |
| Selling expenses (Income Statement) | 582 | 590 | -1% | 515 | 13% | 2,241 |
| Depreciation, depletion and amortization1 | 236 | 205 | 15% | 234 | 1% | 908 |
| Cash selling expenses | 346 | 385 | -10% | 281 | 23% | 1,334 |
| Sales volume | 2,944 | 3,017 | -2% | 3,124 | -6% | 11,820 |
| Cash selling expenses/ton (R$/ton) | 118 | 128 | -8% | 90 | 31% | 113 |
¹ Includes amortization of goodwill surplus/loss (PPA)
| Page 11 of 34 | |
1Q21 EARNINGS RELEASE | |
Cash selling expenses decreased 10% in 1Q21 from 4Q20, mainly due to lower sales volume and lower fixed expenses (personnel expenses), partially offset by the appreciation of average USD against BRL and higher Brent prices. On a per-ton basis, cash selling expenses decreased 8%, mainly due to the reduction of fixed expenses, which was partially offset by the exchange effect on expenses in foreign currency and the impact of Brent.
Compared to 1Q20, the 23% increase in cash selling expenses is mainly explained by increased costs associated with higher Brent prices and the 23% increase in average USD vs. BRL, partially offset by lower sales. Cash selling expenses per ton increased 31% due to cost (related to Brent) and exchange factors.
GENERAL AND ADMINISTRATIVE EXPENSES
| General and Administrative Expenses (R$ million) | 1Q21 | 4Q20 | Δ Q-o-Q | 1Q20 | Δ Y-o-Y | LTM 1Q21 |
| General and Administrative Expenses (Income Statament) | 383 | 480 | -20% | 315 | 22% | 1,511 |
| Depreciation, depletion and amortization1 | 26 | 24 | 6% | 25 | 2% | 79 |
| Cash general and administrative expenses | 357 | 456 | -22% | 290 | 23% | 1,432 |
| Sales volume | 2,944 | 3,017 | -2% | 3,124 | -6% | 11,820 |
| Cash general and administrative expenses/t (R$/ton) | 121 | 151 | -20% | 93 | 31% | 121 |
¹ Includes amortization of goodwill surplus/loss (PPA).
² Inverse effect due to the write-off of PPA on contingencies (write-off of cases initially reassessed in the business combination).
Compared to 4Q20, the 22% decrease in cash general and administrative expenses is mainly due to the decline in personnel expenses (variable compensation) and third-party services. On a per-ton basis, there was a decrease of 20% due to the same factors.
Compared to 1Q20, cash general and administrative expenses increased 23%, mainly due to higher personnel expenses. On a per-ton basis, the 31% increase is explained by the same factors.
Other operating income (expenses) amounted to an income of R$517 million in 1Q21, compared to an income of R$323 million in 4Q20 and income of R$17 million in 1Q20. Compared to 4Q20, the variation is mainly the result of the sale of land and forests (as per the Notices to the Market disclosed on November 20, 2020 and January 5, 2021), partially offset by the absence of adjustment to fair value of biological assets (which occurs in the second and fourth quarters of each year). Compared to 1Q20, the variation is chiefly due to the transaction mentioned above.
ADJUSTED EBITDA
| Consolidated | 1Q21 | 4Q20 | Δ Q-o-Q | 1Q20 | Δ Y-o-Y | LTM 1Q21 |
| Adjusted EBITDA (R$ million)¹ | 4,864 | 3,965 | 23% | 3,026 | 61% | 16,788 |
| Adjusted EBITDA¹ Margin - ex-Klabin | 55% | 49% | 5 p.p. | 44% | 11 p.p. | 52% |
| Sales Volume ex-Klabin (k ton) | 2,944 | 3,017 | -2% | 3,086 | -5% | 11,820 |
| Adjusted EBITDA¹ ex-Klabin/ton (R$/ton) | 1,652 | 1,314 | 26% | 981 | 68% | 1,420 |
¹ Excludes non-recurring items and PPA effects.
The higher Adjusted EBITDA in 1Q21 compared to 4Q20 is explained by the 15% increase in average net pulp price, the appreciation of average USD against BRL (+1%) and the decrease in cash SG&A, partially offset by the lower sales volume and higher cash COGS, as detailed earlier. The 26% increase in EBITDA per ton is due to the exchange factors and lower SG&A.
Compared to 1Q20, the 61% increase in Adjusted EBITDA was mainly due to the 23% increase in average USD vs. BRL and higher net average pulp price (+13%), which were partially offset by the decline in sales volume (-6%) and the increase in SG&A. Adjusted EBITDA per ton rose 68% due to the price and exchange factors, partially offset by higher SG&A (due to the increase in Brent, the appreciation of the average USD vs. the BRL and higher personnel expenses).
| Page 12 of 34 | |
1Q21 EARNINGS RELEASE | |
FINANCIAL RESULTS
| Financial Result (R$ million) | 1Q21 | 4Q20 | Δ Q-o-Q | 1Q20 | Δ Y-o-Y | LTM 1Q21 |
| Financial Expenses | (991) | (974) | 2% | (1,086) | -9% | (4,364) |
| Interest on loans and financing (local currency) | (132) | (169) | -22% | (243) | -46% | (663) |
| Interest on loans and financing (foreign currency) | (626) | (594) | 5% | (643) | -3% | (2,887) |
| Capitalized interest1 | 0 | 1 | -46% | 4 | -89% | 7 |
| Other financial expenses | (233) | (212) | 10% | (204) | 14% | (822) |
| Financial Income | 24 | 66 | -63% | 121 | -80% | 231 |
| Interest on financial investments | 20 | 19 | 6% | 70 | -72% | 97 |
| Other financial income | 4 | 47 | -91% | 51 | -91% | 134 |
| Monetary and Exchange Variations | (5,206) | 4,464 | - | (12,420) | - | (5,318) |
| Foreign exchange variations (Debt) | (5,598) | 4,850 | - | (13,188) | - | (5,775) |
| Other foreign exchange variations | 391 | (387) | - | 768 | -49% | 458 |
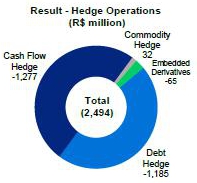
| Derivative income (loss), net2 | (2,494) | 2,683 | - | (9,059) | -72% | (2,858) |
| Cash flow hedge | (1,277) | 1,331 | - | (3,361) | -62% | (1,085) |
| Debt hedge | (1,185) | 1,430 | - | (5,871) | -80% | (1,585) |
| Others3 | (32) | (78) | - | 174 | - | (189) |
| Net Financial Result | (8,667) | 6,238 | - | (22,444) | - | (12,309) |
¹ Capitalized interest due to construction in progress.
2 Variation in mark-to-market adjustment (1Q21: -R$8,557 million | 4Q20: -R$6,776 million), plus adjustments paid and received (1Q21: -R$713 million).
³ Includes commodity hedging and embedded derivatives.
Financial expenses totaled R$991 million in 1Q21, up 2% from 4Q20, mainly due to the appreciation of 10% in the USD against the closing BRL, partially offset by the payment of debt in USD and the drop in the 3M LIBOR rate, one of the main indexers of the floating portion of financial expenses. Compared to 1Q20, the decrease was 9% due to the reduction on financial expense in BRL from the early repayment of debt, such as with BNDES, FDCO and BNB, and the maturities of Agribusiness Receivables Certificates (CRA) in the period.
Financial income decreased by 63% compared to 4Q20, mainly as a result of the decrease in revenue from goodwill resulting from the merger of Fibria, which was fully amortized during 2020. This same factor impacted the decrease of 80% in relation to 1Q20, which is also explained by the drop in the CDI rate (main index of the Company's financial investments).
Inflation adjustment and exchange variation had a negative impact of R$5,598 million on the Company’s financial result in the quarter due to the 10% appreciation of the closing USD rate against BRL on the foreign currency portion of debt (82% of total debt). Note that the accounting impact of exchange variation on foreign currency debt has a cash impact only on the respective maturities.
Derivative operations generated a loss of R$2,494 million in 1Q21, mainly due to the effect of the weaker BRL on debt hedge and cash flow transactions. There also was an impact caused by the variations in the fixed, coupon and Libor rate curves on the transactions. The mark-to-market adjustment of derivative instruments on March 31, 2021 was a loss of R$8,557 million, compared to a loss of R$6,776 million on December 31, 2020, representing a negative variation of R$1,781 million. Note that the impact of BRL depreciation on the derivatives portfolio generates a cash impact only upon the respective maturities. The net effect on cash, which refers to the maturity of derivative operations in the first quarter, was a negative R$713 million (R$135 million expense from debt hedge and R$578 million expense from operating and commodity hedge).
Due to the above factors, net financial result in 1Q21, considering all expense and financial income lines, was an expense of R$8,667 million, compared to an income of R$6,238 million in 4Q20 and an expense of R$22,444 million in 1Q20.
| Page 13 of 34 | |
1Q21 EARNINGS RELEASE | |
DERIVATIVE OPERATIONS
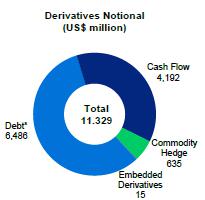
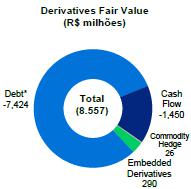
Suzano carries out derivative operations exclusively for hedging purposes. The following table reflects the position of derivative instruments on March 31, 2021:
| Hedge1 | Notional (US$ million) | Fair Value (R$ million) | ||
| Mar/2021 | Dec/2020 | Mar/2021 | Dec/2020 | |
| Debt | 6,486 | 6,584 | (7,424) | (6,374) |
| Cash Flow | 4,192 | 3,292 | (1,450) | (773) |
| Others2 | 650 | 684 | 317 | 371 |
| Total | 11,329 | 10,560 | (8,557) | (6,776) |
¹ Refer to note 4 of the 1Q21 Quarterly Financial Statements (ITR) for further details and fair value sensitivity analysis.
2 Includes commodity hedge and embedded derivatives.
The Company’s financial policy seeks to minimize the volatility of its cash generation and to impart greater flexibility to cash flow management. Currently, the policy stipulates that surplus dollars may be partially hedged (minimum of 40% up to 75% of exchange variation exposure over the next 18 months) using plain vanilla instruments, such as Zero Cost Collars (ZCC) and Non-Deliverable Forwards (NDF).
ZCC transactions establish minimum and maximum limits for the exchange rate that minimize adverse effects in the event of significant appreciation in the BRL. If the exchange rate is within such limits, the Company neither pays nor receives any financial adjustments. Therefore, the Company is protected in scenarios of extreme BRL appreciation. However, these transactions also limit potential gains in scenarios of extreme BRL depreciation. This characteristic allows for capturing greater benefits from export revenue in a potential scenario of USD appreciation within the range contracted.
On March 31, 2021, the outstanding notional value of operations involving forward USD sales through ZCCs was US$4,112 million, whose maturities are distributed from April 2021 to August 2022, with an average forward rate ranging from R$5.00 to R$5.73. On the same date, the outstanding notional value of operations involving forward USD sales through NDFs was US$80 million, whose maturities are distributed between October 2021 and March 2022 and with an average rate of R$5.36. Cash flow hedge operations in 1Q21 resulted in a loss of R$1,277 million. The mark-to-market adjustment (fair value) of ZCC transactions was a loss of R$1,420 million and for NDFs was a loss of R$30 million at the end of the quarter.
The following table presents a sensitivity analysis of the cash impact that the Company could have on its cash flow hedge portfolio (ZCC and NDF) if the future exchange rate remains the same as at the end of 1Q21 (R$/US$ = 5.70) in the coming quarters; as well as the projected variation in cash impact for each R$0.10 variation on the same reference exchange rate (1Q21). Note that the figures presented in the table are the Company’s projections based on the end-of-period curves and could fluctuate depending on market conditions.
| Page 14 of 34 | |
1Q21 EARNINGS RELEASE | |
| Cash adjustment (R$ million) | |||||
| Maturity (up to) | Strike Range | Notional (US$ million) | Actual | R$ / US$ = 5.70 (1Q21) | Sensitivity at R$ 0.10 / US$ variation (+/-)1 |
| Zero Cost Collars | |||||
| 1Q21 | - | - | (599) | - | - |
| 2Q21 | 4.34 - 4.84 | 905 | - | (830) | (90) |
| 3Q21 | 4.87 - 5.67 | 807 | - | (246) | (81) |
| 4Q21 | 5.21 - 6.12 | 929 | - | - | (90) |
| 1Q22 | 5.37 - 6.11 | 571 | - | - | (57) |
| 2Q22 | 5.29 - 6.03 | 736 | - | - | (74) |
| 3Q22 | 5.39 - 6.06 | 165 | - | - | (17) |
| Total | 5.00 - 5.73 | 4,112 | (599) | (1,076) | (408) |
| NDF | |||||
| 1Q21 | - | - | 0 | - | - |
| 2Q21 | - | - | - | - | 0 |
| 3Q21 | 5.33 | 50 | - | (18) | (5) |
| 4Q21 | - | - | - | 0 | |
| 1Q22 | 5.42 | 30 | - | (8) | (3) |
| 2Q22 | - | - | - | 0 | |
| 3Q22 | - | - | - | - | 0 |
| Total | 5.36 | 80 | 0 | (27) | (8) |
¹ Note: sensitivity of adjustments for exchange rates above the strike.
The Company also uses currency and interest rate swaps to mitigate the effects of exchange and interest rate variations on its debt and its cash flow. Contracts swapping different interest rates and inflation indexes may be entered into as a way to mitigate the mismatch between financial assets and liabilities.
On March 31, 2021, the Company held US$6,486 million (notional value) in swaps, distributed as in the table below. In 1Q21, the result of debt hedge transactions was a loss of R$1,185 million, mainly due to the BRL depreciation in the period. The mark-to-market (fair value) of such operations was negative by R$7,424 million at the end of the quarter.
| Notional (US$ million) | Fair value (R$ million) | |||||
| Debt Hedge | Maturity (up to) | Currency | Mar/2021 | Dec/2020 | Mar/2021 | Dec/2020 |
| Swap (PRÉ x USD) | 2024 | USD | 350 | 350 | (786) | (508) |
| Swap (CDI x USD) | 2026 | USD | 2,267 | 2,267 | (5,912) | (4,977) |
| Swap (IPCA x USD) | 2023 | USD | 121 | 121 | (179) | (115) |
| Swap (LIBOR x USD) | 2026 | USD | 3,600 | 3,683 | (827) | (1,059) |
| Swap (IPCA x CDI) | 2023 | BRL | 148¹ | 162 | 280 | 286 |
| Total | 6,486 | 6,584 | (7,424) | (6,374) | ||
1Translated at the closing exchange rate (5.70).
The following table presents a sensitivity analysis¹ of the cash impact that the Company could have on its debt hedge portfolio (swaps) if the future exchange rate remains the same as at the end of 1Q21 (R$/US$ = 5.70) in the coming quarters; as well as the projected variation in cash impact for each R$0.10 variation on the same reference exchange rate (1Q21). Note that the figures presented in the table are the Company’s projections based on the end-of-period curves and could fluctuate depending on market conditions.
| Page 15 of 34 | |
1Q21 EARNINGS RELEASE | |
| Cash adjustment (R$ million) | ||||
| Maturity (up to) | Notional (US$ million) | Actual | R$ / US$ = 5.70 (1Q21) | Sensitivity at R$ 0.10 / US$ variation (+/-)1 |
| 1Q21 | (135) | |||
| 2Q21 | 83 | - | (226) | (7) |
| 3Q21 | 83 | - | (138) | (4) |
| 4Q21 | 83 | - | (198) | (7) |
| 2022 | 737 | - | (1,148) | (60) |
| 2023 | 2,166 | - | (454) | (49) |
| 2024 | 1,331 | - | (514) | (45) |
| 2025 | 1,156 | - | (1,442) | (89) |
| >2026 | 845 | - | (1,520) | (83) |
| Total | 6,486 | (135) | (5,639) | (343) |
¹Sensitivity analysis considers variation only in the exchange rate (R$/US$), while other variables are presumed constant.
Other transactions involving the Company’s derivatives are related to the embedded derivative resulting from the forestry partnerships and commodity hedges (maritime fuel), as follows.
Notional (US$ million) | Fair value (R$ million) | Cash adjustment (R$ million) | ||||||
| Other hedges | Maturity (up to) | Index | Mar/2021 | Dec/2020 | Mar/2021 | Dec/2020 | 1Q21 | 4Q20 |
| Embedded derivative | 2035 | Fixed USD | USD US-CPI | 635 | 646 | 290 | 355 | - | - |
| Commodities | 2021 | Brent/VLSFO | 15 | 38 | 26 | 16 | 22 | (23) |
| Total | 650 | 684 | 317 | 371 | 22 | (23) | ||
Forestry partnership agreements and wood supply agreements signed on December 31, 2013 by Fibria Celulose S.A. are denominated in USD per cubic meter of standing wood, adjusted by U.S. inflation measured by the Consumer Price Index (CPI), which is not related to inflation in the economic environment where the forests are located and, hence, constitutes an embedded derivative. This instrument, which is presented in the table above, consists of a swap contract with the short leg consisting of the variations in the US-CPI during the period of the agreements mentioned below. See note 4 of the 1Q21 Financial Statements for more details and for a sensitivity analysis of the fair value in case of a sharp rise in the U.S. CPI. On March 31, 2021, the outstanding amount (notional) of the operation was US$635 million. The result from the swap in 1Q21 was a loss of R$65 million. The mark-to-market (fair value) adjustment of these operations generated a gain of R$290 million at the end of the quarter.
The Company is also exposed to international Brent prices, which is reflected in the logistics costs involved in exports and in certain inputs. In this case, the Company analyzes the contracting of derivative financial instruments to mitigate the risk.
On March 31, 2021, the outstanding amount (notional) of the operation was US$15 million. The result from this swap in 1Q21 was a gain of R$32 million. The mark-to-market (fair value) adjustment of these operations generated a gain of R$26 million at the end of the quarter.
| Page 16 of 34 | |
1Q21 EARNINGS RELEASE | |
 |  |  |
*Debt in BRL translated into USD at the closing exchange rate of the month (R$/US$5.70 on 03/31/2021).
NET INCOME (LOSS)
In 1Q21, the Company posted net loss of R$2,755 million, compared to net income of R$5,914 million in 4Q20 and net loss of R$13,419 million in 1Q20. The variation in relation to 4Q20 is explained by the negative financial result which, in turn, is due to the effects of exchange variation on debt and the results from derivative transactions, partially offset by higher operating income. Compared to 1Q20, the increase of R$10,664 million in net income mainly reflects the growth in financial income (lower impact from negative exchange variation on debt and derivatives) and better operating income.
DEBT
| Debt (R$ million) | 03/31/2021 | 12/31/2020 | Δ Y-o-Y | 03/31/2020 | Δ Q-o-Q |
| Local Currency | 13,295 | 14,740 | -10% | 18,108 | -27% |
| Short Term | 1,027 | 541 | 90% | 3,552 | -71% |
| Long Term | 12,268 | 14,199 | -14% | 14,556 | -16% |
| Foreign Currency | 62,619 | 58,160 | 8% | 57,674 | 9% |
| Short Term | 1,117 | 1,503 | -26% | 2,972 | -62% |
| Long Term | 61,503 | 56,657 | 9% | 54,702 | 12% |
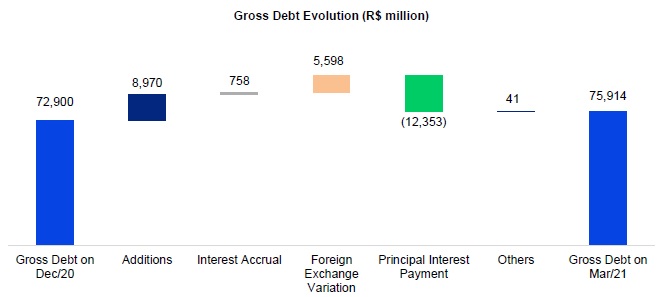
| Gross Debt | 75,914 | 72,900 | 4% | 75,782 | 0% |
| (-) Cash | 9,599 | 9,232 | 4% | 9,739 | -1% |
| Net debt | 66,315 | 63,668 | 4% | 66,043 | 0% |
| Net debt/Adjusted EBITDA1(x) - R$ | 3.9x | 4.3x | -0.4x | 6.0x | -0.8x |
| Net debt/Adjusted EBITDA1(x) - US$ | 3.8x | 4.3x | -0.5x | 4.8x | -0.1x |
¹ Excluding non-recurring items.
Gross debt on March 31, 2021 amounted to R$75.9 billion, composed of 97% long-term maturities and 3% short-term maturities. Debt denominated in foreign currency accounted for 82% of the Company's total debt, while debt in local currency accounted for the remaining 18%. The percentage of gross debt denominated in foreign currency, considering the effect of debt hedge, was 97%. Gross debt grew 8% from 4Q20 (R$3.0 billion) due to the appreciation of USD vs BRL, partially offset by the settlements related to Liability Management.
Suzano contracts debt in foreign currency debt as a natural hedge, since net operating cash generation is denominated in foreign currency (U.S. dollar) due to its predominant status as an exporter. This structural exposure allows the Company to match loans and financing payments in USD with receivable flows from sales.
| Page 17 of 34 | |
1Q21 EARNINGS RELEASE | |
*Corresponding mainly to transaction costs (issue, funding etc.) and impacts from goodwill resulting from the operation with Fibria.
On March 31, 2021, the total average cost of debt in USD was 4.5% p.a. (debt in BRL adjusted by the market swap curve), compared to 4.5% p.a. on December 31, 2020. The average term of consolidated debt at the end of the quarter was 90 months (86 months in December 2020).
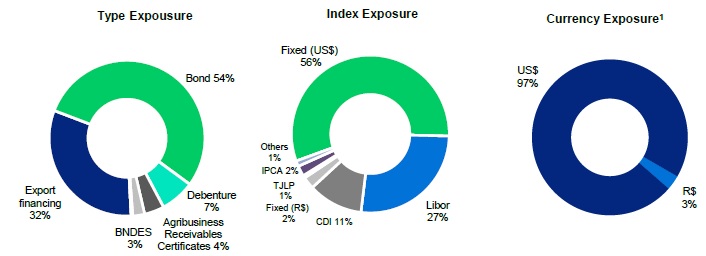
¹ Considers the portion of debt with currency swaps. The original debt was 82% denominated in USD and 18% in BRL.
Cash and cash equivalents on March 31, 2021 amounted to R$9,599 million, 54% of which was invested in foreign currency fixed-income and short-term investments. The local currency portion was invested in government and fixed-income bonds, remunerated at a percentage of the DI rate.
The company has two standby credit facilities totaling R$3,849 million – one in Brazilian real for R$1 billion and available until Jun/2021 and another for US$500 million available until Feb/2024. These facilities help improve the company's liquidity position and can be withdrawn during times of uncertainty, such as during the first half of 2020, when the COVID-19 pandemic broke out. As a result, the current cash position of R$9,599 million plus the available facilities described above, amount to a readily available cash position of R$13,448 million.
| Page 18 of 34 | |
1Q21 EARNINGS RELEASE | |
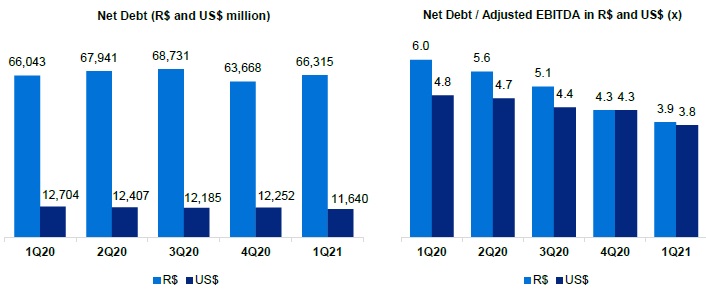
On March 31, 2021, net debt stood at R$66.3 billion (US$11.6 billion), compared to R$63.7 billion (US$12.3 billion) on December 31, 2020. The biggest impact on net debt in local currency came from the exchange variation during the period.
Financial leverage, measured by the ratio of net debt to Adjusted EBITDA in BRL, stood at 3.9 times on March 31, 2021, compared to 4.3 times at the end of 4Q20. The same ratio in USD, a measure established in Suzano’s financial policy, fell to 3.8 times on March 31, 2021, from 4.3 times in 4Q20.

The breakdown of gross debt between trade finance and non-trade finance on March 31, 2021 is shown below:
| 2021 | 2022 | 2023 | 2024 | 2025 | 2026 onward | Total | |
| Trade Finance¹ | 56% | 38% | 50% | 75% | 64% | 13% | 32% |
| Non Trade Finance² | 44% | 62% | 50% | 25% | 36% | 87% | 68% |
¹ ACC, ACE, NCE, PPE
² Bonds, BNDES, CRA, Debentures, among others.
CAPITAL EXPENDITURE
In 1Q21, capital expenditure (cash basis) totaled R$1,323 million, up 13% from 4Q20, mainly due to higher expenses with land, forests and port terminals (higher spending on the Maranhão port project), partially offset by lower expenses with expansion and modernization. Compared to 1Q20, capex increased 52%, with higher maintenance investments (mainly in forestry maintenance, especially for the acquisition of standing wood), higher investment in land and forests, industrial maintenance and port terminals.
| Page 19 of 34 | |
1Q21 EARNINGS RELEASE | |
Capex in 2021 was updated to R$6.2 billion (from R$4.9 billion), due to the expansion capex related to Cerrado Project in the amount of R$957 million, which represents the expected cash disbursement for investments “inside the fence” (industrial, infrastructure and indirect) in 2021. In addition, the Company foresees an additional capex in Land and Forestry corresponding to R$326 million, which may be used to supply the new industrial plant in Ribas do Rio Pardo or destined for the current plant in Três Lagoas.
| Investments (R$ million) | 1Q21 | 4Q20 | Δ Q-o-Q | 1Q20 | Δ Y-o-Y | LTM 1Q21 | Guidance 2021 |
| Maintenance | 999 | 984 | 1% | 690 | 45% | 3,715 | 4,038 |
| Industrial maintenance | 149 | 271 | -45% | 76 | 98% | 681 | 829 |
| Forestry maintenance | 845 | 686 | 23% | 594 | 42% | 2,966 | 3,076 |
| Others | 5 | 28 | -82% | 20 | -76% | 67 | 133 |
| Expansion and modernization | 27 | 80 | -66% | 41 | -34% | 228 | 240 |
| Land and forestry | 186 | 70 | 166% | 77 | 141% | 474 | 752 |
| Port terminals | 93 | 17 | 447% | 46 | 101% | 167 | 152 |
| Maintenance | 19 | 22 | -16% | 19 | -3% | 90 | 79 |
| Cerrado Project | - | - | - | - | - | - | 1,323 |
| Total | 1,323 | 1,173 | 13% | 873 | 52% | 4,675 | 6,218 |
OPERATING CASH GENERATION
| Operating cash flow - Consolidated (R$ million) | 1Q21 | 4Q20 | Δ Q-o-Q | 1Q20 | Δ Y-o-Y | LTM 1Q21 |
| Adjusted EBITDA1 | 4,864 | 3,965 | 23% | 3,026 | 61% | 16,788 |
| Maintenance Capex2 | (999) | (984) | 1% | (690) | 45% | (3,715) |
| Operating Cash Flow | 3,866 | 2,981 | 30% | 2,336 | 65% | 13,073 |
| Operating Cash Flow (R$/ton) | 1,313 | 988 | 33% | 757 | 73% | 1,106 |
¹ Excludes non-recurring items and PPA effects.
² Cash basis.
³ Excludes sales volume from Klabin.
Operating cash generation, measured by Adjusted EBITDA less sustaining capex (cash basis), amounted to R$3,866 million in 1Q21. The 30% increase from 4Q20 reflects the higher EBITDA, as explained earlier. The increase in operating cash generation per ton compared to 4Q20 is related to the growth of EBITDA per ton. The 65% increase in relation to 1Q20 is related to the EBITDA growth mentioned earlier, partially offset by higher sustaining capex. On a per-ton basis, the 73% increase is due to the higher adjusted EBITDA per ton.

| Page 20 of 34 | |
1Q21 EARNINGS RELEASE | |
FREE CASH FLOW
| Free Cash Flow (R$ million) | 1Q21 | 4Q20 | Δ Q-o-Q | 1Q20 | Δ Y-o-Y | LTM 1Q21 |
| Adjusted EBITDA | 4,864 | 3,965 | 23% | 3,026 | 61% | 16,788 |
| (-) Total Capex¹ | (969) | (1,710) | -43% | (878) | 10% | (4,988) |
| (+/-) ▲ Working capital | (518) | 717 | - | (336) | - | 2,082 |
| (-) Net interest | (1,194) | (321) | 272% | (1,115) | 7% | (3,516) |
| (-) Income taxes | (35) | (58) | -40% | (29) | 21% | (195) |
| (-) Dividend payment | 0 | 0 | - | 0 | - | 0 |
| Free cash flow | 2,149 | 2,592 | -17% | 668 | 222% | 10,171 |
| (+) Capex ex-maintenance | 101 | 259 | -61% | 203 | -51% | 682 |
| (+) Dividend payment | 0 | 0 | - | 0 | - | 0 |
| Free cash flow - Adjusted | 2,249 | 2,851 | -21% | 871 | 158% | 10,853 |
| (-) Derivative cash adjustment | (713) | (1,318) | - | (173) | 312% | (5,005) |
| Free cash flow - Adjusted - after derivatives² | 1,537 | 1,533 | 0% | 699 | 120% | 5,847 |
¹ Accrual basis.
² Free cash flow prior to dividend payments and capex ex-maintenance (accrual basis).
Free cash flow considering the adjustment for derivatives stood at R$1,537 million in 1Q21, compared to R$1,533 million in 4Q20 and R$699 million in 1Q20. Compared to the previous period, free cash flow remained stable, given that the increase in adjusted EBITDA, combined with a decline in sustaining capex (accrual basis) and lower disbursement with derivatives, were offset by the decline in working capital (especially accounts receivable, largely impacted by the increase in average net pulp price) and higher net interest (due to higher concentration of payments in 1Q21, mainly related to bonds).
In relation to 1Q20, the increase of 120% was due to the 61% growth in Adjusted EBITDA, partially offset by higher disbursement related to derivative adjustments, higher sustaining capex and decline in working capital variation.
COVID-19
With the onset of the COVID-19 pandemic, Suzano adopted and has maintained preventive and mitigatory measures in compliance with the rules and policies established by domestic and international health authorities to minimize the impacts of the COVID-19 pandemic on the safety of people, society and its business.
The Company’s actions are based on three pillars: (1) People; (2) Society; (3) Business Continuity.
| (1) | People: To ensure the safety of its employees and contractors who work in its operations, Suzano adopted a series of measures to mitigate their exposure and/or mitigate the risks of exposure. |
| (2) | Society: One of Suzano’s three culture drivers is “It's only good for us if it's good for the world.” Accordingly, from the onset of the pandemic till now, the Company has taken a series of measures to protect society, including: |
| ● | Donation of tissue paper, napkins and disposable diapers produced by it to needy regions. |
| ● | Acquisition of 159 ventilators and 1 million medical masks for donation to the federal and state governments. |
| ● | Participation in a joint effort with Positivo Tecnologia, Klabin, Flextronics and Embraer to support the Brazilian company Magnamed in manufacturing ventilators, which were delivered to the Brazilian government. In this action, Suzano invested R$9.6 million in 2020. |
| Page 21 of 34 | |
1Q21 EARNINGS RELEASE | |
| ● | Construction of a field hospital in Teixeira de Freitas, Bahia, jointly with Veracel, which was delivered to the state government and inaugurated in July 2020. |
| ● | Partnership with the vocational school Fatec in Capão Bonito to produce hand sanitizer. |
| ● | Forklifts lent to transport the donations received by the Red Cross. |
| ● | Maintenance of all direct jobs. |
| ● | Maintenance for 90 days (until the end of June 2020) the payment of 100% of the payroll expenses of employees of service providers whose operations were suspended because of the pandemic, in order to protect jobs. |
| ● | Creation of a support program for small suppliers, a social program to help small farmers sell their produce via a home delivery system in 38 communities assisted by Suzano’s Rural Land Development Program (“PDRT”) in five states, and a social program to produce 125,000 masks in local communities for donation in five states. |
| ● | Launch of a support program for small and midsized paper clients called “We’re Together” to ensure that these companies have the financial and managerial capacity to resume operations. |
| ● | Support for the State Government of Maranhão in setting up the Imperatriz field hospital, donating R$2 million. |
| ● | Supply of 280,000 m³ of oxygen to the State of Amazonas. |
| ● | Construction of a new treatment center for COVID-19 in São Paulo in partnership with Gerdau, BTG Pactual, Península Participações and through joint efforts with Hospital Israelita Albert Einstein and the Municipal Government of São Paulo. |
Donations made in support of social actions implemented by Suzano totaled R$4.6 million thousand in the quarter ended March 31, 2021, (see Note 29 – Result by Nature to the Financial Statements).
| (3) | Business continuity: to date, the Company is maintaining its operations normally and has set up a crisis management committee that continues to function. |
The pulp and paper sector was recognized by the World Health Organization (WHO) and diverse countries as a producer of essential goods for society. Hence, to meet the responsibility arising from the essential nature of its business, Suzano took measures to ensure, to the maximum extent possible, that it maintains its operations normally and meets its clients’ requirements by increasing the level of wood and raw material inventories at plants and expanding its inventories of finished products, besides reaching out to its clients to minimize any risks of stockout at plants along the logistics chain and guarantee the sale of their products.
The current scenario arising from COVID-19 also implies higher credit risk, especially among its paper clients. Therefore, the Company has been monitoring this risk and implementing measures to mitigate it. To date, there have been no significant financial impacts.
As previously disclosed in the quarterly financial statements for the period ended March 31, 2020, the Company temporarily shut down its paper production lines at the Mucuri and Rio Verde mills. However, operations resumed at these mills in early July 2020 and have been maintained since then.
Lastly, it is important to mention that in light of the current scenario, the Company has taken and maintained intensive communication efforts to further increase interactions with its main stakeholders in order to ensure adequate transparency and flow of information with them in a timely manner aligned with the current social and economic situation. All key updates on its measures and activities in the context of COVID-19 are available on the Company’s Investor Relations website.
| Page 22 of 34 | |
1Q21 EARNINGS RELEASE | |
The Company has also created a webpage with information on all its actions related to COVID-19: https://www.suzanocontraocoronavirus.com.br.
ESG
The first quarter of 2021 marked another important step forward for Suzano in its ESG agenda. In February, the Company announced to the market that, in a pioneering operation in Brazil, it entered into an export prepayment facility in the form of a Sustainability-Linked Loan (SLL), in the amount of US$1.57 billion, at Libor rate + 1.15% p.a., at an average term of 60 months, with final maturity on March 8, 2027. The operation complies with the principles established by the International Capital Market Association (ICMA) and its key performance indicators (KPIs) are linked to targets for reducing greenhouse gas emissions and the industrial use of water.
On March 24, 2021, the Company organized Suzano Day, when we announced a important step forward in our governance to achieve the Long-Term Targets published in 2020. For 2021, all the targets defined will be part of the variable compensation of at least one executive officer, while the Diversity & Inclusion targets will be a group target for the entire executive board.
In May, the Company will publish its Annual Sustainability Report along with the updated Indicators Center. These publications pertain to 2020 and describe all the achievements made by Suzano on diverse sustainability fronts. This year, the Company will have two major highlights compared to last year, the first related to the expansion of scope by including the SASB methodology, which is widely used in the U.S. and is a reference for GRI in standardizing the Sustainability Reports, as well as reports for the Task Force on Climate Related Financial Disclosures (TCFD), to The World Economic Forum (WEF) and Climate Changes. The second highlight refers to the first report on the progress made regarding the Company’s Long-Term Targets, published on Suzano Day on February 13, 2020. All results presented on the Annual Report were independently audited by Bureau Veritas in the comprehensive scope.
On June 25, 2021, the Company will hold its first ESG Call, to further advance in this important agenda together with its investors. On this date, the Company will announce a new Long-Term Target which will have the scope of biodiversity.
TOTAL OPERATIONAL EXPENDITURE - PULP
As disclosed through a Material Fact notice on March 24, 2021, the estimated total operating expenditure for 2024 is approximately R$1,400/t, and the trend for the indicator remains as planned, considering the exchange and inflation assumptions used.
CAPITAL MARKETS
On March 31, 2021, Suzano’s stock was quoted at R$68.55/share (SUZB3) and US$12.29/share (SUZ). The Company’s stock is listed on the Novo Mercado, the listing segment of the São Paulo Exchange (B3) with the highest corporate governance standards and is also traded on the New York Stock Exchange (NYSE) - Level II.
| Page 23 of 34 | |
1Q21 EARNINGS RELEASE | |

Source: Bloomberg.

Source: Bloomberg.
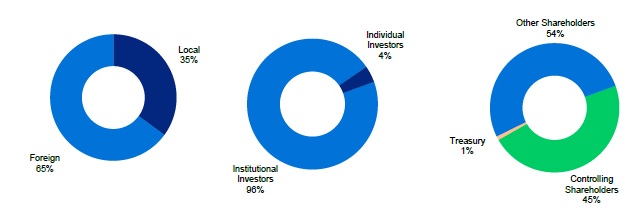
On March 31, 2021, the capital stock of the Company was represented by 1,361,263,584 common shares, of which 12,042,004 were held in treasury. Suzano’s market capitalization on March 31, 2021 stood at R$93.3 billion. In 1Q21, free float corresponded to 54% of the total capital.
| Page 24 of 34 | |
1Q21 EARNINGS RELEASE | |
| Free Float Distribution 03/31/2021 | Ownership structure 03/31/2021 |
(B3 + NYSE)
FIXED INCOME
| Unity | Mar/21 | Dec/20 | Mar/20 | Δ Y-o-Y | Δ Q-o-Q | |
| Fibria 2024 – Price | USD/k | 110.95 | 110.47 | 97.33 | 14.0% | 0.4% |
| Fibria 2024 – Yield | % | 1.62 | 2.01 | 5.99 | -73.0% | -19.4% |
| Fibria 2025 – Price | USD/k | 107.27 | 107.46 | 93.18 | 15.1% | -0.2% |
| Fibria 2025 – Yield | % | 1.99 | 2.06 | 5.65 | -64.7% | -3.3% |
| Suzano 2026 – Price | USD/k | 117.34 | 117.63 | 95.62 | 22.7% | -0.2% |
| Suzano 2026 – Yield | % | 2.25 | 2.33 | 6.61 | -66.0% | -3.6% |
| Fibria 2027 – Price | USD/k | 114.17 | 114.48 | 97.25 | 17.4% | -0.3% |
| Fibria 2027 – Yield | % | 2.83 | 2.87 | 6.00 | -52.9% | -1.5% |
| Suzano 2029 – Price | USD/k | 117.32 | 120.44 | 9301 | 26.1% | -2.6% |
| Suzano 2029 – Yield | % | 3.44 | 3.10 | 7.08 | -51.4% | 10.9% |
| Suzano 2030 – Price | USD/k | 110.26 | 113.78 | 88.59 | 24.5% | -3.1% |
| Suzano 2030 – Yield | % | 3.62 | 3.23 | 6.60 | -45.1% | 12.3% |
| Suzano 2031 – Price | USD/k | 103.38 | 106.68 | - | - | -3.1% |
| Suzano 2031 – Yield | % | 3.34 | 2.98 | - | - | 12.3% |
| Suzano 2047 – Price | USD/k | 127.93 | 134.32 | 97.37 | 31.4% | -4.8% |
| Suzano 2047 – Yield | % | 5.06 | 4.71 | 7.22 | -30.0% | 7.4% |
| Treasury 10 years | % | 1.74 | 0.91 | 0.67 | 160.0% | 90.6% |
Note: Senior Notes issued with face value of 100 USD/k
RATINGS
| Agency | National Scale | Global Scale | Outlook |
| Fitch Ratings | AAA | BBB- | Stable |
| Standard & Poor’s | br.AAA | BBB- | Stable |
| Moody’s | Aaa.br | Baa3 | Stable |
| Page 25 of 34 | |
1Q21 EARNINGS RELEASE | |
UPCOMING EVENTS
Earnings Conference Call (1Q21)
Date: May 13, 2021 (Thursday)
| Portuguese (simultaneous translation) | English |
| 10:00 a.m. (Brasília) | 10:00 a.m. (Brasília) |
| 9:00 a.m. (New York) | 9:00 a.m. (New York) |
| 2:00 p.m. (London) | 2:00 p.m. (London) |
| Tel.: +55 (11) 3181-8565 | Tel.: +1 412 717-9627 |
Please connect 10 minutes before the conference call is scheduled to begin.
The conference call will be held in English and feature a presentation, with a simultaneous webcast. The access links will be available on the Company’s Investor Relations website (www.suzano.com.br/ri).
If you are unable to participate, the webcast link will be available for future consultation on the Investor Relations website of Suzano S.A.
IR CONTACTS
Marcelo Bacci
Camila Nogueira
Camilla Galvão
Mariana Dutra
Roberto Costa
Tel.: +55 (11) 3503-9330
ri@suzano.com.br
www.suzano.com.br/ri
| Page 26 of 34 | |
1Q21 EARNINGS RELEASE | |
APPENDICES
APPENDIX 1 - Operating Data
Revenue breakdown (R$ '000) | 1Q21 | 4Q20 | Δ Q-o-Q | 1Q20 | Δ Y-o-Y |
| Exports | 7,540,691 | 6,489,970 | 16% | 5,818,754 | 30% |
| Pulp | 7,139,229 | 6,093,525 | 17% | 5,488,356 | 30% |
| Paper | 401,462 | 396,445 | 1% | 330,398 | 22% |
| Domestic Market | 1,348,475 | 1,523,006 | -11% | 1,162,039 | 16% |
| Pulp | 454,351 | 453,450 | 0% | 398,367 | 14% |
| Paper | 894,124 | 1,069,556 | -16% | 763,672 | 17% |
| Total Net Revenue | 8,889,166 | 8,012,976 | 11% | 6,980,793 | 27% |
| Pulp | 7,593,580 | 6,546,975 | 16% | 5,886,723 | 29% |
| Paper | 1,295,586 | 1,466,001 | -12% | 1,094,070 | 18% |
| 2Q20 | 2Q19 | Δ Q-o-Q | |||
| Sales volume (‘000) | 1Q21 | 4Q20 | Δ Q-o-Q | 1Q20 | Δ Y-o-Y |
| Exports | 2,540,952 | 2,556,991 | -1% | 2,711,661 | -6% |
| Pulp | 2,450,654 | 2,460,736 | 0% | 2,626,539 | -7% |
| Paper | 90,298 | 96,255 | -6% | 85,122 | 6% |
| Paperboard | 9,954 | 10,078 | -1% | 15,599 | -36% |
| Printing & Writing | 78,208 | 83,130 | -6% | 68,666 | 14% |
| Other paper1 | 2,136 | 3,047 | -30% | 857 | 149% |
| Domestic Market | 403,623 | 460,135 | -12% | 412,449 | -2% |
| Pulp | 202,648 | 201,908 | 0% | 229,758 | -12% |
| Paper | 200,975 | 258,227 | -22% | 182,691 | 10% |
| Paperboard | 39,687 | 44,916 | -12% | 28,805 | 38% |
| Printing & Writing | 134,688 | 182,526 | -26% | 122,867 | 10% |
| Other paper1 | 26,600 | 30,785 | -14% | 31,019 | -14% |
| Total Sales Volume | 2,944,575 | 3,017,126 | -2% | 3,124,110 | -6% |
| Pulp | 2,653,302 | 2,662,644 | 0% | 2,856,297 | -7% |
| Paper | 291,273 | 354,482 | -18% | 267,813 | -9% |
| Paperboard | 49,641 | 54,994 | -10% | 44,404 | 12% |
| Printing & Writing | 212,896 | 265,656 | -20% | 191,533 | 11% |
| Other paper1 | 28,736 | 33,832 | -15% | 31,876 | -10% |
Average net price (R$/ton) | 1Q21 | 4Q20 | Δ Q-o-Q | 1Q20 | Δ Y-o-Y |
| Exports | 2,968 | 2,538 | 17% | 2,146 | 38% |
| Pulp | 2,913 | 2,476 | 18% | 2,090 | 39% |
| Paper | 4446 | 4,119 | 8% | 3,881 | 15% |
| Domestic Market | 3,341 | 3,310 | 1% | 2,817 | 19% |
| Pulp | 2,242 | 2,246 | 0% | 1,734 | 29% |
| Paper | 4,449 | 4,142 | 7% | 4,180 | 6% |
| Total | 3,019 | 2,656 | 14% | 2,234 | 35% |
| Pulp | 2,862 | 2,459 | 16% | 2,061 | 39% |
| Paper | 4,448 | 4,136 | 8% | 4,085 | 9% |
| Page 27 of 34 | |
1Q21 EARNINGS RELEASE | |
| Average net price (US$/ton) | 1Q21 | 4Q20 | Δ Q-o-Q | 1Q20 | Δ Y-o-Y |
| Exports | 543 | 470 | 16% | 481 | 13% |
| Pulp | 533 | 459 | 16% | 469 | 14% |
| Paper | 813 | 763 | 7% | 871 | -7% |
| Domestic Market | 611 | 613 | 0% | 632 | -3% |
| Pulp | 410 | 416 | -1% | 389 | 5% |
| Paper | 813 | 767 | 6% | 937 | -13% |
| Total | 552 | 492 | 12% | 501 | 10% |
| Pulp | 523 | 455 | 15% | 462 | 13% |
| Paper | 813 | 766 | 6% | 916 | -11% |
¹ Paper of other manufacturers sold by Suzano and tissue paper,
FX Rate R$/US$ | 1Q21 | 4Q20 | Δ Q-o-Q | 1Q20 | Δ Y-o-Y |
| Closing | 5.70 | 5.20 | 10% | 5.20 | 10% |
| Average | 5.47 | 5.40 | 1% | 4.46 | 23% |
| Page 28 of 34 | |
1Q21 EARNINGS RELEASE | |
APPENDIX 2 – Consolidated Statement of Income and Goodwill Amortization
Income Statement (R$ ‘000) | 1Q21 | 4Q20 | Δ Q-o-Q | 1Q20 | Δ Y-o-Y |
| Net Revenue | 8,889,166 | 8,012,976 | 11% | 6,980,793 | 27% |
| Cost of Goods Sold | (4,845,034) | (4,883,644) | -1% | (4,819,999) | 1% |
| Gross Debt | 4,044,132 | 3,129,332 | 29% | 2,160,794 | 87% |
| Gross Margin | 45.5% | 39.1% | 6.p.p | 31.0% | 15.p.p |
| Operating Expense/Income | (437,201) | (718,307) | 39% | (812,330) | -46% |
| Selling Expenses | (581,766) | (590,024) | -1% | (514,936) | 13% |
| General and Administrative Expenses | (382,554) | (479,906) | -20% | (314,836) | 22% |
| Other Operating Income (Expenses) | 516,853 | 322,883 | 60% | 16,731 | 2,989% |
| Equity Equivalence | 10,266 | 28,740 | -64% | 711 | 1,344% |
| EBIT | 3,606,931 | 2,411,025 | 50% | 1,348,464 | 167% |
| Depreciation, Amortization & Depletion | 1,766,481 | 1,761,660 | 0% | 1,648,202 | 7% |
| EBITDA | 5,373,412 | 4,172,685 | 29% | 2,996,666 | 79% |
| EBITDA Margin (%) | 60.4% | 52.1% | 8.p.p | 42.9% | 18.p.p |
| Adjusted EBITDA1 | 4,864,298 | 3,964,926 | 23% | 3,026,170 | 61% |
| Adjusted EBITDA Margin1 | 54.7% | 49.5% | 5.p.p | 43.3% | 11.p.p |
| Net Financial Result | (8,667,121) | 6,238,407 | -239% | (22,444,048) | -61% |
| Financial Expenses | 24,227 | 65,889 | -63% | 120,754 | -80% |
| Financial Revenues | (990,933) | (974,494) | 2% | (1,086,424) | -9% |
| Exchange Rate Variation | (5,206,465) | 4,463,515 | -217% | (12,419,586) | -58% |
| Net Proceeds Generated by Derivatives | (2,493,950) | 2,683,497 | -193% | (9,058,792) | -72% |
| Earnings Before Taxes | (5,060,190) | 8,649,432 | -159% | (21,095,584) | -76% |
| Income and Social Contribution Taxes | 2,304,931 | (2,735,081) | -184% | 7,676,523 | -70% |
| Net Income (Loss) | (2,755,259) | 5,914,351 | -147% | (13,419,061) | -79% |
| Net Margin | -31.0% | 73.8% | -105.p.p | -192.2% | 161.p.p |
| 1 Excluding non-recurring items and PPA effects, | |||||
| Goodwill amortization - PPA (R$ ‘000) | 1Q21 | 4Q20 | Δ Q-o-Q | 1Q20 | Δ Y-o-Y |
| COGS | (142,737) | (2,668) | - | (153,078) | -7% |
| Selling Expenses | (207,591) | (206,310) | 1% | (206,467) | 1% |
| General and administrative expenses | (2,149) | (1,191) | 80% | (4,567) | -53% |
| Other operational revenues (expenses) | 2,259 | (5,380) | - | (8,434) | -127% |
| Financial results | (3,054) | 20,756 | - | (18,479) | -83% |
| Page 29 of 34 | |
1Q21 EARNINGS RELEASE | |
APPENDIX 3 – Consolidated Balance Sheet
| Assets (R$ ’000) | 31/03/2021 | 31/12/2020 | 31/03/2020 |
| Current Assets | |||
| Cash and cash equivalents | 5,334,508 | 6,835,057 | 4,548,329 |
| Financial investments | 4,028,038 | 2,212,079 | 5,009,160 |
| Trade accounts receivable | 3,692,928 | 2,915,206 | 4,447,957 |
| Inventories | 3,989,789 | 4,009,335 | 4262511 |
| Recoverable taxes | 406,352 | 406,850 | 836,043 |
| Derivative financial instruments | 414,094 | 484,043 | 128,845 |
| Advance to suppliers | 41,492 | 43,162 | 158,740 |
| Other assets | 752,011 | 738,924 | 266,231 |
| 18,659,212 | 17,644,656 | 19,657,816 | |
| Non-current assets held for sale | - | 313,338 | - |
| Total Current Assets | 18,659,212 | 17,957,994 | 19,657,816 |
| Non-Current Assets | |||
| Financial investments | 236,344 | 184,778 | 181,564 |
| Recoverable taxes | 832,173 | 834,575 | 679,779 |
| Deferred taxes | 11,044,593 | 8,677,002 | 9,363,252 |
| Derivative financial instruments | 856,828 | 857,377 | 959,549 |
| Advance to suppliers | 1,203,265 | 1,015,115 | 1,212,713 |
| Judicial deposits | 275,118 | 257,789 | 267,338 |
| Other assets | 224,663 | 235,341 | 235,810 |
| Biological assets | 11,094,744 | 11,161,210 | 10,431,416 |
| Investments | 379,564 | 359,071 | 326,879 |
| Property, plant and equipment | 38,580,957 | 39,156,890 | 40,701,410 |
| Right of use on lease agreements | 4,566,956 | 4,344,078 | 3,956,304 |
| Intangible | 16,572,051 | 16,759,528 | 17,468,599 |
| Total Non-Current Assets | 85,867,256 | 83,842,754 | 85,784,613 |
| Total Assets | 104,526,468 | 101,800,748 | 105,442,429 |
| Liabilities and Equity (R$ ´000) | 31/03/2021 | 31/12/2020 | 31/03/2020 |
| Current Liabilities | |||
| Trade accounts payable | 2,393,144 | 2,361,098 | 2,408,286 |
| Loans, financing and debentures | 2,143,255 | 2,043,386 | 6,523,908 |
| Accounts payable for lease operations | 632,812 | 620,177 | 664,651 |
| Derivative financial instruments | 2,670,708 | 1,991,118 | 4,642,367 |
| Taxes payable | 239,910 | 170,482 | 226,565 |
| Payroll and charges | 349,263 | 492,728 | 308,756 |
| Liabilities for assets acquisitions and subsidiaries | 114,889 | 101,515 | 116,792 |
| Dividends payable | 6,228 | 6,232 | 5,714 |
| Advance from customers | 92,505 | 25,171 | 67,897 |
| Other liabilities | 336,480 | 360,916 | 302,903 |
| Total Current Liabilities | 8,979,194 | 8,172,823 | 15,267,839 |
| Non-Current Liabilities | |||
| Loans, financing and debentures | 73,770,784 | 70,856,496 | 69,257,752 |
| Accounts payable for lease operations | 5,045,285 | 4,571,583 | 4,062,710 |
| Derivative financial instruments | 7,157,597 | 6,126,282 | 7,150,959 |
| Liabilities for assets acquisitions and subsidiaries | 428,678 | 400,713 | 516,979 |
| Provision for judicial liabilities | 3,255,140 | 3,255,955 | 3,460,373 |
| Actuarial liabilities | 788,948 | 785,045 | 739,595 |
| Deferred taxes | 570 | 76,073 | |
| Advance from customers | 199,595 | ||
| Other liabilities | 336,906 | 293,903 | 245,272 |
| Total Non-Current Liabilities | 90,982,933 | 86,290,547 | 85,509,713 |
| Shareholders’ Equity | |||
| Share capital | 9,235,546 | 9,235,546 | 9,235,546 |
| Capital reserves | 11,822 | 10,612 | 6,417,164 |
| Treasury shares | (218,265) | (218,265) | (218,265) |
| Retained earnings reserves | 317,144 | ||
| Other reserves | 2,065,162 | 2,129,944 | 2,205,836 |
| Retained loss | (6,636,122) | (3,926,015) | (13,409,659) |
| Controlling shareholders´ | 4,458,143 | 7,231,822 | 4,547,766 |
| Non-controlling interest | 106,198 | 105,556 | 117,111 |
| Total Equity | 4,564,341 | 7,337,378 | 4,664,877 |
| Total Liabilities and Equity | 104,526,468 | 101,800,748 | 105,442,429 |
| Page 30 of 34 | |
1Q21 EARNINGS RELEASE | |
APPENDIX 4 – Consolidated Statement of Cash Flow
| Cash Flow (R$ ‘000) | 1Q21 | 1Q20 |
| Cash flow from operating activities | ||
| Net income/(loss) for the period | (2,755,259) | (13,419,061) |
| Adjustment to | ||
| Depreciation, depletion and amortization | 1,734,134 | 1,590,393 |
| Depreciation of right of use | 46,821 | 39,330 |
| Sublease of ships | (11,420) | |
| Interest expense on lease liabilities | 109,040 | 95,350 |
| Results from sale, disposals and provision for losses (impairment) of property, plant and equipment and biological assets, net | (496,844) | 4,488 |
| Income (loss) from associates and joint ventures | (10,266) | (711) |
| Exchange rate and monetary variations, net | 5,206,465 | 12,419,586 |
| Interest expenses with financing, loans and debentures, net | 758,171 | 890,073 |
| Capitalized interest | (402) | (3,803) |
| Premium on early settlements | 32,933 | |
| Accrual of interest on marketable securities | (15,111) | (58,870) |
| Amortization of fundraising costs | 41,020 | 25,250 |
| Derivative (gains) losses, net | 2,493,950 | 9,058,792 |
| Deferred income tax and social contribution | (2,369,080) | (7,730,883) |
| Interest on employee benefits | 13,964 | 13,195 |
| Provision for (reversal of) judicial liabilities, net | 4,311 | (8,772) |
| Allowance for doubtful accounts, net | 1,762 | 5,522 |
| Provision for inventory losses, net | 5,462 | 16,168 |
| Provision for loss of ICMS credits, net | 7,458 | 19,571 |
| Other | 551 | 5,438 |
| Decrease (increase) in assets | (535.478) | 118.377 |
| Trade accounts receivables | (514,616) | (608,145) |
| Inventories | (56,458) | 424,128 |
| Recoverable taxes | (2,390) | 200,988 |
| Other assets | 37,986 | 101,406 |
| Increase (decrease) in liabilities | 25.351 | (454.731) |
| Trade accounts payables | 88,245 | (94,248) |
| Taxes payable | 102,603 | (59,487) |
| Payroll and charges | (143,474) | (92,262) |
| Other liabilities | (29,577) | (208,734) |
| Cash provided by operations, net | 4,279,979 | 2,624,702 |
| Payment of interest with financing, loans and debentures | (1,175,388) | (1,167,141) |
| Premium on early settlements | (32,933) | - |
| Interest received from marketable securities | 14,049 | 52,486 |
| Payment of income taxes | (35,144) | (28,931) |
| Cash provided by operating activities | 3,050,563 | 1,481,116 |
| Investing activities | ||
| Additions to property, plant and equipment | (263,979) | (299,425) |
| Additions to intangible assets | (734) | (469) |
| Additions to biological assets | (703,830) | (578,224) |
| Proceeds from sale of property, plant and equipment | 1,164,928 | 27,905 |
| Increase of capital in subsidiaries and associates | (6,328) | - |
| Marketable securities, net | (1,866,464) | 1,145,994 |
| Advance for acquisition of wood from operations with development | (167,176) | (68,957) |
| Acquisition of minority interests | (6,482) | - |
| Cash used in investing activities, net | (1,850,065) | 226,824 |
| Financing activities | ||
| Proceeds from loans, financing and debentures (note 18.2) | 8,969,521 | 3,663,623 |
| Payment of derivative transactions (note 4.5.4) | (712,547) | (172,797) |
| Payment of loans, financing and debentures (note 18.2) | (11,177,120) | (4,503,548) |
| Payment of leases (note 19.2) | (249,128) | (157,209) |
| Liabilities for assets acquisitions and subsidiaries | - | (2,838) |
| Cash provided (used) by financing activities, net | (3,169,274) | (1,172,769) |
| Exchange variation on cash and cash equivalents | 468,227 | 764,031 |
| Increase (reduction) in cash and cash equivalents, net | (1,500,549) | 1,299,202 |
| Cash and cash equivalents at the beginning for the period | 6,835,057 | 3,249,127 |
| Cash and cash equivalents at the end for the period | 5,334,508 | 4,548,329 |
| Increase (reduction) in cash and cash equivalents, net | (1,500,549) | 1,299,202 |
| Page 31 of 34 | |
1Q21 EARNINGS RELEASE | |
APPENDIX 5 - EBITDA
| (R$ '000, except where otherwise indicated) | 1Q21 | 1Q20 |
| Net income | (2,755,259) | (13,419,061) |
| Net Financial Result | 8,667,121 | 22,444,048 |
| Income and Social Contribution Taxes | (2,304,931) | (7,676,523) |
| EBIT | 3,606,931 | 1,348,464 |
| Depreciation, Amortization and Depletion | 1,766,481 | 1,648,202 |
| EBITDA1 | 5,373,412 | 2,996,666 |
| EBITDA Margin | 60.4% | 42.9% |
| COVID-19 - Expenses related to social actions to combat the virus | 4,555 | 594 |
| Expenses with Fibria's transaction | - | 916 |
| PPA effect (Asset disposal) | - | 5,793 |
| Equity method | (10,266) | (713) |
Expenses with obligations and contract cancellations | - | 6,009 |
| Accruals for losses on ICMS credits | 6,978 | 15,366 |
| ICMS accrual complement | - | 2,632 |
| Adjustments - Losango Project | (9,138) | - |
| Sales of fixed assets and biological assets | (501,243) | (1,093) |
| Adjusted EBITDA | 4,864,298 | 3,026,170 |
| Adjusted EBITDA Margin | 54.7% | 43.3% |
¹ The Company's EBITDA is calculated in accordance with CVM Instruction 527 of October 4, 2012.
| Page 32 of 34 | |
1Q21 EARNINGS RELEASE | |
APPENDIX 6 - Segmented Income Statement
Segmented Financial Statement (R$ '000) | 1Q21 | 1Q20 | |||||||
| Pulp | Paper | Non Segmented | Total Consolidated | Pulp | Paper | Non Segmented | Total Consolidated | ||
| Net Revenue | 7,593,580 | 1,295,586 | - | 8,889,166 | 5,886,723 | 1,094,070 | - | 6,980,793 | |
| Cost of Goods Sold | (4,015,712) | (829,322) | - | (4,845,034) | (4,129,175) | (690,824) | - | (4,819,999) | |
| Gross Profit | 3,577,868 | 466,264 | - | 4,044,132 | 1,757,548 | 403,246 | - | 2,160,794 | |
| Gross Margin | 47,1% | 36,0% | - | 45,5% | 29,9% | 36,9% | - | 31,0% | |
| Operating Expense/Income | (382,677) | (54,524) | - | (437,201) | (631,643) | (180,687) | - | (812,330) | |
| Selling Expenses | (477,598) | (104,168) | - | (581,766) | (418,221) | (96,715) | - | (514,936) | |
| General and Administrative Expenses | (278,406) | (104,148) | - | (382,554) | (224,053) | (90,783) | - | (314,836) | |
| Other Operating Income (Expenses) | 375,582 | 141,271 | - | 516,853 | 16,592 | 139 | - | 16,731 | |
| Equity Equivalence | (2,255) | 12,521 | - | 10,266 | (5,961) | 6,672 | - | 711 | |
| EBIT | 3,195,191 | 411,740 | - | 3,606,931 | 1,125,905 | 222,559 | - | 1,348,464 | |
Depreciation, Amortization & Depletion | 1,629,575 | 136,906 | - | 1,766,481 | 1,539,864 | 108,338 | - | 1,648,202 | |
| EBITDA | 4,824,766 | 548,646 | - | 5,373,412 | 2,665,769 | 330,897 | - | 2,996,666 | |
| EBITDA Margin | 63,5% | 42,3% | - | 60,4% | 45,3% | 30,2% | - | 42,9% | |
| Adjusted EBITDA1 | 4,465,793 | 398,505 | - | 4,864,298 | 2,708,584 | 317,586 | - | 3,026,170 | |
| Adjusted EBITDA Margin1 | 58,8% | 30,8% | - | 54,7% | 46,0% | 29,0% | - | 43,3% | |
| Net Financial Result | - | - | (8,667,121) | (8,667,121) | - | - | (22,444,048) | (22,444,048) | |
| Earnings Before Taxes | 3,195,191 | 411,740 | (8,667,121) | (5,060,190) | 1,125,905 | 222,559 | (22,444,048) | (21,095,584) | |
| �� | |||||||||
Income and Social Contribution Taxes | - | - | 2,304,931 | 2,304,931 | - | - | 7,676,523 | 7,676,523 | |
| Net Income (Loss) | 3,195,191 | 411,740 | (6,362,190) | (2,755,259) | 1,125,905 | 222,559 | (14,767,525) | (13,419,061) | |
| Net Margin | 42,1% | 31,8% | - | -31,0% | 19,1% | 20,3% | - | -192,2 | |
1 Excluding non-recurring items and PPA effects.
| Page 33 of 34 | |
1Q21 EARNINGS RELEASE | |
Forward-Looking Statements
This release may contain forward-looking statements. Such statements are subject to known and unknown risks and uncertainties that could cause the expectations expressed to not materialize or differ substantially from expected results. These risks include, among others, changes in future demand for the Company’s products, changes in factors affecting domestic and international product prices, changes in the cost structure, changes in the seasonal patterns of markets, changes in prices charged by competitors, foreign exchange variations, changes in the political or economic situation of Brazil, as well as emerging and international markets. The forward-looking statements were not reviewed by our independent auditors.
| Page 34 of 34 | |