Exhibit 99.1
 |
Leverage in USD down to 3.3 times
Record quarterly Adjusted EBITDA, up 22%
São Paulo, August 11, 2021. Suzano S.A. (B3: SUZB3 | NYSE: SUZ), one of the world’s largest integrated pulp and paper producers, announces today its consolidated results for the 2nd quarter of 2021 (2Q21).
HIGHLIGHTS
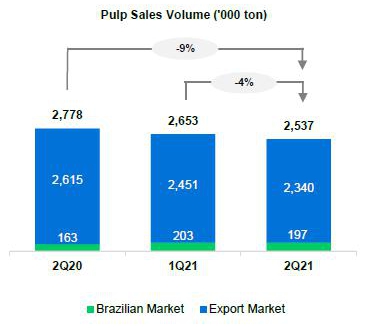
| • | Pulp sales of 2,537 thousand tons (-9% vs. 2Q20). |
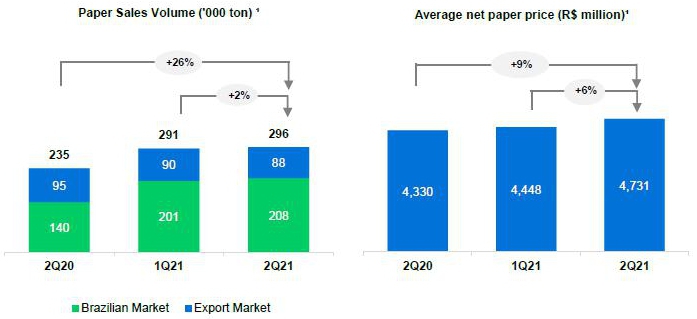
| • | Paper sales of 296 thousand tons (+26% vs. 2Q20). |
| • | Adjusted EBITDA1 and Operating cash generation²: R$5.9 billion and R$4.9 billion, respectively. |
| • | Adjusted EBITDA1/ton3 from pulp of R$2,166/ton (+56% vs. 2Q20). |
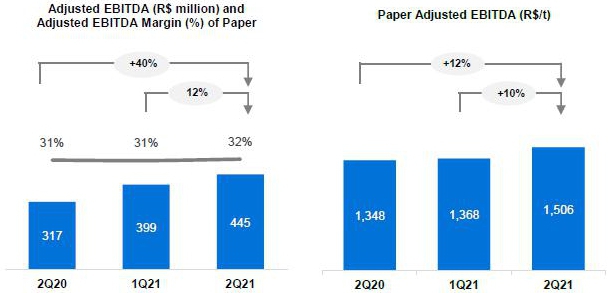
| • | Adjusted EBITDA1/ton4 from paper of R$1,506/ton (+12% vs. 2Q20). |
| • | Average net pulp price – export market: US$636/t (+35% vs. 2Q20). |
| • | Average net paper price4 of R$4,731/ton (+9% vs. 2Q20). |
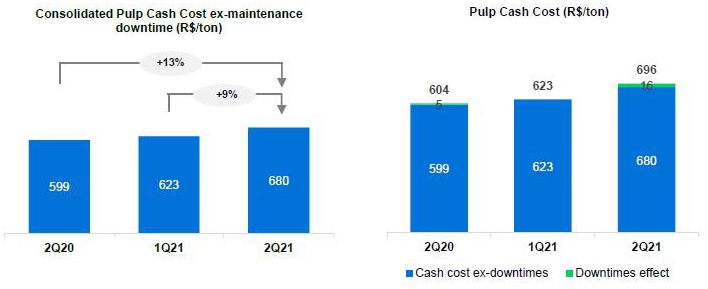
| • | Pulp cash cost ex-downtime of R$680/ton (+13% vs. 2Q20). |
| • | Decrease in leverage to 3.3 times in USD and 3.1 times in BRL. |
| Financial Data (R$ million) | 2Q21 | 1Q21 | ΔQ-o-Q | 2Q20 | ΔY-o-Y | LTM5 2Q21 | ||||||||||||||||||
| Net Revenue | 9,844 | 8,889 | 11 | % | 7,996 | 23 | % | 34,217 | ||||||||||||||||
| Adjusted EBITDA1 | 5,942 | 4,864 | 22 | % | 4,180 | 42 | % | 18,550 | ||||||||||||||||
| Adjusted EBITDA Margin1 | 60 | % | 55 | % | 6 p.p. | 52 | % | 8 p.p. | 54 | % | ||||||||||||||
| Adjusted EBITDA Margin¹ ex- Klabin3 | 60 | % | 55 | % | 6 p.p. | 52 | % | 8 p.p. | 54 | % | ||||||||||||||
| Net Financial Result | 9,743 | (8,667 | ) | - | (5,657 | ) | - | 3,091 | ||||||||||||||||
| Net Income | 10,037 | (2,755 | ) | - | (2,053 | ) | - | 12,038 | ||||||||||||||||
| Operating Cash Generation2 | 4,940 | 3,866 | 28 | % | 3,372 | 47 | % | 14,641 | ||||||||||||||||
| Net Debt /Adjusted EBITDA1 (x) - R$ | 3.1 x | 4.0 x | -0.9 x | 5.6 x | -2.5 x | 3.1 x | ||||||||||||||||||
| Net Debt /Adjusted EBITDA1 (x) - US$ | 3.3 x | 3.8 x | -0.4 x | 4.7 x | -1.4 x | 3.3 x |
| Operational Data ('000 tons) | 2Q21 | 1Q21 | ΔQ-o-Q | 2Q20 | ΔY-o-Y | LTM5 2Q21 | ||||||||||||||||||
| Sales | 2,833 | 2,944 | -4 | % | 3,013 | -6 | % | 11,640 | ||||||||||||||||
| Pulp | 2,537 | 2,653 | -4 | % | 2,778 | -9 | % | 10,380 | ||||||||||||||||
| Paper4 | 296 | 291 | 2 | % | 235 | 26 | % | 1,261 |
¹Excluding non-recurring items. | 2Excludes Klabin’s sales volume. | 3Considers Adjusted EBITDA less sustaining capex (cash basis) | 4Considers the results of the Consumer Goods Unit. | 5Last 12 months.

 |
The consolidated quarterly information has been prepared in accordance with the Securities and Exchange Commission (CVM) and Accounting Standards Committee (CPC) standards and is in compliance with International Accounting Standard (IFRS) issued by the International Accounting Standard Board (IASB). The data contained in this document was obtained from the financial information as made available to the CVM. The operating and financial information is presented based on consolidated numbers in Reais (R$). Summaries may diverge due to rounding. Non-financial data, such as volume, quantity, average price, average price, in Reais and Dollars,
were not reviewed by independent auditors.
| CONTENTS | |
| EXECUTIVE SUMMARY | 3 |
| PULP BUSINESS PERFORMANCE | 3 |
| PULP SALES VOLUME AND REVENUE | 3 |
| PULP CASH COST | 5 |
| PULP SEGMENT EBITDA | 7 |
| OPERATING CASH FLOW FROM THE PULP SEGMENT | 8 |
| PAPER BUSINESS PERFORMANCE | 9 |
| PAPER SALES VOLUME AND REVENUE¹ | 9 |
| OPERATING CASH FLOW FROM THE PAPER SEGMENT | 11 |
| FINANCIAL PERFORMANCE | 12 |
| NET REVENUE | 12 |
| CALENDAR OF SCHEDULED MAINTENANCE DOWNTIMES | 12 |
| COST OF GOODS SOLD (COGS) | 13 |
| SELLING EXPENSES | 13 |
| GENERAL AND ADMINISTRATIVE EXPENSES | 13 |
| ADJUSTED EBITDA | 14 |
| FINANCIAL RESULT | 14 |
| DERIVATIVE OPERATIONS | 15 |
| NET INCOME (LOSS) | 18 |
| DEBT | 18 |
| CAPITAL EXPENDITURE | 21 |
| OPERATING CASH GENERATION | 21 |
| FREE CASH FLOW | 22 |
| SPINNOVA | 22 |
| COVID-19 | 22 |
| ESG | 24 |
| TOTAL OPERATIONAL EXPENDITURE - PULP | 25 |
| CAPITAL MARKETS | 25 |
| FIXED INCOME | 26 |
| RATINGS | 26 |
| UPCOMING EVENTS | 27 |
| IR CONTACTS | 27 |
| APPENDICES | 28 |
| APPENDIX 1 - Operating Data | 28 |
| APPENDIX 2 – Consolidated Statement of Income and Goodwill Amortization | 30 |
| APPENDIX 3 – Consolidated Balance Sheet | 31 |
| APPENDIX 4 – Consolidated Statement of Cash Flow | 32 |
| APPENDIX 5 – EBITDA | 33 |
| APPENDIX 6 – Segmented Income Statement | 34 |
Page 2 of 36
EXECUTIVE SUMMARY
The recovery of pulp market fundamentals that was already evident in the previous quarter had an impact on the Company's results.
Pulp prices continued to perform well during 2Q21 on the back of favorable fundamentals, both on the supply and demand side, with the end of the quarter being marked by signs of cooling off, especially in China given the approaching period of greater seasonal effects. In paper business, demand remained buoyant, enabling further price increases in both the domestic and international markets, supporting the achievement of the highest quarterly EBITDA in its history when considering paper and consumer goods. These factors, combined with the average weaker BRL, drove adjusted EBITDA in the quarter to R$5.9 billion and operating cash generation to R$4.9 billion – the highest since the creation of Suzano.
As for financial management, the Company once again reduced its net debt in USD and leverage, as measured by net debt/adjusted EBITDA in the last twelve months. Its liquidity position remained solid, representing zero refinancing risk until 2023. Suzano remains focused on financial discipline, which is evident from the clear and consistent policies implemented over time. Continuing its debt management program, at the end of June the Company issued a new Sustainability-Linked Bond (SLB) in the international market, with the principal amount of US$ 1 billion and a yield of 3.28% per year, associated with the goals for reducing the use of industrial water by 2026 and reaching 30% in the representation of women occupying a leadership position in the Company by 2025, becoming the first issue in emerging markets to include a social indicator of Diversity & Inclusion.
Another highlight of the quarter on the ESG front, was the release of a pioneering goal in the Pulp & Paper industry about Biodiversity, by establishing the commitment of connecting half a million hectares of priority areas for biodiversity conservation in the Cerrado, Atlantic Forest and Amazon biomes by 2030.
PULP BUSINESS PERFORMANCE
PULP SALES VOLUME AND REVENUE
Demand for pulp in 2Q21 followed the different trends in the paper segment in each of the main markets. In Europe and North America, the positive scenario in the printing and writing, packaging and special paper market resulted enabled successive price increases, while the destocking of tissue paper by end consumers, especially in the North American market, pressured producers who were forced to temporarily scale down production. In China, demand for diverse paper types remained firm until mid-quarter, though it showed signs of cooling off at the end of the period mainly due to the seasonality expected during the middle of the year.
Despite the absence of significant events that could result in unscheduled production stoppages, maintenance downtimes during the spring season across the Northern Hemisphere played an important role in reducing local pulp supply in 2Q21, boosting the demand for imported pulp. However, logistics problems, especially those related to ship delays and shortage of containers, remained a cause for concern.
As such, the imbalance among market fundamentals drove the performance in pulp prices during the quarter. The difference between softwood and hardwood pulp prices remained high, which too continued to favor the substitution of fibers. According to PIX/FOEX, the difference between softwood and hardwood pulp prices at the end of the quarter was US$201/ton in Europe and US$186/ton in China.
In this context, Suzano’s pulp sales totaled 2,537 thousand tons, down 4% and 9%, respectively, from 1Q21 and 2Q20.
Page 3 of 36
Average net price in USD of the pulp sold by Suzano was US$ 629/ton, an increase of 20% and 35%, respectively, from 1Q21 and 2Q20, resulting from the increase in the international pulp prices. Average net pulp price in the export market was US$636/ton (compared to US$532/ton in 1Q21 and US$471/ton in 2Q20).
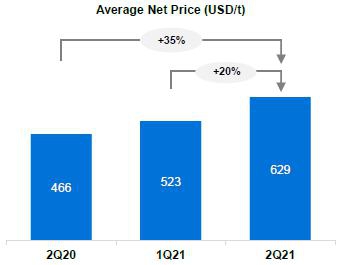
Average net price in BRL was R$3,329/ton in 2Q21, up 16% and 33%, respectively, from 1Q21 and 2Q20, accompanying the growth trend in the international market prices.
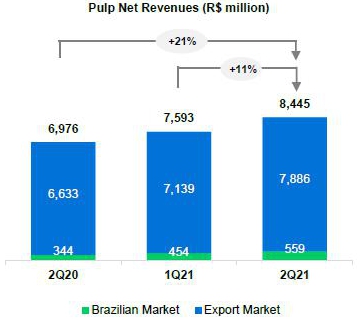
The higher net price in USD led to the 11% and 21% growth, respectively, in net revenue from pulp in relation to 1Q21 and 2Q20, despite de sales volume reduction and lower average exchange rate.
Page 4 of 36
PULP CASH COST
Cash cost excluding downtime in 2Q21 came to R$ 680/ton, 9% higher than in 1Q21, due to: i) higher spending on raw materials, mainly impacted by the Brent energy prices (especially natural gas), higher expenditure on packaging due to the increase in the price of steel and chlorine dioxide due to the higher energy price; as well as higher consumption of materials due to periodic replacements; ii) the increase in wood costs on account of higher transport and harvest costs caused by the increase in the price of diesel, and the record of COVID-19 pandemic impact (previously recorded directly in COGS); iii) higher fixed costs as a result of higher expenses with materials and routine services during the execution of scheduled downtimes; and iv) the lower result from utilities on account of lower energy exports, caused by the reduction in the operational availability of turbogenerators, despite the increase in spot prices. The negative impact of the exchange rate, against the average FX appreciation noticed in the quarter (3%), is related to the turnover effect of raw material inventories caused by the delay of approximately one month between acquisition and consumption.
Page 5 of 36
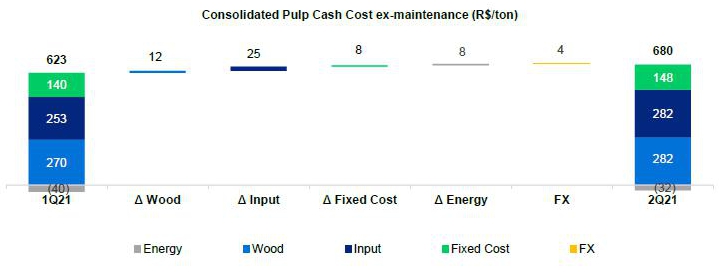
¹Excludes the impact of maintenance and administrative downtimes.
Cash cost excluding downtime in 2Q21 was 13% higher than in 2Q20, due to: i) higher spending on raw materials as a result of higher energy prices (increase in oil and natural gas prices due to the rise in Brent prices), higher prices of chemicals (especially chlorine dioxide due to higher energy cost) and greater expenditure on packaging due to the increase in the price of steel and greater consumption of materials due to periodic replacements; ii) the increase in wood costs on account of higher transport and harvest costs caused by the increase in the price of diesel, and COVID-19 pandemic impact; iii) the increase in fixed costs due to the postponement of maintenance activities in light of the COVID-19 pandemic; and iv) the result from utilities, which was affected by lower exports despite the increase in spot prices.
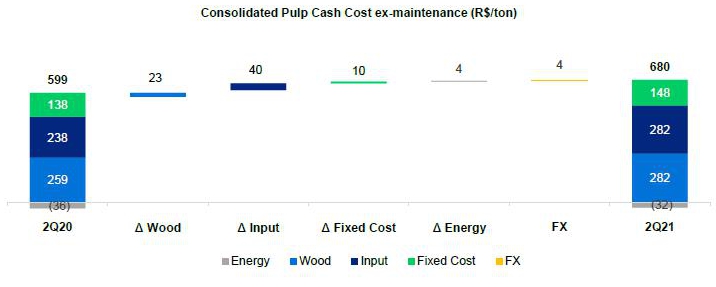
¹Excludes the impact of maintenance and administrative downtimes.
Page 6 of 36

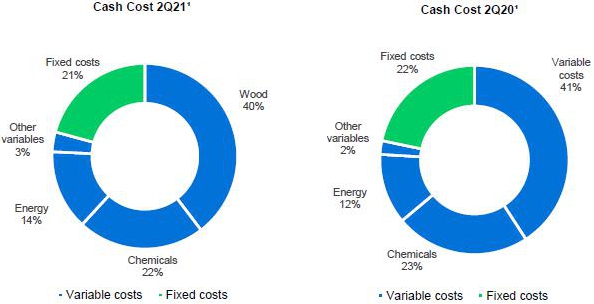
¹Based on cash cost excluding downtimes. Excludes energy sales.
PULP SEGMENT EBITDA
| Pulp segment | 2Q21 | 1Q21 | ΔQ-o-Q | 2Q20 | ΔY-o-Y | LTM 2Q21 | ||||||||||||||||||
| Adjusted EBITDA (R$ million) | 5,496 | 4,466 | 23 | % | 3,862 | 42 | % | 16,876 | ||||||||||||||||
| Sales volume (k ton) | 2,537 | 2,653 | -4 | % | 2,777 | -9 | % | 10,380 | ||||||||||||||||
| Pulp adjusted¹ EBITDA (R$/ton) | 2,166 | 1,683 | 29 | % | 1,391 | 56 | % | 1,626 | ||||||||||||||||
¹ Excludes non-recurring items and PPA effects.
Adjusted EBITDA from pulp in 2Q21 was 23% higher than in 1Q21, mainly due to the higher net average price in USD (+20%) and lower SG&A expenses, largely caused by the decline in variable selling expenses (logistics costs reduction). These effects were partially offset by the decline in average USD against BRL (3%), lower sales volume (-4%) and higher cash COGS per ton, impacted by higher production costs, higher Brent and scheduled maintenance downtimes. The 29% growth in adjusted EBITDA per ton was driven by the price effects and the decline in SG&A expenses, which were partially offset by the stronger BRL and the higher cash COGS.
Compared to 2Q20, the 42% growth in adjusted EBITDA from pulp is mainly due to the 35% increase in net average price, which was partially offset by lower sales volume (-9%) and higher cash COGS per ton (due to higher production cost and higher Brent). Adjusted EBITDA per ton increased 56% due to the price factor but was partially offset by the increase in the cash COGS.
Page 7 of 36

¹ Excludes non-recurring items and PPA effects.
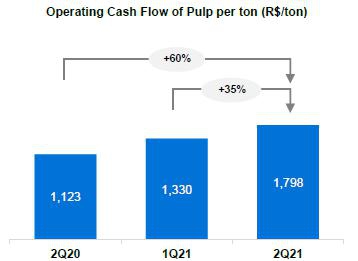
OPERATING CASH FLOW FROM THE PULP SEGMENT
| Operating cash flow - Pulp (R$ million) | 2Q21 | 1Q21 | ΔQ-o-Q | 2Q20 | ΔY-o-Y | LTM 2Q21 | ||||||||||||||||||
| Adjusted EBITDA¹ | 5,496 | 4,466 | 23 | % | 3,862 | 42 | % | 16,876 | ||||||||||||||||
| Maintenance Capex² | (935 | ) | (938 | ) | 0 | % | (742 | ) | 26 | % | (3,621 | ) | ||||||||||||
| Operating Cash Flow | 4,561 | 3,528 | 29 | % | 3,120 | 46 | % | 13,255 |
¹ Excludes non-recurring items and PPA effects.
² Cash basis.
¹ Excludes sales volume related to the agreement with Klabin.
Operating cash generation per ton in the pulp segment was 35% and 60% higher than in 1Q21 and 2Q20, respectively, impacted by the growth in adjusted EBITDA per ton (as explained earlier), partially offset by higher maintenance capex per ton.
Page 8 of 36
PAPER BUSINESS PERFORMANCE
The following data and analyses incorporate the joint results of the consumer goods and paper businesses.
PAPER SALES VOLUME AND REVENUE¹
According to data published by Brazil's Forestry Industry Association (IBÁ), demand for printing and writing in Brazil grew 67% in 2Q21 compared to 2Q20. The main reason for this growth is the fact that 2Q20 marked the worst moment of consumption during the pandemic, with demand reaching the lowest level in April 2020.
Comparing the first half of 2021 with the same period last year, demand in Brazil for printing and writing increased 32%, which is driving the gradual recovery in demand since July 2020. Another trend fueling this growth since 1Q21 is paper sales to the paperboard industry, characterized by the use of uncoated paper as an alternative to paper shavings in applications such as corrugated medium and liners for paper boxes.
This phenomenon of developing new paper applications is the result of the paper and packaging industry’s shift towards developing solutions for the prevailing scenario. Physical distancing measures implemented last year led to changes in consumption that considerably accelerated the growth of e-commerce in Brazil. The spike in demand for this channel, combined with the strong decline in the supply of shavings to produce paper boxes, created a favorable environment for the use of alternative printing and writing solutions for producing these packages.
Demand from the printing and writing industry in Brazil without such application is estimated to grow 23% in the first semester compared to the same period in 2020. Growth in 2Q21 compared to 2Q20 is 59%.
In this context, the potential impact on paper sales caused by measures to contain the pandemic differs according to the product line: printing and writing papers are still adversely affected by the lower circulation of people but these papers, especially those related to corporate and educational segments, have a bright outlook for the second half of the year due to the progress of vaccination across Brazil and the improvement of economic activity.
Demand for paperboard in Brazil grew 28% in 1H21 compared to the same period in 2020. Demand in 2Q21 in relation to 2Q20 grew 36%. This growth was not only due to the high demand in the packaging market but also due to the contrast with the comparison base last year, which registered the lowest ever consumption when the restrictive measures related to the pandemic were at their peak in 2020.
Consolidating both market segments (Suzano's accessible paper market), growth was 31% in 1H21 and 55% in 2Q21 compared to 2Q20. The industry thus continues to reinforce the gradual recovery in demand, especially in lines dedicated to packaging such as paperboard and paper boxes.
Suzano's domestic paper sales (printing and writing, paperboard and tissue) totaled 208 thousand tons in 2Q21, an increase of 4% from 1Q21 and 48% from 2Q20. Sales in 1H21 totaled 409 thousand tons, up 27% year over year, in line with the market trend.
Paper sales in the international markets totaled 88 thousand tons, a reduction of 3% from 1Q21 and 8% from 2Q20 due to the logistical bottlenecks in exports through containers. This volume corresponded to 30% of total sales volume in 2Q21 (vs. 31% and 40% in 1Q21 and 2Q20, respectively).
Driven by the gradual economic recovery and seasonality effects during the period, Suzano's total paper sales in 2Q21 grew 2% in relation to 1Q21 and 26% from 2Q20.
Page 9 of 36
1Includes the Consumer Goods Unit.
Average net price in 2Q21 was R$4,731/ton, up 9% from 2Q20, due to price increases in the domestic market. Compared to 1Q21, average net price rose 6% due to price increases across all product lines in the domestic market, driven mainly by heavy demand in the paperboard market, and the price recovery in all the international markets where the Company operates.
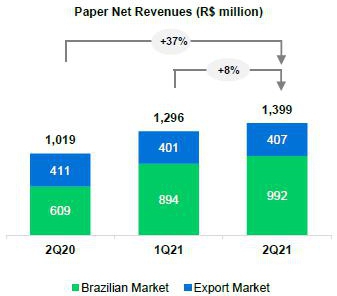
Net revenue from paper was R$1,399 million in 2Q21, an 8% increase vs. 1Q21 due to the price increase as a result of the reasons cited above. Compared to 2Q20, the increase was due to the normalization of sales volumes to pre-pandemic levels and a 9% increase in prices.
1Includes the Consumer Goods Unit.
PAPER SEGMENT EBITDA
| Paper segment | 2Q21 | 1Q21 | ΔQ-o-Q | 2Q20 | ΔY-o-Y | LTM 2Q21 | ||||||||||||||||||
| Adjusted EBITDA (R$ million) | 445 | 399 | 12 | % | 317 | 40 | % | 1,673 | ||||||||||||||||
| Sales volume (k ton) | 296 | 291 | 2 | % | 235 | 26 | % | 1,261 | ||||||||||||||||
| Paper adjusted¹ EBITDA (R$/ton) | 1,506 | 1,368 | 10 | % | 1,348 | 12 | % | 1,328 |
¹ Excludes non-recurring items and PPA effects.
Page 10 of 36
Adjusted EBITDA from paper in 2Q21 was R$445 million, a 12% growth in comparison to 1Q21, mainly due to higher prices (domestic and international markets). Compared to 2Q20, the increase reached 40%, mainly due to higher sales volume and price increases in all product lines.
OPERATING CASH FLOW FROM THE PAPER SEGMENT
| Operating cash flow - Paper (R$ million) | 2Q21 | 1Q21 | ΔQ-o-Q | 2Q20 | ΔY-o-Y | LTM 2Q21 | ||||||||||||||||||
| Adjusted EBITDA¹ | 445 | 399 | 12 | % | 317 | 40 | % | 1,673 | ||||||||||||||||
| Maintenance Capex² | (66 | ) | (61 | ) | 9 | % | (65 | ) | 2 | % | (287 | ) | ||||||||||||
| Operating Cash Flow | 379 | 338 | 12 | % | 252 | 50 | % | 1,386 |
¹ Excluding non-recurring items.
² Cash basis.
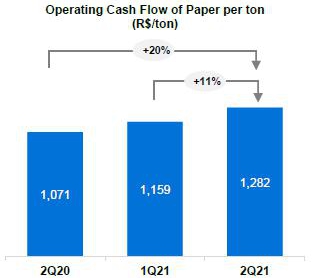
Operating cash generation per ton in the paper segment was R$1,282, up 11% from 1Q21 due to the increase in prices. Capex levels in the comparable quarters remained virtually in line. Compared to 2Q20, the indicator was 20% higher, mainly due to the increase in sales volume and higher prices in the domestic and international markets.
Page 11 of 36
FINANCIAL PERFORMANCE
NET REVENUE
Suzano’s net revenue in 2Q21 was R$9,844 million, 84% of which came from exports (vs. 85% in 1Q21 and 88% in 2Q20). Compared to 1Q21, the 11% growth in net revenue was due to the higher net average price of pulp in USD, which was partially offset by the 3% decline in average USD vs. BRL and the 4% drop in pulp and paper sales volume. The 23% growth in consolidated net revenue in 2Q21 compared to 2Q20 is the result of higher net average pulp price in USD, which was partially offset by the 6% decline in sales volume and the 2% decline in average USD vs. BRL.

¹Excludes service revenue from Portocel.
CALENDAR OF SCHEDULED MAINTENANCE DOWNTIMES
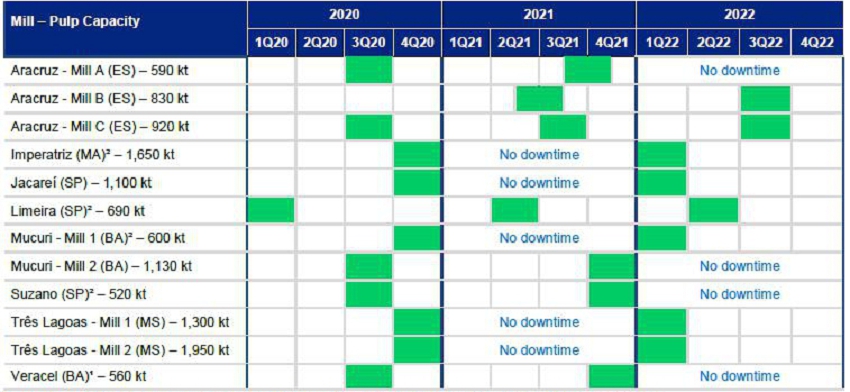
¹Veracel is a joint operation between Suzano (50%) and Stora Enso (50%) with total annual capacity of 1,120 thousand tons.
²Includes integrated capacities and fluff.
Page 12 of 36
COST OF GOODS SOLD (COGS)
| COGS (R$ million) | 2Q21 | 1Q21 | ΔQ-o-Q | 2Q20 | ΔY-o-Y | LTM 2Q21 | ||||||||||||||||||
| COGS (Income statement) | 4,778 | 4,845 | -1 | % | 4,789 | 0 | % | 18,980 | ||||||||||||||||
| Depreciation, depletion and amortization | 1,434 | 1,504 | -5 | % | 1,462 | -2 | % | 5,867 | ||||||||||||||||
| Cash COGS | 3,344 | 3,341 | 0 | % | 3,327 | 1 | % | 13,113 | ||||||||||||||||
| Sales volume | 2,833 | 2,945 | -4 | % | 3,013 | -6 | % | 11,640 | ||||||||||||||||
| Cash COGS/ton (R$/ton) | 1,180 | 1,135 | 4 | % | 1,104 | 7 | % | 1,127 |
Cash COGS in 2Q21 totaled R$3,344 million, or R$1,180/ton. Compared to 1Q21, cash COGS remained stable, with the decline in sales volume (-4%) and in average USD vs. BRL (-3%) offset by higher production costs and the impact of scheduled maintenance downtimes. Cash COGS per ton increased 4% due to the increase in production costs and the impact of downtimes, which were partially offset by higher average BRL vs. USD.
Compared to 2Q20, cash COGS increased 1%, mainly due to higher cash cost of production and higher logistics costs as a result of higher Brent, which was partially offset by lower sales volume (-6%). Cash COGS per ton was 4% higher than in the same period last year due to the production cost factor and Brent effect mentioned earlier.
SELLING EXPENSES
| Selling expenses (R$ million) | 2Q21 | 1Q21 | ΔQ-o-Q | 2Q20 | ΔY-o-Y | LTM 2Q21 | ||||||||||||||||||
| Selling expenses (Income Statement) | 497 | 582 | -15 | % | 547 | -9 | % | 2,191 | ||||||||||||||||
| (-) Depreciation, depletion and amortization | 235 | 236 | 0 | % | 227 | 4 | % | 916 | ||||||||||||||||
| Cash selling expenses | 262 | 346 | -24 | % | 320 | -18 | % | 1,275 | ||||||||||||||||
| Sales volume | 2,833 | 2,944 | -4 | % | 3,013 | -6 | % | 11,640 | ||||||||||||||||
| Cash selling expenses/ton (R$/ton) | 92 | 118 | -21 | % | 106 | -13 | % | 110 |
Cash selling expenses decreased 24% from 1Q21, mainly due to the reduction in sales volume and logistics expenses (in turn due to lower expenses associated with inland logistics in North America and Europe). Cash selling expenses per ton fell 21%, mainly due to the reduction in logistics expenses, as mentioned above.
Compared to 2Q20, the 18% decline in cash selling expenses is mainly due to lower sales volume and the decline of logistics expenses (again explained by the reduction in expenses associated with inland logistics in North America and Europe). Cash selling expenses per ton declined 21%, due to the logistics factors mentioned above.
GENERAL AND ADMINISTRATIVE EXPENSES
| General and Administrative Expenses (R$ million) | 2Q21 | 1Q21 | ΔQ-o-Q | 2Q20 | ΔY-o-Y | LTM 2Q21 | ||||||||||||||||||
| General and Administrative Expenses (Income Statament) | 353 | 383 | -8 | % | 336 | 5 | % | 1,528 | ||||||||||||||||
| Depreciation, depletion and amortization¹ | 26 | 26 | 2 | % | 19 | 39 | % | 86 | ||||||||||||||||
| Cash general and administrative expenses | 327 | 357 | -8 | % | 317 | 3 | % | 1,442 | ||||||||||||||||
| Sales volume | 2,833 | 2,944 | -4 | % | 3,013 | -6 | % | 11,640 | ||||||||||||||||
| Cash general and administrative expenses/t (R$/ton) | 115 | 121 | -5 | % | 105 | 10 | % | 124 |
Compared to 1Q21, the 8% decline in cash general and administrative expenses is mainly due to the reduction in personnel expenses (variable compensation), which was partially offset by higher expenses with third-party services. On a per-ton basis, there was a decrease of 5% due to the same factors.
Page 13 of 36

Compared to 2Q20, cash general and administrative expenses increased 3%, mainly due to higher expenses with personnel and third-party services. On a per-ton basis, the 10% increase is explained by the same factors.
Other operating income (expenses) amounted to an income of R$910 million in 2Q21, compared to an income of R$517 million in 1Q21 and R$196 million in 2Q20. The increase in relation to 1Q21 is mainly due to the adjustment to the fair value of biological assets (which is made in the second and fourth quarter of each year) and the booking of tax credits related to the recognition of the right to exclude ICMS from the PIS and COFINS calculation base, all of which were partially offset by lower income from the sale of land and forests. Compared to 2Q20, the increase is also mainly due to the higher positive effect of the adjustment to the fair value of biological assets and the above-mentioned booking of tax credits.
ADJUSTED EBITDA
| Consolidated | 2Q21 | 1Q21 | ΔQ-o-Q | 2Q20 | ΔY-o-Y | LTM 2Q21 | ||||||||||||||||||
| Adjusted EBITDA (R$ million)¹ | 5,942 | 4,864 | 22 | % | 4,180 | 42 | % | 18,550 | ||||||||||||||||
| Adjusted EBITDA¹ Margin - ex-Klabin | 60 | % | 55 | % | 5 p.p. | 52 | % | 8 p.p. | 54 | % | ||||||||||||||
| Sales Volume ex-Klabin (k ton) | 2,833 | 2,944 | -4 | % | 3,013 | -6 | % | 11,640 | ||||||||||||||||
| Adjusted EBITDA¹ ex-Klabin/ton (R$/ton) | 2,097 | 1,652 | 27 | % | 1,387 | 51 | % | 1,594 |
¹ Excludes non-recurring items and PPA effects.
The growth in adjusted EBITDA in 2Q21 compared to 1Q21 is due to the 20% increase in net average pulp price in USD and lower SG&A expenses, partially offset by the decline in average USD vs. BRL (3%), lower sales volume and the increase in cash COGS per ton, as mentioned earlier. The 27% increase in EBITDA per ton is the result of price and SG&A expenses reduction, partially offset by the depreciation of the average USD vs. BRL (-3%) and production cost increase.
Compared to 2Q20, the 42% increase in Adjusted EBITDA was largely due to higher net average price of pulp in USD (+35%), partially offset by the decline in sales volume (-6%) and in average USD vs. BRL (2%), as well as higher cash COGS per ton (higher cost of production and logistics costs). Adjusted EBITDA per ton increased 51% due to the price factor and was partially offset by the exchange rate effect and higher cash COGS per ton.
FINANCIAL RESULT
| Financial Result (R$ million) | 2Q21 | 1Q21 | ΔQ-o-Q | 2Q20 | ΔY-o-Y | LTM 2Q21 | ||||||||||||||||||
| Financial Expenses | (932 | ) | (991 | ) | -6 | % | (1,033 | ) | -10 | % | (4,263 | ) | ||||||||||||
| Interest on loans and financing (local currency) | (146 | ) | (132 | ) | 10 | % | (191 | ) | -24 | % | (617 | ) | ||||||||||||
| Interest on loans and financing (foreign currency) | (590 | ) | (626 | ) | -6 | % | (660 | ) | -11 | % | (2,817 | ) | ||||||||||||
| Capitalized interest¹ | 1 | 0 | - | 4 | -84 | % | 4 | |||||||||||||||||
| Other financial expenses | (197 | ) | (233 | ) | -15 | % | (187 | ) | 6 | % | (832 | ) | ||||||||||||
| Financial Income | 46 | 24 | 91 | % | 82 | -44 | % | 195 | ||||||||||||||||
| Interest on financial investments | 29 | 20 | 48 | % | 38 | -23 | % | 88 | ||||||||||||||||
| Other financial income | 17 | 4 | 290 | % | 44 | -62 | % | 107 | ||||||||||||||||
| Monetary and Exchange Variations | 6,896 | (5,206 | ) | - | (2,930 | ) | - | 4,508 | ||||||||||||||||
| Foreign exchange variations (Debt) | 7,663 | (5,598 | ) | - | (3,177 | ) | - | 5,065 | ||||||||||||||||
| Other foreign exchange variations | (768 | ) | 391 | - | 247 | - | (557 | ) | ||||||||||||||||
| Derivative income (loss), net² | 3,733 | (2,494 | ) | - | (1,776 | ) | - | 2,652 | ||||||||||||||||
| Cash flow hedge | 1,748 | (1,277 | ) | - | (1,064 | ) | - | 1,343 | ||||||||||||||||
| Debt hedge | 2,015 | (1,185 | ) | - | (679 | ) | - | 1,495 | ||||||||||||||||
| Others³ | (30 | ) | (32 | ) | -7 | % | (33 | ) | -9 | % | (186 | ) | ||||||||||||
| Net Financial Result | 9,743 | (8,667 | ) | - | (5,657 | ) | - | 3,092 |
¹ Capitalized interest due to construction in progress.
² Variation in mark-to-market adjustment (2Q21: -R$4,103 million | 1Q21: -R$8,557 million), plus adjustments paid and received (2Q21 = -R$722 million).
³ Includes commodity hedging and embedded derivatives.
Page 14 of 36

Financial expenses were down 6% from 1Q21, mainly due to the 3% depreciation of the average USD against the BRL. Compared to 2Q20, the 10% reduction was due to the decrease on interest in local currency, in turn as a result of the settlement of debts such as CRA, BNDES, FDCO and BNB, and due to the reduction on interest in foreign currency, mainly due to the withdraw of RCF (Revolving Credit Facility) in that quarter as an initiative to strengthen the cash position, subsequently settled as disclosed to the market at the time. Those effects were partially offset by the 6% increase in other financial expenses, related to charges on assignment of receivables due to the greater volume of operations of this nature.
Financial income grew 91% in relation to 1Q21, due to the increase in CDI, the main index of the company's financial investments and higher cash position. Compared to 2Q20, financial income decreased 44% due to the drop in interest rates on foreign currency investments, cash position reduction and the decline in revenue from goodwill resulting from the merger of Fibria, which was fully amortized in 2020.
Inflation adjustment and exchange variation had a positive impact of R$6,896 million on the Company’s quarterly financial result due to the 12% increase in the end-of-period rate of BRL against USD on the foreign currency portion of debt (81% of total debt). Note that the accounting impact of exchange variation on foreign currency debt has a cash impact only on the respective maturities.
Derivative operations generated an income of R$3,733 million in 2Q21, mainly due to the effect of stronger BRL on debt hedge and cash flow transactions, despite the negative impact caused by the variations in the fixed, coupon and Libor rate curves on the transactions. The mark-to-market adjustment of derivative instruments on June 30, 2021 was an expense of R$4,103 million, compared to an expense of R$8,557 million on March 31, 2021, representing a positive variation of R$4,455 million. Note that the impact of BRL appreciation on the derivatives portfolio generates a cash impact only upon the respective maturities. The net effect on cash, which refers to the maturity of derivative operations in the second quarter, was a negative R$722 million (R$192 million expense from debt hedge and R$530 million expense from operating and commodity hedge).
Due to the above factors, net financial result in 2Q21, considering all financial expense and income lines, was an income of R$9,743 million, compared to an expense of R$8,667 million in 1Q21 and R$5,657 million in 2Q20.
DERIVATIVE OPERATIONS
Suzano carries out derivative operations exclusively for hedging purposes. The following table reflects the position of derivative hedging instruments on June 30, 2021:
| Notional (US$ million) | Fair Value (R$ million) | |||||||||||||||
| Hedge¹ | Jun/2021 | Mar/2021 | Jun/2021 | Mar/2021 | ||||||||||||
| Debt | 6,507 | 6,486 | (5,218 | ) | (7,424 | ) | ||||||||||
| Cash Flow | 3,857 | 4,192 | 860 | (1,450 | ) | |||||||||||
| Others² | 613 | 650 | 255 | 317 | ||||||||||||
| Total | 10,976 | 11,329 | (4,103 | ) | (8,557 | ) | ||||||||||
¹Refer to note 4 of the 1Q21 Quarterly Financial Statements (ITR) for further details and fair value sensitivity analysis.
2Includes commodity hedge and embedded derivatives.
The Company’s financial policy seeks to minimize the volatility of its cash generation and to impart greater flexibility to cash flow management. Currently, the policy stipulates that surplus dollars may be partially hedged (at least 40% and up to 75% of exchange variation exposure over the next 18 months) using plain vanilla instruments, such as Zero Cost Collars (ZCC) and Non-Deliverable Forwards (NDF).
ZCC transactions establish minimum and maximum limits for the exchange rate that minimize adverse effects in the event of significant appreciation in the BRL. If the exchange rate is within such limits, the Company neither pays nor receives any financial adjustments. Therefore, the Company is protected in scenarios of extreme BRL appreciation. However, these transactions also limit potential gains in scenarios of extreme BRL depreciation. This characteristic allows for capturing greater benefits from export revenue in a potential scenario of USD appreciation within the range contracted.
Page 15 of 36

On June 30, 2021, the outstanding notional value of operations involving forward dollar sales through ZCCs was US$3,778 million, whose maturities are distributed from July 2021 to November 2022, with an average forward rate ranging from R$5.21 to R$6.00. On the same date, the outstanding notional value of operations involving forward USD sales through NDFs was US$80 million, whose maturities are distributed between October 2021 and March 2022 and with an average rate of R$5.36. In 2Q21, cash flow hedge operations resulted in a gain of R$1,748 million. The mark-to-market adjustment (fair value) of ZCC transactions was a gain of R$837 million and for NDFs was a gain of R$23 million at the end of the quarter.
The following table presents a sensitivity analysis of the cash impact that the Company could have on its cash flow hedge portfolio (ZCC and NDF) if the future exchange rate remains the same as at the end of 2Q21 (R$/US$ = 5.00) in the coming quarters; as well as the projected variation in cash impact for each R$0.10 variation above the call strike level of each quarter. Note that the figures presented in the table are the Company’s projections based on the end-of-period curves and could fluctuate depending on market conditions.
| Cash adjustment (R$ million) | ||||||||||||||||||||
| Maturity (up to) | Strike Range | Notional (US$ million) | Actual | R$ / US$ = 5.00 (2Q21) | Sensitivity at R$ 0.10 / US$ variation (+/-)1 | |||||||||||||||
| Zero Cost Collars | ||||||||||||||||||||
| 2Q21 | - | - | (562 | ) | - | - | ||||||||||||||
| 3Q21 | 4.87 – 5.67 | 807 | 12 | (81 | ) | |||||||||||||||
| 4Q21 | 5.22 – 6.12 | 969 | - | 222 | (97 | ) | ||||||||||||||
| 1Q22 | 5.37 – 6.10 | 731 | - | 271 | (73 | ) | ||||||||||||||
| 2Q22 | 5.33 – 6.06 | 961 | - | 316 | (96 | ) | ||||||||||||||
| 3Q22 | 5.31 – 6.01 | 270 | - | 84 | (27 | ) | ||||||||||||||
| 4Q22 | 5.10 – 6.02 | 40 | - | 4 | (4 | ) | ||||||||||||||
| Total | 5.21 – 6.00 | 3,778 | (562 | ) | 908 | (378 | ) | |||||||||||||
| NDF | ||||||||||||||||||||
| 2Q21 | ||||||||||||||||||||
| 3Q21 | 5.33 | 50 | - | 16 | (5 | ) | ||||||||||||||
| 4Q21 | - | - | - | - | - | |||||||||||||||
| 1Q22 | 5.42 | 30 | - | 12 | (3 | ) | ||||||||||||||
| Total | 5.36 | 80 | 0 | 28 | (8 | ) | ||||||||||||||
¹ Note: sensitivity of adjustments for exchange rates above the strike.
The Company also uses currency and interest rate swaps to mitigate the effects of exchange and interest rate variations on its debt and its cash flow. Contracts swapping different interest rates and inflation indexes may be entered into as a way to mitigate the mismatch between financial assets and liabilities.
On June 30, 2021, the Company had outstanding (notional value) US$6,507 million distributed as shown in the table below. In 2Q21, the result of liability hedge transactions was a gain of R$2,015 million, mainly due to BRL appreciation in the period. The mark-to-market (fair value) of such operations was negative by R$5,218 million at the end of the quarter.
| Notional (US$ million) | Fair value (R$ million) | |||||||||||||||||||||
| Debt Hedge | Maturity (up to) | Currency | Jun/2021 | Mar/2021 | Jun/2021 | Mar/2021 | ||||||||||||||||
| Swap (PRÉ x USD) | 2024 | USD | 350 | 350 | (529 | ) | (786 | ) | ||||||||||||||
| Swap (CDI x USD) | 2026 | USD | 2,267 | 2,267 | (4,166 | ) | (5,912 | ) | ||||||||||||||
| Swap (IPCA x USD) | 2023 | USD | 121 | 121 | 270 | (179 | ) | |||||||||||||||
| Swap (LIBOR x USD) | 2026 | USD | 3,600 | 3,600 | (706 | ) | (827 | ) | ||||||||||||||
| Swap (IPCA x CDI) | 2023 | BRL | 169¹ | 148 | (86 | ) | 280 | |||||||||||||||
| Total | 6,507 | 6,486 | (5,218 | ) | (7,424 | ) | ||||||||||||||||
1Translated at the closing exchange rate (5.00).
Page 16 of 36

The following table presents a sensitivity analysis1 of the cash impact that the Company could have on its debt hedge portfolio (swaps) if the future exchange rate remains the same as at the end of 2Q21 (R$/US$ = 5.00) in the coming quarters; as well as the projected variation in cash impact for each R$0.10 variation on the same reference exchange rate (2Q21). Note that the figures presented in the table are the Company’s projections based on the end-of-period curves and could fluctuate depending on market conditions.
| Cash adjustment (R$ million | |||||||||||||||||
| Maturity (up to) | Notional (US$ million) | Actual | R$ / US$ = 5.00 (2Q21) | Sensitivity at R$ 0.10 / US$ variation (+/-)1 | |||||||||||||
| 2Q21 | (192 | ) | |||||||||||||||
| 3Q21 | 83 | - | (113 | ) | (4 | ) | |||||||||||
| 4Q21 | 83 | - | (138 | ) | (7 | ) | |||||||||||
| 2022 | 737 | - | (728 | ) | (60 | ) | |||||||||||
| 2023 | 2,187 | - | (118 | ) | (49 | ) | |||||||||||
| 2024 | 1,369 | - | (249 | ) | (46 | ) | |||||||||||
| 2025 | 1,194 | - | (880 | ) | (90 | ) | |||||||||||
| >2026 | 855 | - | (953 | ) | (85 | ) | |||||||||||
| Total | 6,508 | (192 | ) | (3,179 | ) | (341 | ) | ||||||||||
¹Sensitivity analysis considers variation only in the exchange rate (R$/US$), while other variables are presumed constant.
Other transactions involving the Company’s derivatives are related to the embedded derivative resulting from the forestry partnerships and commodity hedges (maritime fuel), as described below.
Notional (US$ million) | Fair value (R$ million) | Cash adjustment (R$ million) | ||||||||||||||||||||||||||||
| Other hedges | Maturity (up to) | Index | Jun/2021 | Mar/2021 | Jun/2021 | Mar/2021 | 2Q21 | 1Q21 | ||||||||||||||||||||||
| Embedded derivative | 2035 | Fixed USD | USD US-CPI | 613 | 635 | 255 | 290 | - | - | ||||||||||||||||||||||
| Commodities | 2021 | Brent/VLSFO | - | 15 | - | 26 | 32 | 22 | ||||||||||||||||||||||
| Total | 613 | 650 | 255 | 317 | 32 | 22 | ||||||||||||||||||||||||
Forestry partnership agreements and wood supply agreements signed on December 31, 2013 are denominated in USD per cubic meter of standing timber, adjusted by U.S. inflation measured by the Consumer Price Index (CPI), which is not related to inflation in the economic environment where the forests are located and, hence, constitutes an embedded derivative. This instrument, which is presented in the table above, consists of a swap contract with the short leg consisting of the variations in the US-CPI during the period of the agreements mentioned below. See note 4 of the 2Q21 Financial Statements for more details and for a sensitivity analysis of the fair value in case of a sharp rise in the U.S. CPI. On June 30, 2021, the outstanding (notional) value of the operation was US$613 million. The result of this swap in 2Q21 was a loss of R$36 million. The mark-to-market (fair value) adjustment of these operations generated a gain of R$255 million at the end of the quarter.
Page 17 of 36
The Company is also exposed to international Brent prices, which is reflected in the logistics costs of exports and in certain raw materials. In this case, the Company evaluates the possibility of contracting derivative instruments to mitigate the risk.
On June 30, 2021, the Company did not have open commodity hedge transactions. The result of these operations in 2Q21 was positive by R$ 6 million.

*Debt in BRL translated into USD at the closing exchange rate of the month (R$/US$5.00 on 06/30/2021).
NET INCOME (LOSS)
In 2Q21, the Company posted net income of R$10,037 million, compared to net loss of R$2,755 million in 1Q21 and R$2,053 million in 2Q20. The growth in relation to 1Q21 was driven by financial income which, in turn, is due to the effects of exchange variation on debt and the result from derivative transactions, as well as higher operating income. Compared to 2Q20, the increase of R$12,792 million in net income mainly reflects the growth in financial income (lower impact of negative exchange variation on debt and derivatives) and better operating income.
Page 18 of 36
DEBT
| Debt (R$ million) | 06/30/2021 | 03/31/2021 | Δ Y-o-Y | 06/30/2020 | Δ Q-o-Q | |||||||||||||||
| Local Currency | 13,275 | 13,295 | 0% | 16,765 | -21% | |||||||||||||||
| Short Term | 1,003 | 1,027 | -2% | 1,966 | -49% | |||||||||||||||
| Long Term | 12,272 | 12,268 | 0% | 14,799 | -17% | |||||||||||||||
| Foreign Currency | 55,202 | 62,619 | -12% | 63,863 | -14% | |||||||||||||||
| Short Term | 917 | 1,117 | -18% | 3,580 | -74% | |||||||||||||||
| Long Term | 54,285 | 61,503 | -12% | 60,283 | -10% | |||||||||||||||
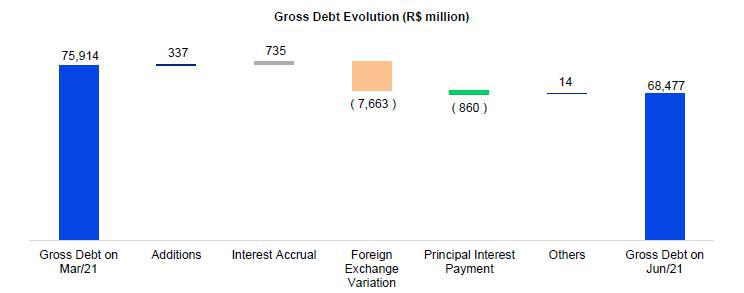
| Gross Debt | 68,477 | 75,914 | -10% | 80,629 | -15% | |||||||||||||||
| (-) Cash | 11,271 | 9,599 | 17% | 12,687 | -11% | |||||||||||||||
| Net debt | 57,206 | 66,315 | -14% | 67,941 | -16% | |||||||||||||||
| Net debt/Adjusted EBITDA1(x) - R$ | 3.1x | 3.9x | -0,8x | 5.6x | -2.5x | |||||||||||||||
| Net debt/Adjusted EBITDA1(x) - US$ | 3.3x | 3.8x | -0,5x | 4.7x | -1.4x | |||||||||||||||
¹ Excluding non-recurring items.
Gross debt on June 30, 2021 amounted to R$68.5 billion, composed of 97% long-term maturities and 3% short-term maturities. Debt denominated in foreign currency accounted for 81% of the Company's total debt, while debt in local currency accounted for the remaining 19%. The percentage of gross debt denominated in foreign currency, considering the effect of debt hedge, was 97%. Gross debt declined 10% in relation to 1Q21 (R$7.5 billion), chiefly due to the appreciation of BRL against USD.
Suzano contracts debt in foreign currency as a natural hedge, since net operating cash generation is denominated in foreign currency (U.S. dollar) due to its predominant status as an exporter. This structural exposure allows the Company to match loans and financing payments in USD with receivable flows from sales.
*Corresponding mainly to transaction costs (issue, funding etc.).
On June 30, 2021, the total average cost of debt in USD was 4.4% p.a. (debt in BRL adjusted by the market swap curve), compared to 4.5% p.a. on March 31, 2021. The average term of consolidated debt at the end of the quarter was 87 months (90 months in March 2021).
Page 19 of 36
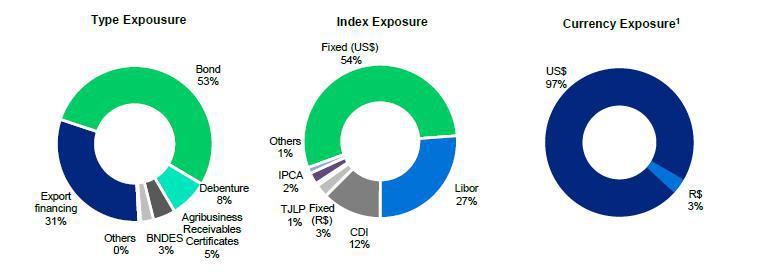
¹ Considers the portion of debt with currency swaps. The original debt was 81% denominated in USD and 19% in BRL.
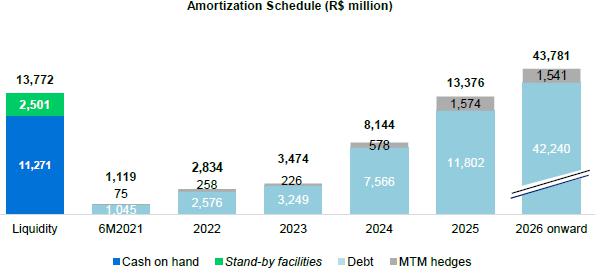
Cash and cash equivalents on June 30, 2021 amounted to R$11,271 million, 75% of which were invested in foreign currency fixed-income and short-term investments. The local currency portion was invested in government and fixed-income bonds, remunerated at a percentage of the DI rate.
The Company has a stand-by credit facility in foreign currency of US$500 million (R$2,501 million) available through February 2024. This facility helps improve the company's liquidity position and can be withdrawn during times of uncertainty, such as during the first half of 2020, when the COVID-19 pandemic broke out. As a result, the current cash position of R$11,271 million plus the facility described above amount to a readily available cash position of R$13,772 million.
Page 20 of 36
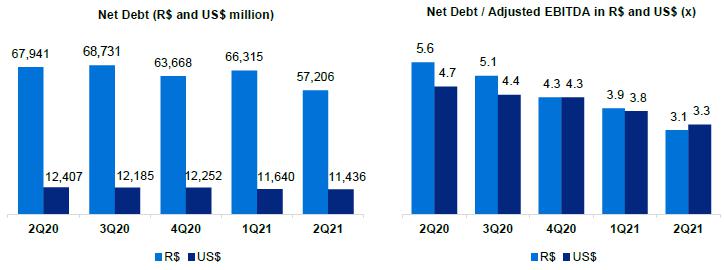
Net debt on June 30, 2021 stood at R$57.2 billion (US$11.4 billion), compared to R$66.3 billion (US$11.6 billion) on March 31, 2021. The biggest impact on net debt in local currency came from the appreciation of the BRL against the USD (12%).
Financial leverage, measured as the ratio of net debt to Adjusted EBITDA in BRL, stood at 3.1 times on June 30, 2021, compared to 3.9 times in 1Q21. The same ratio in USD, a measure established in Suzano’s financial policy, fell from 3.8 times in 1Q21 to 3.3 times on June 30, 2021.
Stand-by facilities
Cash on hand
|  |
The breakdown of total gross debt between trade and non-trade finance on June 30, 2021 is shown below:
| 2021 | 2022 | 2023 | 2024 | 2025 | 2026 onward | Total | ||||||||||||||||||||||
| Trade Finance¹ | 12 | % | 35 | % | 46 | % | 75 | % | 62 | % | 13 | % | 31 | % | ||||||||||||||
| Non Trade Finance² | 88 | % | 65 | % | 54 | % | 25 | % | 38 | % | 87 | % | 69 | % | ||||||||||||||
¹ ACC, ACE, NCE, PPE
² Bonds, BNDES, CRA, Debentures, among others.
Page 21 of 36

In 2Q21, capital expenditure (cash basis) totaled R$1,264 million, down 4% from 1Q21, mainly due to lower expenses with land, forests and port terminals (lower spending on the Maranhão port project), which were partially offset by higher expenses with the Cerrado Project due to the hiring of temporary works and earthmoving services. Compared to 2Q20, capex increased 25% as a result of higher investments on maintenance (mainly in forestry maintenance) and in the Cerrado Project, as mentioned earlier.
| Investments (R$ million) | 2Q21 | 1Q21 | ΔQ-o-Q | 2Q20 | ΔY-o-Y | LTM 2Q21 | Guidance 2021 | ||||||||||||||||||
| Maintenance | 1.001 | 999 | 0 | % | 808 | 24 | % | 3,304 | 4,038 | ||||||||||||||||
| Industrial maintenance | 141 | 149 | -5 | % | 113 | 25 | % | 576 | 829 | ||||||||||||||||
| Forestry maintenance | 849 | 845 | 1 | % | 691 | 23 | % | 2,619 | 3,076 | ||||||||||||||||
| Others | 11 | 5 | 119 | % | 4 | 176 | % | 109 | 133 | ||||||||||||||||
| Expansion and modernization | 29 | 27 | 7 | % | 67 | -57 | % | 614 | 240 | ||||||||||||||||
| Land and forestry | 49 | 184 | -73 | % | 66 | -25 | % | 768 | 752 | ||||||||||||||||
| Port terminals | 11 | 93 | -88 | % | 33 | -65 | % | 287 | 152 | ||||||||||||||||
| Maintenance | 0 | - | - | - | - | - | 79 | ||||||||||||||||||
| Cerrado Project1 | 174 | 21 | 746 | % | 39 | 343 | % | 227 | 957 | ||||||||||||||||
| Total | 1,264 | 1,323 | -4 | % | 1,012 | 25 | % | 5,200 | 6,218 |
1Some capital expenditures have been reclassified to better reflect those expenditures that became part of the Cerrado Project.
| Operating cash flow - Consolidated (R$ million) | 2Q21 | 1Q21 | ΔQ-o-Q | 2Q20 | ΔY-o-Y | LTM 2Q21 | |||||||||||||||
| Adjusted EBITDA1 | 5,942 | 4,864 | 22 | % | 4,180 | 42 | % | 18,550 | |||||||||||||
| Maintenance Capex2 | (1,001 | ) | (999 | ) | 0 | % | (808 | ) | 24 | % | (3,908 | ) | |||||||||
| Operating Cash Flow | 4,940 | 3,866 | 28 | % | 3,372 | 47 | % | 14,641 | |||||||||||||
| Operating Cash Flow (R$/ton)³ | 1,744 | 1,313 | 33 | % | 1,119 | 56 | % | 1,258 |
¹ Excludes non-recurring items and PPA effects.
² Cash basis.
³ Excludes sales volume from Klabin.
Operating cash generation, measured by adjusted EBITDA less sustaining capex (cash basis), amounted to R$4,940 million in 2Q21. The increase in operating cash generation per ton compared to 1Q21 is related to the growth of EBITDA per ton. The 56% increase in relation to 2Q20 is related to the EBITDA growth mentioned earlier, partially offset by higher sustaining capex per ton.

Page 22 of 36

| Free Cash Flow (R$ million) | 2Q21 | 1Q21 | ΔQ-o-Q | 2Q20 | ΔY-o-Y | LTM 2Q21 | ||||||||||||||||||
| Adjusted EBITDA | 5,942 | 4,864 | 22 | % | 4,180 | 42 | % | 16,788 | ||||||||||||||||
| (-) Total Capex¹ | (1,332 | ) | (969 | ) | 38 | % | (1,083 | ) | 23 | % | (5,237 | ) | ||||||||||||
| (-) Leasing contracts – IFRS 16 | (226 | ) | (249 | ) | -9 | % | (197 | ) | 15 | % | (945 | ) | ||||||||||||
| (+/-) D Working capital | (573 | ) | (518 | ) | - | 593 | - | 916 | ||||||||||||||||
| (-) Net interest | (280 | ) | (1,194 | ) | -77 | % | (441 | ) | -36 | % | (3,322 | ) | ||||||||||||
| (-) Income taxes | (36 | ) | (35 | ) | 1 | % | (34 | ) | 5 | % | (196 | ) | ||||||||||||
| (-) Dividend payment | (2 | ) | 0 | - | 0 | - | (2 | ) | ||||||||||||||||
| Free cash flow | 3,492 | 1,900 | 84 | % | 3,018 | 16 | % | 8,000 | ||||||||||||||||
| (+) Capex ex-maintenance | 241 | 101 | -7 | % | 161 | 50 | % | 748 | ||||||||||||||||
| (+) Dividend payment | 2 | 0 | - | 0 | - | 2 | ||||||||||||||||||
| Free cash flow - Adjusted | 3,735 | 2,000 | 73 | % | 3,178 | 18 | % | 8,750 | ||||||||||||||||
| (-) Derivative cash adjustment | (722 | ) | (713 | ) | - | (1,661 | ) | -57 | % | (4,066 | ) | |||||||||||||
| Free cash flow - Adjusted - after derivatives² | 3,013 | 1,288 | 108 | % | 1,517 | 99 | % | 4,684 |
1Accrual basis.
²Free cash flow prior to dividend payments and capex ex-maintenance (accrual basis).
Free cash flow considering the adjustment for derivatives stood at R$3,013 million in 2Q21, compared to R$1,288 million in 1Q21 and R$1,517 million in 2Q20. Compared to the previous period, free cash flow grew 108%, driven by growth in adjusted EBITDA and the lower concentration of net interest payments (especially on bonds), which were partially offset by the increase in sustaining capex (accrual basis).
Compared to 2Q20, the 99% increase was driven by the 42% growth in adjusted EBITDA, lower payments resulting from derivative adjustments and lower net interest payments (gross debt reduction). These effects were partially offset by the negative variation in working capital and higher sustaining capex. With regard to the variation in working capital, it is worth highlighting the receivables line, which was largely impacted by the higher net average price of pulp, and the inventory line, whose quarterly variation was driven by higher inventories of finished products and cost increases (in contrast to the decline in inventories during 2Q20)
On May 17, 2021, the Company increased the capital stock of its affiliated company Spinnova by EUR 5 million (equivalent to R$33 million on the transaction date), thus increasing its interest from 23.44% to 27.15% and holding 9,808,530 shares.
On June 24, 2021, Spinnova held its Initial Public Offering (IPO) on the Nasdaq First North Growth Market, issuing 13,140,605 shares and raising EUR 100 million (equivalent to R$588 million on the transaction date).
As a result of the share issue, Suzano’s interest in Spinnova declined from 27.15% to 19.91%.
The investment totaled EUR21 million (R$125 million on June 30, 2021), after the IPO that generated the aforementioned equity dilution, and consequent gain on the remeasurement of the investment in the amount of EUR 19 million (R$116 million in the transaction date).
With the onset of the COVID-19 pandemic, Suzano adopted and has maintained preventive and mitigatory measures in compliance with the rules and policies established by Brazilian and international health authorities to minimize the impacts of the COVID-19 pandemic on the safety of people, society and its business.
The Company’s actions are based on three pillars: (1) People; (2) Society; (3) Business Continuity.
Page 23 of 36
| (1) | People: To ensure the safety of its employees and contractors who work in its operations, Suzano adopted a series of measures to mitigate their exposure and/or mitigate the risks of exposure. |
| (2) | Society: One of Suzano’s three culture drivers is “It's only good for us if it's good for the world.” Accordingly, from the onset of the pandemic till now, the Company has taken a series of measures to protect society, including: |
| · | Donation of tissue paper, napkins and disposable diapers produced by it to needy regions. |
| · | Acquisition of 159 ventilators and 1 million medical masks for donation to the federal and state governments. |
| · | Participation in a joint effort with Positivo Tecnologia, Klabin, Flextronics and Embraer to support the Brazilian company Magnamed in manufacturing ventilators, which were delivered to the Brazilian government. Suzano invested R$9.6 million in this action in 2020. |
| · | Construction of a field hospital in Teixeira de Freitas, Bahia, jointly with Veracel, which was delivered to the state government and inaugurated in July 2020. |
| · | Partnership with the vocational school Fatec in Capão Bonito to produce hand sanitizer. |
| · | Forklifts lent to transport the donations received by the Red Cross. |
| · | Maintenance of all direct jobs. |
| · | Maintenance for 90 days (until the end of June 2020) the payment of 100% of the payroll expenses of employees of service providers whose operations were suspended because of the pandemic, in order to protect jobs. |
| · | Creation of a support program for small suppliers, a social program to help small farmers sell their produce via a home delivery system in 38 communities assisted by Suzano’s Rural Land Development Program (“PDRT”) in five states, and a social program to produce 125,000 masks in local communities for donation in five states. |
| · | Launch of a support program for small and midsized paper clients called “We’re Together” to ensure that these companies have the financial and managerial capacity to resume operations. |
| · | Support for the State Government of Maranhão in setting up the Imperatriz Temporary Hospital, donating R$3 million. |
| · | Supply of 280,000 m³ of oxygen to the State of Amazonas. |
| · | Construction of a new treatment center for COVID-19 in São Paulo in partnership with Gerdau, BTG Pactual, Península Participações and through joint efforts with Hospital Israelita Albert Einstein and the Municipal Government of São Paulo. |
| · | Donation of oxygen concentrators, acquired in a joint effort involving Suzano, Bradesco, BRF, B3, Embraer, Gerdau, Grupo Ultra, Itaú Unibanco, Magazine Luiza, Marfrig, Natura & Co and Unipar, to the Health Ministry, which is tasked with the logistics of distributing the devices. |
| · | Donation of 66,000 m³ of oxygen to the city of Imperatriz in Maranhão and 1,300 m³ to Aracruz in Espírito Santo. |
Donations made in support of social actions implemented by Suzano totaled R$19 million in 2Q21, (see Note 29 – Result by Nature to the Financial Statements).
| (3) | Business continuity: To date, the Company is maintaining its operations normally and has set up a crisis management committee that continues to function. |
Page 24 of 36
The pulp and paper sector was recognized by the World Health Organization (WHO) and diverse countries as a producer of essential goods for society. Hence, to meet the responsibility arising from the essential nature of its business, Suzano took measures to ensure, to the maximum extent possible, that it maintains its operations normally and meets its clients’ requirements by increasing the level of wood and raw material inventories at plants and expanding its inventories of finished products, besides reaching out to its clients to minimize any risks of stockout at plants along the logistics chain and guarantee the sale of their products.
The current scenario arising from COVID-19 also implies higher credit risk, especially among its paper clients. Therefore, the Company has been monitoring this risk and implementing measures to mitigate it. To date, there have been no significant financial impacts.
As previously disclosed during the year 2020, the Company carried out a temporary 30-day production shutdown, as of April 27, 2020 and May 1, 2020, respectively, on the paper production lines at the Mucuri and Rio mills Green, however, the activities of the factories returned to normal levels in early July 2020 and have been maintained so far.
Lastly, it is important to mention that in light of the current scenario, the Company has taken and maintained intensive communication efforts to further increase interactions with its main stakeholders in order to ensure adequate transparency and flow of information with them in a timely manner aligned with the current social and economic situation. All key updates on its measures and activities in the context of COVID-19 are available on the Company’s Investor Relations website.
The Company has also created a webpage with information on all its actions related to COVID-19: https://www.suzanocontraocoronavirus.com.br
In the second quarter of 2021, we made significant progress in the ESG agenda. To further strengthen Suzano's relations with its suppliers and encourage the adoption of joint commitments to reduce emissions, the company launched the Climate Change in the Value Chain Program in April in partnership with CDP, an international non-profit organization. This alliance will engage and assist our suppliers in measurements, data transparency, establishment of targets, as well as the assessment of risks and opportunities related to climate change. The program will help expand knowledge on the theme across the value chain, consequently enabling suppliers to streamline their emissions management practices.
In June, Suzano held its ESG Call, which registered more than 1,300 participants. The company sought to: (i) report on progress in governance and transparency in Annual Report 2020 and Indicator Center released in May, 4 “Position Papers” on relevant subjects, (ii) present the status of its long-term goals in 2020 and perspectives; and (iii) announce its new Biodiversity long term goal. The Company also discussed important topics such as combating deforestation and reinforced its willingness to play an active role at COP 15 on Biodiversity and COP 26 on Climate Change. The event also featured a debate (Q&A) with our executive board, which was mediated by our special guest Pavan Sukhdev, with the objective of promoting an interaction with transparency and quality on issues that are important for the company. The recorded event is available on Suzano’s channel on YouTube and the presentation can be accessed at the Company’s Investor Relations website.
In what refers to its new biodiversity goal, it is worth mentioning that it represents an innovative objective for the global pulp and paper industry, by having as a commitment connecting half a million hectares of priority areas for biodiversity conservation in the Cerrado, Atlantic Forest and Amazon biomes by 2030, which will help preserve biodiversity and balance among the ecosystems, which is an important factor for Suzano’s operations and to face global challenges.
Still in June, Suzano issued a Sustainability-Linked Bond (SLB) in the international market through its wholly-owned subsidiary Suzano Austria GmbH ("Suzano Austria"), in the principal amount of US$1 billion, with a yield of 3.280% p.a. and coupon of 3.125% p.a., to be paid semiannually and maturing on January 15, 2032. The bond is linked to two targets: (i) 12.4% reduction in the industrial use of water by the end of 2026; and (ii) 30% of leadership positions in the Company occupied by women by the end of 2025. As such, the issue is the first in the emerging markets to be linked to a Diversity & Inclusion indicator. The Sustainability Linked Securities Framework and the Second-Party Opinion from ISS-ESG are available at the Company’s Investor Relations website, as well as all the other contents mentioned above.
Page 25 of 36

TOTAL OPERATIONAL EXPENDITURE - PULP
As disclosed through a Material Fact notice on March 24, 2021, the estimated total operating expenditure for 2024 is approximately R$1,400/ton, and the trend for the indicator remains as planned, considering the exchange and inflation assumptions used.
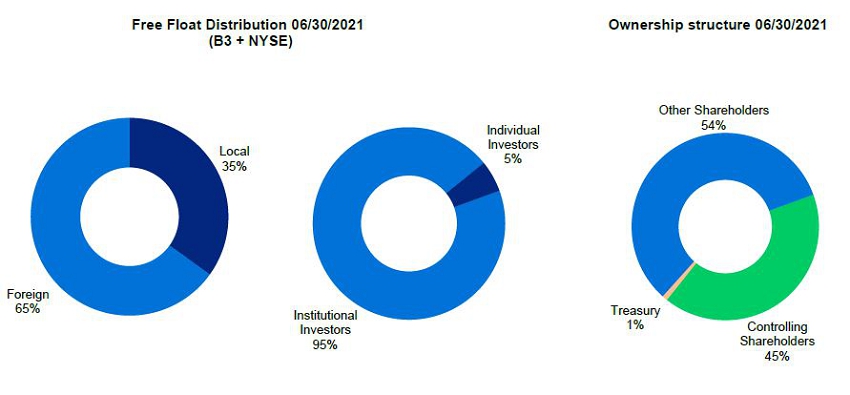
On June 30, 2021, Suzano’s stock was quoted at R$59.81/share (SUZB3) and US$12.04/share (SUZ). The Company’s stock is listed on the Novo Mercado, the listing segment of the São Paulo Stock Exchange (B3 – Brasil, Bolsa e Balcão) with the highest corporate governance standards, and on the New York Stock Exchange (NYSE) - Level II.

Source: Bloomberg.

Source: Bloomberg.
On June 30, 2021, the Company's share capital was represented by 1,361,263,584 common shares, of which 12,042,004 were held in Treasury. Suzano’s market capitalization on June 30, 2021 was R$81.4 billion. Free float in 2Q21 corresponded to 54% of the total capital.
Page 26 of 36
FIXED INCOME
| Unit | Jun/21 | Mar/21 | Jun/20 | Δ Y-o-Y | Δ Q-o-Q | |||||||||||||||||||
| Fibria 2024 – Price | USD/k | 112.02 | 110.95 | 107.46 | 4.2 | % | 1.0 | % | ||||||||||||||||
| Fibria 2024 – Yield | % | 0.98 | 1.62 | 3.18 | -69.2 | % | -39.4 | % | ||||||||||||||||
| Fibria 2025 – Price | USD/k | 108.04 | 107.27 | 103.25 | 4.6 | % | 0.7 | % | ||||||||||||||||
| Fibria 2025 – Yield | % | 1.65 | 1.99 | 3.22 | -48.8 | % | -17.2 | % | ||||||||||||||||
| Suzano 2026 – Price | USD/k | 117.76 | 117.34 | 109.49 | 7.5 | % | 0.4 | % | ||||||||||||||||
| Suzano 2026 – Yield | % | 2.02 | 2.25 | 3.97 | -49.0 | % | -9.9 | % | ||||||||||||||||
| Fibria 2027 – Price | USD/k | 116.45 | 114.17 | 108.13 | 7.7 | % | 2.0 | % | ||||||||||||||||
| Fibria 2027 – Yield | % | 2.32 | 2.83 | 4.07 | -43.1 | % | -17.9 | % | ||||||||||||||||
| Suzano 2029 – Price | USD/k | 119.41 | 117.32 | 109.06 | 9.5 | % | 1.8 | % | ||||||||||||||||
| Suzano 2029 – Yield | % | 3.09 | 3.44 | 4.70 | -34.2 | % | -10.1 | % | ||||||||||||||||
| Suzano 2030 – Price | USD/k | 113.45 | 110.26 | 102.33 | 10.9 | % | 2.9 | % | ||||||||||||||||
| Suzano 2030 – Yield | % | 3.19 | 3.62 | 4.69 | -32.1 | % | -12.1 | % | ||||||||||||||||
| Suzano 2031 – Price | USD/k | 104.79 | 103.38 | - | - | 1.4 | % | |||||||||||||||||
| Suzano 2031 – Yield | % | 3.16 | 3.34 | - | - | -5.3 | % | |||||||||||||||||
| Suzano 2047 – Price | USD/k | 134.97 | 127.93 | 110.07 | 22.6 | % | 5.5 | % | ||||||||||||||||
| Suzano 2047 – Yield | % | 4.65 | 5.06 | 6.22 | -25.2 | % | -8.0 | % | ||||||||||||||||
| Treasury 10 years | % | 1.47 | 1.74 | 0.66 | 123.7 | % | -15.7 | % | ||||||||||||||||
Note: Senior Notes issued with face value of 100 USD/k
RATINGS
| Agência | Escala Local | Escala Global | Perspectiva | |||
| Fitch Ratings | AAA | BBB- | Estável | |||
| Standard & Poor’s | br.AAA | BBB- | Estável | |||
| Moody’s | Aaa.br | Baa3 | Estável |
Page 27 of 36
UPCOMING EVENTS
Earnings Conference Call (2Q21)
Date: August 12, 2021 (Thursday)
| Portuguese (simultaneous translation) | English |
| 10.00 a.m. (Brasilia) | 10:00 a.m. (Brasília) |
| 9:00 a.m. (New York) | 9:00 a.m. (New York) |
| 2:00 p.m. (London) | 2:00 p.m. (London) |
| Tel.: +55 (11) 3181-8565 | Tel.: +1 412 717-9627 |
Please connect 10 minutes before the conference call is scheduled to begin.
The conference call will be held in English and will feature a presentation, with simultaneous webcast. The access links will be available on the Company’s Investor Relations website (www.suzano.com.br/ir).
If you are unable to participate, the webcast link will be available for future consultation on the Investor Relations website of Suzano S.A.
IR CONTACTS
Marcelo Bacci
Camila Nogueira
Luísa Puccini
Mariana Dutra
Roberto Costa
Tel.: +55 (11) 3503-9330
ri@suzano.com.br
www.suzano.com.br/ir
Page 28 of 36
APPENDICES
APPENDIX 1 - Operating Data
| Revenue breakdown (R$ '000) | 2Q21 | 1Q21 | Δ Q-o-Q | 2Q20 | Δ Y-o-Y | 6M21 | 6M20 | Δ Y-o-Y | |||||||||||||||||||||||
| Exports | 8,292,725 | 7,540,691 | 10 | % | 7,043,721 | 18 | % | 15,833,416 | 12,862,475 | 23 | % | ||||||||||||||||||||
| Pulp | 7,885,580 | 7,139,229 | 10 | % | 6,633,011 | 19 | % | 15,024,809 | 12,121,368 | 24 | % | ||||||||||||||||||||
| Paper | 407,145 | 401,462 | 1 | % | 410,710 | -1 | % | 808,607 | 741,107 | 9 | % | ||||||||||||||||||||
| Domestic Market | 1,551,714 | 1,348,475 | 15 | % | 951,952 | 63 | % | 2,900,189 | 2,113,991 | 37 | % | ||||||||||||||||||||
| Pulp | 559,797 | 454,351 | 23 | % | 343,201 | 63 | % | 1,014,148 | 741,568 | 37 | % | ||||||||||||||||||||
| Paper | 991,917 | 894,124 | 11 | % | 608,751 | 63 | % | 1,886,041 | 1,372,423 | 37 | % | ||||||||||||||||||||
| Total Net Revenue | 9,844,439 | 8,889,166 | 11 | % | 7,995,673 | 23 | % | 18,733,605 | 14,976,466 | 25 | % | ||||||||||||||||||||
| Pulp | 8,445,377 | 7,593,580 | 11 | % | 6,976,212 | 21 | % | 16,038,957 | 12,862,936 | 25 | % | ||||||||||||||||||||
| Paper | 1,399,062 | 1,295,586 | 8 | % | 1,019,461 | 37 | % | 2,694,648 | 2,113,530 | 27 | % |
| Sales volume (‘000) | 2Q21 | 1Q21 | Δ Q-o-Q | 2Q20 | Δ Y-o-Y | 6M21 | 6M20 | Δ Y-o-Y | |||||||||||||||||||||||
| Exports | 2,427,453 | 2,540,952 | -4 | % | 2,710,040 | -10 | % | 4,968,405 | 5,421,701 | -8 | % | ||||||||||||||||||||
| Pulp | 2,339,906 | 2,450,654 | -5 | % | 2,615,068 | -11 | % | 4,790,560 | 5,241,607 | -9 | % | ||||||||||||||||||||
| Paper | 87,547 | 90,298 | -3 | % | 94,972 | -8 | % | 177,845 | 180,094 | -1 | % | ||||||||||||||||||||
| Paperboard | 8,647 | 9,954 | -13 | % | 21,935 | -61 | % | 18,601 | 37,534 | -50 | % | ||||||||||||||||||||
| Printing & Writing | 75,732 | 78,208 | -3 | % | 69,425 | 9 | % | 153,940 | 138,091 | 11 | % | ||||||||||||||||||||
| Other paper1 | 3,168 | 2,136 | 48 | % | 3,612 | -12 | % | 5,304 | 4,469 | 18 | % | ||||||||||||||||||||
| Domestic Market | 405,371 | 403,623 | 0 | % | 303,030 | 34 | % | 808,994 | 715,479 | 13 | % | ||||||||||||||||||||
| Pulp | 197,193 | 202,648 | -3 | % | 162,540 | 21 | % | 399,841 | 392,298 | 2 | % | ||||||||||||||||||||
| Paper | 208,178 | 200,975 | 4 | % | 140,490 | 48 | % | 409,153 | 323,181 | 27 | % | ||||||||||||||||||||
| Paperboard | 41,501 | 39,687 | 5 | % | 27,854 | 49 | % | 81,188 | 56,659 | 43 | % | ||||||||||||||||||||
| Printing & Writing | 138,448 | 134,688 | 3 | % | 81,399 | 70 | % | 273,136 | 204,266 | 34 | % | ||||||||||||||||||||
| Other paper1 | 28,229 | 26,600 | 6 | % | 31,237 | -10 | % | 54,829 | 62,256 | -12 | % | ||||||||||||||||||||
| Total Sales Volume | 2,832,824 | 2,944,575 | -4 | % | 3,013,070 | -6 | % | 5,777,399 | 6,137,180 | -6 | % | ||||||||||||||||||||
| Pulp | 2,537,099 | 2,653,302 | -4 | % | 2,777,608 | -9 | % | 5,190,401 | 5,633,905 | -8 | % | ||||||||||||||||||||
| Paper | 295,725 | 291,273 | 2 | % | 235,462 | 26 | % | 586,998 | 503,275 | 17 | % | ||||||||||||||||||||
| Paperboard | 50,148 | 49,641 | 1 | % | 49,789 | 1 | % | 99,789 | 94,193 | 6 | % | ||||||||||||||||||||
| Printing & Writing | 214,180 | 212,896 | 1 | % | 150,824 | 42 | % | 427,076 | 342,357 | 25 | % | ||||||||||||||||||||
| Other paper1 | 31,397 | 28,736 | 9 | % | 34,849 | -10 | % | 60,133 | 66,725 | -10 | % |
¹ Paper of other manufacturers sold by Suzano and tissue paper.
| Average net price (R$/ton) | 2Q21 | 1Q21 | Δ Q-o-Q | 2Q20 | Δ Y-o-Y | 6M21 | 6M20 | Δ Y-o-Y | |||||||||||||||||||||||
| Exports | 3,416 | 2,968 | 15 | % | 2,599 | 31 | % | 3,187 | 2,372 | 34 | % | ||||||||||||||||||||
| Pulp | 3,370 | 2,913 | 16 | % | 2,536 | 33 | % | 3,136 | 2,313 | 36 | % | ||||||||||||||||||||
| Paper | 4,651 | 4,446 | 5 | % | 4,325 | 8 | % | 4,547 | 4,115 | 10 | % | ||||||||||||||||||||
| Domestic Market | 3,828 | 3,341 | 15 | % | 3,141 | 22 | % | 3,585 | 2,955 | 21 | % | ||||||||||||||||||||
| Pulp | 2,839 | 2,242 | 27 | % | 2,111 | 34 | % | 2,536 | 1,890 | 34 | % | ||||||||||||||||||||
| Paper | 4,765 | 4,449 | 7 | % | 4,333 | 10 | % | 4,610 | 4,247 | 9 | % | ||||||||||||||||||||
| Total | 3,475 | 3,019 | 15 | % | 2,654 | 31 | % | 3,243 | 2,440 | 33 | % | ||||||||||||||||||||
| Pulp | 3,329 | 2,862 | 16 | % | 2,512 | 33 | % | 3,090 | 2,283 | 35 | % | ||||||||||||||||||||
| Paper | 4,731 | 4,448 | 6 | % | 4,330 | 9 | % | 4,591 | 4,200 | 9 | % |
Page 29 of 36
| Average net price (US$/ton) | 2Q21 | 1Q21 | ΔQ-o-Q | 2Q20 | ΔY-o-Y | 6M21 | 6M20 | ΔY-o-Y | |||||||||||
| Exports | 645 | 543 | 19 | % | 482 | 34 | % | 592 | 482 | 23 | % | ||||||||
| Pulp | 636 | 533 | 19 | % | 471 | 35 | % | 582 | 470 | 24 | % | ||||||||
| Paper | 878 | 813 | 8 | % | 802 | 9 | % | 844 | 836 | 1 | % | ||||||||
| Domestic Market | 722 | 611 | 18 | % | 583 | 24 | % | 666 | 600 | 11 | % | ||||||||
| Pulp | 536 | 410 | 31 | % | 392 | 37 | % | 471 | 384 | 23 | % | ||||||||
| Paper | 899 | 813 | 11 | % | 804 | 12 | % | 856 | 863 | -1 | % | ||||||||
| Total | 656 | 552 | 19 | % | 492 | 33 | % | 602 | 496 | 21 | % | ||||||||
| Pulp | 628 | 523 | 20 | % | 466 | 35 | % | 574 | 464 | 24 | % | ||||||||
| Paper | 893 | 813 | 10 | % | 803 | 11 | % | 852 | 853 | 0 | % |
| FX Rate BRL/USD | 2Q21 | 1Q21 | ΔQ-o-Q | 2Q20 | ΔY-o-Y | |||||||
| Closing | 5.00 | 5.70 | -12 | % | 5.48 | -9 | % | |||||
| Average | 5.30 | 5.47 | -3 | % | 5.39 | -2 | % |
Page 30 of 36
APPENDIX 2 – Consolidated Statement of Income and Goodwill Amortization
Income Statement (R$ ‘000) | 2Q21 | 1Q21 | ΔQ-o-Q | 2Q20 | ΔY-o-Y | 6M21 | 6M20 | ΔY-o-Y | ||||||||||||||||||||||||
| Net Revenue | 9,844,439 | 8,889,166 | 11 | % | 7,995,673 | 23 | % | 18,733,605 | 14,976,466 | 25 | % | |||||||||||||||||||||
| Cost of Goods Sold | (4,777,655 | ) | (4,845,034 | ) | -1 | % | (4,788,694 | ) | 0 | % | (9,622,689 | ) | (9,608,693 | ) | 0 | % | ||||||||||||||||
| Gross Debt | 5,066,784 | 4,044,132 | 25 | % | 3,206,979 | 58 | % | 9,110,916 | 5,367,773 | 70 | % | |||||||||||||||||||||
| Gross Margin | 51.5 | % | 45.5 | % | 6 p,p, | 40.1 | % | 11 p,p, | 48.6 | % | 35.8 | % | 13 p,p, | |||||||||||||||||||
| Operating Expense/Income | 139,703 | (437,201 | ) | - | (690,805 | ) | - | (297,498 | ) | (1,503,135 | ) | -80 | % | |||||||||||||||||||
| Selling Expenses | (496,934 | ) | (581,766 | ) | -15 | % | (547,098 | ) | -9 | % | (1,078,700 | ) | (1,062,034 | ) | 2 | % | ||||||||||||||||
| General and Administrative Expenses | (353,004 | ) | (382,554 | ) | -8 | % | (335,715 | ) | 5 | % | (735,558 | ) | (650,551 | ) | 13 | % | ||||||||||||||||
| Other Operating Income (Expenses) | 909,543 | 516,853 | 76 | % | 195,671 | 365 | % | 1,426,396 | 212,402 | 572 | % | |||||||||||||||||||||
| Equity Equivalence | 80,098 | 10,266 | 680 | % | (3,663 | ) | - | 90,364 | (2,952 | ) | - | |||||||||||||||||||||
| EBIT | 5,206,487 | 3,606,931 | 44 | % | 2,516,174 | 107 | % | 8,813,418 | 3,864,638 | 128 | % | |||||||||||||||||||||
| Depreciation, Amortization & Depletion | 1,696,755 | 1,766,481 | -4 | % | 1,709,381 | -1 | % | 3,463,236 | 3,357,581 | 3 | % | |||||||||||||||||||||
| EBITDA | 6,903,242 | 5,373,412 | 28 | % | 4,225,555 | 63 | % | 12,276,654 | 7,222,219 | 70 | % | |||||||||||||||||||||
| EBITDA Margin (%) | 70.1 | % | 60.4 | % | 10 p,p, | 52.8 | % | 17 p,p, | 65.5 | % | 48.2 | % | 17 p,p, | |||||||||||||||||||
| Adjusted EBITDA1 | 5,941,750 | 4,864,298 | 22 | % | 4,179,838 | 42 | % | 10,806,048 | 7,206,009 | 50 | % | |||||||||||||||||||||
| Adjusted EBITDA Margin1 | 60.4 | % | 54.7 | % | 6 p,p, | 52.3 | % | 8 p,p, | 57.7 | % | 48.1 | % | 10 p,p, | |||||||||||||||||||
| Net Financial Result | 9,742,584 | (8,667,121 | ) | -212 | % | (5,657,238 | ) | -272 | % | 1,075,463 | (28,101,286 | ) | -104 | % | ||||||||||||||||||
| Financial Expenses | 46,263 | 24,227 | 91 | % | 82,419 | -44 | % | 70,490 | 203,173 | -65 | % | |||||||||||||||||||||
| Financial Revenues | (932,159 | ) | (990,933 | ) | -6 | % | (1,033,126 | ) | -10 | % | (1,923,092 | ) | (2,119,550 | ) | -9 | % | ||||||||||||||||
| Exchange Rate Variation | 6,895,657 | (5,206,465 | ) | -232 | % | (2,930,209 | ) | -335 | % | 1,689,192 | (15,349,795 | ) | -111 | % | ||||||||||||||||||
| Net Proceeds Generated by Derivatives | 3,732,823 | (2,493,950 | ) | -250 | % | (1,776,322 | ) | -310 | % | 1,238,873 | (10,835,114 | ) | -111 | % | ||||||||||||||||||
| Earnings Before Taxes | 14,949,071 | (5,060,190 | ) | -395 | % | (3,141,064 | ) | -576 | % | 9,888,881 | (24,236,648 | ) | -141 | % | ||||||||||||||||||
| Income and Social Contribution Taxes | (4,912,372 | ) | 2,304,931 | -313 | % | 1,088,546 | -551 | % | (2,607,441 | ) | 8,765,069 | -130 | % | |||||||||||||||||||
| Net Income (Loss) | 10,036,699 | (2,755,259 | ) | -464 | % | (2,052,518 | ) | -589 | % | 7,281,440 | (15,471,579 | ) | -147 | % | ||||||||||||||||||
| Net Margin | 102.0 | % | -31.0 | % | 133 p,p, | -25.7 | % | 128 p,p, | 38.8 | % | -103.3 | % | 142 p,p, | |||||||||||||||||||
1 Excluding non-recurring items and PPA effects.
| Goodwill amortization - PPA (R$ ‘000) | 2Q21 | 1Q21 | ΔQ-o-Q | 2Q20 | ΔY-o-Y | ||||||||||
| COGS | (149,751 | ) | (142,737 | ) | 5 | % | (153,832 | ) | -3 | % | |||||
| Selling Expenses | (207,763 | ) | (207,591 | ) | 0 | % | (206,787 | ) | 0 | % | |||||
| General and administrative expenses | (2,668 | ) | (2,149 | ) | 24 | % | 2,094 | -227 | % | ||||||
| Other operational revenues (expenses) | (6,008 | ) | 2,259 | -366 | % | (5,085 | ) | 18 | % | ||||||
| Financial results | (3,054 | ) | (3,054 | ) | 0 | % | 18,479 | -117 | % |
Page 31 of 36
APPENDIX 3 – Consolidated Balance Sheet
| Assets (R$ ’000) | 06/30/2021 | 03/31/2021 | 06/30/2020 | |||||||||
| Current Assets | ||||||||||||
| Cash and cash equivalents | 8,585,570 | 5,334,508 | 10,473,701 | |||||||||
| Financial investments | 2,448,267 | 4,028,038 | 2,030,560 | |||||||||
| Trade accounts receivable | 3,979,086 | 3,692,928 | 3,762,875 | |||||||||
| Inventories | 4,404,865 | 3,989,789 | 4,206,778 | |||||||||
| Recoverable taxes | 382,415 | 406,352 | 888,245 | |||||||||
| Derivative financial instruments | 1,204,841 | 414,094 | 152,978 | |||||||||
| Advance to suppliers | 35,821 | 41,492 | 106,636 | |||||||||
| Other assets | 758,427 | 752,011 | 281,471 | |||||||||
| Total Current Assets | 21,799,292 | 18,659,212 | 21,903,244 | |||||||||
| Non-Current Assets | ||||||||||||
| Financial investments | 237,345 | 236,344 | 182,936 | |||||||||
| Recoverable taxes | 1,156,151 | 832,173 | 712,279 | |||||||||
| Deferred taxes | 6,224,616 | 11,044,593 | 10,454,646 | |||||||||
| Derivative financial instruments | 764,156 | 856,828 | 925,459 | |||||||||
| Advance to suppliers | 1,249,628 | 1,203,265 | 1,149,832 | |||||||||
| Judicial deposits | 298,049 | 275,118 | 268,462 | |||||||||
| Other assets | 222,695 | 224,663 | 231,633 | |||||||||
| Biological assets | 11,720,857 | 11,094,744 | 10,672,724 | |||||||||
| Investments | 497,083 | 379,564 | 325,420 | |||||||||
| Property, plant and equipment | 38,190,785 | 38,580,957 | 40,242,196 | |||||||||
| Right of use on lease agreements | 4,571,713 | 4,566,956 | 4,199,804 | |||||||||
| Intangible | 16,375,218 | 16,572,051 | 17,225,097 | |||||||||
| Total Non-Current Assets | 81,508,296 | 85,867,256 | 86,590,488 | |||||||||
| Total Assets | 103,307,588 | 104,526,468 | 108,493,732 | |||||||||
| Liabilities and Equity (R$ ´000) | 06/30/2021 | 03/31/2021 | 06/30/2020 | |||||||||
| Current Liabilities | ||||||||||||
| Trade accounts payable | 2,575,168 | 2,393,144 | 2,081,533 | |||||||||
| Loans, financing and debentures | 1,920,072 | 2,143,255 | 5,546,123 | |||||||||
| Accounts payable for lease operations | 593,691 | 632,812 | 704,174 | |||||||||
| Derivative financial instruments | 1,010,897 | 2,670,708 | 4,529,091 | |||||||||
| Taxes payable | 233,277 | 239,910 | 274,858 | |||||||||
| Payroll and charges | 444,938 | 349,263 | 380,762 | |||||||||
| Liabilities for assets acquisitions and subsidiaries | 112,446 | 114,889 | 127,721 | |||||||||
| Dividends payable | 11,185 | 6,228 | 4,891 | |||||||||
| Advance from customers | 115,260 | 92,505 | ||||||||||
| Other liabilities | 361,197 | 336,480 | 284,828 | |||||||||
| Total Current Liabilities | 7,378,131 | 8,979,194 | 13,933,981 | |||||||||
| Non-Current Liabilities | ||||||||||||
| Loans, financing and debentures | 66,556,926 | 73,770,784 | 75,082,454 | |||||||||
| Accounts payable for lease operations | 4,773,303 | 5,045,285 | 4,469,798 | |||||||||
| Derivative financial instruments | 5,060,920 | 7,157,597 | 7,369,241 | |||||||||
| Liabilities for assets acquisitions and subsidiaries | 396,923 | 428,678 | 530,414 | |||||||||
| Provision for judicial liabilities | 3,271,679 | 3,255,140 | 3,441,451 | |||||||||
| Actuarial liabilities | 792,387 | 788,948 | 744,105 | |||||||||
| Deferred taxes | 75,354 | |||||||||||
| Share-based compensation plans | 212,500 | 223,915 | 151,365 | |||||||||
| Advance from customers | 165,439 | 199,595 | ||||||||||
| Other liabilities | 111,888 | 112,991 | 84,134 | |||||||||
| Total Non-Current Liabilities | 81,341,965 | 90,982,933 | 91,948,316 | |||||||||
| Shareholders’ Equity | ||||||||||||
| Share capital | 9,235,546 | 9,235,546 | 9,235,546 | |||||||||
| Capital reserves | 13,033 | 11,822 | 6,418,344 | |||||||||
| Treasury shares | (218,265 | ) | (218,265 | ) | (218,265 | ) | ||||||
| Retained earnings reserves | 317,144 | |||||||||||
| Other reserves | 2,028,382 | 2,065,162 | 2,191,704 | |||||||||
| Retained loss | 3,429,696 | (6,636,122 | ) | (15,453,035 | ) | |||||||
| Controlling shareholders´ | 14,488,392 | 4,458,143 | 2,491,438 | |||||||||
| Non-controlling interest | 99,100 | 106,198 | 119,997 | |||||||||
| Total Equity | 14,587,492 | 4,564,341 | 2,611,435 | |||||||||
| Total Liabilities and Equity | 103,307,588 | 104,526,468 | 108,493,732 | |||||||||
Page 32 of 36
APPENDIX 4 – Consolidated Statement of Cash Flow
| Cash Flow (R$ ‘000) | 2Q21 | 2Q20 | 6M21 | 6M20 | ||||||||||||
| OPERATING ACTIVITIES | ||||||||||||||||
| Net income (loss) for the period | 10,036,699 | (2,052,518 | ) | 7,281,440 | (15,471,579 | ) | ||||||||||
| Depreciation, depletion and amortization | 1,655,769 | 1,648,285 | 3,389,903 | 3,238,678 | ||||||||||||
| Depreciation of right of use | 53,355 | 53,979 | 100,176 | 93,309 | ||||||||||||
| Sublease of ships | (9,315 | ) | (11,365 | ) | (20,735 | ) | (11,365 | ) | ||||||||
| Interest expense on lease liabilities | 103,500 | 108,138 | 212,540 | 203,488 | ||||||||||||
| Result from sale and disposal of property, plant and equipment and biological assets, net | (24,329 | ) | (13,831 | ) | (521,173 | ) | (9,343 | ) | ||||||||
| Income from associates and joint ventures | (80,098 | ) | 3,663 | (90,364 | ) | 2,952 | ||||||||||
| Exchange rate and monetary variations, net | (6,895,657 | ) | 2,930,209 | (1,689,192 | ) | 15,349,795 | ||||||||||
| Interest expenses with financing, loans and debentures, net | 735,399 | 846,702 | 1,493,570 | 1,736,775 | ||||||||||||
| Capitalized loan costs | (647 | ) | (4,137 | ) | (1,049 | ) | (7,940 | ) | ||||||||
| Premium expenses with early settlements | 786 | - | 33,719 | - | ||||||||||||
| Accrual of interest on marketable securities | (23,496 | ) | (15,232 | ) | (38,607 | ) | (74,102 | ) | ||||||||
| Amortization of fundraising costs | 15,482 | 16,018 | 56,502 | 41,268 | ||||||||||||
| Derivative losses, net | (3,732,823 | ) | 1,776,322 | (1,238,873 | ) | 10,835,114 | ||||||||||
| Fair value adjustment of biological assets | (564,533 | ) | (173,733 | ) | (564,533 | ) | (173,733 | ) | ||||||||
| Deferred income tax and social contribution | 4,820,858 | (1,092,015 | ) | 2,451,778 | (8,822,898 | ) | ||||||||||
| Interest on actuarial liabilities | 13,961 | 13,332 | 27,925 | 26,527 | ||||||||||||
| Provision (reversal) for judicial liabilities, net | 29,214 | (13,480 | ) | 33,525 | (22,252 | ) | ||||||||||
| Allowance for doubtful accounts, net | 2,394 | 4,728 | 4,156 | 10,250 | ||||||||||||
| Provision for inventory losses, net | 5,205 | 16,452 | 10,667 | 32,620 | ||||||||||||
| Provision for loss of ICMS credits, net | 15,937 | 28,580 | 23,395 | 48,151 | ||||||||||||
| Tax credits | (315,431 | ) | - | (315,431 | ) | - | ||||||||||
| Other | 10,451 | 7,360 | 11,002 | 12,798 | ||||||||||||
| Decrease (increase) in assets | (1,008,411 | ) | 830,437 | (1,543,889 | ) | 948,814 | ||||||||||
| Trade accounts receivables | (707,774 | ) | 814,715 | (1,222,390 | ) | 206,570 | ||||||||||
| Inventories | (396,394 | ) | 42,347 | (452,852 | ) | 466,475 | ||||||||||
| Recoverable taxes | 14,575 | (86,487 | ) | 12,185 | 114,501 | |||||||||||
| Other assets | 81,182 | 59,862 | 119,168 | 161,268 | ||||||||||||
| Increase (decrease) in liabilities | 435,200 | (237,556 | ) | 452,997 | (692,287 | ) | ||||||||||
| Trade accounts payables | 363,463 | (258,727 | ) | 451,708 | (352,975 | ) | ||||||||||
| Taxes payable | 30,303 | 83,722 | 132,906 | 24,235 | ||||||||||||
| Payroll and charges | 95,675 | 72,583 | (47,799 | ) | (19,679 | ) | ||||||||||
| Other liabilities | (54,241 | ) | (135,134 | ) | (83,818 | ) | (343,868 | ) | ||||||||
| Cash provided by operations | 5,279,470 | 4,670,338 | 9,559,449 | 7,295,040 | ||||||||||||
| Payment of interest with financing, loans and debentures | (304,437 | ) | (515,272 | ) | (1,479,825 | ) | (1,682,413 | ) | ||||||||
| Payment of premium with early settlements | (786 | ) | - | (33,719 | ) | - | ||||||||||
| Interest received from marketable securities | 24,018 | 74,093 | 38,067 | 126,579 | ||||||||||||
| Payment of income taxes | (35,585 | ) | (33,763 | ) | (70,729 | ) | (62,694 | ) | ||||||||
| Cash provided by operating activities | 4,962,680 | 4,195,396 | 8,013,243 | 5,676,512 | ||||||||||||
| INVESTING ACTIVITIES | ||||||||||||||||
| Additions to property, plant and equipment | (406,609 | ) | (259,701 | ) | (670,588 | ) | (559,126 | ) | ||||||||
| Additions to intangible | (17,409 | ) | (44 | ) | (18,143 | ) | (513 | ) | ||||||||
| Additions to biological assets | (907,844 | ) | (823,200 | ) | (1,611,674 | ) | (1,401,424 | ) | ||||||||
| Proceeds from sale of property, plant and equipment | 96,080 | 33,982 | 1,261,008 | 61,887 | ||||||||||||
| Capital increase | (44,490 | ) | - | (50,818 | ) | - | ||||||||||
| Marketable securities, net | 1,578,249 | 2,918,367 | (288,215 | ) | 4,064,361 | |||||||||||
| Advance for acquisition of wood from operations with development | (64,981 | ) | 75,501 | (232,157 | ) | 6,544 | ||||||||||
| Dividends received | 6,453 | - | 6,453 | - | ||||||||||||
| Acquisition of non-controlling interests | - | - | (6,482 | ) | - | |||||||||||
| Cash provided (used) in investing activities | 239,449 | 1,944,905 | (1,610,616 | ) | 2,171,729 | |||||||||||
| FINANCING ACTIVITIES | ||||||||||||||||
| Proceeds from loans, financing and debentures | 337,093 | 3,036,906 | 9,306,614 | 6,700,529 | ||||||||||||
| Payment of derivative transactions | (721,741 | ) | (1,661,453 | ) | (1,434,288 | ) | (1,834,250 | ) | ||||||||
| Payment of loans, financing and debentures | (555,432 | ) | (1,721,392 | ) | (11,732,552 | ) | (6,224,940 | ) | ||||||||
| Payment of leases | (226,355 | ) | (197,080 | ) | (475,483 | ) | (354,289 | ) | ||||||||
| Payment of dividends | (2,322 | ) | - | (2,322 | ) | - | ||||||||||
| Liabilities for assets acquisitions and subsidiaries | (1,520 | ) | (2,832 | ) | (1,520 | ) | (5,670 | ) | ||||||||
| Cash used by financing activities | (1,170,277 | ) | (545,851 | ) | (4,339,551 | ) | (1,718,620 | ) | ||||||||
| EXCHANGE VARIATION ON CASH AND CASH EQUIVALENTS | (780,790 | ) | 330,922 | (312,563 | ) | 1,094,953 | ||||||||||
| Increase (reduction) in cash and cash equivalents, net | 3,251,062 | 5,925,372 | 1,750,513 | 7,224,574 | ||||||||||||
| At the beginning for the period | 5,334,508 | 4,548,329 | 6,835,057 | 3,249,127 | ||||||||||||
| At the end for the period | 8,585,570 | 10,473,701 | 8,585,570 | 10,473,701 | ||||||||||||
| Increase (reduction) in cash and cash equivalents, net | 3,251,062 | 5,925,372 | 1,750,513 | 7,224,574 |
Page 33 of 36
APPENDIX 5 – EBITDA
| (R$ '000, except where otherwise indicated) | 2Q21 | 2Q20 | 6M21 | 6M20 | ||||||||||||
| Net income | 10,036,699 | (2,052,518 | ) | 7,281,440 | (15,471,579 | ) | ||||||||||
| Net Financial Result | (9,742,584 | ) | 5,657,238 | (1,075,463 | ) | 28,101,286 | ||||||||||
| Income and Social Contribution Taxes | 4,912,372 | (1,088,546 | ) | 2,607,441 | (8,765,069 | ) | ||||||||||
| EBIT | 5,206,487 | 2,516,174 | 8,813,418 | 3,864,638 | ||||||||||||
| Depreciation, Amortization and Depletion | 1,696,755 | 1,709,381 | 3,463,236 | 3,357,581 | ||||||||||||
| EBITDA1 | 6,903,242 | 4,225,555 | 12,276,654 | 7,222,219 | ||||||||||||
| EBITDA Margin | 70.1 | % | 52.8 | % | 65.5 | % | 48.2 | % | ||||||||
| Social actions and operational expenses related to COVID-19 | 19,141 | 73,660 | 23,696 | 74,253 | ||||||||||||
| Fair Value Update - Biological Asset | (564,533 | ) | (173,733 | ) | (564,533 | ) | (173,733 | ) | ||||||||
| Ibema goodwill write-off | 125 | - | 125 | - | ||||||||||||
| Tax credits - exclusion of ICMS in the PIS and COFINS calculation basis | (315,431 | ) | - | (315,431 | ) | - | ||||||||||
| Transaction expenses with Fibria | - | 14 | - | 927 | ||||||||||||
| Demobilization of machinery and equipment - FACEPA | - | 199 | - | 199 | ||||||||||||
| PPA Effect (Write-Off) | - | 2,444 | - | 8,242 | ||||||||||||
| Equity method | (80,098 | ) | 3,663 | (90,364 | ) | 2,952 | ||||||||||
| Expenses with obligations and contract cancellations | - | 2,800 | - | 8,809 | ||||||||||||
| Provision - Tax on the transfer of real estate for the regularization of land acquired prior to 2015 | - | 10,529 | - | 10,529 | ||||||||||||
| Provision - ICMS credit loss | 16,156 | 26,852 | 23,134 | 42,217 | ||||||||||||
| Provision - Regularization of development contract | 114 | - | 114 | - | ||||||||||||
| ICMS accrual complement | - | 7,855 | - | 10,488 | ||||||||||||
| Adjustments - Losango Project | - | - | (9,138 | ) | - | |||||||||||
| Income from the sale and disposal of property, plant and equipment and biological assets | (36,966 | ) | - | (538,209 | ) | (1,093 | ) | |||||||||
| Adjusted EBITDA | 5,941,750 | 4,179,838 | 10,806,048 | 7,206,009 | ||||||||||||
| Adjusted EBITDA Margin | 60.4 | % | 52.3 | % | 57.7 | % | 48.1 | % |
1 The Company's EBITDA is calculated in accordance with CVM Instruction 527 of October 4, 2012.
Page 34 of 36
 |  |
APPENDIX 6 – Segmented Income Statement
| 2Q21 | 2Q20 | |||||||||||||||||||||||||||||||
| Segmented Financial Statement (R$ '000) | Pulp | Paper | Non Segmented | Total Consolidated | Pulp | Paper | Non Segmented | Total Consolidated | ||||||||||||||||||||||||
| Net Revenue | 8,445,377 | 1,399,062 | - | 9,844,439 | 6,976,212 | 1,019,461 | - | 7,995,673 | ||||||||||||||||||||||||
| Cost of Goods Sold | (3,890,070 | ) | (887,585 | ) | - | (4,777,655 | ) | (4,117,353 | ) | (671,341 | ) | - | (4,788,694 | ) | ||||||||||||||||||
| Gross Profit | 4,555,307 | 511,477 | - | 5,066,784 | 2,858,859 | 348,120 | - | 3,206,979 | ||||||||||||||||||||||||
| Gross Margin | 53.9 | % | 36.6 | % | - | 51.5 | % | 41.0 | % | 34.1 | % | - | 40.1 | % | ||||||||||||||||||
| Operating Expense/Income | 141,835 | (2,132 | ) | - | 139,703 | (548,316 | ) | (142,489 | ) | - | (690,805 | ) | ||||||||||||||||||||
| Selling Expenses | (378,184 | ) | (118,750 | ) | - | (496,934 | ) | (457,123 | ) | (89,975 | ) | - | (547,098 | ) | ||||||||||||||||||
| General and Administrative Expenses | (254,048 | ) | (98,956 | ) | - | (353,004 | ) | (236,172 | ) | (99,543 | ) | - | (335,715 | ) | ||||||||||||||||||
| Other Operating Income (Expenses) | 695,544 | 213,999 | - | 909,543 | 153,620 | 42,051 | - | 195,671 | ||||||||||||||||||||||||
| Equity Equivalence | 78,523 | 1,575 | - | 80,098 | (8,641 | ) | 4,978 | - | (3,663 | ) | ||||||||||||||||||||||
| EBIT | 4,697,142 | 509,345 | - | 5,206,487 | 2,310,543 | 205,631 | - | 2,516,174 | ||||||||||||||||||||||||
| Depreciation, Amortization & Depletion | 1,550,059 | 146,696 | - | 1,696,755 | 1,586,667 | 122,714 | - | 1,709,381 | ||||||||||||||||||||||||
| EBITDA | 6,247,201 | 656,041 | - | 6,903,242 | 3,897,210 | 328,345 | - | 4,225,555 | ||||||||||||||||||||||||
| EBITDA Margin | 74.0 | % | 46.9 | % | - | 70.1 | % | 55.9 | % | 32.2 | % | - | 52.8 | % | ||||||||||||||||||
| Adjusted EBITDA1 | 5,496,348 | 445,402 | - | 5,941,750 | 3,894,112 | 285,726 | - | 4,179,838 | ||||||||||||||||||||||||
| Adjusted EBITDA Margin1 | 65.1 | % | 31.8 | % | - | 60.4 | % | 55.8 | % | 28.0 | % | - | 52.3 | % | ||||||||||||||||||
| Net Financial Result | - | - | 9,742,584 | 9,742,584 | - | - | (5,657,238 | ) | (5,657,238 | ) | ||||||||||||||||||||||
| Earnings Before Taxes | 4,697,145 | 509,342 | 9,742,584 | 14,949,071 | 2,310,544 | 205,630 | (5,657,238 | ) | (3,141,064 | ) | ||||||||||||||||||||||
| Income and Social Contribution Taxes | - | - | (4,912,372 | ) | (4,912,372 | ) | - | - | 1,088,546 | 1,088,546 | ||||||||||||||||||||||
| Net Income (Loss) | 4,697,145 | 509,342 | 4,830,212 | 10,036,699 | 2,310,544 | 205,630 | (4,568,692 | ) | (2,052,518 | ) | ||||||||||||||||||||||
| Net Margin | 55.6 | % | 36.4 | % | - | 101.95 | % | 33.1 | % | 20.2 | % | - | -25.7 | % | ||||||||||||||||||
1 Excluding non-recurring items and PPA effects.
Page 35 of 36
| | |
| 6M21 | 6M20 | |||||||||||||||||||||||||||||||
| Segmented Financial Statement (R$ '000) | Pulp | Paper | Non Segmented | Total Consolidated | Pulp | Paper | Non Segmented | Total Consolidated | ||||||||||||||||||||||||
| Net Revenue | 16,038,957 | 2,694,648 | - | 18,733,605 | 12,862,936 | 2,113,530 | - | 14,976,466 | ||||||||||||||||||||||||
| Cost of Goods Sold | (7,905,782 | ) | (1,716,907 | ) | - | (9,622,689 | ) | (8,246,527 | ) | (1,362,166 | ) | - | (9,608,693 | ) | ||||||||||||||||||
| Gross Profit | 8,133,175 | 977,741 | - | 9,110,916 | 4,616,409 | 751,364 | - | 5,367,773 | ||||||||||||||||||||||||
| Gross Margin | 50.7 | % | 36.3 | % | - | 48.6 | % | 35.9 | % | 35.6 | % | - | 35.8 | % | ||||||||||||||||||
| Operating Expense/Income | (240,841 | ) | (56,657 | ) | - | (297,498 | ) | (1,179,960 | ) | (323,175 | ) | - | (1,503,135 | ) | ||||||||||||||||||
| Selling Expenses | (855,781 | ) | (222,919 | ) | - | (1,078,700 | ) | (875,343 | ) | (186,691 | ) | - | (1,062,034 | ) | ||||||||||||||||||
| General and Administrative Expenses | (532,454 | ) | (203,104 | ) | - | (735,558 | ) | (460,226 | ) | (190,325 | ) | - | (650,551 | ) | ||||||||||||||||||
| Other Operating Income (Expenses) | 1,071,126 | 355,270 | - | 1,426,396 | 170,212 | 42,190 | - | 212,402 | ||||||||||||||||||||||||
| Equity Equivalence | 76,268 | 14,096 | - | 90,364 | (14,603 | ) | 11,651 | - | (2,952 | ) | ||||||||||||||||||||||
| EBIT | 7,892,334 | 921,084 | - | 8,813,418 | 3,436,449 | 428,189 | - | 3,864,638 | ||||||||||||||||||||||||
| Depreciation, Amortization & Depletion | 3,179,633 | 283,603 | - | 3,463,236 | 3,126,528 | 231,053 | - | 3,357,581 | ||||||||||||||||||||||||
| EBITDA | 11,071,967 | 1,204,687 | - | 12,276,654 | 6,562,977 | 659,242 | - | 7,222,219 | ||||||||||||||||||||||||
| EBITDA Margin | 69.0 | % | 44.7 | % | - | 65.5 | % | 51.0 | % | 31.2 | % | - | 48.2 | % | ||||||||||||||||||
| Adjusted EBITDA1 | 9,962,141 | 843,907 | - | 10,806,048 | 6,571,007 | 635,002 | - | 7,206,009 | ||||||||||||||||||||||||
| Adjusted EBITDA Margin1 | 62.1 | % | 31.3 | % | - | 57.7 | % | 51.1 | % | 30.0 | % | - | 48.1 | % | ||||||||||||||||||
| Net Financial Result | - | - | 1,075,463 | 1,075,463 | - | - | (28,101,286 | ) | (28,101,286 | ) | ||||||||||||||||||||||
| Earnings Before Taxes | 7,892,335 | 921,083 | 1,075,463 | 9,888,881 | 3,436,449 | 428,189 | (28,101,286 | ) | (24,236,648 | ) | ||||||||||||||||||||||
| Income and Social Contribution Taxes | - | - | (2,607,441 | ) | (2,607,441 | ) | - | - | 8,765,069 | 8,765,069 | ||||||||||||||||||||||
| Net Income (Loss) | 7,892,335 | 921,083 | (1,531,978 | ) | 7,281,440 | 3,436,449 | 428,189 | (19,336,217 | ) | (15,471,579 | ) | |||||||||||||||||||||
| Net Margin | 49.2 | % | 34.2 | % | 38.8 | % | 26.7 | % | 20.3 | % | -103.3 | % | ||||||||||||||||||||
1 Excluding non-recurring items and PPA effects.
Page 36 of 36