Exhibit 99.1

Record EBITDA, strong sales volume and
leverage down to 2.7 times
São Paulo, October 28, 2021. Suzano S.A. (B3: SUZB3 | NYSE: SUZ), one of the world’s largest integrated pulp and paper producers, announces today its consolidated results for the 3rd quarter of 2021 (3Q21).
HIGHLIGHTS
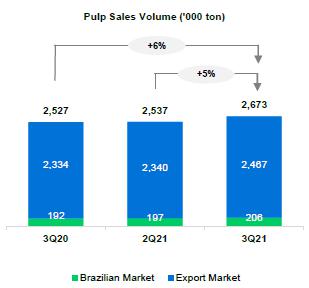
| · | Pulp sales of 2,673 thousand tons (+6% vs. 3Q20). |
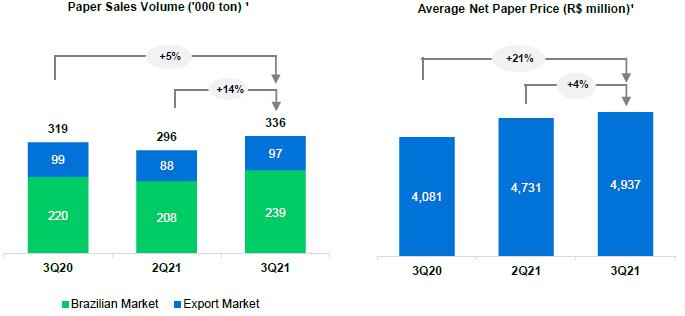
| · | Paper sales of 336 thousand tons (+5% vs. 3Q20). |
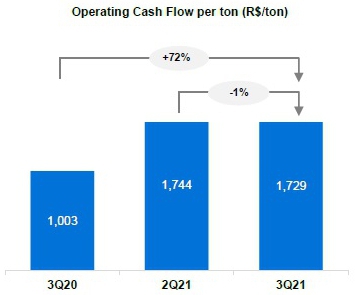
| · | Adjusted EBITDA1 and Operating cash generation²: R$6.3 billion and R$5.2 billion, respectively. |
| · | Adjusted EBITDA1/ton3 from pulp of R$2,140/ton (+60% vs. 3Q20). |
| · | Adjusted EBITDA1/ton4 from paper of R$1,748/ton (+41% vs. 3Q20). |
| · | Average net pulp price in export market: US$654/ton (+43% vs. 3Q20). |
| · | Average net paper price4 of R$4,937/ton (+21% vs. 3Q20). |
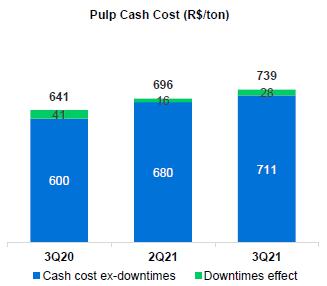
| · | Pulp cash cost ex-downtime of R$711/ton (+19% vs. 3Q20). |
| · | Leverage down to 2.7 times in USD and 2.8 times in BRL. |
| Financial Data (R$ million) | | | 3Q21 | | | | 2Q21 | | | | ΔQ-o-Q | | | | 3Q20 | | | | ΔY-o-Y | | | | LTM4 3Q21 | |
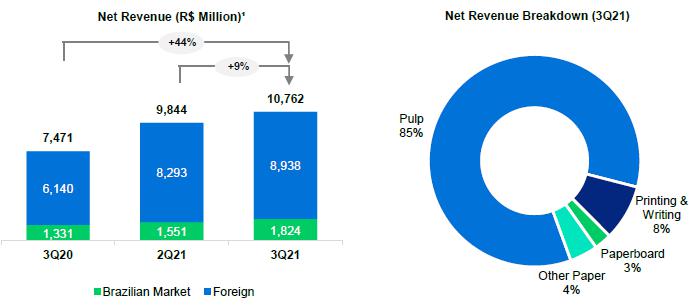
| Net Revenue | | | 10,762 | | | | 9,844 | | | | 9 | % | | | 7,471 | | | | 44 | % | | | 37,508 | |
| Adjusted EBITDA1 | | | 6,310 | | | | 5,942 | | | | 6 | % | | | 3.779 | | | | 67 | % | | | 21,080 | |
| Adjusted EBITDA Margin1 | | | 59 | % | | | 60 | % | | | -1 p.p. | | | | 51 | % | | | +8 p.p. | | | | 56 | % |
| Adjusted EBITDA Margin¹ ex- Klabin3 | | | (7,765 | ) | | | 9,743 | | | | - | | | | (4,223 | ) | | | 84 | % | | | (452 | ) |
| Net Financial Result | | | (959 | ) | | | 10,037 | | | | - | | | | (1,158 | ) | | | -17 | % | | | 12,236 | |
| Net Income | | | 5,204 | | | | 4,940 | | | | 5 | % | | | 2,854 | | | | 82 | % | | | 16,991 | |
| Operating Cash Generation2 | | | 2.8 x | | | | 3.1 x | | | | -0.3 x | | | | 5.1 x | | | | -2.3 x | | | | 2.8 x | |
| Net Debt /Adjusted EBITDA1 (x) - R$ | | | 2.7 x | | | | 3.3 x | | | | -0.6 x | | | | 4.4 x | | | | -1.7 x | | | | 2.7 x | |
| Operational Data ('000 tons) | | | 3Q21 | | | | 2Q21 | | | | ΔQ-o-Q | | | | 3Q20 | | | | ΔY-o-Y | | | | LTM4 3Q21 | |
| Sales | | | 3,010 | | | | 2,833 | | | | 6 | % | | | 2,846 | | | | 6 | % | | | 11,804 | |
| Pulp | | | 2,673 | | | | 2,537 | | | | 5 | % | | | 2,527 | | | | 6 | % | | | 10,526 | |
| Paper4 | | | 336 | | | | 296 | | | | 14 | % | | | 319 | | | | 5 | % | | | 1,278 | |
¹Excluding non-recurring items. | 2Considers Adjusted EBITDA less sustaining capex (cash basis) | 3Considers the results of the Consumer Goods Unit. | 4Last 12 months.


The consolidated quarterly information has been prepared in accordance with the Securities and Exchange Commission (CVM) and Accounting Standards Committee (CPC) standards and is in compliance with International Accounting Standard (IFRS) issued by the International Accounting Standard Board (IASB). The data contained in this document was obtained from the financial information as made available to the CVM. The operating and financial information is presented based on consolidated numbers in Reais (R$). Summaries may diverge due to rounding. Non-financial data, such as volume, quantity, average price, average price, in Reais and Dollars, were not reviewed by independent auditors.
CONTENTS
| EXECUTIVE SUMMARY | 3 |
| PULP BUSINESS PERFORMANCE | 3 |
| PULP SALES VOLUME AND REVENUE | 3 |
| PULP CASH COST | 5 |
| PULP SEGMENT EBITDA | 7 |
| OPERATING CASH FLOW FROM THE PULP SEGMENT | 8 |
| PAPER BUSINESS PERFORMANCE | 9 |
| PAPER SALES VOLUME AND REVENUE1 | 9 |
| OPERATING CASH FLOW FROM THE PAPER SEGMENT | 11 |
| FINANCIAL PERFORMANCE | 12 |
| NET REVENUE | 12 |
| CALENDAR OF SCHEDULED MAINTENANCE DOWNTIMES | 13 |
| COST OF GOODS SOLD | 13 |
| SELLING EXPENSES | 13 |
| GENERAL AND ADMINISTRATIVE EXPENSES | 14 |
| ADJUSTED EBITDA | 14 |
| FINANCIAL RESULT | 15 |
| DERIVATIVE OPERATIONS | 16 |
| NET INCOME (LOSS) | 19 |
| DEBT | 19 |
| CAPITAL EXPENDITURE | 21 |
| OPERATING CASH GENERATION | 22 |
| FREE CASH FLOW | 22 |
| COVID-19 | 23 |
| ESG | 24 |
| TOTAL OPERATIONAL EXPENDITURE - PULP | 25 |
| EVENTS SUBSEQUENT TO THE REPORTING PERIOD | 25 |
| CAPITAL MARKETS | 25 |
| FIXED INCOME | 27 |
| RATING | 27 |
| UPCOMING EVENTS | 28 |
| IR CONTACTS | 28 |
| APPENDICES | 29 |
| APPENDIX 1 - Operating Data | 29 |
| APPENDIX 2 – Consolidated Statement of Income and Goodwill Amortization | 31 |
| APPENDIX 3 – Consolidated Balance Sheet | 32 |
| APPENDIX 4 – Consolidated Statement of Cash Flow | 33 |
| APPENDIX 5 - EBITDA | 34 |
| APPENDIX 6 - Segmented Income Statement | 35 |
EXECUTIVE SUMMARY
The third quarter of 2021 was marked by strong sales volume and resilient pulp prices, mainly driven by solid pulp demand performance in Europe and North America, despite the seasonality effects during this period of the year and falling demand in China. In the paper business, demand remained buoyant, with high sales volumes and further price increases in both the domestic and international markets and once again registering the highest quarterly EBITDA in the company’s history, considering paper and consumer goods. These factors, combined with the average weaker BRL, drove adjusted EBITDA in the quarter to R$6.3 billion and operating cash generation to R$5.2 billion – the highest since the creation of Suzano S.A.
On the financial management front, the Company completed the post-merger deleveraging cycle, underscoring its continued focus on financial discipline. Leverage measured by net debt/adjusted EBITDA in the last twelve months stood below the 3.0x threshold established in its Debt Policy, reaching 2.7x measured in USD. Net debt in USD declined once again, while the Company’s liquidity position strengthened further, which let Suzano well positioned for the new investment cycle through the Cerrado Project. Continuing its debt management program, in September the Company issued a new Sustainability-Linked Bond (SLB) in the international market maturing in 2028, in the principal amount of US$500 million and yield of 2.70% p.a., the lowest in its history. The bond has targets associated with reducing the use of industrial water by 2026 and increasing the percentage of women holding leadership positions in the Company by 2025.
On the ESG front, during the quarter Suzano joined the Science Based Target Initiative (SBTi) and the Business Ambition for 1.5ºC campaign. While joining these initiatives, the Company undertook to set a target in line with the climate scenario of reducing emissions that limit global warming to 1.5°C. The company also announced a commitment with SBTi to help develop methodologies applicable to the Pulp & Paper sector. In addition, in the context of discussions related to the climate emergency and considering that effective measures in the short term are essential, the Company anticipated its Commitment to Renew Life to remove 40 million tons of CO2e from the atmosphere by 2030 for the year of 2025.
PULP BUSINESS PERFORMANCE
PULP SALES VOLUME AND REVENUE
The third quarter of 2021 was marked by strong demand for pulp in Europe and North America, on the back of solid performance by the paper segments. Tissue paper consumption remained strong, sustained by the continued strong consumption of household products combined with the spurt in demand for corporate use products, mainly printing and writing paper, as the transoceanic logistical crisis reduced the availability and, consequently, the competition of imported products and due to the faster pace of vaccination against COVID-19, which made economic recovery possible as a result of less restrictive measures on social interaction in both continents. In China, however, the seasonal resumption of demand expected for the period between the end of August and the beginning of September did not materialize in the expected intensity given a scenario of high maritime freight and a reduction in paper exports, restrictions on school tutoring and a slowdown in the country's economic growth.
On the supply side, the worsening logistics problems in late 2020 caused by lower availability of containers, congestion at ports and strict operational protocols at Chinese port companies against the delta variant exerted different pressures on the balance between supply and demand with a more favorable scenario in Europe and a challenging one in China. In this scenario, the benchmark PIX/FOEX indexes for hardwood pulp recorded an increase of 13% in the European market and a 15% drop in China when compared to the previous quarter.
Moreover, the wide gap between softwood and hardwood pulp prices continued, which encouraged the substitution of fibers. According to PIX/FOEX, the difference between softwood and hardwood pulp prices at the end of the quarter was US$200/t in Europe and US$208/t in China.
In this context, Suzano’s pulp sales totaled 2,673 thousand tons, up 5% and 6%, respectively, from 2Q21 and 3Q20.
Average net price in USD of the pulp sold by Suzano was US$ 651/ton, an increase of 4% and 43%, respectively, from 2Q21 and 3Q20, driven by the hike in international pulp prices. Average net price in the export market was US$654/ton (compared to US$636/ton in 2Q21 and US$458/ton in 3Q20).
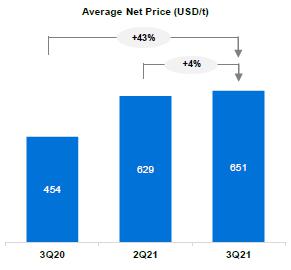
Average net price in BRL was R$3,405/ton in 3Q21, increasing 2% and 39%, respectively, from 2Q21 and 3Q20, accompanying the rising trend in the international market prices.
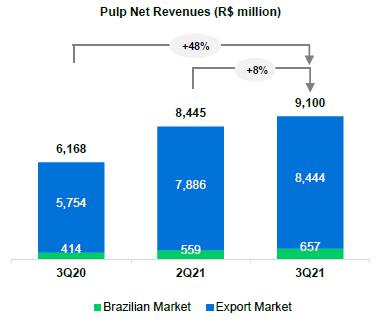
Pulp net revenue increased 8% compared to 1Q21, mainly due to higher sales volume (+5%) and higher net price in USD (+4%), partially offset by the depreciation of the average USD against the BRL of 1%. Compared to 3Q20, revenue was 48% higher due to the better price in USD (+43%) and a 6% growth in sales volume, despite the appreciation of the average USD against the BRL (3%).
PULP CASH COST
Cash cost excluding downtime in 3Q21 came to R$711/ton, 5% higher than in 2Q21, due to: i) the higher spending on raw materials, mainly impacted by Brent energy prices (especially natural gas), higher prices of chemicals, especially caustic soda given the international prices increase and chlorine dioxide, due to higher energy prices, as well as higher expenses with packaging driven by the increase in steel prices; ii) the increase in the cost of wood due to higher transport costs, in turn caused by the hike in diesel prices and greater average supply radius, as well as the increase in the share of third-party wood; and iii) higher fixed cost due to higher intensity in maintenance. The positive impact of exchange rate resulted from the higher average BRL during the quarter, leveraged by the effect of raw material inventory turnover resulting from a delay of about one month between acquisition and consumption.
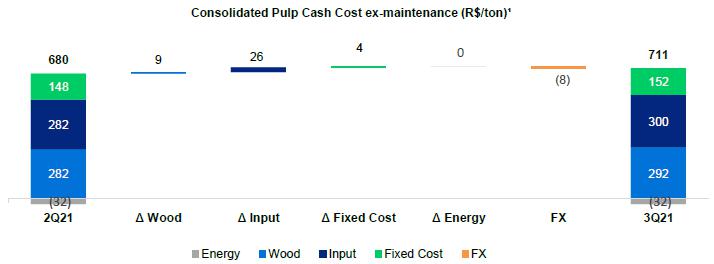
¹Excludes the impact of maintenance and administrative downtimes.
Cash cost excluding downtime in 3Q21 was 19% higher than in 3Q20, due to: i) the higher spending on raw materials on account of higher energy prices (natural gas, and oil due to the rise in Brent prices), higher prices of chemicals (especially chlorine dioxide due to the increase in energy costs) and higher expenses with packaging caused by the increase in steel prices; ii) higher expenses with wood due to the hike in diesel prices, which affected harvest and transport, in addition to the higher share of third-party wood; and iii) the increase in fixed costs in light of the record of COVID-19 pandemic impact (previously recorded directly in COGS).
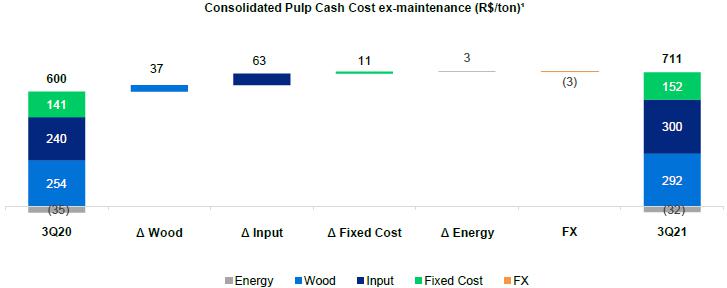
¹Excludes the impact of maintenance and administrative downtimes.

¹Based on cash cost excluding downtimes. Excludes energy sales.
PULP SEGMENT EBITDA
| Pulp segment | | | 3Q21 | | | | 2Q21 | | | | ΔQ-o-Q | | | | 3Q20 | | | | ΔY-o-Y | | | | LTM 3Q21 | |
| Adjusted EBITDA (R$ million) | | | 5,721 | | | | 5,496 | | | | 4 | % | | | 3,384 | | | | 69 | % | | | 19,213 | |
| Sales volume (k ton) | | | 2,673 | | | | 2,537 | | | | 5 | % | | | 2,527 | | | | 6 | % | | | 10,526 | |
| Pulp adjusted¹ EBITDA (R$/ton) | | | 2,140 | | | | 2,166 | | | | -1 | % | | | 1,339 | | | | 60 | % | | | 1,825 | |
¹Excludes non-recurring items.
The 5% increase in Adjusted EBITDA from pulp in 3Q21 vs. 2Q21 was mainly due to higher sales volume and higher average net price in USD (+4%). These effects were partially offset by: i) higher cash COGS, impacted by higher sales volumes, higher production costs, in turn mainly due to the increase in Brent prices and scheduled maintenance downtimes; ii) the depreciation of average USD against BRL (1%); and iii) higher SG&A expenses, caused by the increase in selling expenses (higher Brent on logistics expenses and higher volumes), despite the decline in administrative expenses. The 1% decline in adjusted EBITDA per ton is due to the increase in cash COGS, the foreign exchange effect and higher SG&A expenses resulting from the increase in logistics expenses, which were partially offset by higher prices.
Compared to 3Q20, the 69% increase in Adjusted EBITDA from pulp is mainly driven by the 43% increase in average net price and higher sales volume (+6%), partially offset by higher cash COGS (due to higher sales volumes, higher production cost and logistics costs increase associated to higher commodities prices - Brent) and lower average USD against BRL (3%). Adjusted EBITDA per ton increased 60% on account of the price factor but was partially offset by the increase in cash COGS and the foreign exchange effect.
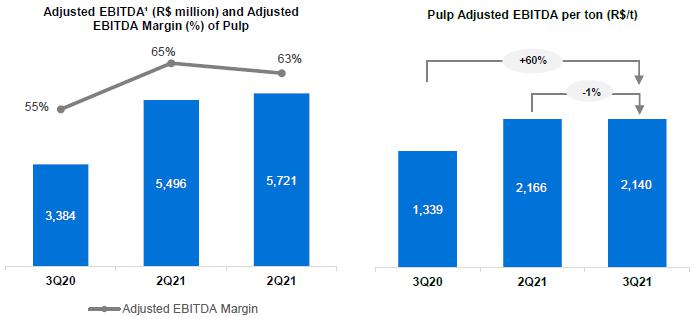
¹Excludes non-recurring items.
OPERATING CASH FLOW FROM THE PULP SEGMENT
| Operating cash flow - Pulp (R$ million) | | | 3Q21 | | | | 2Q21 | | | | ΔQ-o-Q | | | | 3Q20 | | | | ΔY-o-Y | | | | LTM 3Q21 | |
| Adjusted EBITDA¹ | | | 5,721 | | | | 5,496 | | | | 4 | % | | | 3,384 | | | | 69 | % | | | 19,213 | |
| Maintenance Capex² | | | (1,025 | ) | | | (935 | ) | | | 10 | % | | | (854 | ) | | | 20 | % | | | (3,792 | ) |
| Operating Cash Flow | | | 4,696 | | | | 4,561 | | | | 3 | % | | | 2,530 | | | | 86 | % | | | 15,421 | |
¹Excludes non-recurring items.
²Cash basis.
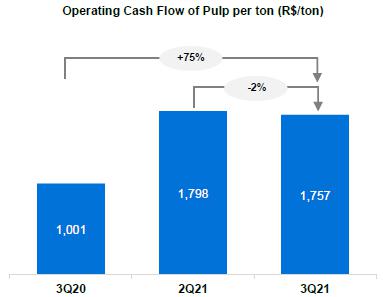
Operating cash generation per ton in the pulp segment was 2% lower than in 2Q21, due to the decline in adjusted EBITDA per ton and higher sustaining capex. Compared to 3Q20, the 75% increase is due to the increase in adjusted EBITDA per ton (as explained earlier), partially offset by the increase in sustaining capex.
PAPER BUSINESS PERFORMANCE
The following data and analyses incorporate the joint results of the consumer goods and paper businesses.
PAPER SALES VOLUME AND REVENUE¹
According to data published by Brazil's Forestry Industry Association (IBÁ), demand for printing and writing in Brazil grew 21% in July and August 2021 compared to the same period in 2020. Comparing the eight months of 2021 with the same period in 2020, demand for printing and writing increased 29% across Brazil. These figures show that demand in Brazil continues to recover with the progress of vaccination and the resumption of onsite classes and activities.
Despite the relaxation of distancing measures and the progress of vaccination, the pandemic brought changes in consumption habits, such as the spike in e-commerce. This trend, combined with the prolonged restrictions on the supply of wood shavings to produce cardboard boxes, continues to drive the use of printing and writing paper as an alternative in this industry. In July and August 2021, about 15% of total demand in the segment was estimated to have been used for this purpose.
Without this application, domestic sales in the printing and writing segment in Brazil should have grown 17% in the eight months in 2021 compared to the same period in 2020. Growth in July and August 2021 compared to the same period in 2020 is estimated at 4%. We expect better seasonal effects in the domestic market during the final quarter as a result of paper sales to Brazil’s national textbook program (PNLD) and a brighter scenario in the notebooks market and promotional campaigns.
Demand for paperboard in Brazil grew 21% in the first eight months of 2021 compared to the same period in 2020. In July and August 2021, nationwide demand grew 3% compared to the same period in 2020, already reflecting the heavy demand for the product.
Consolidating both market segments (Suzano's accessible paper market), demand grew 26% in the first eight months of 2021, and by 15% in July and August 2021, compared to the same periods in 2020.
Suzano's paper sales (printing and writing, paperboard and tissue) in the domestic market totaled 239 thousand tons in 2Q21, an increase of 15% from 2Q21 and 9% from 3Q20.
Paper sales in the international markets totaled 97 thousand tons, an increase of 10% from 2Q21 but down 2% from 3Q20, representing 29% of total sales in 3Q21.
Driven by the gradual economic recovery and seasonality effects during the period, total paper sales in 3Q21 grew 14% in relation to 2Q21 and 5% in relation to 3Q20.
1Includes the Consumer Goods Unit.
Average net price rose 4% vs. the previous quarter, driven by price increases across all product lines in the domestic market during 2Q21, mainly due to the recovery in international market prices across all operating regions and high demand in the paperboard market. Year-on-year, the increase was 21% from 3Q20, due to price increases in the domestic and international markets in all segments.
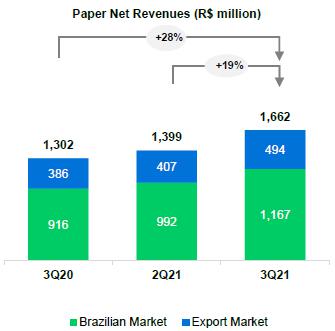
Net revenue from paper was R$1,662 million in 3Q21, an increase of 19% from 2Q21, resulting from the price increase caused by the above factors and higher sales volumes. In relation to 3Q20, net revenue from paper grew 28% due to the normalization of sales volume to pre-pandemic levels and higher prices.
1Includes the Consumer Goods Unit.
PAPER SEGMENT EBITDA
| Paper segment | | 3Q21 | | | 2Q21 | | | Δ Q-o-Q | | | 3Q20 | | | Δ Y-o-Y | | | LTM 3Q21 | |
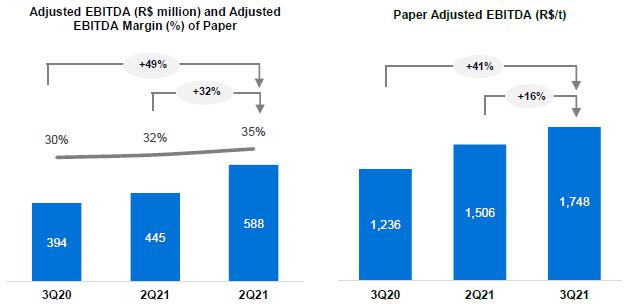
| Adjusted EBITDA (R$ million) | | | 588 | | | | 445 | | | | 32 | % | | | 394 | | | | 49 | % | | | 1,867 | |
| Sales volume (k ton) | | | 336 | | | | 296 | | | | 14 | % | | | 319 | | | | 5 | % | | | 1,278 | |
| Paper adjusted¹ EBITDA (R$/ton) | | | 1,748 | | | | 1,506 | | | | 16 | % | | | 1,236 | | | | 41 | % | | | 1,461 | |
¹Excludes non-recurring items.
Adjusted EBITDA from paper was up 32% from 2Q21, mainly resulting from higher sales volumes and the price increases in both the domestic and international markets. Compared to 3Q20, adjusted EBITDA increased 49%, mainly due to price increase across all product lines.
OPERATING CASH FLOW FROM THE PAPER SEGMENT
| Operating cash flow - Paper (R$ million) | | 3Q21 | | | 2Q21 | | | Δ Q-o-Q | | | 3Q20 | | | Δ Y-o-Y | | | LTM 3Q21 | |
| Adjusted EBITDA¹ | | | 588 | | | | 445 | | | | 32 | % | | | 394 | | | | 49 | % | | | 1,867 | |
| Maintenance Capex² | | | (80 | ) | | | (66 | ) | | | 21 | % | | | (70 | ) | | | 15 | % | | | (297 | ) |
| Operating Cash Flow | | | 508 | | | | 379 | | | | 34 | % | | | 325 | | | | 56 | % | | | 1,570 | |
¹Excluding non-recurring items.
²Cash basis.

Operating cash generation per ton in the paper segment was R$1,510/ton, an increase of 18% from 2Q21 due to price increases, despite an uptick in sustaining capex. In relation to 3Q20, the indicator was up 48% driven by EBITDA increase.
FINANCIAL PERFORMANCE
NET REVENUE
Suzano’s net revenue in 3Q21 was R$10,762 million, 83% of which came from exports (vs. 84% in 2Q21 and 82% in 3Q20). Compared to 2Q21, the 9% growth in net revenue was due to higher sales volume and higher net average price of pulp and paper, which was partially offset by the 1% decline in average USD vs. BRL. The 44% growth in consolidated net revenue compared to 3Q20 was driven by the higher average net price of pulp in USD and paper and the growth in sales volume (+6%), which was partially offset by the 3% decline in average USD vs. BRL.
¹Does not includes Portocel service revenue.
CALENDAR OF SCHEDULED MAINTENANCE DOWNTIMES
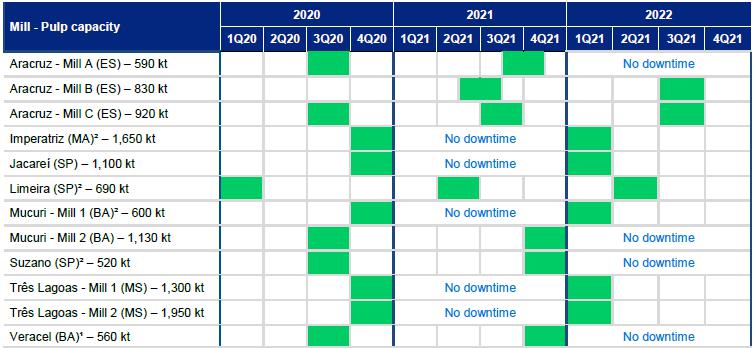
¹Veracel is a joint operation between Suzano (50%) and Stora Enso (50%) with total annual capacity of 1,120 thousand tons.
²Includes integrated capacities and fluff.
COST OF GOODS SOLD
| COGS (R$ million) | | 3Q21 | | | 2Q21 | | | Δ Q-o-Q | | | 3Q20 | | | Δ Y-o-Y | | | LTM 3Q21 | |
| COGS (Income statement) | | | 5,300 | | | | 4,778 | | | | 11 | % | | | 4,474 | | | | 18 | % | | | 19,806 | |
| (-) Depreciation, depletion and amortization | | | 1,482 | | | | 1,434 | | | | 3 | % | | | 1,399 | | | | 6 | % | | | 5,950 | |
| Cash COGS | | | 3,818 | | | | 3,344 | | | | 14 | % | | | 3,075 | | | | 24 | % | | | 13,856 | |
| Sales volume | | | 3,010 | | | | 2,833 | | | | 6 | % | | | 2,846 | | | | 6 | % | | | 11,804 | |
| Cash COGS/ton (R$/ton) | | | 1,269 | | | | 1,180 | | | | 7 | % | | | 1,081 | | | | 17 | % | | | 1,174 | |
Cash COGS in 3Q21 totaled R$3,818 million, or R$1,269/ton. Compared to 2Q21, cash COGS increased 14% mainly due to the growth in sales volume (+6%), higher cost of production, higher logistics costs due to Brent increase and higher impact of scheduled maintenance downtimes. COGS per ton increased 7% due to the higher cost of production, logistics cost (Brent) and the impact of downtimes.
Compared to 3Q20, cash COGS increased 24%, chiefly due to the higher cash cost of production, Brent increase impacting logistics costs and higher sales volume (+6%). Cash COGS per ton was 17% higher year on year due to the same factors explained earlier.
SELLING EXPENSES
| Selling expenses (R$ million) | | 3Q21 | | | 2Q21 | | | Δ Q-o-Q | | | 3Q20 | | | Δ Y-o-Y | | | LTM 3Q21 | |
| Selling expenses (Income Statement) | | | 578 | | | | 497 | | | | 16 | % | | | 523 | | | | 11 | % | | | 2,247 | |
| (-) Depreciation, depletion and amortization | | | 237 | | | | 235 | | | | 1 | % | | | 241 | | | | -2 | % | | | 912 | |
| Cash selling expenses | | | 341 | | | | 262 | | | | 30 | % | | | 282 | | | | 21 | % | | | 1,334 | |
| Sales volume | | | 3,010 | | | | 2,833 | | | | 6 | % | | | 2,846 | | | | 6 | % | | | 11,804 | |
| Cash selling expenses/ton (R$/ton) | | | 113 | | | | 92 | | | | 23 | % | | | 99 | | | | 14 | % | | | 113 | |
Cash selling expenses increased 30% in relation to 2Q21, mainly due to the increase in Brent on inland freight expenses, as well as the growth in sales volume (+6%). Cash selling expenses per ton increased 23% mainly due to higher Brent on logistics expenses, as mentioned above.
Compared to 3Q20, the 21% increase in cash selling expenses is mainly due to higher inland logistics expenses (Brent and other effects), as well as higher sales volume (+6%). Cash selling expenses per ton increased 14% due to Brent and the logistics factors mentioned above.
GENERAL AND ADMINISTRATIVE EXPENSES
| General and Administrative Expenses (R$ million) | | | 3Q21 | | | | 2Q21 | | | | Δ Q-o-Q | | | | 3Q20 | | | | Δ Y-o-Y | | | | LTM 3Q21 | |
| General and Administrative Expenses (Income Statament) | | | 320 | | | | 353 | | | | -9 | % | | | 313 | | | | 2 | % | | | 1,535 | |
| (-) Depreciation, depletion and amortization | | | 25 | | | | 26 | | | | -2 | % | | | 10 | | | | 151 | % | | | 102 | |
| Cash general and administrative expenses | | | 294 | | | | 327 | | | | -10 | % | | | 303 | | | | -3 | % | | | 1,434 | |
| Sales volume | | | 3,010 | | | | 2,833 | | | | 6 | % | | | 2,846 | | | | 6 | % | | | 11,804 | |
| Cash general and administrative expenses/t (R$/ton) | | | 98 | | | | 115 | | | | -15 | % | | | 106 | | | | -8 | % | | | 121 | |
Compared to 2Q21, the 10% decrease in cash general and administrative expenses is mainly due to the decline in expenses related to COVID-19, lower third-party services and personnel expenses (variable compensation). The same factors caused the 15% decline per ton and higher dilution of expenses.
Compared to 3Q20, cash general and administrative expenses declined 3%, mainly due to lower expenses related to COVID-19 and personnel, which were partially offset by higher expenses with third parties. On a per ton basis, these expenses declined 8% due to the same factors, in addition to higher dilution of fixed expenses.
Other operating income (expenses) amounted to an income of R$19 million in 3Q21, compared to an income of R$910 million in 2Q21 and an expense of R$4 million in 3Q20. The decrease in relation to 2Q21 is mainly due to the absence of the updated fair value of biological assets (which happens in the second and fourth quarter of each year) and due to the recognition of tax credits related to the recognition of the right to exclude ICMS from the calculation basis of contributions to PIS and COFINS, which were recognized in greater proportion in 2Q21. Compared to 3Q20, the variation is mainly due to the aforementioned tax credit of R$53 million in 3Q21, partially offset by higher expenses with asset sale and write-offs.
ADJUSTED EBITDA
| Consolidated | | | 3Q21 | | | | 2Q21 | | | | Δ Q-o-Q | | | | 3Q20 | | | | Δ Y-o-Y | | | | LTM 3Q21 | |
| Adjusted EBITDA (R$ million)1 | | | 6,310 | | | | 5,942 | | | | 6 | % | | | 3,779 | | | | 67 | % | | | 21,081 | |
| Adjusted EBITDA1 Margin - ex-Klabin | | | 59 | % | | | 60 | % | | | -2 p.p. | | | | 51 | % | | | 8 p.p. | | | | 56 | % |
| Sales Volume ex-Klabin (k ton) | | | 3,010 | | | | 2,833 | | | | 6 | % | | | 2,846 | | | | 6 | % | | | 11,804 | |
| Adjusted EBITDA1 ex-Klabin/ton (R$/ton) | | | 2,097 | | | | 2,097 | | | | 0 | % | | | 1,328 | | | | 58 | % | | | 1,786 | |
1Excludes non-recurring items.
The increase in Adjusted EBITDA in 3Q21 compared to 2Q21 is due to the 6% growth in sales volume and higher average net price. These factors were partially offset by the increase in cash COGS per ton, decline in the average USD against BRL (1%) and higher selling expenses, as mentioned earlier. Adjusted EBITDA per ton remained stable.
Compared to 3Q20, the 67% increase in Adjusted EBITDA was largely due to higher net average price of pulp in USD (+43%) and higher sales volume, partially offset by the increase in cash COGS per ton, decline in average USD vs. BRL (3%) and higher selling expenses. Adjusted EBITDA per ton increased 58% due to the price factor, which was partially offset by higher cash COGS per ton, by the foreign exchange effect and higher selling expenses.
FINANCIAL RESULT
| Financial Result (R$ million) | | | 3Q21 | | | | 2Q21 | | | | Δ Q-o-Q | | | | 3Q20 | | | | Δ Y-o-Y | | | | LTM 3Q21 | |
| Financial Expenses | | | (1,213 | ) | | | (932 | ) | | | 30 | % | | | (1,365 | ) | | | -11 | % | | | (4,110 | ) |
| Interest on loans and financing (local currency) | | | (180 | ) | | | (146 | ) | | | 24 | % | | | (171 | ) | | | 6 | % | | | (627 | ) |
| Interest on loans and financing (foreign currency) | | | (619 | ) | | | (590 | ) | | | 5 | % | | | (1,007 | ) | | | -39 | % | | | (2,429 | ) |
| Capitalized interest1 | | | 4 | | | | 1 | | | | - | | | | 2 | | | | - | | | | 6 | |
| Other financial expenses | | | (418 | ) | | | (197 | ) | | | 112 | % | | | (190 | ) | | | 120 | % | | | (1,060 | ) |
| Financial Income | | | 54 | | | | 46 | | | | 18 | % | | | 58 | | | | -7 | % | | | 191 | |
| Interest on financial investments | | | 44 | | | | 29 | | | | 51 | % | | | 20 | | | | 125 | % | | | 112 | |
| Other financial income | | | 10 | | | | 17 | | | | -40 | % | | | 39 | | | | -74 | % | | | 78 | |
| Monetary and Exchange Variations | | | (4,078 | ) | | | 6,896 | | | | - | | | | (1,645 | ) | | | 148 | % | | | 2,075 | |
| Foreign exchange variations (Debt) | | | (5,191 | ) | | | 7,663 | | | | - | | | | (1,851 | ) | | | 180 | % | | | 1,725 | |
| Other foreign exchange variations | | | 1,113 | | | | (768 | ) | | | - | | | | 206 | | | | 439 | % | | | 350 | |
| Derivative income (loss), net2 | | | (2,529 | ) | | | 3,733 | | | | - | | | | (1,271 | ) | | | 99 | % | | | 1,394 | |
| Cash flow hedge | | | (1,077 | ) | | | 1,748 | | | | - | | | | (459 | ) | | | 134 | % | | | 725 | |
| Debt hedge | | | (1,303 | ) | | | 2,015 | | | | - | | | | (766 | ) | | | 70 | % | | | 957 | |
| Others3 | | | (149 | ) | | | (30 | ) | | | - | | | | (46 | ) | | | 226 | % | | | (289 | ) |
| Net Financial Result | | | (7,765 | ) | | | 9,743 | | | | - | | | | (4,223 | ) | | | 84 | % | | | (451 | ) |
1Capitalized interest due to construction in progress.
2Variation in mark-to-market adjustment (3Q21: -R$6,411 million | 2Q21: -R$4,103 million), plus adjustments paid and received (3Q21 = -R$221 million).
3Includes commodity hedging and embedded derivatives.
Financial expenses were 30% higher than in 2Q21, mainly due to: (i) the premium on the total repurchase of 2024 Senior Notes, whose coupon was 5.25% p.a., in the amount of R$227 million as part of the liability management of the Company; (ii) the increase in the CDI (from 4.15% in 2Q21 to 6.15% in 3Q21), which represents the main index of the debt in local currency; and (iii) the increase in gross debt with the issuance of Senior Notes 2028 and 2032 in the period, impacting the increase in interest on foreign currency loans. Compared to 3Q20, the 11% reduction in financial expenses is mainly due to the lower premium on the repurchase of bonds in the quarter. It is worth mentioning the reclassification of expenses with Senior Notes repurchase premiums (which in 3Q20 were R$366 million), from “Interest on loans and financing (foreign currency)” to “Other financial expenses” in operations carried out in 2021. The referred reallocation explains the 39% reduction in the “interest” line and the 120% increase in “other financial expenses” compared to 3Q20.
Financial income grew 18% in relation to 2Q21, due to the increase in Company’s cash position, in turn mainly due to issuances including two new Senior Notes (2028 and 2032), and also as a result of the CDI increase, which is the main index of the Company's financial investments. Compared to 3Q20, financial income declined 7% mainly due to the decrease in revenue from goodwill resulting from the merger of Fibria, which was fully amortized in 2020, fully offsetting the positive effect of the increase in interest arising from the higher cash position and the increase in the CDI in the period.
Inflation adjustment and exchange variation had a negative impact of R$4,078 million on the Company’s financial result in the quarter due to the 9% appreciation of the closing USD rate against BRL on the foreign currency portion of debt (83% of total debt). Note that the accounting impact of exchange variation on foreign currency debt has a cash impact only on the respective maturities.
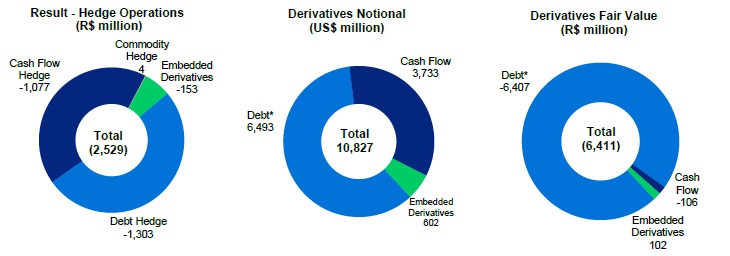
Derivative operations resulted in a loss of R$2,529 million in 3Q21, mainly due to the effect of weaker BRL on debt hedge and cash flow transactions, despite the positive impact of the variation in the fixed, coupon and Libor rate curves on the transactions. The mark-to-market adjustment of derivative instruments on September 30, 2021 was an expense of R$6,411 million, compared to an expense of R$4,103 million on June 30, 2021, representing a negative variation of R$2,308 million. Note that the impact of BRL depreciation on the derivatives portfolio generates a cash impact only upon the respective maturities. The net effect on cash, which refers to the maturity of derivative operations in the second quarter, was a negative R$221 million (R$114 million expense from debt hedge and R$107 million expense from operating and commodity hedge).
Due to the above factors, net financial result in 3Q21, considering all expense and financial income lines, was an expense of R$7,765 million, compared to an income of R$9,743 million in 2Q21 and an expense of R$4,223 million in 3Q20.
DERIVATIVE OPERATIONS
Suzano carries out derivative operations exclusively for hedging purposes. The following table reflects the position of derivative hedging instruments on September 30, 2021:
| | | Notional (US$ million) | | | Fair Value (R$ million) | |
| Hedge1 | | Sep/2021 | | | Jun/2021 | | | Sep/2021 | | | Jun/2021 | |
| Debt | | | 6,493 | | | | 6,507 | | | | (6,407 | ) | | | (5,218 | ) |
| Cash Flow | | | 3,733 | | | | 3,857 | | | | (106 | ) | | | 860 | |
| Others² | | | 602 | | | | 613 | | | | 102 | | | | 255 | |
| Total | | | 10,827 | | | | 10,976 | | | | (6,411 | ) | | | (4,103 | ) |
1Refer to note 4 of the 3Q21 Quarterly Financial Statements (ITR) for further details and fair value sensitivity analysis.
2Includes commodity hedge and embedded derivatives.
The Company’s foreign exchange exposure policy seeks to minimize the volatility of its cash generation and to impart greater flexibility to cash flow management. Currently, the policy stipulates that surplus dollars may be partially hedged (at least 40% and up to 75% of exchange variation exposure over the next 18 months) using plain vanilla instruments such as Zero Cost Collars (ZCC) and Non-Deliverable Forwards (NDF).
ZCC transactions establish minimum and maximum limits for the exchange rate that minimize adverse effects in the event of significant appreciation of the BRL. If the exchange rate is within such limits, the Company neither pays nor receives any financial adjustments. Therefore, the Company is protected in scenarios of extreme BRL appreciation. However, these transactions also limit, temporarily and partially, potential gains in scenarios of extreme BRL depreciation. This characteristic allows for capturing greater benefits from export revenue in a potential scenario of USD appreciation within the range contracted.
On September 30, 2021, the outstanding notional value of operations involving forward dollar sales through ZCCs was US$3,703 million, whose maturities are distributed from October 2021 to February 2023, with an average forward rate ranging from R$ 5.32 to R$6.13. On the same date, the outstanding notional value of operations involving forward USD sales through NDFs was US$30 million, whose maturities are in February 2022 and with an average rate of R$5.42. Cash flow hedge operations in 3Q21 resulted in a loss of R$1,077 million. The mark-to-market adjustment (fair value) of ZCC transactions was a loss of R$101 million and for NDFs was a loss of R$5 million at the end of the quarter.
The following table presents a sensitivity analysis of the cash impact that the Company could have on its cash flow hedge portfolio (ZCC and NDF) if the exchange rate remains the same as at the end of 3Q21 (R$/US$ = 5.44) in the coming quarters; as well as the projected variation in cash impact for each R$0.10 variation above the call strike level of each quarter. Note that the figures presented in the table are the Company’s projections based on the end-of-period curves and could fluctuate depending on market conditions.
| | | | | | | | | Cash adjustment (R$ million) | |
Maturity
(up to) | | Strike Range | | | Notional
(US$ million) | | | Actual | | | R$ / US$ = 5.44 (3Q21) | | | Sensitivity at R$ 0.10
/ US$
variation (+/-)1 | |
| | | | | | | | | | | | | | | | |
| Zero Cost Collars | |
| 3Q21 | | | - | | | | - | | | | (113 | ) | | | - | | | | - | |
| 4Q21 | | | 5.22 – 6.12 | | | | 969 | | | | - | | | | 13 | | | | (97 | ) |
| 1Q22 | | | 5.37 – 6.10 | | | | 731 | | | | - | | | | 38 | | | | (73 | ) |
| 2Q22 | | | 5.33 – 6.06 | | | | 961 | | | | - | | | | 26 | | | | (96 | ) |
| 3Q22 | | | 5.33 – 6.04 | | | | 508 | | | | - | | | | 9 | | | | (51 | ) |
| 4Q22 | | | 5.36 – 6.19 | | | | 358 | | | | - | | | | 14 | | | | (36 | ) |
| 1Q23 | | | 5.42 – 6.89 | | | | 176 | | | | - | | | | 7 | | | | (18 | ) |
| Total | | | 5.32 – 6.13 | | | | 3,703 | | | | (113 | ) | | | 107 | | | | (370 | ) |
| NDF | | | | | | | | | | | | | | | | | | | | |
| 3Q21 | | | - | | | | - | | | | 2 | | | | - | | | | - | |
| 4Q21 | | | - | | | | - | | | | - | | | | - | | | | - | |
| 1Q22 | | | 5.42 | | | | 30 | | | | - | | | | (1 | ) | | | (3 | ) |
| Total | | | 5.42 | | | | 30 | | | | 2 | | | | (1 | ) | | | (3 | ) |
1Note: sensitivity of adjustments for exchange rates above the strike.
The Company also uses currency and interest rate swaps to mitigate the effects of exchange and interest rate variations on its debt and its cash flow. Contracts swapping different interest rates and inflation indexes may be entered into as a way to mitigate the mismatch between financial assets and liabilities.
On September 30, 2021, the Company had outstanding (notional value) US$6,493 million distributed as shown in the table below. In 3Q21, the result of debt hedge transactions was a loss of R$1,303 million, mainly due to BRL depreciation in the period. The mark-to-market (fair value) of such operations was negative by R$6,407 million at the end of the quarter.
| | | | | | | | | | Notional (US$ million) | | | | Fair value (R$ million) | |
| Debt Hedge | | | Maturity (up to) | | | Currency | | | Sep/2021 | | | | Jun/2021 | | | | Sep/2021 | | | | Jun/2021 | |
| Swap (PRÉ x USD) | | | 2024 | | | USD | | | 350 | | | | 350 | | | | (734 | ) | | | (529 | ) |
| Swap (CDI x USD) | | | 2026 | | | USD | | | 2,267 | | | | 2,267 | | | | (5,106 | ) | | | (4,166 | ) |
| Swap (IPCA x USD) | | | 2023 | | | USD | | | 121 | | | | 121 | | | | (142 | ) | | | (86 | ) |
| Swap (LIBOR x USD) | | | 2026 | | | USD | | | 3,600 | | | | 3,600 | | | | (681 | ) | | | (706 | ) |
| Swap (IPCA x CDI) | | | 2023 | | | BRL | | | 1551 | | | | 169 | | | | 256 | | | | 270 | |
| Total | | | | | | | | | 6,493 | | | | 6,507 | | | | (6,407 | ) | | | (5,218 | ) |
1Translated at the closing exchange rate (5.44).
The following table presents a sensitivity analysis1 of the cash impact that the Company could have on its debt hedge portfolio (swaps) if the exchange rate remains the same as at the end of 3Q21 (R$/US$ = 5.44) in the coming quarters; as well as the projected variation in cash impact for each R$0.10 variation on the same reference exchange rate (3Q21). Note that the figures presented in the table are the Company’s projections based on the end-of-period curves and could fluctuate depending on market conditions.
| | | | | | Cash adjustment (R$ million | |
| Maturity (up to) | | Notional
(US$
million) | | | Actual | | | R$ / US$ = 5.44 (3Q21) | | | Sensitivity at R$
0.10 / US$
variation (+/-)1 | |
| 3Q21 | | | - | | | | (114 | ) | | | - | | | | - | |
| 4Q21 | | | 83 | | | | - | | | | (160 | ) | | | (7 | ) |
| 2022 | | | 737 | | | | - | | | | (887 | ) | | | (60 | ) |
| 2023 | | | 2,173 | | | | - | | | | (194 | ) | | | (49 | ) |
| 2024 | | | 1,406 | | | | - | | | | (338 | ) | | | (46 | ) |
| 2025 | | | 1,231 | | | | - | | | | (1,172 | ) | | | (90 | ) |
| >2026 | | | 864 | | | | - | | | | (1,286 | ) | | | (85 | ) |
| Total | | | 6,493 | | | | (114 | ) | | | (4,037 | ) | | | (336 | ) |
1Sensitivity analysis considers variation only in the exchange rate (R$/US$), while other variables are presumed constant.
Other transactions involving the Company’s derivatives are related to the embedded derivative resulting from the forestry partnerships and commodity hedges, as shown in the table.
| | | | | | | Notional
(US$ million) | | | Fair value
(R$ million) | | | Cash adjustment
(R$ million) | |
| Other hedges | | Maturity
(up to) | | Index | | Sep/2021 | | | Jun/2021 | | | Sep/2021 | | | Jun/2021 | | | 3Q21 | | | 2Q21 | |
| Embedded derivative | | 2035 | | Fixed USD | USD US-CPI | | | 602 | | | | 613 | | | | 102 | | | | 255 | | | | - | | | | - | |
| Commodities | | 2021 | | Brent/VLSFO/
Other | | | - | | | | - | | | | - | | | | - | | | | 4 | | | | 32 | |
| Total | | | | | | | 602 | | | | 613 | | | | 102 | | | | 255 | | | | 4 | | | | 32 | |
Forestry partnership agreements and wood supply agreements signed on December 31, 2013 are denominated in USD per cubic meter of standing timber, adjusted by U.S. inflation measured by the Consumer Price Index (CPI), which is not related to inflation in the economic environment where the forests are located and, hence, constitutes an embedded derivative. This instrument, which is presented in the table above, consists of a swap contract with the short leg consisting of the variations in the US-CPI during the period of the agreements mentioned below. See note 4 of the 3Q21 Financial Statements for more details and for a sensitivity analysis of the fair value in case of a sharp rise in the U.S. CPI. On September 30, 2021, the outstanding (notional) value of the operation was US$602 million. The result of this swap in 3Q21 was a loss of R$153 million. The mark-to-market (fair value) adjustment of these operations generated a gain of R$102 million at the end of the quarter.
The Company is also exposed to the international Brent prices, which is reflected in the logistics costs of exports and in certain raw materials. In this case, the Company studies the contracting of derivative instruments to mitigate the risk.
On September 30, 2021, the Company did not have open commodity hedge transactions. The result of these operations in 3Q21 was a gain of R$4 million.
*Debt in BRL translated into USD at the closing exchange rate of the month (R$/US$5.44 on 09/30/2021).
NET INCOME (LOSS)
In 3Q21, the Company posted net loss of R$959 million, compared to net income of R$10,037 million in 2Q21 and net loss of R$1,158 million in 3Q20. The decline in relation to 2Q21 was chiefly due to the negative financial result, in turn caused by the exchange rate variation on debt, as well as derivative operations. Compared to 3Q20, the R$198 million improvement in net result mainly reflects the increase in operating income and higher income tax and social contribution credit, in turn caused by the higher impact of exchange variation and mark-to-market adjustment of derivatives in Deferred Income Tax), partially offset by the lower financial result.
DEBT
| Debt (R$ million) | | 09/30/2021 | | | 06/30/2021 | | | Δ Y-o-Y | | | 09/30/2020 | | | Δ Q-o-Q | |
| Local Currency | | | 13,364 | | | | 13,275 | | | | 1 | % | | | 16,359 | | | | -18 | % |
| Short Term | | | 1,831 | | | | 1,003 | | | | 83 | % | | | 1,651 | | | | 11 | % |
| Long Term | | | 11,534 | | | | 12,272 | | | | -6 | % | | | 14,709 | | | | -22 | % |
| Foreign Currency | | | 63,783 | | | | 55,202 | | | | 16 | % | | | 62,131 | | | | 3 | % |
| Short Term | | | 455 | | | | 917 | | | | -50 | % | | | 2,673 | | | | -83 | % |
| Long Term | | | 63,328 | | | | 54,285 | | | | 17 | % | | | 59,458 | | | | 7 | % |
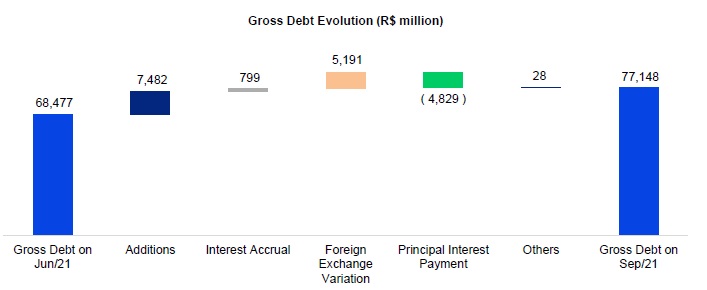
| Gross Debt | | | 77,148 | | | | 68,477 | | | | 13 | % | | | 78,490 | | | | -2 | % |
| (-) Cash | | | 18,930 | | | | 11,271 | | | | 68 | % | | | 9,758 | | | | 94 | % |
| Net debt | | | 58,218 | | | | 57,206 | | | | 2 | % | | | 68,731 | | | | -15 | % |
| Net debt/Adjusted EBITDA1(x) - R$ | | | 2.8 x | | | | 3.1 x | | | | -0.3 x | | | | 5.1 x | | | | -2.3 x | |
| Net debt/Adjusted EBITDA1(x) - US$ | | | 2.7 x | | | | 3.3 x | | | | -0.6 x | | | | 4.4 x | | | | -1.7 x | |
1Excluding non-recurring items.
On September 30, 2021, gross debt stood at R$77.1 billion and was composed of 97% long-term maturities and 3% short-term maturities. Debt denominated in foreign currency corresponded to 83% of the Company's total debt, while debt in local currency corresponded to the remaining 17%. The percentage of gross debt denominated in foreign currency, considering the effect of debt hedge, was 97%. Gross debt increased 13% (R$8.7 billion) in relation to 2Q21, chiefly due to the weakening of BRL against USD, and net funding in the period mainly through the issuance of Senior Notes 2028 and 2032.
Suzano contracts debt in foreign currency debt as a natural hedge, since net operating cash generation is denominated in foreign currency (U.S. dollar) due to its predominant status as an exporter. This structural exposure allows the Company to match loans and financing payments in USD with receivable flows from sales.
*Corresponding mainly to transaction costs (issue, funding etc.).
On September 30, 2021, the total average cost of debt in USD was 4.3% p.a. (debt in BRL adjusted by the market swap curve), compared to 4.4% p.a. on June 30, 2021. The average term of consolidated debt at the end of the quarter was 90 months (87 months in June 2021).

1Considers the portion of debt with currency swaps. The original debt was 83% denominated in USD and 17% in BRL.
2Considers the portion of debt with currency swaps. The exposure of the original debt was: Fixed (US$) – 60%, Libor – 23%, CDI – 11%, Other (Fixed R$, IPCA, TJLP, others) – 5%.
Cash and cash equivalents on September 30, 2021 amounted to R$18.9 billion, 80% of which were invested in foreign currency fixed-income and short-term investments. The local currency portion was invested in government and fixed-income bonds, remunerated at a percentage of the DI rate.
The Company has a stand-by credit facility, in foreign currency, of US$0.5 billion (R$2.7 billion) available through February 2024. This facility helps improve the company's liquidity position and can be withdrawn during times of uncertainty, such as during the first half of 2020, when the COVID-19 pandemic broke out. As a result, the current cash position of R$18.9 billion plus the facility described above amount to a readily available cash position of R$21.6 billion.
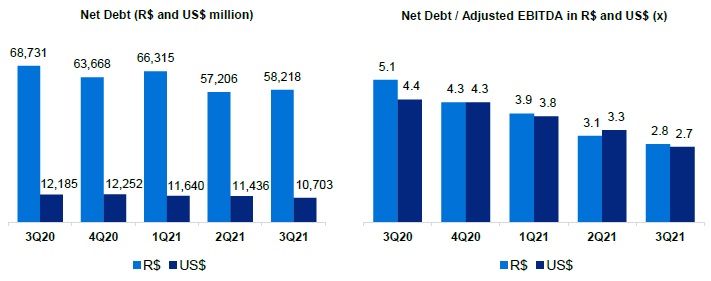
Net debt stood at R$58.2 billion (US$10.7 billion) on September 30, 2021, compared to R$57.2 billion (US$11.4 billion) on June 30, 2021. Though net debt in BRL increased on account of the exchange rate variation in the period, net debt in USD declined as a result of higher cash balance.
Financial leverage, measured as the ratio of net debt to Adjusted EBITDA in BRL, was 2.8 times on September 30, 2021, compared to 3.1 times in 2Q21. The same ratio in USD, a measure established in Suzano’s financial policy, dropped from 3.3 times in 2Q21 to 2.7 times on September 30, 2021.

The breakdown of total gross debt between trade and non-trade finance on September 30, 2021 is shown below:
| | | 2021 | | | 2022 | | | 2023 | | | 2024 | | | 2025 | | | 2026
onward | | | Total | |
| Trade Finance1 | | | 22 | % | | | 29 | % | | | 0 | % | | | 98 | % | | | 63 | % | | | 11 | % | | | 27 | % |
| Non Trade Finance2 | | | 78 | % | | | 71 | % | | | 100 | % | | | 2 | % | | | 37 | % | | | 89 | % | | | 73 | % |
1ACC, ACE, NCE, PPE
2Bonds, BNDES, CRA, Debentures, among others.
CAPITAL EXPENDITURE
In 3Q21, capital expenditure (cash basis) totaled R$1,535 million, up 21% from the previous quarter, mainly due to port terminals (increased spending on the Maranhão port project) and higher maintenance expenses (especially with greater investments in forestry maintenance). Compared to 3Q20, capex increased 32% as a result of higher investments in the Cerrado Project (infrastructure, earthworks and temporary works that proceed as planned) and increased investments in forestry maintenance.
| Investments (R$ million) | | | 3Q21 | | | | 2Q21 | | | | Δ Q-o-Q | | | | 3Q20 | | | | Δ Y-o-Y | | | | LTM
3Q21 | | | | Guidance
2021 | |
| Maintenance | | | 1,105 | | | | 1,001 | | | | 10 | % | | | 924 | | �� | | 20 | % | | | 3,105 | | | | 4,038 | |
| Industrial maintenance | | | 154 | | | | 141 | | | | 9 | % | | | 149 | | | | 4 | % | | | 445 | | | | 829 | |
| Forestry maintenance | | | 919 | | | | 849 | | | | 8 | % | | | 745 | | | | 23 | % | | | 2,613 | | | | 3,076 | |
| Others | | | 32 | | | | 11 | | | | 196 | % | | | 31 | | | | 5 | % | | | 48 | | | | 133 | |
| Expansion and modernization | | | 49 | | | | 29 | | | | 70 | % | | | 55 | | | | -11 | % | | | 105 | | | | 240 | |
| Land and forestry | | | 77 | | | | 49 | | | | 57 | % | | | 152 | | | | -49 | % | | | 310 | | | | 752 | |
| Port terminals | | | 107 | | | | 11 | | | | 846 | % | | | 25 | | | | 331 | % | | | 211 | | | | 152 | |
| Maintenance | | | 0 | | | | 0 | | | | - | | | | - | | | | - | | | | 0 | | | | 79 | |
| Cerrado Project1 | | | 196 | | | | 174 | | | | 13 | % | | | 11 | | | | - | | | | 390 | | | | 957 | |
| Total | | | 1,535 | | | | 1,264 | | | | 21 | % | | | 1,167 | | | | 32 | % | | | 4,122 | | | | 6,218 | |
1Some capital expenditure items have been reclassified to better reflect the expenses that went to the Cerrado Project.
OPERATING CASH GENERATION
| Operating cash flow - Consolidated (R$ million) | | 3Q21 | | | 2Q21 | | | Δ Q-o-Q | | | 3Q20 | | | Δ Y-o-Y | | | LTM 3Q21 | |
| Adjusted EBITDA1 | | | 6,310 | | | | 5,942 | | | | 6 | % | | | 3,779 | | | | 67 | % | | | 21,081 | |
| Maintenance Capex2 | | | (1,105 | ) | | | (1,001 | ) | | | 10 | % | | | (924 | ) | | | 20 | % | | | (4,089 | ) |
| Operating Cash Flow | | | 5,204 | | | | 4,940 | | | | 5 | % | | | 2,854 | | | | 82 | % | | | 16,991 | |
| Operating Cash Flow (R$/ton)³ | | | 1,729 | | | | 1,744 | | | | -1 | % | | | 1,003 | | | | 72 | % | | | 1,439 | |
¹Excludes non-recurring items.
²Cash basis.
Operating cash generation, measured by adjusted EBITDA less sustaining capex (cash basis), amounted to R$5,204 million in 3Q21. The decline in operating cash generation per ton in relation to 2Q21 is due to the higher sustaining capex per ton and lower adjusted EBITDA per ton. The 72% increase in relation to 3Q20 is due to the growth in adjusted EBITDA mentioned earlier, partially offset by higher sustaining capex per ton.
FREE CASH FLOW
| Free Cash Flow (R$ million) | | 3Q21 | | | 2Q21 | | | Δ Q-o-Q | | | 3Q20 | | | Δ Y-o-Y | | | LTM 3Q21 | |
| Adjusted EBITDA | | | 6,310 | | | | 5,942 | | | | 6 | % | | | 3,779 | | | | 67 | % | | | 21,081 | |
| (-) Total Capex¹ | | | (1,724 | ) | | | (1,332 | ) | | | 29 | % | | | (1,226 | ) | | | 41 | % | | | (5,735 | ) |
| (-) Leasing contracts – IFRS 16 | | | (222 | ) | | | (226 | ) | | | -2 | % | | | (223 | ) | | | 0 | % | | | (945 | ) |
| (+/-) D Working capital | | | 98 | | | | (573 | ) | | | - | | | | 1,290 | | | | - | | | | (276 | ) |
| (-) Net interest | | | (1,365 | ) | | | (280 | ) | | | 387 | % | | | (1,560 | ) | | | -12 | % | | | (3,129 | ) |
| (-) Income taxes | | | (11 | ) | | | (36 | ) | | | -68 | % | | | (67 | ) | | | -83 | % | | | (140 | ) |
| (-) Dividend payment | | | - | | | | (2 | ) | | | - | | | | - | | | | - | | | | (2 | ) |
| Free cash flow | | | 3,085 | | | | 3,492 | | | | -12 | % | | | 1,992 | | | | 55 | % | | | 10,853 | |
| (+) Capex ex-maintenance | | | 499 | | | | 241 | | | | 107 | % | | | 163 | | | | 206 | % | | | 1,099 | |
| (+) Dividend payment | | | - | | | | 2 | | | | - | | | | - | | | | - | | | | 2 | |
| Free cash flow - Adjusted | | | 3,583 | | | | 3,735 | | | | -4 | % | | | 2,155 | | | | 66 | % | | | 11,955 | |
| (-) Derivative cash adjustment | | | (221 | ) | | | (722 | ) | | | - | | | | (1,313 | ) | | | -83 | % | | | (2,973 | ) |
| Free cash flow - Adjusted - after derivatives² | | | 3,363 | | | | 3,013 | | | | 12 | % | | | 842 | | | | 299 | % | | | 8,981 | |
1Accrual basis.
2Free cash flow prior to dividend payments and capex ex-maintenance (accrual basis).
Free cash flow considering the adjustment for derivatives stood at R$3,363 million in 3Q21, as against R$3,013 million in 2Q21 and R$842 million in 3Q20. Compared to the previous period, free cash flow grew 12% due to the increase in working capital, lower payments resulting from derivative adjustments and higher adjusted EBITDA. These effects were partially offset by the higher concentration of net interest payments (mainly related to bonds). Regarding working capital, it is worth mentioning that the negative variations, especially in accounts receivable and inventories, were offset by the suppliers item (increase in payment terms and higher prices) and taxes payable.
Compared to 3Q20, the 299% increase was caused by the 67% growth in adjusted EBITDA and lower payments resulting from derivative adjustments, partially offset by the reduction in working capital. Regarding the variation in working capital, it is worth remembering that in 3Q20 there was a significant reduction in the price of pulp in USD and a drop in sales volume, contrasting the movement observed in 3Q21 in these two indicators.
COVID-19
With the onset of the COVID-19 pandemic, popularly known as the new coronavirus, Suzano adopted and has maintained preventive and mitigatory measures in compliance with the rules and policies established by Brazilian and international health authorities to minimize the impacts of the pandemic on the safety of people, society and its business.
The Company’s actions are based on three pillars: (1) People; (2) Society; (3) Business Continuity.
| (1) | People: To ensure the safety of its employees and contractors who work in its operations, Suzano adopted a series of measures to mitigate their exposure and/or mitigate the risks of exposure. |
| (2) | Society: One of Suzano’s three culture drivers is “It's only good for us if it's good for the world.” Accordingly, from the onset of the pandemic till now, the Company has taken a series of measures to protect society, including: |
| · | Donation of tissue paper, napkins and disposable diapers produced by it to needy regions. |
| · | Acquisition of 159 ventilators and 1 million medical masks for donation to the federal and state governments. |
| · | Participation in a joint effort with Positivo Tecnologia, Klabin, Flextronics and Embraer to support the Brazilian company Magnamed in manufacturing ventilators, which were delivered to the Brazilian government. Suzano invested R$9.6 million in this action in 2020. |
| · | Construction of a field hospital in Teixeira de Freitas, Bahia, jointly with Veracel, which was delivered to the state government and inaugurated in July 2020. |
| · | Partnership with the vocational school Fatec in Capão Bonito to produce hand sanitizer. |
| · | Forklifts lent to transport the donations received by the Red Cross. |
| · | Maintenance of all direct jobs. |
| · | Maintenance for 90 days (until the end of June 2020) the payment of 100% of the payroll expenses of employees of service providers whose operations were suspended because of the pandemic, in order to protect jobs. |
| · | Creation of a support program for small suppliers, a social program to help small farmers sell their produce via a home delivery system in 38 communities assisted by Suzano’s Rural Land Development Program (“PDRT”) in five states, and a social program to produce 125,000 masks in local communities for donation in five states. |
| · | Launch of a support program for small and midsized paper clients called “We’re Together” to ensure that these companies have the financial and managerial capacity to resume operations. |
| · | Support for the State Government of Maranhão in setting up the Imperatriz Temporary Hospital, donating R$3 million. |
| · | Supply of 280,000 m³ of oxygen to the State of Amazonas. |
| · | Construction of a new treatment center for COVID-19 in São Paulo in partnership with Gerdau, BTG Pactual, Península Participações and through joint efforts with Hospital Israelita Albert Einstein and the Municipal Government of São Paulo. |
| · | Donation of oxygen concentrators, acquired in a joint effort involving Suzano, Bradesco, BRF, B3, Embraer, Gerdau, Grupo Ultra, Itaú Unibanco, Magazine Luiza, Marfrig, Natura & Co and Unipar, to the Health Ministry, which is tasked with the logistics of distributing the devices. |
| · | Donation of 66,000 m³ of oxygen to the city of Imperatriz in Maranhão and 1,300 m³ to Aracruz in Espírito Santo. |
In 9M21, donations made in support of social actions implemented by Suzano totaled R$24 million (see Note 29 to the Financial Statements - Result by Nature).
| (3) | Business continuity: to date, the Company is maintaining its operations normally and has set up a crisis management committee that continues to function. |
The pulp and paper sector was recognized by the World Health Organization (WHO) and diverse countries as a producer of essential goods for society. Hence, to meet the responsibility arising from the essential nature of its business, Suzano took measures to ensure, to the maximum extent possible, that it maintains its operations normally and meets its clients’ requirements by increasing the level of wood and raw material inventories at plants and expanding its inventories of finished products, besides reaching out to its clients to minimize any risks of stockout at plants along the logistics chain and guarantee the sale of their products.
The current scenario arising from COVID-19 also implies higher credit risk, especially among its paper clients. Therefore, the Company has been monitoring this risk and implementing measures to mitigate it. To date, there have been no significant financial impacts.
As previously disclosed throughout 2020, the Company temporarily shut down its paper production lines at the Mucuri and Rio Verde mills for 30 days from April 27, 2020 and May 1, 2020, respectively. However, normal operations resumed at these mills in July 2020 and have been maintained since then.
Lastly, it is important to mention that in light of the current scenario, the Company has taken and maintained intensive communication efforts to further increase interactions with its main stakeholders in order to ensure adequate transparency and flow of information with them in a timely manner and in alignment with the current social and economic situation. All key updates on its measures and activities in the context of COVID-19 are available on the Company’s Investor Relations website.
The Company has also created a webpage with information on all its actions related to COVID-19: https://www.suzanocontraocoronavirus.com.br
ESG
The third quarter of 2021 was marked by major advances in the Company's ESG agenda.
During the period, Suzano issued a new Sustainability-Linked Bond (SLB) in the amount of US$500 million with two sustainability goals linked to the operation: (i) a target to reduce water consumption by the end of 2026; and (ii) a target to increase the percentage of women in leadership positions in the Company by the end of 2025. The operation achieved the lowest yield in the company’s history (2.70% p.a.) and with this issue, 39% of the Company's total debt at the end of 3Q21 was linked to ESG bonds.
In September, Suzano announced that it joined the Taskforce on Nature-related Financial Disclosures (TNFD). The Company will be part of an advisory group that will design a framework for organizations to measure and report the risks related to nature and their financial impacts. Joining TNFD underscores Suzano's alignment with its sustainability strategy and its commitment to honoring the Commitments to Renewing Life, including the recently announced biodiversity target.
Regarding the climate agenda, in September 2021, Suzano also joined the Business Ambition for 1.5ºC campaign and the Science Based Target Initiative (SBTi). While joining these initiatives, Suzano undertook to set within a period of two years (as established by the initiative), a target aligned with the climate scenario for reducing emissions, which limits global warming to 1.5°C. The company also announced a commitment with SBTi to actively help in developing methodologies applicable to the Pulp & Paper sector.
It is worth mentioning that based on other methodologies such as the Transition Pathway Initiative (TPI) and Trucost ESG Analysis on the Paris Agreement, Suzano is well below the 2°C threshold and has one of the lowest emission intensity indicators (scopes 1 and 2) per ton of product across the Paper and Pulp sector. Nevertheless, by joining these initiatives, the Company is committed to ramping up its ambition and the pace of its decarbonization journey, while removing carbon from the atmosphere, thus contributing to the global climate agenda.
The third quarter was also marked by the hiring of the new Executive Officer - Sustainability, Ms. Cristina Gil White, who joined the Company on October 1, 2021.
TOTAL OPERATIONAL EXPENDITURE - PULP
As disclosed through a Material Fact notice on March 24, 2021, the estimated total operating expenditure for 2024 is approximately R$1,400/t, and the trend for the indicator remains as planned, considering the exchange and inflation assumptions used.
EVENTS SUBSEQUENT TO THE REPORTING PERIOD
In October, in the context of discussions related to the climate emergency, the Company brought forward by five years the term of the Commitment to remove 40 million tons of CO2 from the atmosphere, from 2030 to 2025. The anticipation of the above target is supported by the expansion of vegetation cover during this period, through commercial plantations and areas destined for conservation, in places that were previously degraded and anthropized. In addition, the Company will continue through its research and management processes, improving its forest management in order to avoid losses, maximize productivity and increase carbon removal. In parallel, Suzano will continue to work with effective initiatives and fronts to reduce its greenhouse gas emissions in its own operations and in the chain (scopes 1, 2 and 3).
In November 2021, the 26th United Nations Climate Change Conference (COP26) will be held in Glasgow, Scotland. Suzano is actively participating in the pre-COP26 discussions and will send its representatives to the conference to emphasize the importance of negotiators arriving at a consensus on implementing article 6 of the Paris Agreement.
CAPITAL MARKETS
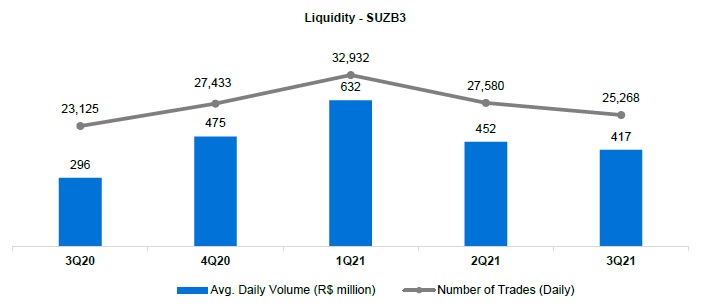
On September 30, 2021, Suzano’s stock was quoted at R$54.52/share (SUZB3) and US$10.00/share (SUZ). The Company’s stock is listed on the Novo Mercado, the listing segment of the São Paulo Stock Exchange (B3 – Brasil, Bolsa e Balcão) with the highest corporate governance standards, and on the New York Stock Exchange (NYSE) - Level II.

Source: Bloomberg.
Source: Bloomberg.
On September 30, 2021, the Company's share capital was represented by 1,361,263,584 common shares, of which 12,042,004 were held in Treasury. Suzano’s market capitalization stood at R$74.2 billion on September 30, 2021. Free float in 3Q21 corresponded to 53% of the total capital.

FIXED INCOME
| | | Unit | | Sep/21 | | | Jun/21 | | | Sep/20 | | | Δ Q-o-Q | | | Δ Y-o-Y | |
| Fibria 2025 - Price | | USD/k | | | 107.02 | | | | 108.04 | | | | 106.24 | | | | -0.9 | % | | | 0.7 | % |
| Fibria 2025 - Yield | | % | | | 1.79 | | | | 1.65 | | | | 2.46 | | | | 8.2 | % | | | -27.3 | % |
| Suzano 2026 - Price | | USD/k | | | 116.49 | | | | 117.76 | | | | 114.58 | | | | -1.1 | % | | | 1.7 | % |
| Suzano 2026 - Yield | | % | | | 2.10 | | | | 2.02 | | | | 2.99 | | | | 4.0 | % | | | -29.5 | % |
| Fibria 2027 - Price | | USD/k | | | 116.49 | | | | 116.45 | | | | 113.39 | | | | 2.0 | % | | | 7.7 | % |
| Fibria 2027 - Yield | | % | | | 2.10 | | | | 2.32 | | | | 3.14 | | | | -17.9 | % | | | -43.1 | % |
| Suzano 2028 - Price | | USD/k | | | 97.84 | | | | - | | | | - | | | | - | | | | - | |
| Suzano 2028 - Yield | | % | | | 2.84 | | | | - | | | | - | | | | - | | | | - | |
| Suzano 2029 – Price | | USD/k | | | 118.12 | | | | 119.41 | | | | 114.10 | | | | -1.1 | % | | | 3.5 | % |
| Suzano 2029 – Yield | | % | | | 3.19 | | | | 3.09 | | | | 3.98 | | | | 3.2 | % | | | -19.9 | % |
| Suzano 2030 – Price | | USD/k | | | 111.69 | | | | 113.45 | | | | 107.97 | | | | -1.6 | % | | | 3.4 | % |
| Suzano 2030 - Yield | | % | | | 3.37 | | | | 3.19 | | | | 3.97 | | | | 5.7 | % | | | -15.0 | % |
| Suzano 2031 - Price | | USD/k | | | 103.28 | | | | 104.79 | | | | 100.31 | | | | -1.4 | % | | | 3.0 | % |
| Suzano 2031 - Yield | | % | | | 3.34 | | | | 3.16 | | | | 3.71 | | | | 5.4 | % | | | -10.2 | % |
| Suzano 2032 - Price | | USD/k | | | 96.96 | | | | - | | | | - | | | | - | | | | - | |
| Suzano 2032 - Yield | | % | | | 3.48 | | | | - | | | | - | | | | - | | | | - | |
| Suzano 2047 - Price | | USD/k | | | 131.75 | | | | 134.97 | | | | 118.48 | | | | -2.4 | % | | | 11.2 | % |
| Suzano 2047 - Yield | | % | | | 4.82 | | | | 4.65 | | | | 5.65 | | | | 3.6 | % | | | -14.6 | % |
| Treasury 10 years | | % | | | 1.49 | | | | 1.47 | | | | 0.69 | | | | 1.3 | % | | | 117.1 | % |
Note: Senior Notes issued with face value of 100 USD/k
RATING
| Agency | | National Scale | | Global Scale | | Outlook |
| Fitch Ratings | | AAA | | BBB- | | Stable |
| Standard & Poor’s | | br.AAA | | BBB- | | Stable |
| Moody’s | | Aaa.br | | Baa3 | | Stable |
UPCOMING EVENTS
Earnings Conference Call (3Q21)
Date: October 29, 2021 (Friday)
| Portuguese (simultaneous translation) | English |
| 9:00 p.m. (Brasília) | 9:00 a.m. (Brasília) |
| 8:00 a.m. (New York) | 8:00 a.m. (New York) |
| 1:00 p.m. (London) | 1:00 p.m. (London) |
| Tel.: +55 (11) 3181-8565 | Tel.: +1 412 717-9627 |
Please connect 10 minutes before the conference call is scheduled to begin.
The conference call will be held in English and feature a presentation, with simultaneous webcast. The access links will be available on the Company’s Investor Relations website (www.suzano.com.br/ri).
If you are unable to participate, the webcast link will be available for future consultation on the Investor Relations website of Suzano S.A.
IR CONTACTS
Marcelo Bacci
Camila Nogueira
Luísa Puccini
Mariana Dutra
Roberto Costa
Tel.: +55 (11) 3503-9330
ri@suzano.com.br
www.suzano.com.br/ri
APPENDICES
APPENDIX 1 - Operating Data
| Revenue breakdown (R$ '000) | | 3Q21 | | | 2Q21 | | | Δ Q-o-Q | | | 3Q20 | | | Δ Y-o-Y | | | 9M21 | | | 9M20 | | | Δ Y-o-Y | |
| Exports | | | 8,937,959 | | | | 8,292,725 | | | | 8 | % | | | 6,140,197 | | | | 46 | % | | | 24,771,375 | | | | 19,002,672 | | | | 30 | % |
| Pulp | | | 8,443,713 | | | | 7,885,580 | | | | 7 | % | | | 5,753,923 | | | | 47 | % | | | 23,468,522 | | | | 17,875,291 | | | | 31 | % |
| Paper | | | 494,246 | | | | 407,145 | | | | 21 | % | | | 386,274 | | | | 28 | % | | | 1,302,853 | | | | 1,127,381 | | | | 16 | % |
| Domestic Market | | | 1,823,896 | | | | 1,551,714 | | | | 18 | % | | | 1,330,638 | | | | 37 | % | | | 4,724,085 | | | | 3,444,629 | | | | 37 | % |
| Pulp | | | 656,579 | | | | 559,797 | | | | 17 | % | | | 414,431 | | | | 58 | % | | | 1,670,727 | | | | 1,155,999 | | | | 45 | % |
| Paper | | | 1,167,317 | | | | 991,917 | | | | 18 | % | | | 916,207 | | | | 27 | % | | | 3,053,358 | | | | 2,288,630 | | | | 33 | % |
| Total Net Revenue | | | 10,761,855 | | | | 9,844,439 | | | | 9 | % | | | 7,470,835 | | | | 44 | % | | | 29,495,460 | | | | 22,447,301 | | | | 31 | % |
| Pulp | | | 9,100,292 | | | | 8,445,377 | | | | 8 | % | | | 6,168,354 | | | | 48 | % | | | 25,139,249 | | | | 19,031,290 | | | | 32 | % |
| Paper | | | 1,661,563 | | | | 1,399,062 | | | | 19 | % | | | 1,302,481 | | | | 28 | % | | | 4,356,211 | | | | 3,416,011 | | | | 28 | % |
| Sales volume (‘000) | | | 3Q21 | | | | 2Q21 | | | | Δ Q-o-Q | | | | 3Q20 | | | | Δ Y-o-Y | | | | 9M21 | | | | 9M20 | | | | Δ Y-o-Y | |
| Exports | | | 2,564,315 | | | | 2,427,453 | | | | 6 | % | | | 2,432,865 | | | | 5 | % | | | 7,532,720 | | | | 7,854,566 | | | | -4 | % |
| Pulp | | | 2,467,203 | | | | 2,339,906 | | | | 5 | % | | | 2,334,152 | | | | 6 | % | | | 7,257,763 | | | | 7,575,759 | | | | -4 | % |
| Paper | | | 97,112 | | | | 87,547 | | | | 11 | % | | | 98,713 | | | | -2 | % | | | 274,957 | | | | 278,807 | | | | -1 | % |
| Paperboard | | | 7,984 | | | | 8,647 | | | | -8 | % | | | 15,204 | | | | -47 | % | | | 26,585 | | | | 52,738 | | | | -50 | % |
| Printing & Writing | | | 87,177 | | | | 75,732 | | | | 15 | % | | | 82,347 | | | | 6 | % | | | 241,117 | | | | 220,438 | | | | 9 | % |
| Other paper1 | | | 1,951 | | | | 3,168 | | | | -38 | % | | | 1,162 | | | | 68 | % | | | 7,255 | | | | 5,631 | | | | 29 | % |
| Domestic Market | | | 445,227 | | | | 405,371 | | | | 10 | % | | | 412,826 | | | | 8 | % | | | 1,254,221 | | | | 1,128,305 | | | | 11 | % |
| Pulp | | | 205,813 | | | | 197,193 | | | | 4 | % | | | 192,415 | | | | 7 | % | | | 605,654 | | | | 584,713 | | | | 4 | % |
| Paper | | | 239,414 | | | | 208,178 | | | | 15 | % | | | 220,411 | | | | 9 | % | | | 648,567 | | | | 543,592 | | | | 19 | % |
| Paperboard | | | 42,516 | | | | 41,501 | | | | 2 | % | | | 37,362 | | | | 14 | % | | | 123,704 | | | | 94,021 | | | | 32 | % |
| Printing & Writing | | | 164,647 | | | | 138,448 | | | | 19 | % | | | 152,069 | | | | 8 | % | | | 437,783 | | | | 356,335 | | | | 23 | % |
| Other paper1 | | | 32,251 | | | | 28,229 | | | | 14 | % | | | 30,980 | | | | 4 | % | | | 87,080 | | | | 93,236 | | | | -7 | % |
| Total Sales Volume | | | 3,009,542 | | | | 2,832,824 | | | | 6 | % | | | 2,845,691 | | | | 6 | % | | | 8,786,941 | | | | 8,982,871 | | | | -2 | % |
| Pulp | | | 2,673,016 | | | | 2,537,099 | | | | 5 | % | | | 2,526,567 | | | | 6 | % | | | 7,863,417 | | | | 8,160,472 | | | | -4 | % |
| Paper | | | 336,526 | | | | 295,725 | | | | 14 | % | | | 319,124 | | | | 5 | % | | | 923,524 | | | | 822,399 | | | | 12 | % |
| Paperboard | | | 50,500 | | | | 50,148 | | | | 1 | % | | | 52,566 | | | | -4 | % | | | 150,289 | | | | 146,759 | | | | 2 | % |
| Printing & Writing | | | 251,824 | | | | 214,180 | | | | 18 | % | | | 234,416 | | | | 7 | % | | | 678,900 | | | | 576,773 | | | | 18 | % |
| Other paper1 | | | 34,202 | | | | 31,397 | | | | 9 | % | | | 32,142 | | | | 6 | % | | | 94,335 | | | | 98,867 | | | | -5 | % |
| Average net price (R$/ton) | | | 3Q21 | | | | 2Q21 | | | | Δ Q-o-Q | | | | 3Q20 | | | | Δ Y-o-Y | | | | 9M21 | | | | 9M20 | | | | Δ Y-o-Y | |
| Exports | | | 3,486 | | | | 3,416 | | | | 2 | % | | | 2,524 | | | | 38 | % | | | 3,289 | | | | 2,419 | | | | 36 | % |
| Pulp | | | 3,422 | | | | 3,370 | | | | 2 | % | | | 2,465 | | | | 39 | % | | | 3,234 | | | | 2,360 | | | | 37 | % |
| Paper | | | 5,089 | | | | 4,651 | | | | 9 | % | | | 3,913 | | | | 30 | % | | | 4,738 | | | | 4,044 | | | | 17 | % |
| Domestic Market | | | 4,097 | | | | 3,828 | | | | 7 | % | | | 3,223 | | | | 27 | % | | | 3,767 | | | | 3,053 | | | | 23 | % |
| Pulp | | | 3,190 | | | | 2,839 | | | | 12 | % | | | 2,154 | | | | 48 | % | | | 2,759 | | | | 1,977 | | | | 40 | % |
| Paper | | | 4,876 | | | | 4,765 | | | | 2 | % | | | 4,157 | | | | 17 | % | | | 4,708 | | | | 4,210 | | | | 12 | % |
| Total | | | 3,576 | | | | 3,475 | | | | 3 | % | | | 2,625 | | | | 36 | % | | | 3,357 | | | | 2,499 | | | | 34 | % |
| Pulp | | | 3,405 | | | | 3,329 | | | | 2 | % | | | 2,441 | | | | 39 | % | | | 3,197 | | | | 2,332 | | | | 37 | % |
| Paper | | | 4,937 | | | | 4,731 | | | | 4 | % | | | 4,081 | | | | 21 | % | | | 4,717 | | | | 4,154 | | | | 14 | % |
| Average net price (US$/ton) | | 3Q21 | | 2Q21 | | Δ Q-o-Q | | | 3Q20 | | Δ Y-o-Y | | | 9M21 | | 9M20 | | Δ Y-o-Y | |
| Exports | | 667 | | 645 | | 3 | % | | 469 | | 42 | % | | 617 | | 477 | | 30 | % |
| Pulp | | 654 | | 636 | | 3 | % | | 458 | | 43 | % | | 607 | | 465 | | 31 | % |
| Paper | | 973 | | 878 | | 11 | % | | 727 | | 34 | % | | 889 | | 797 | | 12 | % |
| Domestic Market | | 784 | | 722 | | 9 | % | | 599 | | 31 | % | | 707 | | 601 | | 18 | % |
| Pulp | | 610 | | 536 | | 14 | % | | 400 | | 53 | % | | 517 | | 390 | | 33 | % |
| Paper | | 933 | | 899 | | 4 | % | | 773 | | 21 | % | | 883 | | 829 | | 7 | % |
| Total | | 684 | | 656 | | 4 | % | | 488 | | 40 | % | | 630 | | 492 | | 28 | % |
| Pulp | | 651 | | 628 | | 4 | % | | 454 | | 43 | % | | 600 | | 459 | | 31 | % |
| Paper | | 944 | | 893 | | 6 | % | | 759 | | 24 | % | | 885 | | 818 | | 8 | % |
¹Paper of other manufacturers sold by Suzano and tissue paper.
| FX Rate R$/US$ | | 3Q21 | | 2Q21 | | Δ Q-o-Q | | | 3Q20 | | Δ Y-o-Y | |
| Closing | | 5.44 | | 5.00 | | 9 | % | | 5.64 | | -4 | % |
| Average | | 5.23 | | 5.30 | | -1 | % | | 5.38 | | -3 | % |
APPENDIX 2 – Consolidated Statement of Income and Goodwill Amortization
Income Statement (R$ ‘000) | | 3Q21 | | | 2Q21 | | | ΔQ-o-Q | | | 3Q20 | | | ΔY-o-Y | | | 9M21 | | | 9M20 | | | ΔY-o-Y | |
| Net Revenue | | | 10,761,855 | | | | 9,844,439 | | | | 9 | % | | | 7,470,835 | | | | 44 | % | | | 29,495,460 | | | | 22,447,301 | | | | 31 | % |
| Cost of Goods Sold | | | (5,299,911 | ) | | | (4,777,655 | ) | | | 11 | % | | | (4,473,994 | ) | | | 18 | % | | | (14,922,600 | ) | | | (14,082,687 | ) | | | 6 | % |
| Gross Debt | | | 5,461,944 | | | | 5,066,784 | | | | 8 | % | | | 2,996,841 | | | | 82 | % | | | 14,572,860 | | | | 8,364,614 | | | | 74 | % |
| Gross Margin | | | 50.7 | % | | | 51.5 | % | | | -1 p.p. | | | | 40.1 | % | | | 11 p.p. | | | | 49.4 | % | | | 37.3 | % | | | 12 p.p. | |
| | | | | | | | | | | | | | | | | | | | | | | | | | | | | | | | | |
| Operating Expense/Income | | | (849,402 | ) | | | 139,703 | | | | -708 | % | | | (829,110 | ) | | | 2 | % | | | (1,146,900 | ) | | | (2,332,245 | ) | | | -51 | % |
| Selling Expenses | | | (578,101 | ) | | | (496,934 | ) | | | 16 | % | | | (522,594 | ) | | | 11 | % | | | (1,656,801 | ) | | | (1,584,628 | ) | | | 5 | % |
| General and Administrative Expenses | | | (319,590 | ) | | | (353,004 | ) | | | -9 | % | | | (312,735 | ) | | | 2 | % | | | (1,055,148 | ) | | | (963,286 | ) | | | 10 | % |
| Other Operating Income (Expenses) | | | 18,830 | | | | 909,543 | | | | -98 | % | | | (4,135 | ) | | | -555 | % | | | 1,445,226 | | | | 208,267 | | | | 594 | % |
| Equity Equivalence | | | 29,459 | | | | 80,098 | | | | -63 | % | | | 10,354 | | | | 185 | % | | | 119,823 | | | | 7,402 | | | | 1519 | % |
| EBIT | | | 4,612,542 | | | | 5,206,487 | | | | -11 | % | | | 2,167,731 | | | | 113 | % | | | 13,425,960 | | | | 6,032,369 | | | | 123 | % |
| | | | | | | | | | | | | | | | | | | | | | | | | | | | | | | | | |
| Depreciation, Amortization & Depletion | | | 1,745,487 | | | | 1,696,755 | | | | 3 | % | | | 1,653,560 | | | | 6 | % | | | 5,208,723 | | | | 5,011,119 | | | | 4 | % |
| | | | | | | | | | | | | | | | | | | | | | | | | | | | | | | | | |
| EBITDA | | | 6,358,029 | | | | 6,903,242 | | | | -8 | % | | | 3,821,291 | | | | 66 | % | | | 18,634,683 | | | | 11,043,488 | | | | 69 | % |
| EBITDA Margin (%) | | | 59.1 | % | | | 70.1 | % | | | -11 p.p. | | | | 51.2 | % | | | 8 p.p. | | | | 63.2 | % | | | 49.2 | % | | | 14 p.p. | |
| | | | | | | | | | | | | | | | | | | | | | | | | | | | | | | | | |
| Adjusted EBITDA1 | | | 6,309,558 | | | | 5,941,750 | | | | 6 | % | | | 3,778,534 | | | | 67 | % | | | 17,115,606 | | | | 10,984,519 | | | | 56 | % |
| Adjusted EBITDA Margin1 | | | 58.6 | % | | | 60.4 | % | | | -2 p.p. | | | | 50.6 | % | | | 8 p.p. | | | | 58.0 | % | | | 48.9 | % | | | 9 p.p. | |
| | | | | | | | | | | | | | | | | | | | | | | | | | | | | | | | | |
| Net Financial Result | | | (7,765,377 | ) | | | 9,742,584 | | | | -180 | % | | | (4,222,644 | ) | | | 84 | % | | | (6,689,914 | ) | | | (32,323,930 | ) | | | -79 | % |
| Financial Expenses | | | 54,444 | | | | 46,263 | | | | 18 | % | | | 58,413 | | | | -7 | % | | | 124,934 | | | | 261,586 | | | | -52 | % |
| Financial Revenues | | | (1,212,759 | ) | | | (932,159 | ) | | | 30 | % | | | (1,365,381 | ) | | | -11 | % | | | (3,135,851 | ) | | | (3,484,931 | ) | | | -10 | % |
| Exchange Rate Variation | | | (4,077,782 | ) | | | 6,895,657 | | | | -159 | % | | | (1,644,611 | ) | | | 148 | % | | | (2,388,590 | ) | | | (16,994,406 | ) | | | -86 | % |
| Net Proceeds Generated by Derivatives | | | (2,529,280 | ) | | | 3,732,823 | | | | -168 | % | | | (1,271,065 | ) | | | 99 | % | | | (1,290,407 | ) | | | (12,106,179 | ) | | | -89 | % |
| Earnings Before Taxes | | | (3,152,835 | ) | | | 14,949,071 | | | | -121 | % | | | (2,054,913 | ) | | | 53 | % | | | 6,736,046 | | | | (26,291,561 | ) | | | -126 | % |
| | | | | | | | | | | | | | | | | | | | | | | | | | | | | | | | | |
| Income and Social Contribution Taxes | | | 2,193,460 | | | | (4,912,372 | ) | | | -145 | % | | | 897,206 | | | | 144 | % | | | (413,981 | ) | | | 9,662,275 | | | | -104 | % |
| | | | | | | | | | | | | | | | | | | | | | | | | | | | | | | | | |
| Net Income (Loss) | | | (959,375 | ) | | | 10,036,699 | | | | -110 | % | | | (1,157,707 | ) | | | -17 | % | | | 6,322,065 | | | | (16,629,286 | ) | | | -138 | % |
| Net Margin | | | -8.9 | % | | | 102.0 | % | | | -111 p.p. | | | | -15.5 | % | | | 7 p.p. | | | | 21.4 | % | | | -74.1 | % | | | 95.5 p.p. | |
1Excluding non-recurring items.
| Goodwill amortization - PPA (R$ ‘000) | | | 3Q21 | | | | 2Q21 | | | | Δ Q-o-Q | | | | 3Q20 | | | | Δ Y-o-Y | |
| COGS | | | (149,176 | ) | | | (149,751 | ) | | | 0 | % | | | (126,165 | ) | | | 18 | % |
| Selling Expenses | | | (207,763 | ) | | | (207,763 | ) | | | 0 | % | | | (206,474 | ) | | | 1 | % |
| General and administrative expenses | | | (1,844 | ) | | | (2,668 | ) | | | -31 | % | | | 10,620 | | | | - | |
| Other operational revenues (expenses) | | | (18,886 | ) | | | (6,008 | ) | | | 214 | % | | | (14.686 | ) | | | 29 | % |
| Financial results | | | 14,397 | | | | (3,054 | ) | | | -571 | % | | | (1.303 | ) | | | - | |
APPENDIX 3 – Consolidated Balance Sheet
| Assets (R$ ’000) | | 09/30/2021 | | | 06/30/2021 | | | 09/30/2020 | |
| Current Assets | | | | | | | | | |
| Cash and cash equivalents | | | 13,461,967 | | | | 8,585,570 | | | | 7,247,184 | |
| Financial investments | | | 5,228,075 | | | | 2,448,267 | | | | 2,327,353 | |
| Trade accounts receivable | | | 4,577,069 | | | | 3,979,086 | | | | 3,036,769 | |
| Inventories | | | 4,652,459 | | | | 4,404,865 | | | | 4,245,766 | |
| Recoverable taxes | | | 427,987 | | | | 382,415 | | | | 874,152 | |
| Derivative financial instruments | | | 515,204 | | | | 1,204,841 | | | | 209,970 | |
| Advance to suppliers | | | 39,327 | | | | 35,821 | | | | 102,765 | |
| Other assets | | | 783,943 | | | | 758,427 | | | | 479,903 | |
| Total Current Assets | | | 29,686,031 | | | | 21,799,292 | | | | 18,523,862 | |
| | | | | | | | | | | | | |
| Non-Current Assets | | | | | | | | | | | | |
| Financial investments | | | 240,329 | | | | 237,345 | | | | 183,893 | |
| Recoverable taxes | | | 1,219,207 | | | | 1,156,151 | | | | 748,584 | |
| Deferred taxes | | | 8,505,573 | | | | 6,224,616 | | | | 11,399,116 | |
| Derivative financial instruments | | | 753,791 | | | | 764,156 | | | | 922,225 | |
| Advance to suppliers | | | 1,220,625 | | | | 1,249,628 | | | | 1,071,249 | |
| Judicial deposits | | | 322,879 | | | | 298,049 | | | | 266,214 | |
| Other assets | | | 237,742 | | | | 222,695 | | | | 235,309 | |
| | | | | | | | | | | | | |
| Biological assets | | | 11,807,705 | | | | 11,720,857 | | | | 10,759,599 | |
| Investments | | | 518,977 | | | | 497,083 | | | | 336,929 | |
| Property, plant and equipment | | | 38,027,466 | | | | 38,190,785 | | | | 39,736,484 | |
| Right of use on lease agreements | | | 4,593,241 | | | | 4,571,713 | | | | 4,242,105 | |
| Intangible | | | 16,249,726 | | | | 16,375,218 | | | | 17,014,465 | |
| Total Non-Current Assets | | | 83,697,261 | | | | 81,508,296 | | | | 86,916,172 | |
| | | | | | | | | | | | | |
| Total Assets | | | 113,383,292 | | | | 103,307,588 | | | | 105,440,034 | |
| Liabilities and Equity (R$ ´000) | | | 09/30/2021 | | | | 06/30/2021 | | | | 09/30/2020 | |
| Current Liabilities | | | | | | | | | | | | |
| Trade accounts payable | | | 2,966,600 | | | | 2,575,168 | | | | 2,157,286 | |
| Loans, financing and debentures | | | 2,286,040 | | | | 1,920,072 | | | | 4,323,325 | |
| Accounts payable for lease operations | | | 623,136 | | | | 593,691 | | | | 629,329 | |
| Derivative financial instruments | | | 1,619,081 | | | | 1,010,897 | | | | 4,117,393 | |
| Taxes payable | | | 346,285 | | | | 233,277 | | | | 315,080 | |
| Payroll and charges | | | 549,949 | | | | 444,938 | | | | 478,732 | |
| Liabilities for assets acquisitions and subsidiaries | | | 91,828 | | | | 112,446 | | | | 102,013 | |
| Dividends payable | | | 11,173 | | | | 11,185 | | | | 4,888 | |
| Advance from customers | | | 92,567 | | | | 115,260 | | | | | |
| Other liabilities | | | 359,754 | | | | 361,197 | | | | 292,387 | |
| Total Current Liabilities | | | 8,946,413 | | | | 7,378,131 | | | | 12,420,433 | |
| | | | | | | | | | | | | |
| Non-Current Liabilities | | | | | | | | | | | | |
| Loans, financing and debentures | | | 74,861,856 | | | | 66,556,926 | | | | 74,166,284 | |
| Lease liabilities | | | 5,030,297 | | | | 4,773,303 | | | | 4,662,805 | |
| Derivative financial instruments | | | 6,061,046 | | | | 5,060,920 | | | | 7,792,461 | |
| Liabilities for assets acquisitions and associates | | | 301,893 | | | | 396,923 | | | | 429,357 | |
| Provision for judicial liabilities | | | 3,273,411 | | | | 3,271,679 | | | | 3,403,233 | |
| Employee benefit plans | | | 795,090 | | | | 792,387 | | | | 747,984 | |
| Deferred taxes | | | | | | | | | | | 74,736 | |
| Share-based compensation plans | | | 206,961 | | | | 212,500 | | | | 203,865 | |
| Advance from customers | | | 165,439 | | | | 165,439 | | | | | |
| Other liabilities | | | 122,040 | | | | 111,888 | | | | 83,086 | |
| Total Non-Current Liabilities | | | 90,818,033 | | | | 81,341,965 | | | | 91,563,811 | |
| | | | | | | | | | | | | |
| Shareholders’ Equity | | | | | | | | | | | | |
| Share capital | | | 9,235,546 | | | | 9,235,546 | | | | 9,235,546 | |
| Capital reserves | | | 14,244 | | | | 13,033 | | | | 6,419,430 | |
| Treasury shares | | | (218,265 | ) | | | (218,265 | ) | | | (218,265 | ) |
| Retained earnings reserves | | | | | | | | | | | 317,144 | |
| Other reserves | | | 1,988,711 | | | | 2,028,382 | | | | 2,180,733 | |
| Retained loss | | | 2,498,255 | | | | 3,429,696 | | | | (16,599,888 | ) |
| Controlling shareholders´ | | | 13,518,491 | | | | 14,488,392 | | | | 1,334,700 | |
| | | | | | | | | | | | | |
| Non-controlling interest | | | 100,355 | | | | 99,100 | | | | 121,090 | |
| Total Equity | | | 13,618,846 | | | | 14,587,492 | | | | 1,455,790 | |
| Total Liabilities and Equity | | | 113,383,292 | | | | 103,307,588 | | | | 105,440,034 | |
APPENDIX 4 – Consolidated Statement of Cash Flow
| Cash Flow (R$ ‘000) | | 3Q21 | | | 3Q20 | | | 9M21 | | | 9M20 | |
| Cash flow from operating activities | | | | | | | | | | | | |
| Net income/(loss) for the period | | | (959,375 | ) | | | (1,157,707 | ) | | | 6,322,065 | | | | (16,629,286 | ) |
| Depreciation, depletion and amortization | | | 1,691,415 | | | | 1,633,305 | | | | 5,081,318 | | | | 4,871,983 | |
| Depreciation of right of use | | | 51,138 | | | | 33,492 | | | | 151,314 | | | | 126,801 | |
| Sublease of ships | | | (11,463 | ) | | | (11,956 | ) | | | (32,198 | ) | | | (23,321 | ) |
| Interest expense on lease liabilities | | | 105,310 | | | | 80,742 | | | | 317,850 | | | | 284,230 | |
| Result from sale and disposal of property, plant and equipment and biological assets, net | | | 28,789 | | | | 10,839 | | | | (492,384 | ) | | | 1,496 | |
| Income from associates and joint ventures | | | (29,459 | ) | | | (10,354 | ) | | | (119,823 | ) | | | (7,402 | ) |
| Exchange rate and monetary variations, net | | | 4,077,782 | | | | 1,644,611 | | | | 2,388,590 | | | | 16,994,406 | |
| Interest expenses with financing, loans and debentures, net | | | 798,942 | | | | 785,989 | | | | 2,292,512 | | | | 2,522,764 | |
| Premium expenses with early settlements | | | 226,570 | | | | 391,390 | | | | 260,289 | | | | 391,390 | |
| Capitalized loan costs | | | (4,011 | ) | | | (1,951 | ) | | | (5,060 | ) | | | (9,891 | ) |
| Accrual of interest on marketable securities | | | (36,801 | ) | | | (8,505 | ) | | | (75,408 | ) | | | (82,607 | ) |
| Amortization of fundraising costs | | | 33,768 | | | | 31,248 | | | | 90,270 | | | | 72,516 | |
| Derivative losses, net (Note 26) | | | 2,529,280 | | | | 1,271,065 | | | | 1,290,407 | | | | 12,106,179 | |
| Fair value adjustment of biological assets | | | | | | | | | | | (564,533 | ) | | | (173,733 | ) |
| Deferred income tax and social contribution | | | (2,281,320 | ) | | | (944,676 | ) | | | 170,458 | | | | (9,767,574 | ) |
| Interest on actuarial liabilities | | | 13,961 | | | | 13,279 | | | | 41,886 | | | | 39,806 | |
| Provision (reversal) for judicial liabilities, net | | | 24,108 | | | | 9,494 | | | | 57,633 | | | | (12,758 | ) |
| Allowance for doubtful accounts, net | | | 1,529 | | | | (5,040 | ) | | | 5,685 | | | | 5,210 | |
| Provision (reversal) for inventory losses, net | | | 21,888 | | | | (61,338 | ) | | | 32,555 | | | | (28,718 | ) |
| Provision (reversal) for loss of ICMS credits, net | | | 8,027 | | | | (141,526 | ) | | | 31,422 | | | | (93,375 | ) |
| Tax credits | | | (53,534 | ) | | | | | | | (368,965 | ) | | | | |
| Other | | | 8,920 | | | | 13,115 | | | | 19,922 | | | | 25,913 | |
| Decrease (increase) in assets | | | (537,712 | ) | | | 927,038 | | | | (2,081,601 | ) | | | 1,875,852 | |
| Trade accounts receivables | | | (298,356 | ) | | | 809,670 | | | | (1,520,746 | ) | | | 1,016,240 | |
| Inventories | | | (203,885 | ) | | | 93,542 | | | | (656,737 | ) | | | 560,017 | |
| Recoverable taxes | | | (50,185 | ) | | | 147,884 | | | | (38,000 | ) | | | 262,385 | |
| Other assets | | | 14,714 | | | | (124,058 | ) | | | 133,882 | | | | 37,210 | |
| Increase (decrease) in liabilities | | | 636,025 | | | | 362,967 | | | | 1,089,022 | | | | (329,320 | ) |
| Trade accounts payables | | | 465,575 | | | | 154,281 | | | | 917,283 | | | | (198,694 | ) |
| Taxes payable | | | 123,178 | | | | 111,414 | | | | 256,084 | | | | 135,649 | |
| Payroll and charges | | | 105,011 | | | | 97,972 | | | | 57,212 | | | | 78,293 | |
| Other liabilities | | | (57,739 | ) | | | (700 | ) | | | (141,557 | ) | | | (344,568 | ) |
| Cash provided by operations, net | | | 6,343,777 | | | | 4,865,521 | | | | 15,903,226 | | | | 12,160,561 | |
| Payment of interest with financing, loans and debentures | | | (1,153,851 | ) | | | (1,200,748 | ) | | | (2,633,676 | ) | | | (2,883,161 | ) |
| Payment of premium with early settlements | | | (226,570 | ) | | | (378,382 | ) | | | (260,289 | ) | | | (378,382 | ) |
| Interest received from marketable securities | | | 15,272 | | | | 19,572 | | | | 53,339 | | | | 146,151 | |
| Payment of income taxes | | | (11,427 | ) | | | (67,402 | ) | | | (82,156 | ) | | | (130,096 | ) |
| Cash provided by operating activities | | | 4,967,201 | | | | 3,238,561 | | | | 12,980,444 | | | | 8,915,073 | |
| | | | | | | | | | | | | | | | | |
| Investing activities | | | | | | | | | | | | | | | | |
| Additions to property, plant and equipment | | | (513,630 | ) | | | (310,183 | ) | | | (1,184,218 | ) | | | (869,309 | ) |
| Additions to intangible | | | (197,402 | ) | | | (913 | ) | | | (215,545 | ) | | | (1,426 | ) |
| Additions to biological assets | | | (1,013,284 | ) | | | (915,202 | ) | | | (2,624,958 | ) | | | (2,316,626 | ) |
| Proceeds from sale of property, plant and equipment | | | 44,783 | | | | 26,927 | | | | 1,305,791 | | | | 88,814 | |
| Capital increase | | | (998 | ) | | | | | | | (51,816 | ) | | | | |
| Marketable securities, net | | | (2,726,348 | ) | | | (308,816 | ) | | | (3,014,563 | ) | | | 3,755,545 | |
| Advance for acquisition of wood from operations with development | | | 38,823 | | | | 81,334 | | | | (193,334 | ) | | | 87,878 | |
| Dividends received | | | - | | | | 753 | | | | 6,453 | | | | 753 | |
| Acquisition of non-controlling interests | | | (34 | ) | | | - | | | | (6,516 | ) | | | - | |
| Cash used in investing activities, net | | | (4,368,090 | ) | | | (1,426,100 | ) | | | (5,978,706 | ) | | | 745,629 | |
| | | | | | | | | | | | | | | | | |
| Financing activities | | | | | | | | | | | | | | | | |
| Proceeds from loans, financing and debentures | | | 7,482,066 | | | | 3,882,643 | | | | 16,788,680 | | | | 10,583,172 | |
| Payment of derivative transactions | | | (220,968 | ) | | | (1,313,206 | ) | | | (1,655,256 | ) | | | (3,147,456 | ) |
| Payment of loans, financing and debentures | | | (3,675,376 | ) | | | (7,527,204 | ) | | | (15,407,928 | ) | | | (13,752,144 | ) |
| Payment of leases | | | (222,219 | ) | | | (222,838 | ) | | | (697,702 | ) | | | (577,127 | ) |
| Payment of dividends | | | - | | | | - | | | | (2,322 | ) | | | - | |
| Liabilities for assets acquisitions and associates | | | (149,215 | ) | | | (145,512 | ) | | | (150,735 | ) | | | (151,182 | ) |
| Cash provided (used) by financing activities, net | | | 3,214,288 | | | | (5,326,117 | ) | | | (1,125,263 | ) | | | (7,044,737 | ) |
| | | | | | | | | | | | | | | | | |
| Exchange variation on cash and cash equivalents | | | 1,062,998 | | | | 287,139 | | | | 750,435 | | | | 1,382,092 | |
| | | | | | | | | | | | | | | | | |
| Increase in cash and cash equivalents, net | | | 4,876,397 | | | | (3,226,517 | ) | | | 6,626,910 | | | | 3,998,057 | |
| At the beginning for the period | | | 8,585,570 | | | | 10,473,701 | | | | 6,835,057 | | | | 3,249,127 | |
| At the end for the period | | | 13,461,967 | | | | 7,247,184 | | | | 13,461,967 | | | | 7,247,184 | |
| Increase in cash and cash equivalents, net | | | 4,876,397 | | | | (3,226,517 | ) | | | 6,626,910 | | | | 3,998,057 | |
APPENDIX 5 - EBITDA
| (R$ '000, except where otherwise indicated) | | 3Q21 | | | 3Q20 | | | 9M21 | | | 9M20 | |
| Net income | | | (959,375 | ) | | | (1,157,707 | ) | | | 6,322,065 | | | | (16,629,286 | ) |
| Net Financial Result | | | 7,765,377 | | | | 4,222,644 | | | | 6,689,914 | | | | 32,323,930 | |
| Income and Social Contribution Taxes | | | (2,193,460 | ) | | | (897,206 | ) | | | 413,981 | | | | (9,662,275 | ) |
| EBIT | | | 4,612,542 | | | | 2,167,731 | | | | 13,425,960 | | | | 6,032,369 | |
| Depreciation, Amortization and Depletion | | | 1,745,487 | | | | 1,653,560 | | | | 5,208,723 | | | | 5,011,119 | |
| EBITDA1 | | | 6,358,029 | | | | 3,821,291 | | | | 18,634,683 | | | | 11,043,488 | |
| EBITDA Margin | | | 59.1 | % | | | 51.2 | % | | | 63.2 | % | | | 49.2 | % |
| | | | | | | | | | | | | | | | | |
| Social actions and operating expenses COVID-19 | | | 214 | | | | 55.554 | | | | 23.910 | | | | 129.807 | |
| Fair Value Update - Biological Asset | | | - | | | | - | | | | (564.533 | ) | | | (173.733 | ) |
| Ibema goodwill write-off | | | - | | | | - | | | | 125 | | | | - | |
| Tax credits - exclusion of ICMS in the PIS and COFINS calculation basis | | | (53.534 | ) | | | - | | | | (368.965 | ) | | | - | |
| Transaction expenses with Fibria | | | - | | | | (4 | ) | | | - | | | | 933 | |
| Demobilization of machinery and equipment - FACEPA | | | - | | | | - | | | | - | | | | 199 | |
| PPA Effect (Write-Off) | | | - | | | | 12.806 | | | | - | | | | 21.043 | |
| Closing of the Mucuri Project | | | - | | | | 30.684 | | | | - | | | | 30.684 | |
| Equity | | | (29.459 | ) | | | (10.354 | ) | | | (119.823 | ) | | | (7.402 | ) |
| Expenses with ancillary obligations and termination of contracts | | | - | | | | (719 | ) | | | - | | | | 8.084 | |
| Write-off of advance for forestry development program | | | 2.586 | | | | - | | | | 2.700 | | | | - | |
| Provision - Tax on the transfer of real estate for the regularization of land acquired prior to 2015 | | | - | | | | - | | | | - | | | | 10.529 | |
| Provision - Complement of ICMS provision | | | - | | | | 3.387 | | | | - | | | | 13.872 | |
| Provision - Provision for loss of biological assets | | | 30.712 | | | | - | | | | 30.712 | | | | - | |
| Provision - ICMS credit loss | | | 8.789 | | | | (134.111 | ) | | | 31.923 | | | | (91.892 | ) |
| Reversal - Provision of development (Project Losango) | | | - | | | | - | | | | (9.138 | ) | | | - | |
| Income from the sale and disposal of property, plant and equipment and biological assets | | | (7.779 | ) | | | - | | | | (545.988 | ) | | | (1.093 | ) |
| Adjusted EBITDA | | | 6,309,558 | | | | 3,778,534 | | | | 17,115,606 | | | | 10,984,519 | |
| Adjusted EBITDA Margin | | | 58.6 | % | | | 50.6 | % | | | 58.0 | % | | | 48.9 | % |
1The Company's EBITDA is calculated in accordance with CVM Instruction 527 of October 4, 2012.
APPENDIX 6 - Segmented Income Statement
Segmented Financial Statement (R$ '000) | | 3Q21 | | | 3Q20 | |
| | | Pulp | | | Paper | | | Non Segmented | | | Total Consolidated | | | Pulp | | | Paper | | | Non Segmented | | | Total Consolidated | |
| Net Revenue | | | 9,100,292 | | | | 1,661,563 | | | | - | | | | 10,761,855 | | | | 6,168,354 | | | | 1,302,481 | | | | - | | | | 7,470,835 | |
| Cost of Goods Sold | | | (4,294,260 | ) | | | (1,005,651 | ) | | | - | | | | (5,299,911 | ) | | | (3,592,529 | ) | | | (881,465 | ) | | | - | | | | (4,473,994 | ) |
| Gross Profit | | | 4,806,032 | | | | 655,912 | | | | - | | | | 5,461,944 | | | | 2,575,825 | | | | 421,016 | | | | - | | | | 2,996,841 | |
| Gross Margin | | | 52.8 | % | | | 39.5 | % | | | - | | | | 50.8 | % | | | 41.8 | % | | | 32.3 | % | | | - | | | | 40.1 | % |
| | | | | | | | | | | | | | | | | | | | | | | | | | | | | | | | | |
| Operating Expense/Income | | | (672,144 | ) | | | (177,258 | ) | | | - | | | | (849,402 | ) | | | (635,221 | ) | | | (193,889 | ) | | | - | | | | (829,110 | ) |
| Selling Expenses | | | (446,938 | ) | | | (131,163 | ) | | | - | | | | (578,101 | ) | | | (427,581 | ) | | | (95,013 | ) | | | - | | | | (522,594 | ) |
| General and Administrative Expenses | | | (228,239 | ) | | | (91,351 | ) | | | - | | | | (319,590 | ) | | | (219,793 | ) | | | (92,942 | ) | | | - | | | | (312,735 | ) |
| Other Operating Income (Expenses) | | | (372 | ) | | | 19,202 | | | | - | | | | 18,830 | | | | (10,739 | ) | | | 6,604 | | | | - | | | | (4,135 | ) |
| Equity Equivalence | | | 3,405 | | | | 26,054 | | | | - | | | | 29,459 | | | | 22,892 | | | | (12,538 | ) | | | - | | | | 10,354 | |
| EBIT | | | 4,133,888 | | | | 478,654 | | | | - | | | | 4,612,542 | | | | 1,940,604 | | | | 227,127 | | | | - | | | | 2,167,731 | |
| | | | | | | | | | | | | | | | | | | | | | | | | | | | | | | | | |
Depreciation, Amortization & Depletion | | | 1,592,378 | | | | 153,109 | | | | - | | | | 1,745,487 | | | | 1,508,897 | | | | 144,663 | | | | - | | | | 1,653,560 | |
| | | | | | | | | | | | | | | | | | | | | | | | | | | | | | | | | |
| EBITDA | | | 5,726,266 | | | | 631,763 | | | | - | | | | 6,358,029 | | | | 3,449,501 | | | | 371,790 | | | | - | | | | 3,821,291 | |
| EBITDA Margin | | | 62.9 | % | | | 38.0 | % | | | - | | | | 59.1 | % | | | 55.9 | % | | | 28.5 | % | | | - | | | | 51.2 | % |
| | | | | | | | | | | | | | | | | | | | | | | | | | | | | | | | | |
| Adjusted EBITDA1 | | | 5,721,444 | | | | 588,114 | | | | - | | | | 6,309,558 | | | | 3,384,057 | | | | 394,477 | | | | - | | | | 3,778,534 | |
| Adjusted EBITDA Margin1 | | | 62.9 | % | | | 35.4 | % | | | - | | | | 58.6 | % | | | 54.9 | % | | | 30.3 | % | | | - | | | | 50.6 | % |
| | | | | | | | | | | | | | | | | | | | | | | | | | | | | | | | | |
| Net Financial Result | | | - | | | | - | | | | (7,765,377 | ) | | | (7,765,377 | ) | | | | | | | | | | | (4,222,644 | ) | | | (4,222,644 | ) |
| | | | | | | | | | | | | | | | | | | | | | | | | | | | | | | | | |
| Earnings Before Taxes | | | 4,133,892 | | | | 478,650 | | | | (7,765,377 | ) | | | (3,152,835 | ) | | | 1,940,604 | | | | 227,127 | | | | (4,222,644 | ) | | | (2,054,913 | ) |
| | | | | | | | | | | | | | | | | | | | | | | | | | | | | | | | | |
Income and Social Contribution Taxes | | | - | | | | - | | | | 2,193,460 | | | | 2,193,460 | | | | - | | | | - | | | | 897,206 | | | | 897,206 | |
| | | | | | | | | | | | | | | | | | | | | | | | | | | | | | | | | |
| Net Income (Loss) | | | 4,133,892 | | | | 478,650 | | | | (5,571,917 | ) | | | (959,375 | ) | | | 1,940,604 | | | | 227,127 | | | | (3,325,438 | ) | | | (1,157,707 | ) |
| Net Margin | | | 45.4 | % | | | 28.8 | % | | | - | | | | -8.9 | % | | | 31.5 | % | | | 17.4 | % | | | - | | | | -15.5 | % |
1Excluding non-recurring items.
Segmented Financial Statement (R$ '000) | | 9M21 | | | 9M20 | |
| | | Pulp | | | Paper | | | Non Segmented | | | Total Consolidated | | | Pulp | | | Paper | | | Non Segmented | | | Total Consolidated | |
| Net Revenue | | | 25,139,249 | | | | 4,356,211 | | | | - | | | | 29,495,460 | | | | 19,031,290 | | | | 3,416,011 | | | | - | | | | 22,447,301 | |
| Cost of Goods Sold | | | (12,200,038 | ) | | | (2,722,562 | ) | | | - | | | | (14,922,600 | ) | | | (11,839,056 | ) | | | (2,243,631 | ) | | | - | | | | (14,082,687 | ) |
| Gross Profit | | | 12,939,211 | | | | 1,633,649 | | | | - | | | | 14,572,860 | | | | 7,192,234 | | | | 1,172,380 | | | | - | | | | 8,364,614 | |
| Gross Margin | | | 51.5 | % | | | 37.5 | % | | | - | | | | 49.4 | % | | | 37.8 | % | | | 34.3 | % | | | - | | | | 37.3 | % |
| | | | | | | | | | | | | | | | | | | | | | | | | | | | | | | | | |
| Operating Expense/Income | | | (912,984 | ) | | | (233,916 | ) | | | - | | | | (1,146,900 | ) | | | (1,815,181 | ) | | | (517,064 | ) | | | - | | | | (2,332,245 | ) |
| Selling Expenses | | | (1,302,720 | ) | | | (354,081 | ) | | | - | | | | (1,656,801 | ) | | | (1,302,925 | ) | | | (281,703 | ) | | | - | | | | (1,584,628 | ) |
| General and Administrative Expenses | | | (760,691 | ) | | | (294,457 | ) | | | - | | | | (1,055,148 | ) | | | (680,019 | ) | | | (283,267 | ) | | | - | | | | (963,286 | ) |
| Other Operating Income (Expenses) | | | 1,070,754 | | | | 374,472 | | | | - | | | | 1,445,226 | | | | 159,473 | | | | 48,794 | | | | - | | | | 208,267 | |
| Equity Equivalence | | | 79,673 | | | | 40,150 | | | | - | | | | 119,823 | | | | 8,290 | | | | (888 | ) | | | - | | | | 7,402 | |
| EBIT | | | 12,026,227 | | | | 1,399,733 | | | | - | | | | 13,425,960 | | | | 5,377,053 | | | | 655,316 | | | | - | | | | 6,032,369 | |
| | | | | | | | | | | | | | | | | | | | | | | | | | | | | | | | | |
Depreciation, Amortization & Depletion | | | 4,772,011 | | | | 436,712 | | | | - | | | | 5,208,723 | | | | 4,635,402 | | | | 375,717 | | | | - | | | | 5,011,119 | |
| | | | | | | | | | | | | | | | | | | | | | | | | | | | | | | | | |
| EBITDA | | | 16,798,238 | | | | 1,836,445 | | | | - | | | | 18,634,683 | | | | 10,012,455 | | | | 1,031,033 | | | | - | | | | 11,043,488 | |
| EBITDA Margin | | | 66.8 | % | | | 42.2 | % | | | - | | | | 63.2 | % | | | 52.6 | % | | | 30.2 | % | | | - | | | | 49.2 | % |
| | | | | | | | | | | | | | | | | | | | | | | | | | | | | | | | | |
| Adjusted EBITDA1 | | | 15,683,584 | | | | 1,432,022 | | | | - | | | | 17,115,606 | | | | 9,955,041 | | | | 1,029,478 | | | | - | | | | 10,984,519 | |
| Adjusted EBITDA Margin1 | | | 62.4 | % | | | 32.9 | % | | | - | | | | 58.0 | % | | | 52.3 | % | | | 30.1 | % | | | - | | | | 48.9 | % |
| | | | | | | | | | | | | | | | | | | | | | | | | | | | | | | | | |
| Net Financial Result | | | - | | | | - | | | | (6,689,914 | ) | | | (6,689,914 | ) | | | - | | | | - | | | | (32,323,930 | ) | | | (32,323,930 | ) |
| | | | | | | | | | | | | | | | | | | | | | | | | | | | | | | | | |
| Earnings Before Taxes | | | 12,026,227 | | | | 1,399,733 | | | | (6,689,914 | ) | | | 6,736,046 | | | | 5,377,053 | | | | 655,316 | | | | (32,323,930 | ) | | | (26,291,561 | ) |
| | | | | | | | | | | | | | | | | | | | | | | | | | | | | | | | | |
Income and Social Contribution Taxes | | | - | | | | - | | | | (413,981 | ) | | | (413,981 | ) | | | - | | | | - | | | | 9,662,275 | | | | 9,662,275 | |
| | | | | | | | | | | | | | | | | | | | | | | | | | | | | | | | | |
| Net Income (Loss) | | | 12,026,227 | | | | 1,399,733 | | | | (7,103,895 | ) | | | 6,322,065 | | | | 5,377,053 | | | | 655,316 | | | | (22,661,655 | ) | | | (16,629,286 | ) |
| Net Margin | | | 47.8 | % | | | 32.1 | % | | | - | | | | 21.4 | % | | | 28.3 | % | | | 19.2 | % | | | - | | | | -74.1 | % |