Exhibit 99.1

New quarterly EBITDA record contributes
for highest EBITDA in history in 2021
Leverage down to 2.4x, lowest level post-merger
São Paulo, February 9, 2022. Suzano S.A. (B3: SUZB3 | NYSE: SUZ), one of the world’s largest integrated pulp and paper producers, announces today its consolidated results for the 4th quarter of 2021 (4Q21).
HIGHLIGHTS
| · | Pulp sales of 2,722 thousand tons (+2% vs. 4Q20). |
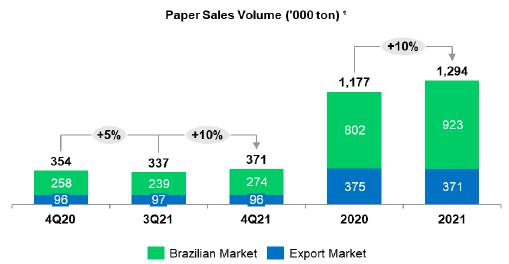
| · | Paper sales of 371 thousand tons (+5% vs. 4Q20). |
| · | Adjusted EBITDA1 and Operating cash generation²: R$6.4 billion and R$4.8 billion, respectively. |
| · | Adjusted EBITDA1/ton from pulp of R$2,114/ton (+59% vs. 4Q20). |
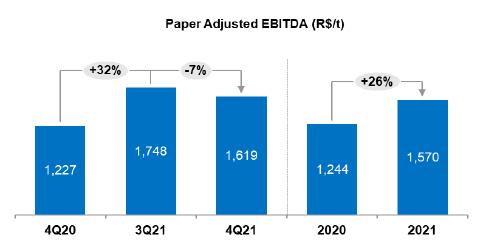
| · | Adjusted EBITDA1/ton3 from paper of R$1,619/ton (+32% vs. 4Q20). |
| · | Average net pulp price in export market: US$630/ton (+38% vs. 4Q20). |
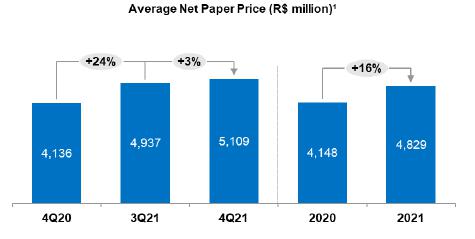
| · | Average net paper price3 of R$5,109/ton (+24% vs. 4Q20). |
| · | Pulp cash cost ex-downtime of R$747/ton (+20% vs. 4Q20). |
| · | Leverage down to 2.4 times in USD and 2.5 times in BRL. |
| Financial Data (R$ million) | 4Q21 | 3Q21 | Δ Q-o-Q | 4Q20 | Δ Y-o-Y | 2021 | 2020 | Δ Y-o-Y | ||||||||||||||||||||||||
| Net Revenue | 11,470 | 10,762 | 7 | % | 8,013 | 43 | % | 40,965 | 30,460 | 34 | % | |||||||||||||||||||||
| Adjusted EBITDA1 | 6,355 | 6,310 | 1 | % | 3,965 | 60 | % | 23,471 | 14,949 | 57 | % | |||||||||||||||||||||
| Adjusted EBITDA Margin1 | 55 | % | 59 | % | -3 p.p. | 49 | % | 6 p.p. | 57 | % | 49 | % | 8 p.p. | |||||||||||||||||||
| Net Financial Result | (2,657 | ) | (7,765 | ) | -66 | % | 6,238 | - | (9,347 | ) | (26,086 | ) | -64 | % | ||||||||||||||||||
| Net Income | 2,313 | (959 | ) | - | 5,914 | -61 | % | 8,636 | (10,715 | ) | - | |||||||||||||||||||||
| Operating Cash Generation2 | 4,809 | 5,204 | -8 | % | 2,981 | 61 | % | 18,819 | 11,543 | 63 | % | |||||||||||||||||||||
| Net Debt /Adjusted EBITDA1 (x) - R$ | 2.5 x | 2.8 x | -0,3 x | 4.3 x | -1.8 x | 2.5 x | 4.3 x | -1.8 x | ||||||||||||||||||||||||
| Net Debt /Adjusted EBITDA1 (x) - US$ | 2.4 x | 2.7 x | -0,3 x | 4.2 x | -1.8 x | 2.4 x | 4.2 x | -1.8 x | ||||||||||||||||||||||||
| Operational Data ('000 tons) | 4Q21 | 3Q21 | Δ Q-o-Q | 4Q20 | Δ Y-o-Y | 2021 | 2020 | Δ Y-o-Y | ||||||||||||||||||||||||
| Sales | 3,093 | 3,010 | 3 | % | 3,017 | 3 | % | 11,880 | 12,000 | -1 | % | |||||||||||||||||||||
| Pulp | 2,722 | 2,673 | 2 | % | 2,663 | 2 | % | 10,586 | 10,823 | -2 | % | |||||||||||||||||||||
| Paper3 | 371 | 336 | 10 | % | 354 | 5 | % | 1,294 | 1,177 | 10 | % | |||||||||||||||||||||
1Excluding non-recurring items. | 2Considers Adjusted EBITDA less sustaining capex (cash basis). | 3Considers the results of the Consumer Goods Unit.


The consolidated financial statements were prepared in accordance with the standards of the Securities and Exchange Commission of Brazil (CVM) and the Accounting Pronouncements Committee (CPC) and comply with the International Financial Reporting Standards (IFRS) issued by the International Accounting Standards Board (IASB). The operational and financial information is presented on a consolidated basis and in Brazilian real (R$). Note that the numbers may present discrepancies due to rounding. Non-financial data such as volume, quantity, average price and average quote in Brazilian real and U.S. dollar were not reviewed by independent auditors.
CONTENTS
| EXECUTIVE SUMMARY | 3 |
| PULP BUSINESS PERFORMANCE | 3 |
| PULP SALES VOLUME AND REVENUE | 3 |
| PULP CASH COST | 5 |
| PULP SEGMENT EBITDA | 7 |
| OPERATING CASH FLOW FROM THE PULP SEGMENT | 8 |
| PAPER BUSINESS PERFORMANCE | 9 |
| PAPER SALES VOLUME AND REVENUE¹ | 9 |
| OPERATING CASH FLOW FROM THE PAPER SEGMENT | 12 |
| FINANCIAL PERFORMANCE | 12 |
| NET REVENUE | 12 |
| CALENDAR OF SCHEDULED MAINTENANCE DOWNTIMES | 13 |
| COST OF GOODS SOLD | 13 |
| SELLING EXPENSES | 13 |
| GENERAL AND ADMINISTRATIVE EXPENSES | 14 |
| ADJUSTED EBITDA | 14 |
| FINANCIAL RESULT | 15 |
| DERIVATIVE OPERATIONS | 16 |
| NET INCOME (LOSS) | 19 |
| DEBT | 19 |
| CAPITAL EXPENDITURE | 21 |
| CERRADO PROJECT | 21 |
| OPERATING CASH GENERATION | 22 |
| FREE CASH FLOW | 22 |
| NET DEBT EVOLUTION (R$ million) | 23 |
| COVID-19 | 23 |
| ESG | 25 |
| TOTAL OPERATIONAL EXPENDITURE - PULP | 25 |
| EVENTS SUBSEQUENT TO THE REPORTING PERIOD | 25 |
| CAPITAL MARKETS | 26 |
| FIXED INCOME | 27 |
| RATINGS | 27 |
| UPCOMING EVENTS | 28 |
| IR CONTACTS | 28 |
| APPENDICES | 29 |
| APPENDIX 1 - Operating Data | 29 |
| APPENDIX 2 – Consolidated Statement of Income and Goodwill Amortization | 31 |
| APPENDIX 3 – Consolidated Balance Sheet | 32 |
| APPENDIX 4 – Consolidated Statement of Cash Flow | 33 |
| APPENDIX 5 - EBITDA | 34 |
| APPENDIX 6 - Segmented Income Statement | 36 |
Page 2 of 36
EXECUTIVE SUMMARY
The year 2021 presented the best results in our history, marked by important advances in our strategy. In a context of logistical restrictions in global chains and low availability of pulp in the market, the significant recovery in pulp prices and the strong sales volume were characteristic throughout the year, which supported a 59% growth in the EBITDA of this segment in 2021, despite pressure on the cash cost of production, largely affected by the global rise in commodity prices. In the paper segment, EBITDA was a record, driven by operational performance and a significant improvement in the business environment, despite higher costs.
With regard to financial management, throughout 2021 the Company reduced its net debt in USD by 15% and concluded the post-merger deleveraging cycle, ending the year with leverage of 2.4x in USD, measured by net debt/Adjusted EBITDA for the last twelve months. The significant drop in indebtedness associated with the increase in the liquidity position further strengthens Suzano's solid balance sheet for the new investment cycle related to the Cerrado Project, approved by the Board of Directors in October. The new plant will have a nominal capacity of 2.55 million tons, with an estimated start-up in the second half of 2024.
Regarding the ESG agenda, important advances continued to be made in the fourth quarter of the year, such as the Company's announcement of anticipating the carbon sequestration target of 40 million tons by 2025, previously scheduled for 2030. Still on this topic, Suzano actively participated in the 26th Conference of the United Nations on Climate Change in Glasgow, dedicating itself to contributing to discussions on various topics associated with the climate emergency. It is also worth mentioning the performance obtained in the CDP (Carbon Disclosure Project), in which Suzano advanced to an “A-“ grade in the 3 assessments (Water, Forest and Climate). In addition, Suzano was once again selected for the B3 Corporate Sustainability Index (ISE), which today includes 34 companies.
PULP BUSINESS PERFORMANCE
PULP SALES VOLUME AND REVENUE
The final quarter of the year witnessed strong global demand for pulp. In Europe and North America, demand for pulp was driven by solid performance by the paper segments. Tissue paper consumption followed the trend of recovery seen in 3Q21. The Printing and Writing segment remained buoyant on account of lower supply, since the ongoing global logistics crisis restricted imports, followed by an economic recovery by the demand. In China, after energy restrictions that affected the industry in September and October, paper production recovered, which, combined with the usual restocking ahead of the Chinese New Year and this year the Beijing Winter Olympics, reflected the recovery in prices since late November.
On the supply side, the increase in production resulting from new pulp projects, although below expectations, combined with the slowdown of the Chinese economy, had a negative effect on the price environment during the first half of the quarter. However, a scenario of unscheduled downtimes associated with even more challenging logistics chain contributed to a price recovery from the end of November. In Europe, the balance between supply and demand remained stable during the quarter. In this scenario, the PIX/FOEX indices for hardwood pulp decreased 13% in the Chinese market but remained stable at record-high levels in Europe compared to the previous quarter.
Moreover, the elevated gap between softwood and hardwood pulp prices continued, which encouraged the substitution of fibers. According to PIX/FOEX, the difference between softwood and hardwood pulp prices at the end of the quarter was US$120/t in Europe and US$179/t in China.
In this scenario, Suzano’s pulp sales totaled 2,722 thousand tons, up 2% from 3Q21 and 4Q20.
Page 3 of 36

Average net price in USD of pulp sold by Suzano was US$630/t, down 3% from 3Q21, while PIX/FOEX in China declined 13% during the period. Compared to 4Q20, the 38% increase was due to the upsurge in international pulp prices. Average net price in the export market was US$630/t (compared to US$654/t in 3Q21 and US$459/t in 4Q20).
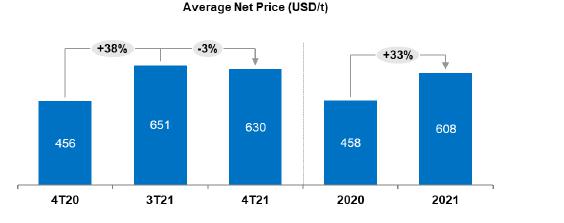
Average net price in BRL was R$3,517/ton in 4Q21, increasing 3% from 3Q21, due to the 7% increase in average USD against BRL. Compared to the same period the previous year, average net price increased 43%, following the trend in international market prices.
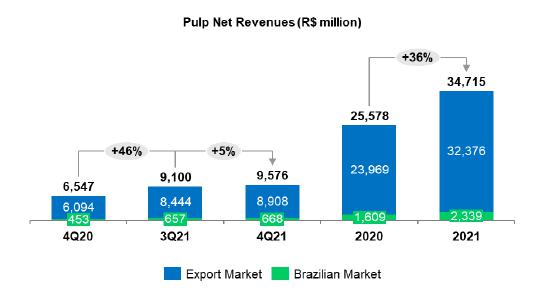
Net revenue from pulp increased 5% from 3Q21, due to the appreciation of average USD against BRL (7%) and higher sales (+2%), partially offset by lower net price in USD (-3%). Compared to 4Q20, revenue increased 46% due to better price in USD (+38%), the 2% growth in sales volume and average USD appreciation against the BRL of 3%.
Page 4 of 36
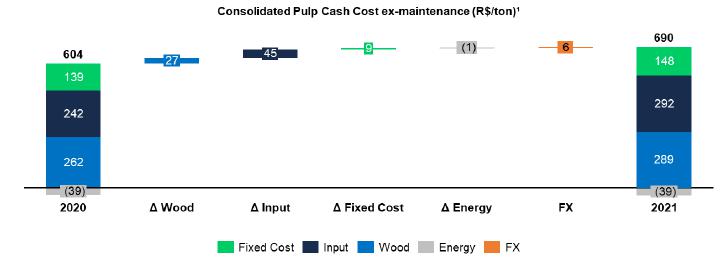
PULP CASH COST

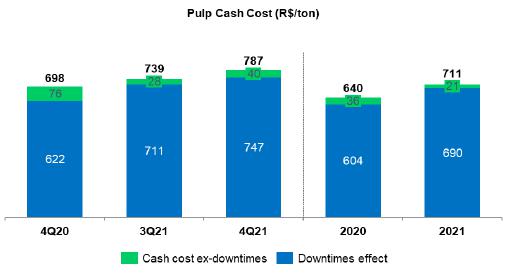
Cash cost excluding downtime in 4Q21 came to R$747/t, 5% higher than in 3Q21, due to: i) higher input costs, mainly on account of higher prices of chemicals (especially of caustic soda as a result of the increase in international prices and dioxide due to higher energy charges) and the impact of Brent energy prices (especially natural gas); and ii) the increase in wood costs on account of higher transport costs, largely caused by the hike in diesel prices. These effects were partially offset by better results from utilities due to the auction of additional energy offered to the electricity grid on account of the water crisis. Suzano benefited from its strategy in the energy market in a context of water crisis, with a greater impact on cash costs compared to the previous quarter.
Page 5 of 36
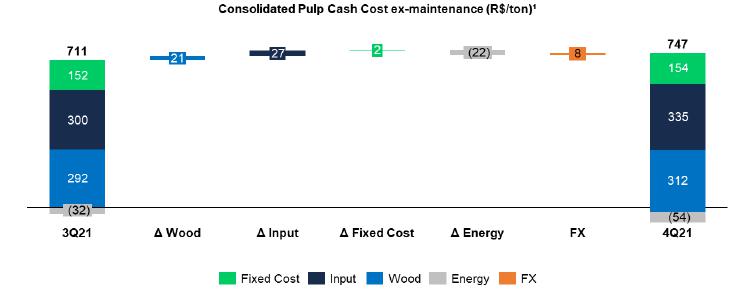
1Excludes the impact of maintenance and administrative downtimes.
Cash cost excluding downtime in 4Q21 was 20% higher than in 4Q20, due to: i) the increase in input costs on account of higher energy prices (natural gas, and oil due to the rise in Brent prices), higher prices of chemicals (especially caustic soda due to the increase in international prices and chlorine dioxide due to the increase in energy costs) and higher expenses with packaging caused by the increase in steel prices; ii) higher wood costs resulting from higher diesel prices, which affected harvest and transportation; and iii) the increase in fixed costs due to the recognition of the impact of the COVID-19 pandemic, which was previously booked directly in COGS. These effects were partially offset by better results from utilities, as previously mentioned.

1Excludes the impact of maintenance and administrative downtimes.
Page 6 of 36
Cash cost excluding downtime in 2021 was 14% higher than in 2020, due to higher costs of chemicals and energy inputs and wood, as well as fixed costs.
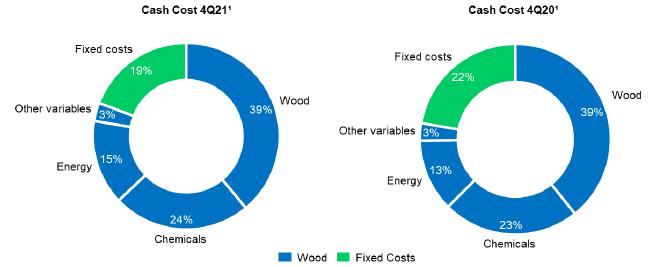
1Based on cash cost excluding downtimes. Excludes energy sales.
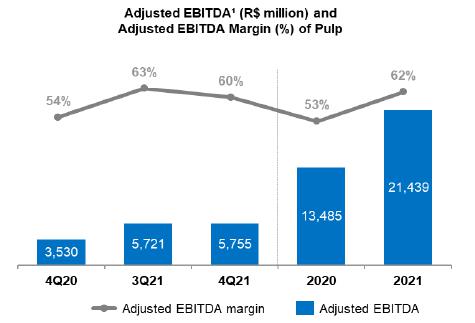
PULP SEGMENT EBITDA
| Pulp segment | 4Q21 | 3Q21 | Δ Q-o-Q | 4Q20 | Δ Y-o-Y | 2021 | 2020 | Δ Y-o-Y | ||||||||||||||||||||||||
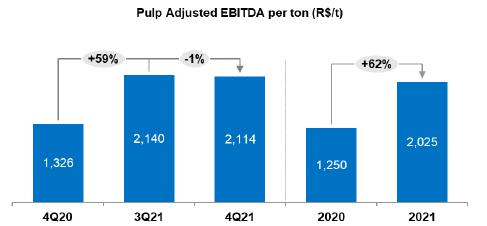
| Adjusted EBITDA (R$ million)1 | 5,755 | 5,721 | 1 | % | 3,530 | 63 | % | 21,439 | 13,485 | 59 | % | |||||||||||||||||||||
| Sales volume (k ton) | 2,722 | 2,673 | 2 | % | 2,663 | 2 | % | 10,586 | 10,785 | -2 | % | |||||||||||||||||||||
| Pulp adjusted¹ EBITDA (R$/ton) | 2,114 | 2,140 | -1 | % | 1,326 | 59 | % | 2,025 | 1,250 | 62 | % | |||||||||||||||||||||
1Excludes non-recurring items.
Adjusted EBITDA from pulp remained stable in relation to 3Q21. The positive effects of higher average USD versus BRL (7%) and higher sales volume (2%) were offset by: i) lower average net price in USD (-3%); ii) higher cash COGS (higher cost of production, mainly due to the increase in commodity prices linked to raw materials, scheduled maintenance downtimes, higher volume and logistics costs, in turn due to FX and higher Brent); and iii) higher SG&A expenses, caused by the increase in selling expenses (due to higher Brent and logistics tariffs overseas, given the unfavorable scenario, exchange rate effect and higher sales volume) and in administrative expenses, which resulted from the increase in personnel expenses (variable compensation) and third-party services. The 1% decline in adjusted EBITDA per ton is due to the lower average net price, the increase in cash COGS and higher SG&A expenses, which were partially offset by the exchange rate effect.
Compared to 4Q20, the 63% increase in Adjusted EBITDA from pulp is mainly due to the 38% increase in average net price in USD, higher sales volume (+2%) and average USD appreciation vs. the BRL (+3%), partially offset by higher cash COGS (higher cost of production and increase in logistics costs, the latter linked to the increase in commodity prices – Brent and higher sales volume). Adjusted EBITDA per ton increased 59% on account of the price factor but was partially offset by the increase in cash COGS and the exchange rate effect.
Page 7 of 36
1Excluding non-recurring items.
OPERATING CASH FLOW FROM THE PULP SEGMENT
Operating cash flow - Pulp (R$ million) | 4Q21 | 3Q21 | Δ Q-o-Q | 4Q20 | Δ Y-o-Y | 2021 | 2020 | Δ Y-o-Y | ||||||||||||||||||||||||
| Adjusted EBITDA1 | 5,755 | 5,721 | 1 | % | 3,530 | 63 | % | 21,439 | 13,485 | 59 | % | |||||||||||||||||||||
| Maintenance Capex2 | (1,417 | ) | (1,025 | ) | 38 | % | (894 | ) | 59 | % | (4,315 | ) | (3,124 | ) | 38 | % | ||||||||||||||||
| Operating Cash Flow | 4,338 | 4,696 | -8 | % | 2,636 | 65 | % | 17,124 | 10,361 | 65 | % |
1Excluding non-recurring items.
2Cash basis.
Page 8 of 36
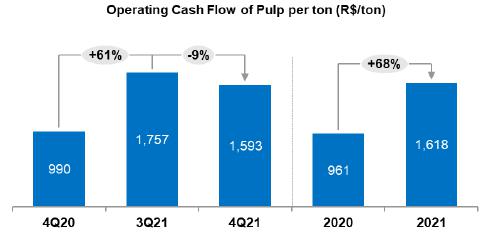
Operating cash flow per ton in the pulp segment was 9% lower than in 3Q21, due to higher sustaining capex. Compared to 4Q20, the 61% increase is due to higher adjusted EBITDA per ton.
PAPER BUSINESS PERFORMANCE
The following data and analyses incorporate the joint results of the consumer goods and paper businesses.
PAPER SALES VOLUME AND REVENUE¹
The 2021 scenario demonstrated that the recovery in demand occurred in parallel with the evolution of vaccination that led to the return to schools, offices, in addition to other face-to-face activities. Additionally, due to logistical bottlenecks faced throughout the year, which caused restrictions in the supply of paper, there was pressure on logistical costs, as well as considerable increases in electricity and inputs. The combination of these factors led to increases in paper prices in the international and domestic markets.
According to data published by Brazil's Forestry Industry Association (IBÁ), demand for printing and writing in Brazil grew 6% compared to 4Q20. Comparing 2021 with 2020, paper demand for printing and writing increased 19% across Brazil.
It is estimated that in 4Q21, around 7% of total demand from the printing and writing segment was destined for sales to the cardboard packaging industry. However, in 2022, with the regularization of the supply of wood shavings in the market, there are uncertainties about the continuation of this use for the printing and writing paper line.
Without this application, domestic sales in the printing and writing segment in Brazil should have grown 8% in 2021 compared to 2020. In 4Q21 is expected to be stable in comparison with the 4Q20.
Demand for paperboard in Brazil grew 10% in 2021 compared to the previous year, while the comparison between 4Q21 and 4Q20, there was a 6% reduction, due to the comparison with a period of very high demand in 2020.
Consolidating both market segments (Suzano's accessible paper market), demand grew 16% in 2021 vs. 2020 and by 2% when comparing 4Q21 with the same period of the previous year.
Suzano's paper sales (printing and writing, paperboard and tissue) in the domestic market totaled 274 thousand tons in 4Q21, an increase of 15% from 3Q21 and 6% from 4Q20.
Paper sales in the international markets totaled 96 thousand tons, down 1% from 3Q21 but remaining stable in relation to 4Q20, and accounting for 26% of total sales in 4Q21.
Driven by the gradual economic recovery and favorable seasonality effects during the period in the domestic market, total paper sales in 4Q21 grew 10% in relation to 3Q21. In relation to 4Q20, total paper sales grew 5%.
Page 9 of 36
1Includes the Consumer Goods Unit.
Average net price rose 3% from the previous quarter, marked by increases in the international market, despite the seasonality of the I&E segment, due to the greater mix destined to fulfill orders from the National Textbook Program (PNLD). In relation to 4Q20, the 24% increase was caused by price increases in the domestic and international markets across all segments.
Net revenue from paper1 was R$1,894 million in 4Q21, an increase of 14% from 3Q21, resulting from the price increase and by higher sales volume. In relation to 4Q20, net revenue from paper grew 29% due to higher prices in both the domestic and international markets.

1Includes the Consumer Goods Unit.
Page 10 of 36
PAPER SEGMENT EBITDA
| Paper segment | 4Q21 | 3Q21 | Δ Q-o-Q | 4Q20 | Δ Y-o-Y | 2021 | 2020 | Δ Y-o-Y | ||||||||||||||||||||||||
| Adjusted EBITDA (R$ million)1 | 600 | 588 | 2 | % | 435 | 38 | % | 2,032 | 1,465 | 39 | % | |||||||||||||||||||||
| Sales volume (k ton) | 371 | 336 | 10 | % | 354 | 5 | % | 1,294 | 1,177 | 10 | % | |||||||||||||||||||||
| Paper adjusted1 EBITDA (R$/ton) | 1,619 | 1,748 | -7 | % | 1,227 | 32 | % | 1,570 | 1,244 | 26 | % | |||||||||||||||||||||
1Excludes non-recurring items.
Adjusted EBITDA from paper increased 2% from 3Q21, mainly resulting from higher sales volume and price increases in international markets. Compared to 4Q20, adjusted EBITDA from paper increased 38%, mainly due to price increases across all product lines.
Adjusted EBITDA per ton declined 7%, mainly due to higher logistics and industrial costs, including the general downtime at the Suzano mill. This effect was partially offset by higher export market prices in 4Q21.

Page 11 of 36
OPERATING CASH FLOW FROM THE PAPER SEGMENT
Operating cash flow - Paper (R$ million) | 4Q21 | 3Q21 | Δ Q-o-Q | 4Q20 | Δ Y-o-Y | 2021 | 2020 | Δ Y-o-Y | ||||||||||||||||||||||||
| Adjusted EBITDA1 | 600 | 588 | 2 | % | 435 | 38 | % | 2,032 | 1,465 | 39 | % | |||||||||||||||||||||
| Maintenance Capex2 | (129 | ) | (80 | ) | 61 | % | (90 | ) | 43 | % | (336 | ) | (282 | ) | 19 | % | ||||||||||||||||
| Operating Cash Flow | 471 | 508 | -7 | % | 345 | 37 | % | 1,696 | 1,183 | 43 | % | |||||||||||||||||||||
1Excludes non-recurring items.
2Cash basis.
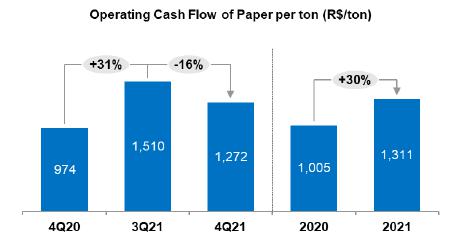
Operating cash generation per ton in the paper segment was R$1,272/t in 4Q21, down 16% from 3Q21, due to higher Capex. In relation to 4Q20, the indicator was up 31%, driven by EBITDA growth.
FINANCIAL PERFORMANCE
NET REVENUE
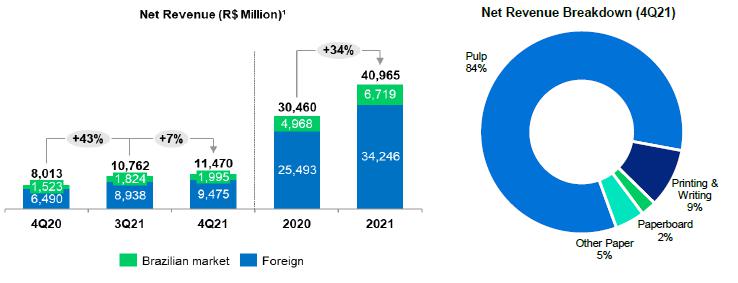
Suzano’s net revenue in 4Q21 was R$11,470 million, 83% of which came from exports (vs. 83% in 3Q21 and 81% in 4Q20). Compared to 3Q21, the 7% growth in net revenue was due to the 7% appreciation of average USD versus BRL and higher sales volume (+3%), which was partially offset by the lower net average price of pulp. The 43% growth in consolidated net revenue compared to 4Q20 was driven by higher average net price of pulp in USD and of paper, the exchange rate effect (+3%) and growth in sales volume (+3%).
1Does not include Portocel service revenue.
Page 12 of 36
CALENDAR OF SCHEDULED MAINTENANCE DOWNTIMES
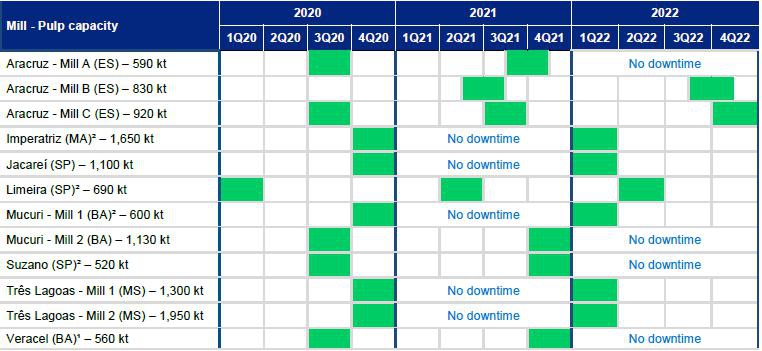
1Veracel is a joint operation between Suzano (50%) and Stora Enso (50%) with total annual capacity of 1,120 thousand tons.
2Includes integrated capacities and fluff.
COST OF GOODS SOLD
| COGS (R$ million) | 4Q21 | 3Q21 | Δ Q-o-Q | 4Q20 | Δ Y-o-Y | 2021 | 2020 | Δ Y-o-Y | ||||||||||||||||||||||||
| COGS (Income statement) | 5,693 | 5,300 | 7 | % | 4,884 | 17 | % | 20,616 | 18,966 | 9 | % | |||||||||||||||||||||
| Depreciation, depletion and amortization | 1,568 | 1,482 | 6 | % | 1,531 | 2 | % | 5,988 | 5,773 | 4 | % | |||||||||||||||||||||
| Cash COGS | 4,125 | 3,818 | 8 | % | 3,353 | 23 | % | 14,628 | 13,193 | 11 | % | |||||||||||||||||||||
| Sales volume | 3,093 | 3,010 | 3 | % | 3,017 | 3 | % | 11,880 | 12,000 | -1 | % | |||||||||||||||||||||
| Cash COGS/ton (R$/ton) | 1,333 | 1,269 | 5 | % | 1,111 | 20 | % | 1,231 | 1,099 | 12 | % | |||||||||||||||||||||
Cash COGS in 4Q21 totaled R$4,125 million, or R$1,333/ton. Compared to 3Q21, cash COGS increased 8%, chiefly due to: i) the higher cost of production, as mentioned earlier, including the greater impact from scheduled maintenance downtimes; ii) the increase in sales volume (+3%); (ii) the increase in average USD versus BRL; and iv) higher logistics costs on account of higher Brent prices. COGS per ton increased 5% due to the higher production and logistics costs (Brent), as well as the impact of downtimes, the exchange rate effect and logistics costs.
Compared to 3Q20, cash COGS increased 23%, chiefly due to the higher cash cost of production, higher Brent which affected logistics costs and higher sales volume (+3%). In relation to the same period last year, cash COGS per ton increased 20% due to the factors mentioned above.
SELLING EXPENSES
| Selling expenses (R$ million) | 4Q21 | 3Q21 | Δ Q-o-Q | 4Q20 | Δ Y-o-Y | 2021 | 2020 | Δ Y-o-Y | ||||||||||||||||||||||||
| Selling expenses (Income Statement) | 635 | 578 | 10 | % | 590 | 8 | % | 2,292 | 2,175 | 5 | % | |||||||||||||||||||||
| Depreciation, depletion and amortization | 237 | 237 | 0 | % | 205 | 16 | % | 944 | 906 | 4 | % | |||||||||||||||||||||
| Cash selling expenses | 398 | 341 | 17 | % | 385 | 3 | % | 1,348 | 1,269 | 6 | % | |||||||||||||||||||||
| Sales volume | 3,093 | 3,010 | 3 | % | 3,017 | 3 | % | 11,880 | 12,000 | -1 | % | |||||||||||||||||||||
| Cash selling expenses/ton (R$/ton) | 129 | 113 | 14 | % | 128 | 1 | % | 114 | 106 | 8 | % | |||||||||||||||||||||
Page 13 of 36
Cash selling expenses increased 17% in relation to 3Q21, mainly due to the increase in inland logistics expenses (Brent prices increase and higher logistics tariffs overseas, given the unfavorable scenario), increase in average USD against BRL (+7%) and growth in sales volume (+3%). Cash selling expenses per ton increased 14% mainly due to higher logistics expenses and the exchange rate effect, as mentioned above.
Compared to 4Q20, the 3% increase in cash selling expenses is mainly due to the increase in inland logistics expenses (Brent and higher logistics tariffs overseas, given the unfavorable scenario), higher sales volume (+3%) and appreciation of the average USD vs the BRL (+3%). Cash selling expenses per ton increased 1% due to the logistics effects mentioned above and the exchange rate effect.
GENERAL AND ADMINISTRATIVE EXPENSES
| General and Administrative Expenses (R$ million) | 4Q21 | 3Q21 | Δ Q-o-Q | 4Q20 | Δ Y-o-Y | 2021 | 2020 | Δ Y-o-Y | ||||||||||||||||
| General and Administrative Expenses | 523 | 320 | 64 | % | 480 | 9 | % | 1,578 | 1,443 | 9 | % | |||||||||||||
| Depreciation, depletion and amortization | 27 | 25 | 5 | % | 24 | 10 | % | 104 | 78 | 33 | % | |||||||||||||
| Cash general and administrative expenses | 496 | 294 | 69 | % | 456 | 9 | % | 1,474 | 1,365 | 8 | % | |||||||||||||
| Sales volume | 3,093 | 3,010 | 3 | % | 3,017 | 3 | % | 11,880 | 12,000 | -1 | % | |||||||||||||
| Cash general and administrative expenses/t (R$/ton) | 160 | 98 | 64 | % | 151 | 6 | % | 124 | 114 | 9 | % |
Compared to 3Q21, the 69% increase in cash general and administrative expenses is mainly due to higher personnel expenses (variable compensation) and third-party services. On a per-ton basis, these expenses increased 64% due to the same factors.
Compared to 4Q20, cash general and administrative expenses increased 9%, mainly due to higher expenses related to COVID-19 and to personnel expenses (despite the lower expenses with variable compensation). On a per-ton basis, the 6% increase is explained by the same factors.
Other operating income (expenses) amounted to an income of R$203 million in 4Q21, compared to R$19 million in 3Q21 and R$323 million in 4Q20. The increase in relation to 3Q21 is mainly due to the updated fair value of biological assets (which happens in the second and fourth quarters of each year). Compared to 4Q20, the decrease is mainly due to the above sales result and the lower impact of the updated fair value of biological assets, partially offset by the recognition of tax credits related to the right to exclude ICMS from the calculation basis of contributions to PIS and COFINS.
ADJUSTED EBITDA
| Consolidated | 4Q21 | 3Q21 | Δ Q-o-Q | 4Q20 | Δ Y-o-Y | 2021 | 2020 | Δ Y-o-Y | ||||||||||||||||
| Adjusted EBITDA (R$ million)1 | 6,355 | 6,310 | 1 | % | 3,965 | 60 | % | 23,471 | 14,949 | 57 | % | |||||||||||||
| Adjusted EBITDA1 Margin | 55 | % | 59 | % | -3 p.p. | 49 | % | 6 p.p. | 57 | % | 49 | % | 8 p.p. | |||||||||||
| Sales Volume (k ton) | 3,093 | 3,010 | 3 | % | 3,017 | 3 | % | 11,880 | 11,962 | -1 | % | |||||||||||||
| Consolidated Adjusted EBITDA1 (R$/ton) | 2,055 | 2,097 | -2 | % | 1,314 | 56 | % | 1,976 | 1,250 | 5 | % |
1Excludes non-recurring items.
The 1% increase in Adjusted EBITDA in 4Q21 compared to 3Q21 is due to the 7% increase in average USD versus BRL and the growth in sales volume. These factors were partially offset by the increase in cash COGS per ton, the decline in average net price of pulp in USD and higher SG&A expenses, as mentioned earlier. Adjusted EBITDA per ton fell 2% due to the cost factor, lower price of pulp and higher SG&A expenses.
Compared to 4Q20, the 60% increase in Adjusted EBITDA was due to higher net average price of pulp in USD (+38%), average USD appreciation vs. the BRL (+3%) and sales growth, which was partially offset by the increase in cash COGS per ton. Adjusted EBITDA per ton increased 56% mainly due to the price factor and was partially offset by higher cash COGS per ton, as explained previously.
Page 14 of 36
FINANCIAL RESULT
| Financial Result (R$ million) | 4Q21 | 3Q21 | Δ Q-o-Q | 4Q20 | Δ Y-o-Y | 2021 | 2020 | Δ Y-o-Y | ||||||||||||||||
| Financial Expenses | (1,085 | ) | (1,213 | ) | -10 | % | (974 | ) | 11 | % | (4,221 | ) | (4,459 | ) | -5 | % | ||||||||
| Interest on loans and financing (local currency) | (241 | ) | (180 | ) | 34 | % | (169 | ) | 43 | % | (699 | ) | (774 | ) | -10 | % | ||||||||
| Interest on loans and financing (foreign currency) | (673 | ) | (619 | ) | 9 | % | (594 | ) | 13 | % | (2,508 | ) | (2,904 | ) | -14 | % | ||||||||
| Capitalized interest1 | 14 | 4 | 238 | % | 1 | - | 19 | 11 | 75 | % | ||||||||||||||
| Other financial expenses | (184 | ) | (418 | ) | -56 | % | (212 | ) | -13 | % | (1,033 | ) | (792 | ) | 30 | % | ||||||||
| Financial Income | 148 | 54 | 171 | % | 66 | 124 | % | 273 | 327 | -17 | % | |||||||||||||
| Interest on financial investments | 112 | 44 | 153 | % | 19 | 495 | % | 206 | 147 | 40 | % | |||||||||||||
| Other financial income | 36 | 10 | 251 | % | 47 | -24 | % | 67 | 181 | -63 | % | |||||||||||||
| Monetary and Exchange Variations | (1,412 | ) | (4,078 | ) | -65 | % | 4,464 | - | (3,801 | ) | (12,531 | ) | -70 | % | ||||||||||
| Foreign exchange variations (Debt) | (1,722 | ) | (5,191 | ) | -67 | % | 4,850 | - | (4,847 | ) | (13,365 | ) | -64 | % | ||||||||||
| Other foreign exchange variations | 310 | 1,113 | -72 | % | (387 | ) | - | 1,046 | 835 | 25 | % | |||||||||||||
| Derivative income (loss), net2 | (307 | ) | (2,529 | ) | -88 | % | 2,683 | - | (1,597 | ) | (9,423 | ) | -83 | % | ||||||||||
| Cash Flow hedge | (111 | ) | (1,077 | ) | -92 | % | 1,331 | - | (717 | ) | (3,169 | ) | -77 | % | ||||||||||
| Cerrado Project hedge | 27 | - | 100 | % | - | 100 | % | 27 | - | 100 | % | |||||||||||||
| Debt hedge | (38 | ) | (1,303 | ) | -97 | % | 1,430 | - | (511 | ) | (6,270 | ) | -92 | % | ||||||||||
| Others3 | (185 | ) | (149 | ) | 24 | % | (78 | ) | 138 | % | (396 | ) | 17 | - | ||||||||||
| Net Financial Result | (2,657 | ) | (7,765 | ) | -66 | % | 6,238 | - | (9,347 | ) | (26,086 | ) | -64 | % |
1 Capitalized interest due to work in progress.
2Variation in mark-to-market adjustment (4Q21: -R$6,452 million | 3Q21: -R$6,411 million), plus adjustments paid and received (4Q21 = -R$266 million).
3Includes commodity hedge and embedded derivatives.
Financial expenses in the fourth quarter were 10% lower than in 3Q21, mainly due to the reduction in other financial expenses, since the premium of R$227 million on the full repurchase of Senior Notes 2024 negatively affected the 3Q21 result. This reduction was partially offset by the increase in interest on loans in local and foreign currency, as a result of the increase in the CDI in the quarter (from 6.15% to 9.15%) and the issuance of US$500 million in Senior Notes 2028 that took place in September. In comparison to the 4Q20, the 11% increase can be explained by the effect of the increase in the CDI and IPCA indexes on interest on loans in local currency (CDI from 1.9% in 4Q20 to 7.6% in 4Q21 and IPCA from 0.8% in the fourth quarter of 2020 to 1.1% in 2021). The increase in the foreign currency interest line refers mainly to the issuances of Senior Notes 2028 (US$500 million) and Senior Notes 2032 (US$1 billion).
Financial income grew 171% and 124% in relation to 3Q21 and 4Q20, respectively, due to the increase in the Company’s cash position and higher CDI rates.
Inflation adjustment and exchange rate variation of debt had a negative impact of R$1,722 million on the Company’s financial result due to the 3% decline in BRL versus closing USD rate on the foreign currency portion. Note that the accounting impact of exchange variation on foreign currency debt will have a cash impact only on the respective maturities.
Derivative operations resulted in a loss of R$307 million in 4Q21, mainly due to the effect of weaker BRL on debt hedge and cash flow transactions, despite the positive impact caused by the variation in the Pre, Coupon and Libor curves of these operations and other derivatives (embedded derivatives and commodities). The mark-to-market adjustment of derivative instruments on December 31, 2021 was an expense of R$6,452 million, compared to an expense of R$6,411 million on September 30, 2021, representing a negative variation of R$41 million. Note that the impact of BRL depreciation on the derivatives portfolio generates a cash impact only upon the respective maturities. The net effect on cash, which refers to the maturity of derivative operations in the fourth quarter, was an expense of R$266 million (R$159 million related to debt hedge and R$107 million to operating and commodity hedge).
As a result of the above factors, net financial result in 4Q21, considering all financial expense and income lines, was an expense of R$2,657 million, compared to an expense of R$7,765 million in 3Q21 and an income of R$6,238 million in 4Q20.
Page 15 of 36
DERIVATIVE OPERATIONS
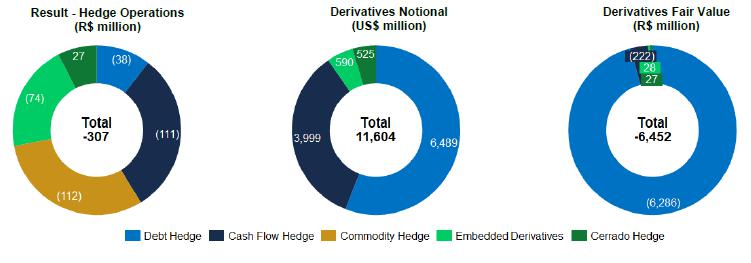
Suzano carries out derivative operations exclusively for hedging purposes. The following table reflects the position of derivative hedging instruments on December 31, 2021.
| Notional (US$ million) | Fair Value (R$ million) | |||||||||||||||
| Hedge1 | Dec/2021 | Sep/2021 | Dec/2021 | Sep/2021 | ||||||||||||
| Debt | 6,489 | 6,493 | (6,286 | ) | (6,407 | ) | ||||||||||
| Cash Flow | 3,999 | 3,733 | (222 | ) | (106 | ) | ||||||||||
| Cerrado project | 525 | 0 | 27 | - | ||||||||||||
| Others2 | 590 | 602 | 28 | 102 | ||||||||||||
| Total | 11,604 | 10,827 | (6,452 | ) | (6,411 | ) | ||||||||||
1See note 4 of the 4Q21 Quarterly Financial Statements (ITR) for further details and fair value sensitivity analysis.
2Hedging program referred to capex in BRL of the Cerrado Project.
3Includes commodity hedge and embedded derivatives.
The Company’s foreign exchange exposure policy seeks to minimize the volatility of its cash generation and to ensure greater flexibility in cash flow management. Currently, the policy stipulates that surplus dollars may be partially hedged (at least 40% and up to 75% of exchange variation exposure over the next 18 months) using plain vanilla instruments such as Zero Cost Collars (ZCC) and Non-Deliverable Forwards (NDF).
Considering the foreign exchange exposure related to the capital investment in the Cerrado Project, given that approximately 67% of CAPEX is pegged to local currency, the Board of Directors approved, on October 28, 2021, a program for contracting additional specific hedge operations to protect from such exposure. The approved program is provided for in the Derivatives Management Policy available on the Investor Relations website, has a maximum amount (notional) of up to 1 billion dollars and a term of operations of up to 36 months. In order to provide transparency on the Cerrado Project's hedging program, as of 4Q21, the Company will begin to prominently disclose the respective contracted operations.
ZCC transactions establish minimum and maximum limits for the exchange rate that minimize adverse effects in the event of significant appreciation of the BRL. As such, if the exchange rate is within such limits, the Company neither pays nor receives any financial adjustments. This characteristic allows for capturing greater benefits from export revenue in a potential scenario of USD appreciation versus BRL within the range contracted. Therefore, in cases of extreme BRL appreciation, the Company is protected by the minimum limits, which are considered appropriate for the operation. However, this protection instrument also limits, temporarily and partially, potential gains in scenarios of extreme BRL depreciation when exchange rates exceed the maximum limits contracted.
On December 31, 2021, the outstanding notional value of operations involving forward USD sales through ZCCs related to Cash Flows (including those related to the Cerrado Project) was US$4,494 million, with an average forward rate ranging from R$5.56 to R$6.61 and maturities distributed between January 2022 and August 2024. On the same date, the outstanding notional value of operations involving forward USD sales through NDFs was US$30 million, whose maturities are distributed in February 2022 and with an average rate of R$5.42. Cash Flow and Cerrado Project hedge operations in 4Q21 resulted in a loss of R$84 million. The mark-to-market adjustment (fair value) of ZCC transactions was a loss of R$188 million and for NDFs was a loss of R$7 million.
The following table presents a sensitivity analysis of the cash impact that the Company could have on its Cash Flow hedge portfolio (ZCC and NDF) if the exchange rate remains the same as at the end of 4Q21 (R$/US$ = 5.58) in the coming quarters, as well as the projected cash impact for R$0.10 variations above the strike of call options defined in each quarter. Note that the figures presented in the table are the Company’s projections based on the end-of-period curves and could vary depending on market conditions.
Page 16 of 36
| Cash Adjustment (R$ million) | ||||||||||||||||||||
Maturity (up to) | Strike Range | Notional (US$ million) | Actual | R$ / US$ = 5.58 (4Q21) | Sensitivity at R$ 0.10 / US$ variation (+/-)1 | |||||||||||||||
| Zero Cost Collars – Cash Flow | ||||||||||||||||||||
| 4Q21 | - | - | 5 | - | - | |||||||||||||||
| 1Q22 | 5.37 - 6.10 | 731 | - | 10 | (73 | ) | ||||||||||||||
| 2Q22 | 5.33 - 6.06 | 971 | - | 3 | (97 | ) | ||||||||||||||
| 3Q22 | 5.34 - 6.07 | 528 | - | 3 | (53 | ) | ||||||||||||||
| 4Q22 | 5.40 - 6.36 | 448 | - | 11 | (45 | ) | ||||||||||||||
| 1Q23 | 5.63 - 7.12 | 672 | - | 68 | (67 | ) | ||||||||||||||
| 2Q23 | 5.93 - 7.24 | 620 | - | 218 | (62 | ) | ||||||||||||||
| Total | 5.49 - 6.47 | 3,969 | 5 | 313 | (397 | ) | ||||||||||||||
| NDF – Cash Flow | ||||||||||||||||||||
| 4Q21 | - | - | - | - | - | |||||||||||||||
| 1Q22 | 5.42 | 30 | - | (5 | ) | (3 | ) | |||||||||||||
| Total | 5.42 | 30 | - | (5 | ) | (3 | ) | |||||||||||||
| Zero Cost Collars – Cerrado Project | ||||||||||||||||||||
| 4Q21 | - | - | - | - | - | |||||||||||||||
| 2Q23 | 5.93 - 7.39 | 97 | - | 33 | (10 | ) | ||||||||||||||
| 3Q23 | 6.00 - 7.60 | 205 | - | 87 | (21 | ) | ||||||||||||||
| 4Q23 | 6.12 - 7.74 | 144 | - | 78 | (14 | ) | ||||||||||||||
| 1Q24 | 6.30 - 7.91 | 36 | - | 26 | (4 | ) | ||||||||||||||
| 2Q24 | 6.37 - 8.05 | 34 | - | 27 | (3 | ) | ||||||||||||||
| 3Q24 | 6.35 - 8.34 | 9 | - | 7 | (1 | ) | ||||||||||||||
| Total | 6.07 - 7.66 | 525 | - | 258 | (53 | ) | ||||||||||||||
1Note: sensitivity of adjustments for exchange rates above the strike.
To mitigate the effects of exchange and interest rate variations on its debt and its cash flows, the Company also uses currency and interest rate swaps. Swap contracts are entered into considering different interest rates and inflation indices in order to mitigate the mismatch between financial assets and liabilities.
On December 31, 2021, the Company had an outstanding amount (notional value) of US$6,489 million in swap contracts as shown in the table below. In 4Q21, the result of debt hedge transactions was a loss of R$38 million, mainly due to the depreciation of BRL versus the USD in the period. The mark-to-market adjustment (fair value) of these operations was a loss of R$6,286 million.
| Notional (US$ million) | Fair Value (R$ million) | |||||||||||||||||||||||
| Debt Hedge | Maturity (up to) | Currency | Dec/2021 | Sep/2021 | Dec/2021 | Sep/2021 | ||||||||||||||||||
| Swap (PRÉ x USD) | 2024 | USD | 350 | 350 | (761 | ) | (734 | ) | ||||||||||||||||
| Swap (CDI x USD) | 2026 | USD | 2,267 | 2,267 | (5,231 | ) | (5,106 | ) | ||||||||||||||||
| Swap (IPCA x USD) | 2023 | USD | 121 | 121 | (149 | ) | (142 | ) | ||||||||||||||||
| Swap (LIBOR x USD) | 2027 | USD | 3,600 | 3,600 | (396 | ) | (681 | ) | ||||||||||||||||
| Swap (IPCA x CDI) | 2023 | BRL | 1511 | 155 | 250 | 256 | ||||||||||||||||||
| Total | 6,489 | 6,493 | (6,286 | ) | (6,407 | ) | ||||||||||||||||||
1Translated at the closing exchange rate (5.58).
The following table presents a sensitivity analysis1 of the cash impact that the Company could have on its debt hedge portfolio (swaps) if the exchange rate remains the same as at the end of 4Q21 (R$/US$ = 5.58) in the coming quarters, as well as the projected variation in cash impact for each R$0.10 variation on the same reference exchange rate (4Q21). Note that the figures presented in the table are the Company’s projections based on the end-of-period curves and could vary depending on market conditions.
Page 17 of 36
| Cash Adjustment (R$ million) | |||||||||||||
| Maturity (up to) | Notional (US$ million) | Actual | R$ / US$ = 5.58 (4Q21) | Sensitivity at R$ 0.10 / US$ variation (+/-)1 | |||||||||
| 4Q21 | - | (159 | ) | - | - | ||||||||
| 2022 | 737 | - | (786 | ) | (59) | ||||||||
| 2023 | 2,169 | - | 357 | (48) | |||||||||
| 2024 | 1,443 | - | (370 | ) | (45) | ||||||||
| 2025 | 1,268 | - | (1,347 | ) | (90) | ||||||||
| >2026 | 873 | - | (1,421 | ) | (85) | ||||||||
| Total | 6,489 | (159 | ) | (3,567 | ) | (327) | |||||||
1Sensitivity analysis considers variation only in the exchange rate (R$/US$), while other variables are presumed constant.
Other transactions involving the Company’s derivatives are related to the embedded derivative resulting from forestry partnerships and commodity hedges, as shown in the table.
Notional (US$ million) | Fair Value (R$ million) | Cash adjustment (R$ million) | ||||||||||||||||||||||||||||
| Other hedges | Maturity (up tp) | Index | Dec/2021 | Sep/2021 | Dec/2021 | Sep/2021 | Dec/2021 | Sep/2021 | ||||||||||||||||||||||
| Embedded derivative | 2035 | Fixed Dollar | US-CPI Dollar | 590 | 602 | 28 | 102 | - | - | ||||||||||||||||||||||
| Commodities | 2021 | Brent/VLSFO/Other | - | - | - | - | (112 | ) | 4 | |||||||||||||||||||||
| Total | 590 | 602 | 28 | 102 | (112 | ) | 4 | |||||||||||||||||||||||
Forestry partnership agreements and wood supply agreements signed on December 31, 2013 are denominated in USD per cubic meter of standing timber, adjusted by U.S. inflation measured by the Consumer Price Index (CPI), which is not related to inflation in the economic environment where the forests are located and, hence, constitutes an embedded derivative. This instrument, which is presented in the table above, consists of a swap contract with the short leg consisting of the variations in the US-CPI during the period of the agreements mentioned below. See note 4 of the 4Q21 Financial Statements for more details and for a sensitivity analysis of the fair value in case of a sharp rise in the U.S. CPI. On December 31, 2021, the outstanding (notional) value of the operation was US$590 million. The result of this swap in 4Q21 was a loss of R$74 million. The mark-to-market (fair value) adjustment of these operations generated a gain of R$28 million at the end of the quarter.
The Company is also exposed to the price of some commodities and, therefore, continually assesses the contracting of derivative financial instruments to mitigate such risks.
On December 31, 2021, the Company did not have any open commodity hedge transactions. The result of these operations in 4Q21 was a loss of R$112 million.
Page 18 of 36
NET INCOME (LOSS)
In 4Q21, the Company posted net income of R$2,313 million, compared to net loss of R$959 million in 3Q21 and net income of R$5,914 million in 4Q20. The variation in relation to 3Q21 was largely due to the positive financial result which, in turn, was caused by the lower negative effect of exchange rate variation on debt and mark-to-market adjustment of derivative operations. Compared to 4Q20, the decrease of R$3,601 million in the net result mainly reflects the decline in financial result, which was partially offset by better operating results.
As the Company recorded net income in 2021 in the amount of R$8,626 million, the amount of R$913 million corresponds to the minimum mandatory dividend. Additionally, BRL 87 million is attributed to the existing profit reserve, distributed “ad referendum” by the Board of Directors on January 7, 2022, totaling BRL 1 billion, at the rate of BRL 0.741168104 per share of the Company, considering the number of “ex-treasury” shares for the year ended December 31, 2021.
DEBT
| Debt (R$ million) | 4Q21 | 3Q21 | Δ Q-o-Q | 4Q20 | Δ Y-o-Y | ||||||||||||||
| Local Currency | 13,641 | 13,364 | 2 | % | 14,740 | -7 | % | ||||||||||||
| Short Term | 1,849 | 1,831 | 1 | % | 541 | 242 | % | ||||||||||||
| Long Term | 11,791 | 11,534 | 2 | % | 14,199 | -17 | % | ||||||||||||
| Foreign Currency | 65,988 | 63,783 | 3 | % | 58,160 | 13 | % | ||||||||||||
| Short Term | 1,806 | 455 | 297 | % | 1,503 | 20 | % | ||||||||||||
| Long Term | 64,182 | 63,328 | 1 | % | 56,657 | 13 | % | ||||||||||||
| Gross Debt | 79,629 | 77,148 | 3 | % | 72,900 | 9 | % | ||||||||||||
| (-) Cash | 21,349 | 18,930 | 13 | % | 9,232 | 131 | % | ||||||||||||
| Net debt | 58,280 | 58,218 | 0 | % | 63,668 | -8 | % | ||||||||||||
| Net debt/Adjusted EBITDA1(x) - R$ | 2.5x | 2.8x | -0.3x | 4.3x | -1.8x | ||||||||||||||
| Net debt/Adjusted EBITDA1(x) - US$ | 2.4x | 2.7x | -0.3x | 4.2x | -1.8x | ||||||||||||||
1Excluding non-recurring items.
On December 31, 2021, gross debt stood at R$79.6 billion and was composed of 95% long-term maturities and 5% short-term maturities. Foreign currency debt corresponded to 83% of the Company's total debt at the end of the quarter. The percentage of gross debt denominated in foreign currency, considering the effect of debt hedge, was 97%. Gross debt increased 3% (R$2.5 billion) in relation to 3Q21, mainly due to the depreciation of BRL against USD.
Suzano contracts debt in foreign currency as a natural hedge, since net operating cash generation is mostly denominated in foreign currency (U.S. dollar) due to its predominant status as an exporter. This structural exposure allows the Company to match loans and financing payments in USD with receivable flows from sales.
Gross Debt Evolution (R$ million) |
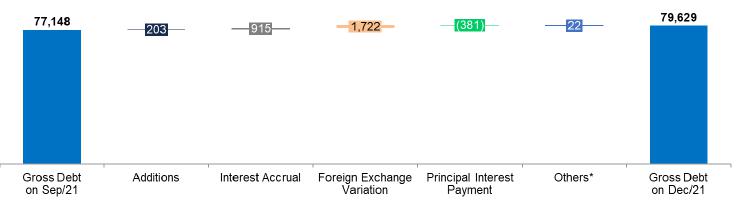
*Corresponding mainly to transaction costs (issue, funding etc.).
Page 19 of 36
On December 31, 2020, the average cost of debt in U.S. dollar was 4.3% p.a. (considering debt in BRL adjusted by the market swap curve), the same average cost registered on September 30, 2021. The average term of consolidated debt at the end of the quarter was 89 months vs. 90 months at the end of September 2021.
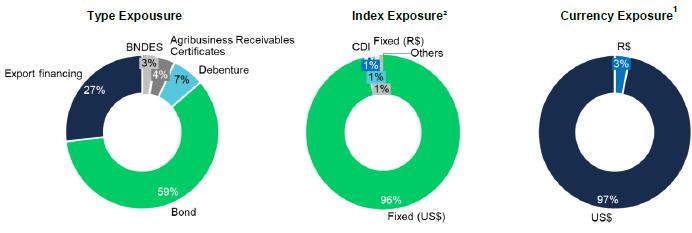
1Considers the portion of debt with currency swaps. The original debt was 83% denominated in USD and 17% in BRL.
2Considers the portion of debt with currency swaps. The exposure of the original debt was: Fixed (US$) – 60%, Libor – 23%, CDI – 11%, Other (Fixed R$, IPCA, TJLP, others) – 5%.
Cash and cash equivalents on December 31, 2021 amounted to R$21.3 billion, 74% of which were invested in foreign currency fixed-income and short-term investments. The remaining 26% was invested in local currency, in government and fixed-income bonds, remunerated at a percentage of the DI rate.
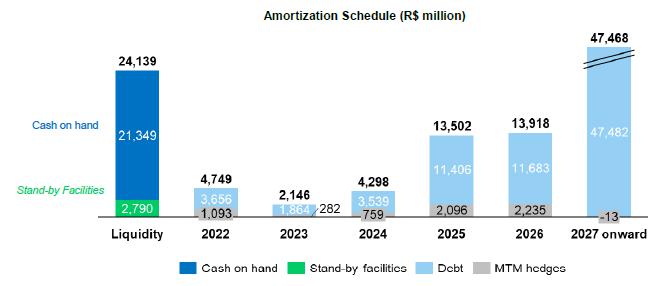
At the end of 2021, the Company also had a stand-by credit facility of R$2.8 billion (US$0.5 billion in foreign currency) available through February 2024. This facility helps improve the company's liquidity position and can be withdrawn during times of uncertainty. As a result, the cash and equivalents of R$21.3 billion plus the facility described above amounted at December 31, 2021 to a readily available cash position of R$24.1 billion.
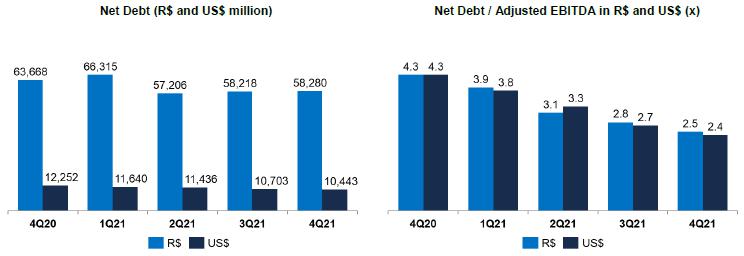
On December 31, 2021, net debt stood at R$58.3 billion (US$10.4 billion), compared to R$58.2 billion (US$10.7 billion) on September 30, 2021. Net debt in BRL did not vary significantly between the third and fourth quarters, but net debt in USD decreased on account of exchange rate variation and cash flow generation during the period.
Financial leverage, measured as the ratio of net debt to Adjusted EBITDA in BRL, was 2.5 times on December 31, 2021 (2.8 times in 3Q21). The same ratio in USD, a measure established in Suzano’s financial policy, was 2.4 times on December 31, 2021 (2.7 times in 3Q21).
Page 20 of 36
The breakdown of gross debt between trade and non-trade finance on December 31, 2021 is shown below:
| 2022 | 2023 | 2024 | 2025 | 2026 | 2027 onward | Total | ||||||||||||||||||||||
| Trade Finance1 | 26 | % | 0 | % | 97 | % | 59 | % | 52 | % | 9 | % | 27 | % | ||||||||||||||
| Non Trade Finance2 | 74 | % | 100 | % | 3 | % | 41 | % | 48 | % | 91 | % | 73 | % | ||||||||||||||
1ECN, EPP
2Bonds, BNDES, CRA, Debentures, among others.
CAPITAL EXPENDITURE
In 4Q21, capital expenditure (cash basis) totaled R$2,220 million, up 45% and 89% from 3Q21 and 4Q20, respectively, chiefly due to higher maintenance expenses (mostly on forestry maintenance and industrial projects due to maintenance downtimes expected for early 2022), as well as higher investments in the Cerrado Project and in modernization projects.
Capex in 2021 remained in line with the guidance earlier announced by the Company. For 2022, the Management approved a Capital Budget of R$13.6 billion, with R$5.0 billion allocated to industrial and forest maintenance and R$7.3 billion to the Cerrado Project, among others.
| Investiments (R$ million) | 4Q21 | 3Q21 | Δ Q-o-Q | 4Q20 | Δ Y-o-Y | 2021 | 2020 | Δ Y-o-Y | Guidance 2022 | |||||||||||||||||||||||||||
| Maintenance | 1,546 | 1,105 | 40 | % | 984 | 57 | % | 4,652 | 3,406 | 37 | % | 5,036 | ||||||||||||||||||||||||
| Industrial maintenance | 333 | 154 | 117 | % | 271 | 23 | % | 778 | 608 | 28 | % | 1,265 | ||||||||||||||||||||||||
| Forestry maintenance | 1,164 | 919 | 27 | % | 686 | 70 | % | 3,777 | 2,716 | 39 | % | 3,753 | ||||||||||||||||||||||||
| Others | 49 | 32 | 51 | % | 28 | 76 | % | 97 | 83 | 17 | % | 18 | ||||||||||||||||||||||||
| Expansion and modernization | 114 | 49 | 132 | % | 80 | 43 | % | 219 | 242 | -10 | % | 489 | ||||||||||||||||||||||||
| Land and forestry | 133 | 77 | 72 | % | 70 | 91 | % | 444 | 365 | 21 | % | 604 | ||||||||||||||||||||||||
| Port terminals | 68 | 107 | -36 | % | 17 | 302 | % | 279 | 120 | 132 | % | 119 | ||||||||||||||||||||||||
| Others | 11 | 0 | - | - | - | 11 | - | - | 92 | |||||||||||||||||||||||||||
| Cerrado Project¹ | 348 | 196 | 78 | % | 22 | - | 739 | 91 | 712 | % | 7,276 | |||||||||||||||||||||||||
| Total | 2,220 | 1,535 | 45 | % | 1,173 | 89 | % | 6,342 | 4,225 | 50 | % | 13,616 | ||||||||||||||||||||||||
1Some capital expenditure items have been reclassified to better reflect the expenses that went to the Cerrado Project.
CERRADO PROJECT
The Cerrado Project schedule continues as planned, closing the year 2021 with the execution “inside the fence” (which corresponds to industrial and infrastructure investments) reaching a physical advance of 3%, a percentage that coincides with the respective financial disbursement. In 4Q21, we highlight the contracting of the chemical plant, the conclusion of the negotiation with the company Rumo as planned for the outflow of production via Malha Norte, the progress of earthworks reaching 80% of execution, among others.
Page 21 of 36
OPERATING CASH GENERATION
Operating cash flow - Consolidated (R$ million) | 4Q21 | 3Q21 | Δ Q-o-Q | 4Q20 | Δ Y-o-Y | 2021 | 2020 | Δ Y-o-Y | ||||||||||||||||||||||||
| Adjusted EBITDA1 | 6,355 | 6,310 | 1 | % | 3,965 | 60 | % | 23,471 | 14,949 | 57 | % | |||||||||||||||||||||
| Maintenance Capex2 | (1,546 | ) | (1,105 | ) | 40 | % | (984 | ) | 57 | % | (4,652 | ) | (3,406 | ) | 37 | % | ||||||||||||||||
| Operating Cash Flow | 4,809 | 5,204 | -8 | % | 2,981 | 61 | % | 18,819 | 11,543 | 63 | % | |||||||||||||||||||||
| Operating Cash Flow (R$/ton) | 1,555 | 1,729 | -10 | % | 988 | 57 | % | 1,584 | 965 | 64 | % | |||||||||||||||||||||
1Excludes non-recurring items.
2Cash basis.
Operating cash generation, measured by adjusted EBITDA less sustaining capex (cash basis), amounted to R$4.8 billion in 4Q21. The decline in operating cash generation per ton in relation to 3Q21 is due to the higher sustaining capex per ton and lower adjusted EBITDA per ton. The 57% increase in relation to 4Q20 is due to the growth in adjusted EBITDA, as mentioned earlier, partially offset by higher sustaining capex per ton.

FREE CASH FLOW
| Free Cash Flow (R$ million) | 4Q21 | 3Q21 | Δ Q-o-Q | 4Q20 | Δ Y-o-Y | 2021 | 2020 | Δ Y-o-Y | ||||||||||||||||||||||||
| Adjusted EBITDA | 6,355 | 6,310 | 1 | % | 3,965 | 60 | % | 23,471 | 14,949 | 57 | % | |||||||||||||||||||||
| (-) Total Capex1 | (2,219 | ) | (1,724 | ) | 29 | % | (1,710 | ) | 30 | % | (6,243 | ) | (4,898 | ) | 27 | % | ||||||||||||||||
| (-) Leases contracts | (314 | ) | (222 | ) | 41 | % | (247 | ) | 27 | % | (1,012 | ) | (824 | ) | 23 | % | ||||||||||||||||
| (+/-) D Working capital | (1,383 | ) | 98 | - | 717 | - | (2,376 | ) | 2,264 | - | ||||||||||||||||||||||
| (-) Net interest2 | (275 | ) | (1,365 | ) | -80 | % | (321 | ) | -14 | % | (3,116 | ) | (3,436 | ) | -9 | % | ||||||||||||||||
| (-) Income taxes | (24 | ) | (11 | ) | 110 | % | (58 | ) | -59 | % | (106 | ) | (188 | ) | -44 | % | ||||||||||||||||
| (-) Dividend payment | (7 | ) | 0 | - | 0 | - | (10 | ) | 0 | - | ||||||||||||||||||||||
| (-) Derivative cash adjustment | (266 | ) | (221 | ) | 20 | % | (1,318 | ) | -80 | % | (1,921 | ) | (4,466 | ) | -57 | % | ||||||||||||||||
| Free cash flow | 1,867 | 2,864 | -35 | % | 1,027 | 82 | % | 8,687 | 3,401 | 155 | % | |||||||||||||||||||||
| (+) Capex ex-maintenance | 690 | 499 | 38 | % | 259 | 166 | % | 1,530 | 784 | 95 | % | |||||||||||||||||||||
| (+) Dividend payment | 7 | 0 | - | 0 | - | 10 | 0 | - | ||||||||||||||||||||||||
| Free cash flow – Adjusted3 | 2,564 | 3,363 | -24 | % | 1,286 | 99 | % | 10,227 | 4,185 | 144 | % | |||||||||||||||||||||
1Accrual basis.
2Considers interest paid on debt, interest received on financial investments and premiums paid resulting from liability management operations.
3Free cash flow prior to dividend payments and capex ex-maintenance (accrual basis).
Page 22 of 36
Adjusted free cash flow considering the adjustment for derivatives stood at R$2,564 million in 4Q21, as against R$3,363 million in 3Q21 and R$1,286 million in 4Q20. Compared to the previous period, free cash flow fell 24% due to lower working capital and higher Capex. These effects were partially offset by the lower concentration of net interest payments. With regard to working capital, note that the decline, especially in accounts receivable (decrease in receivables discount operations volume and increase in volume sold), was partially offset by the suppliers item.
Compared to 4Q20, the 92% increase was caused by the 60% growth in adjusted EBITDA and lower payments resulting from derivative adjustments, partially offset by the reduction in working capital (also due to accounts receivable, also explained by the delta in receivables discount operations).
NET DEBT EVOLUTION (R$ million)
The net debt between December 2020 and December 2021 evolution occurred as follows:

1Considers amounts related to derivative adjustments, payment of leases, payment of dividends, costs due to liability management, among other items.
2Net of exchange variations on cash and financial investments.
3Accrual basis.
COVID-19
With the onset of the COVID-19 pandemic, popularly known as the new coronavirus, Suzano adopted and has maintained preventive and mitigatory measures in compliance with the rules and policies established by Brazilian and international health authorities to minimize the impacts of the pandemic on the safety of people, society and its business.
The Company’s actions are based on three pillars: (1) People; (2) Society; (3) Business Continuity.
| (1) | People: To ensure the safety of its employees and contractors who work in its operations, Suzano adopted a series of measures to mitigate their exposure and/or mitigate the risks of exposure. |
| (2) | Society: One of Suzano’s three culture drivers is “It's only good for us if it's good for the world.” Accordingly, from the onset of the pandemic till now, the Company has taken a series of measures to protect society, including: |
| · | Donation of tissue paper, napkins and disposable diapers produced by it to needy regions. |
| · | Acquisition of 159 ventilators and 1 million medical masks for donation to the federal and state governments. |
| · | Participation in a joint effort with Positivo Tecnologia, Klabin, Flextronics and Embraer to support the Brazilian company Magnamed in manufacturing ventilators, which were delivered to the Brazilian government. Suzano invested R$9.6 million in this action in 2020. |
| · | Construction of a field hospital in Teixeira de Freitas, Bahia, jointly with Veracel, which was delivered to the state government and inaugurated in July 2020. |
Page 23 of 36
| · | Partnership with the vocational school Fatec in Capão Bonito to produce hand sanitizer. |
| · | Forklifts lent to transport the donations received by the Red Cross. |
| · | Maintenance of all direct jobs. |
| · | Maintenance for 90 days (until the end of June 2020) the payment of 100% of the payroll expenses of employees of service providers whose operations were suspended because of the pandemic, in order to protect jobs. |
| · | Creation of a support program for small suppliers, a social program to help small farmers sell their produce via a home delivery system in 38 communities assisted by Suzano’s Rural Land Development Program (“PDRT”) in five states, and a social program to produce 125,000 masks in local communities for donation in five states. |
| · | Launch of a support program for small and midsized paper clients called “We’re Together” to ensure that these companies have the financial and managerial capacity to resume operations. |
| · | Support for the State Government of Maranhão in setting up the Imperatriz Temporary Hospital, donating R$3 million. |
| · | Supply of 280,000 m³ of oxygen to the State of Amazonas. |
| · | Construction of a new treatment center for COVID-19 in São Paulo in partnership with Gerdau, BTG Pactual, Península Participações and through joint efforts with Hospital Israelita Albert Einstein and the Municipal Government of São Paulo. |
| · | Donation of oxygen concentrators, acquired in a joint effort involving Suzano, Bradesco, BRF, B3, Embraer, Gerdau, Grupo Ultra, Itaú Unibanco, Magazine Luiza, Marfrig, Natura & Co and Unipar, to the Health Ministry, which is tasked with the logistics of distributing the devices. |
| · | Donation of 86,000 m³ of oxygen to the city of Imperatriz in Maranhão and 1,300 m³ to Aracruz in Espírito Santo. |
| · | Joint efforts to accelerate the vaccination program for the Brazilian population through participation in the "Unidos pela Vacina" group, with the donation of cold rooms and thermal boxes, to municipalities in Bahia and Espírito Santo. |
| · | Donation of basic food baskets and kits of individual protection equipment (masks, alcohol, aprons, caps and gloves) to municipalities. |
In 2021, donations made in support of social actions implemented by Suzano totaled R$25 million (see Note 30 to the Financial Statements - Result by Nature).
| (3) | Business continuity: to date, the Company is maintaining its operations normally and has set up a crisis management committee that continues to function. |
The pulp and paper sector was recognized by the World Health Organization (WHO) and diverse countries as a producer of essential goods for society. Hence, to meet the responsibility arising from the essential nature of its business, Suzano took measures to ensure, to the maximum extent possible, that it maintains its operations normally and meets its clients’ requirements by increasing the level of wood and raw material inventories at plants and expanding its inventories of finished products, besides reaching out to its clients to minimize any risks of stockout at plants along the logistics chain and guarantee the sale of their products.
The current scenario arising from COVID-19 also implies higher credit risk, especially among its paper clients. Therefore, the Company has been monitoring this risk and implementing measures to mitigate it. To date, there have been no significant financial impacts.
Page 24 of 36
As previously disclosed throughout 2020, the Company temporarily shut down its paper production lines at the Mucuri and Rio Verde mills for 30 days from April 27, 2020 and May 1, 2020, respectively. However, normal operations resumed at these mills in July 2020 and have been maintained since then.
Lastly, it is important to mention that in light of the current scenario, the Company has taken and maintained intensive communication efforts to further increase interactions with its main stakeholders in order to ensure adequate transparency and flow of information with them in a timely manner and in alignment with the current social and economic situation. All key updates on its measures and activities in the context of COVID-19 are available on the Company’s Investor Relations website.
The Company has also created a webpage with information on all its actions related to COVID-19: https://www.suzanocontraocoronavirus.com.br.
ESG
The final quarter of 2021, similar to previous quarters, was one of important advances in Suzano's strategic agenda related to ESG.
Aware that effective measures in the short term are essential for the Company’s efforts to combat the climate emergency, Suzano announced in October the decision to anticipate our Commitment to Renew Life by removing 40 million tons of CO2 from the atmosphere, previously planned until 2030 for the year 2025. The anticipation of the target by five years is supported by the expansion of vegetation cover, through commercial plantations and areas destined for conservation, in previously degraded and anthropized areas, especially in the Cerrado areas.
Still on the climate issue, in November, the Company was present at COP26, in Glasgow, dedicating itself to actively contributing to various discussions associated with the climate emergency.
During the quarter, the company launched the Inclusive Sourcing Program, which involved over 500 suppliers. The program is designed to engage the company’s supply chain in adopting diversity and inclusion practices in order to increase the number of historically marginalized groups among the company’s outsourced employees. The program is aligned with the Company’s Diversity and Inclusion Commitment.
4Q21 also registered important recognitions, with highlights for Suzano in the SustainAbility Leadership Survey ranking and in the report “The State of Child and Business Rights 2021” promoted by the Global Child Forum. It is also worth mentioning the Company's progress in the 3 CDP questionnaires, by evolving its scores in the 3 questionnaires (Water, Forest and Climate) from “B” to “A-“. Finally, the Company was again selected for B3's Corporate Sustainability Index (ISE).
TOTAL OPERATIONAL EXPENDITURE - PULP
As disclosed through a Material Fact notice on March 24, 2021, the estimated total operating expenditure for 2024 is approximately R$1,400/t, and the trend for the indicator remains as planned, considering the exchange and inflation assumptions used.
EVENTS SUBSEQUENT TO THE REPORTING PERIOD
On February 8, 2022, the Company concluded the contracting of a new revolving credit facility (stand-by credit facility), increasing the total available in revolving credit lines from US$500 million to US$1,275 million. Of the total contracted amount, US$100 million is available until February 2024, with this remaining amount of the line already in force since February 2019, in the original amount of US$500 million. The additional amount of US$1,175 million is available until February 2027 and has the same financial costs as the current line until February 2024.
Suzano's Bylaws establish the minimum mandatory dividend equivalent to the lower of 25% of net income after the constitution of legal reserves for the year or 10% of Operating Cash Generation (GCO) of the respective fiscal year, with CGO being the result of Adjusted EBITDA deducted from maintenance capex. As the Company recorded net income in 2021 in the amount of R$8,626 million, the amount of R$913 million corresponds to the minimum mandatory dividend. Additionally, R$87 million is attributed to the existing profit reserve, distributed “ad referendum” by the Board of Directors on January 7, 2022, totaling BRL 1 billion, at the rate of BRL 0.741168104 per share of the Company, considering the number of “ex-treasury” shares for the year ended December 31, 2021.
Page 25 of 36
CAPITAL MARKETS
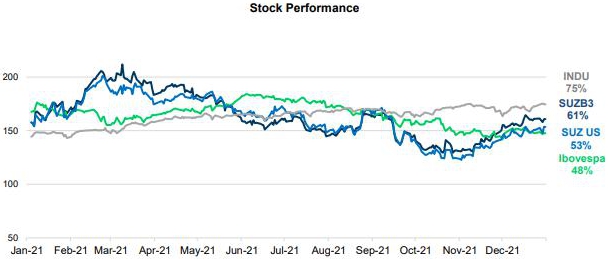
On December 31, 2021, Suzano’s stock was quoted at R$60.11/share (SUZB3) and US$10.80/share (SUZ). The Company’s stock is listed on the Novo Mercado, the listing segment of the São Paulo Stock Exchange (B3 – Brasil, Bolsa e Balcão) with the highest corporate governance standards, and on the New York Stock Exchange (NYSE) - Level II.
Source: Bloomberg.
Source: Bloomberg.
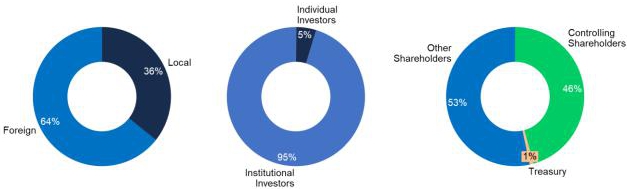
On December 31, 2021, the Company's share capital was represented by 1,361,263,584 common shares, of which 12,042,004 were held in Treasury. Suzano’s market capitalization stood at R$81.8 billion on December 31, 2021. Free float in 4Q21 corresponded to 53% of the total capital.
Page 26 of 36
| Free Float distribution on 12/31/2021 (B3 + NYSE) | Ownership structure on 12/31/2021 |
FIXED INCOME
| Unit | Dec/21 | Sep/21 | Dec20 | Δ Q-o-Q | Δ Y-o-Y | |||||||||||||||||||
| Fibria 2025 - Price | USD/k | 105.23 | 107.02 | 107.46 | -1.7 | % | -2.1 | % | ||||||||||||||||
| Fibria 2025 - Yield | % | 2.21 | 1.79 | 2.06 | 23.6 | % | 7.2 | % | ||||||||||||||||
| Suzano 2026 - Price | USD/k | 114.31 | 116.49 | 117.63 | -1.9 | % | -2.8 | % | ||||||||||||||||
| Suzano 2026 - Yield | % | 2.40 | 2.10 | 2.33 | 13.9 | % | 2.8 | % | ||||||||||||||||
| Fibria 2027 - Price | USD/k | 112.26 | 114.49 | 114.48 | -1.9 | % | -1.9 | % | ||||||||||||||||
| Fibria 2027 - Yield | % | 2.87 | 2.55 | 2.87 | 12.4 | % | 0.0 | % | ||||||||||||||||
| Suzano 2028 - Price | USD/k | 96.81 | 97.84 | - | -1.1 | % | - | |||||||||||||||||
| Suzano 2028 - Yield | % | 3.03 | 2.84 | - | 6.5 | % | - | |||||||||||||||||
| Suzano 2029 - Price | USD/k | 116.01 | 118.12 | 120.44 | -1.8 | % | -3.7 | % | ||||||||||||||||
| Suzano 2029 - Yield | % | 3.42 | 3.19 | 3.10 | 7.1 | % | 10.1 | % | ||||||||||||||||
| Suzano 2030 - Price | USD/k | 110.07 | 111.69 | 113.78 | -1.4 | % | -3.3 | % | ||||||||||||||||
| Suzano 2030 - Yield | % | 3.55 | 3.37 | 3.23 | 5.3 | % | 9.9 | % | ||||||||||||||||
| Suzano 2031 - Price | USD/k | 102.00 | 103.28 | 106.68 | -1.2 | % | -4.4 | % | ||||||||||||||||
| Suzano 2031 - Yield | % | 3.49 | 3.34 | 2.98 | 4.6 | % | 17.3 | % | ||||||||||||||||
| Suzano 2032 - Price | USD/k | 97.14 | 96.96 | - | 0.2 | % | - | |||||||||||||||||
| Suzano 2032 - Yield | % | 3.46 | 3.48 | - | -0.4 | % | - | |||||||||||||||||
| Suzano 2047 - Price | USD/k | 127.06 | 131.75 | 134.32 | -3.6 | % | -5.4 | % | ||||||||||||||||
| Suzano 2047 - Yield | % | 5.08 | 4.82 | 4.71 | 5.4 | % | 8.0 | % | ||||||||||||||||
| Treasury 10 years | % | 1.51 | 1.49 | 0.91 | 1.6 | % | 65.4 | % | ||||||||||||||||
Note: Senior Notes issued with face value of 100 USD/k
RATINGS
| Agency | National Scale | Global Scale | Outlook | |||
| Fitch Ratings | AAA | BBB- | Stable | |||
| Standard & Poor’s | br.AAA | BBB- | Stable | |||
| Moody’s | Aaa.br | Baa3 | Stable |
Page 27 of 36
UPCOMING EVENTS
Earnings Conference Call (4Q21)
Date: February 10, 2022 (Thursday)
| Portuguese (simultaneous translation) | English |
| 10:00 p.m. (Brasília) | 10:00 a.m. (Brasília) |
| 8:00 a.m. (New York) | 8:00 a.m. (New York) |
| 1:00 p.m. (London) | 1:00 p.m. (London) |
| Tel.: +55 (11) 4090-1621 | Tel.: +1 844 204 8942 |
Please connect 10 minutes before the conference call is scheduled to begin.
The conference call will be held in English and feature a presentation, with simultaneous webcast. The access links will be available on the Company’s Investor Relations website (www.suzano.com.br/ri).
If you are unable to participate, the webcast link will be available for future consultation on the Investor Relations website of Suzano S.A.
Suzano Day
Date: March 30, 2022 (Wednesday)
IR CONTACTS
Marcelo Bacci
Camila Nogueira
Larissa Barbosa
Luísa Puccini
Mariana Dutra
Roberto Costa
Tel.: +55 (11) 3503-9330
ri@suzano.com.br
www.suzano.com.br/ir
Page 28 of 36
APPENDICES
APPENDIX 1 - Operating Data
| Revenue breakdown (R$ '000) | 4Q21 | 3Q21 | Δ Q-o-Q | 4Q20 | Δ Y-o-Y | 2021 | 2020 | Δ Y-o-Y | ||||||||||||||||||||||||
| Exports | 9,474,662 | 8,937,959 | 6 | % | 6,489,970 | 46 | % | 34,246,037 | 25,492,642 | 34 | % | |||||||||||||||||||||
| Pulp | 8,907,877 | 8,443,713 | 5 | % | 6,093,525 | 46 | % | 32,376,399 | 23,968,816 | 35 | % | |||||||||||||||||||||
| Paper | 566,785 | 494,246 | 15 | % | 396,445 | 43 | % | 1,869,638 | 1,523,826 | 23 | % | |||||||||||||||||||||
| Domestic Market | 1,995,309 | 1,823,896 | 9 | % | 1,523,006 | 31 | % | 6,719,394 | 4,967,635 | 35 | % | |||||||||||||||||||||
| Pulp | 668,082 | 656,579 | 2 | % | 453,450 | 47 | % | 2,338,809 | 1,609,449 | 45 | % | |||||||||||||||||||||
| Paper | 1,327,227 | 1,167,317 | 14 | % | 1,069,556 | 24 | % | 4,380,585 | 3,358,186 | 30 | % | |||||||||||||||||||||
| Total Net Revenue | 11,469,971 | 10,761,855 | 7 | % | 8,012,976 | 43 | % | 40,965,431 | 30,460,277 | 34 | % | |||||||||||||||||||||
| Pulp | 9,575,959 | 9,100,292 | 5 | % | 6,546,975 | 46 | % | 34,715,208 | 25,578,265 | 36 | % | |||||||||||||||||||||
| Paper | 1,894,012 | 1,661,563 | 14 | % | 1,466,001 | 29 | % | 6,250,223 | 4,882,012 | 28 | % | |||||||||||||||||||||
| Sales volume (‘000) | 4Q21 | 3Q21 | Δ Q-o-Q | 4Q20 | Δ Y-o-Y | 2021 | 2020 | Δ Y-o-Y | ||||||||||||||||||||||||
| Exports | 2,627,747 | 2,564,315 | 2 | % | 2,556,991 | 3 | % | 10,160,467 | 10,411,557 | -2 | % | |||||||||||||||||||||
| Pulp | 2,531,366 | 2,467,203 | 3 | % | 2,460,736 | 3 | % | 9,789,129 | 10,036,495 | -2 | % | |||||||||||||||||||||
| Paper | 96,381 | 97,112 | -1 | % | 96,255 | 0 | % | 371,338 | 375,062 | -1 | % | |||||||||||||||||||||
| Paperboard | 8,350 | 7,984 | 5 | % | 10,078 | -17 | % | 34,935 | 62,816 | -44 | % | |||||||||||||||||||||
| Printing & Writing | 87,319 | 87,177 | 0 | % | 83,130 | 5 | % | 328,436 | 303,568 | 8 | % | |||||||||||||||||||||
| Other paper1 | 712 | 1,951 | -64 | % | 3,047 | -77 | % | 7,967 | 8,678 | -8 | % | |||||||||||||||||||||
| Domestic Market | 465,396 | 445,227 | 5 | % | 460,135 | 1 | % | 1,719,617 | 1,588,440 | 8 | % | |||||||||||||||||||||
| Pulp | 191,054 | 205,813 | -7 | % | 201,908 | -5 | % | 796,708 | 786,621 | 1 | % | |||||||||||||||||||||
| Paper | 274,342 | 239,414 | 15 | % | 258,227 | 6 | % | 922,909 | 801,819 | 15 | % | |||||||||||||||||||||
| Paperboard | 39,917 | 42,516 | -6 | % | 44,916 | -11 | % | 163,621 | 138,937 | 18 | % | |||||||||||||||||||||
| Printing & Writing | 199,978 | 164,647 | 21 | % | 182,526 | 10 | % | 637,761 | 538,861 | 18 | % | |||||||||||||||||||||
| Other paper1 | 34,447 | 32,251 | 7 | % | 30,785 | 12 | % | 121,527 | 124,021 | -2 | % | |||||||||||||||||||||
| Total Sales Volume | 3,093,143 | 3,009,542 | 3 | % | 3,017,126 | 3 | % | 11,880,084 | 11,999,997 | -1 | % | |||||||||||||||||||||
| Pulp | 2,722,420 | 2,673,016 | 2 | % | 2,662,644 | 2 | % | 10,585,837 | 10,823,116 | -2 | % | |||||||||||||||||||||
| Paper | 370,723 | 336,526 | 10 | % | 354,482 | 5 | % | 1,294,247 | 1,176,881 | 10 | % | |||||||||||||||||||||
| Paperboard | 48,267 | 50,500 | -4 | % | 54,994 | -12 | % | 198,556 | 201,753 | -2 | % | |||||||||||||||||||||
| Printing & Writing | 287,297 | 251,824 | 14 | % | 265,656 | 8 | % | 966,197 | 842,429 | 15 | % | |||||||||||||||||||||
| Other paper1 | 35,159 | 34,202 | 3 | % | 33,832 | 4 | % | 129,494 | 132,699 | -2 | % | |||||||||||||||||||||
| Average net price (R$/ton) | 4Q21 | 3Q21 | Δ Q-o-Q | 4Q20 | Δ Y-o-Y | 2021 | 2020 | Δ Y-o-Y | ||||||||||||||||||||||||
| Exports | 3,606 | 3,486 | 3 | % | 2,538 | 42 | % | 3,371 | 2,448 | 38 | % | |||||||||||||||||||||
| Pulp | 3,519 | 3,422 | 3 | % | 2,476 | 42 | % | 3,307 | 2,388 | 38 | % | |||||||||||||||||||||
| Paper | 5,881 | 5,089 | 16 | % | 4,119 | 43 | % | 5,035 | 4,063 | 24 | % | |||||||||||||||||||||
| Domestic Market | 4,287 | 4,097 | 5 | % | 3,310 | 30 | % | 3,907 | 3,127 | 25 | % | |||||||||||||||||||||
| Pulp | 3,497 | 3,190 | 10 | % | 2,246 | 56 | % | 2,936 | 2,046 | 43 | % | |||||||||||||||||||||
| Paper | 4,838 | 4,876 | -1 | % | 4,142 | 17 | % | 4,746 | 4,188 | 13 | % | |||||||||||||||||||||
| Total | 3,708 | 3,576 | 4 | % | 2,656 | 40 | % | 3,448 | 2,538 | 36 | % | |||||||||||||||||||||
| Pulp | 3,517 | 3,405 | 3 | % | 2,459 | 43 | % | 3,279 | 2,363 | 39 | % | |||||||||||||||||||||
| Paper | 5,109 | 4,937 | 3 | % | 4,136 | 24 | % | 4,829 | 4,148 | 16 | % | |||||||||||||||||||||
Page 29 of 36
| Average net price (US$/ton) | 4Q21 | 3Q21 | Δ Q-o-Q | 4Q20 | Δ Y-o-Y | 2021 | 2020 | Δ Y-o-Y | ||||||||||||||||||||||||
| Exports | 646 | 667 | -3 | % | 470 | 37 | % | 625 | 474 | 32 | % | |||||||||||||||||||||
| Pulp | 630 | 654 | -4 | % | 459 | 37 | % | 613 | 463 | 32 | % | |||||||||||||||||||||
| Paper | 1,053 | 973 | 8 | % | 763 | 38 | % | 933 | 787 | 18 | % | |||||||||||||||||||||
| Domestic Market | 768 | 784 | -2 | % | 613 | 25 | % | 724 | 606 | 19 | % | |||||||||||||||||||||
| Pulp | 626 | 610 | 3 | % | 416 | 50 | % | 544 | 397 | 37 | % | |||||||||||||||||||||
| Paper | 867 | 933 | -7 | % | 767 | 13 | % | 880 | 812 | 8 | % | |||||||||||||||||||||
| Total | 664 | 684 | -3 | % | 492 | 35 | % | 639 | 492 | 30 | % | |||||||||||||||||||||
| Pulp | 630 | 651 | -3 | % | 455 | 38 | % | 608 | 458 | 33 | % | |||||||||||||||||||||
| Paper | 915 | 944 | -3 | % | 766 | 19 | % | 895 | 804 | 11 | % | |||||||||||||||||||||
1 Paper of other manufacturers sold by Suzano and tissue paper.
| FX Rate R$/US$ | 4Q21 | 3Q21 | Δ Q-o-Q | 4Q20 | Δ Y-o-Y | 2021 | 2020 | Δ Y-o-Y | ||||||||||||||||||||||||
| Closing | 5.58 | 5.44 | -1 | % | 5.20 | 7 | % | 5.58 | 5.20 | 7 | % | |||||||||||||||||||||
| Average | 5.58 | 5.23 | 7 | % | 5.40 | 3 | % | 5.40 | 5.16 | 5 | % | |||||||||||||||||||||
Page 30 of 36
APPENDIX 2 – Consolidated Statement of Income and Goodwill Amortization
Income Statement (R$ ‘000) | 4Q21 | 3Q21 | Δ Q-o-Q | 4Q20 | Δ Y-o-Y | 2021 | 2020 | Δ Y-o-Y | ||||||||||||||||||||||||
| Net Revenue | 11,469,971 | 10,761,855 | 7 | % | 8,012,976 | 43 | % | 40,965,431 | 30,460,277 | 34 | % | |||||||||||||||||||||
| Cost of Goods Sold | (5,692,988 | ) | (5,299,911 | ) | 7 | % | (4,883,644 | ) | 17 | % | (20,615,588 | ) | (18,966,331 | ) | 9 | % | ||||||||||||||||
| Gross Debt | 5,776,983 | 5,461,944 | 6 | % | 3,129,332 | 85 | % | 20,349,843 | 11,493,946 | 77 | % | |||||||||||||||||||||
| Gross Margin | 50.4 | % | 50.7 | % | 0 p,p, | 39.1 | % | 11 p,p, | 49.7 | % | 37.7 | % | 12 p,p, | |||||||||||||||||||
| Operating Expense/Income | (1,022,752 | ) | (849,402 | ) | 20 | % | (718,307 | ) | 42 | % | (2,169,652 | ) | (3,050,552 | ) | -29 | % | ||||||||||||||||
| Selling Expenses | (634,921 | ) | (578,101 | ) | 10 | % | (590,024 | ) | 8 | % | (2,291,722 | ) | (2,174,652 | ) | 5 | % | ||||||||||||||||
| General and Administrative Expenses | (522,761 | ) | (319,590 | ) | 64 | % | (479,906 | ) | 9 | % | (1,577,909 | ) | (1,443,192 | ) | 9 | % | ||||||||||||||||
| Other Operating Income (Expenses) | 202,841 | 18,830 | 977 | % | 322,883 | -37 | % | 1,648,067 | 531,150 | 210 | % | |||||||||||||||||||||
| Equity Equivalence | (67,911 | ) | 29,459 | -331 | % | 28,740 | -336 | % | 51,912 | 36,142 | 44 | % | ||||||||||||||||||||
| EBIT | 4,754,231 | 4,612,542 | 3 | % | 2,411,025 | 97 | % | 18,180,191 | 8,443,394 | 115 | % | |||||||||||||||||||||
| Depreciation, Amortization & Depletion | 1,832,940 | 1,745,487 | 5 | % | 1,761,660 | 4 | % | 7,041,663 | 6,772,780 | 4 | % | |||||||||||||||||||||
| EBITDA | 6,587,171 | 6,358,029 | 4 | % | 4,172,685 | 58 | % | 25,221,854 | 15,216,174 | 66 | % | |||||||||||||||||||||
| EBITDA Margin (%) | 57.4 | % | 59.1 | % | -2 p,p, | 52,1 | % | 5 p,p, | 61,6 | % | 49,9 | % | 12 p,p, | |||||||||||||||||||
| Adjusted EBITDA1 | 6,355,317 | 6,309,558 | 1 | % | 3,964,926 | 60 | % | 23,470,923 | 14,949,489 | 57 | % | |||||||||||||||||||||
| Adjusted EBITDA Margin1 | 55,4 | % | 58,6 | % | -3 p,p, | 49,5 | % | 6 p,p, | 57,3 | % | 49,1 | % | 8 p,p, | |||||||||||||||||||
| Net Financial Result | (2,657,320 | ) | (7,765,377 | ) | -66 | % | 6,238,407 | -143 | % | (9,347,234 | ) | (26,085,523 | ) | -64 | % | |||||||||||||||||
| Financial Expenses | 147,622 | 54,444 | 171 | % | 65,889 | 124 | % | 272,556 | 327,475 | -17 | % | |||||||||||||||||||||
| Financial Revenues | (1,085,450 | ) | (1,212,759 | ) | -10 | % | (974,494 | ) | 11 | % | (4,221,301 | ) | (4,459,425 | ) | -5 | % | ||||||||||||||||
| Exchange Rate Variation | (1,412,237 | ) | (4,077,782 | ) | -65 | % | 4,463,515 | -132 | % | (3,800,827 | ) | (12,530,891 | ) | -70 | % | |||||||||||||||||
| Net Proceeds Generated by Derivatives | (307,255 | ) | (2,529,280 | ) | -88 | % | 2,683,497 | -111 | % | (1,597,662 | ) | (9,422,682 | ) | -83 | % | |||||||||||||||||
| Earnings Before Taxes | 2,096,911 | (3,152,835 | ) | -167 | % | 8,649,432 | -76 | % | 8,832,957 | (17,642,129 | ) | -150 | % | |||||||||||||||||||
| Income and Social Contribution Taxes | 216,556 | 2,193,460 | -90 | % | (2,735,081 | ) | -108 | % | (197,425 | ) | 6,927,194 | -103 | % | |||||||||||||||||||
| Net Income (Loss) | 2,313,467 | (959,375 | ) | -341 | % | 5,914,351 | -61 | % | 8,635,532 | (10,714,935 | ) | -181 | % | |||||||||||||||||||
| Net Margin | 20,2 | % | -8,9 | % | 29 p,p, | 73,8 | % | -54 p,p, | 21,1 | % | -35,2 | % | 56,3 p,p, | |||||||||||||||||||
1 Excluding non-recurring items and PPA effects.
| Goodwill amortization - PPA (R$ ‘000) | 4Q21 | 3Q21 | Δ Q-o-Q | 4Q20 | Δ Y-o-Y | |||||||||||||||
| COGS | (144,122 | ) | (149,176 | ) | -3 | % | (2,668 | ) | - | |||||||||||
| Selling Expenses | (207,925 | ) | (207,763 | ) | 0 | % | (206,310 | ) | 1 | % | ||||||||||
| General and administrative expenses | (2,732 | ) | (1,844 | ) | 48 | % | (1,191 | ) | 129 | % | ||||||||||
| Other operational revenues (expenses) | (50,207 | ) | (18,886 | ) | 166 | % | (5,380 | ) | 833 | % | ||||||||||
| Financial results | (4,722 | ) | 14,397 | - | 20,756 | -123 | % |
Page 31 of 36
APPENDIX 3 – Consolidated Balance Sheet
| Ativo (R$ mil) | 31/12/2021 | 30/09/2021 | 31/12/2020 | |||||||||
| Current Assets | ||||||||||||
| Cash and cash equivalents | 13,590,776 | 13,461,967 | 6,835,057 | |||||||||
| Financial investments | 7,508,275 | 5,228,075 | 2,212,079 | |||||||||
| Trade accounts receivable | 6,531,465 | 4,577,069 | 2,915,206 | |||||||||
| Inventories | 4,637,485 | 4,652,459 | 4,009,335 | |||||||||
| Recoverable taxes | 360,725 | 427,987 | 406,850 | |||||||||
| Derivative financial instruments | 470,261 | 515,204 | 484,043 | |||||||||
| Advance to suppliers | 59,564 | 39,327 | 43,162 | |||||||||
| Dividends receivable | 6,604 | - | 7,633 | |||||||||
| Other assets | 937,786 | 783.943 | 731,291 | |||||||||
| Non-current assets held for sale | - | - | 313,338 | |||||||||
| Total Current Assets | 34,102,941 | 29,686,031 | 17,957,994 | |||||||||
| Non-Current Assets | ||||||||||||
| Financial investments | 250.054 | 240.329 | 184.778 | |||||||||
| Recoverable taxes | 1.269.164 | 1.219.207 | 834.575 | |||||||||
| Deferred taxes | 8.729.929 | 8.505.573 | 8.677.002 | |||||||||
| Derivative financial instruments | 971.879 | 753.791 | 857.377 | |||||||||
| Advance to suppliers | 1.282.763 | 1.220.625 | 1.015.115 | |||||||||
| Judicial deposits | 300,715 | 322.879 | 257.789 | |||||||||
| Other assets | 296,844 | 237.742 | 235.341 | |||||||||
| Biological assets | 12,248,732 | 11,807,705 | 11,161,210 | |||||||||
| Investments | 524,066 | 518,977 | 359,071 | |||||||||
| Property, plant and equipment | 38,169,703 | 38,027,466 | 39,156,890 | |||||||||
| Right of use on lease agreements | 4,794,023 | 4,593,241 | 4,344,078 | |||||||||
| Intangible | 16,034,339 | 16,249,726 | 16,759,528 | |||||||||
| Total Non-Current Assets | 84,872,211 | 83,697,261 | 83,842,754 | |||||||||
| Total Assets | 118,975,152 | 113,383,292 | 101,800,748 | |||||||||
| Liabilities and Equity (R$ ´000) | 12/31/2021 | 09/30/2021 | 12/31/2020 | |||||||||
| Current Liabilities | ||||||||||||
| Trade accounts payable | 3,288,897 | 2,966,600 | 2,361,098 | |||||||||
| Loans, financing and debentures | 3,655,537 | 2,286,040 | 2,043,386 | |||||||||
| Accounts payable for lease operations | 623,282 | 623,136 | 620,177 | |||||||||
| Derivative financial instruments | 1,563,459 | 1,619,081 | 1,991,118 | |||||||||
| Taxes payable | 339,553 | 346,285 | 170,482 | |||||||||
| Payroll and charges | 590,529 | 549,949 | 492,728 | |||||||||
| Liabilities for assets acquisitions and subsidiaries | 99,040 | 91,828 | 101,515 | |||||||||
| Dividends payable | 919,073 | 11,173 | 6,232 | |||||||||
| Advance from customers | 103,656 | 92,567 | 25,171 | |||||||||
| Other liabilities | 368,198 | 359,754 | 360,916 | |||||||||
| Total Current Liabilities | 11,551,224 | 8.946.413 | 8.172.823 | |||||||||
| Non-Current Liabilities | ||||||||||||
| Loans, financing and debentures | 75,973,092 | 74,861,856 | 70,856,496 | |||||||||
| Accounts payable for lease operations | 5,269,912 | 5,030,297 | 4,571,583 | |||||||||
| Derivative financial instruments | 6,331,069 | 6,061,046 | 6,126,282 | |||||||||
| Liabilities for assets acquisitions and subsidiaries | 306,912 | 301,893 | 400,713 | |||||||||
| Provision for judicial liabilities | 3,232,612 | 3,273,411 | 3,255,955 | |||||||||
| Actuarial liabilities | 675,158 | 795,090 | 785,045 | |||||||||
| Deferred taxes | - | - | 570 | |||||||||
| Share-based compensation plans | 166,998 | 206,961 | 195,135 | |||||||||
| Advance from customers | 149,540 | 165,439 | - | |||||||||
| Other liabilities | 143,505 | 122,040 | 98,768 | |||||||||
| Total Non-Current Liabilities | 92,248,798 | 90,818,033 | 86,290,547 | |||||||||
| Shareholders’ Equity | ||||||||||||
| Share capital | 9,235,546 | 9,235,546 | 9,235,546 | |||||||||
| Capital reserves | 15,455 | 14,244 | 10,612 | |||||||||
| Treasury shares | (218,265 | ) | (218,265 | ) | (218,265 | ) | ||||||
| Retained earnings reserves | 3,927,824 | - | - | |||||||||
| Other reserves | 2,114,907 | 1,988,711 | 2,129,944 | |||||||||
| Retained loss | - | 2,498,255 | (3,926,015 | ) | ||||||||
| Controlling shareholders´ | 15,075,467 | 13,518,491 | 7,231,822 | |||||||||
| Non-controlling interest | 99,663 | 100,355 | 105,556 | |||||||||
| Total Equity | 15,175,130 | 13,618,846 | 7,231,822 | |||||||||
| Total Liabilities and Equity | 118,975,152 | 113,383,292 | 101,800,748 | |||||||||
Page 32 of 36
APPENDIX 4 – Consolidated Statement of Cash Flow
| Cash Flow (R$ ‘000) | 4Q21 | 4Q20 | 2021 | 2020 | ||||||||||||
| Operating Activities | ||||||||||||||||
| Net income (loss) for the year | 2,313,467 | 5,914,351 | 8,635,532 | (10,714,935 | ) | |||||||||||
| Depreciation, depletion and amortization | 1,797,814 | 1,693,458 | 6,879,132 | 6,565,441 | ||||||||||||
| Depreciation of right of use | 52,356 | 59,967 | 203,670 | 186,768 | ||||||||||||
| Sublease of ships | (12,508 | ) | (12,520 | ) | (44,706 | ) | (35,841 | ) | ||||||||
| Interest expense on lease liabilities | 110,084 | 113,516 | 427,934 | 397,746 | ||||||||||||
| Result from sale and disposal of property, plant and equipment and biological assets, net | 79,772 | (9,868 | ) | (412,612 | ) | (8,372 | ) | |||||||||
| Income from associates and joint ventures | 67,911 | (28,740 | ) | (51,912 | ) | (36,142 | ) | |||||||||
| Exchange rate and monetary variations, net | 1,412,237 | (4,463,515 | ) | 3,800,827 | 12,530,891 | |||||||||||
| Interest expenses with financing, loans and debentures, net | 914,766 | 763,490 | 3,207,278 | 3,286,254 | ||||||||||||
| Premium expenses with early settlements | - | - | 260,289 | 391,390 | ||||||||||||
| Capitalized loan costs | (13,564 | ) | (745 | ) | (18,624 | ) | (10,636 | ) | ||||||||
| Accrual of interest on marketable securities | (102,912 | ) | (12,261 | ) | (178,320 | ) | (94,868 | ) | ||||||||
| Amortization of fundraising costs | 16,969 | 29,225 | 107,239 | 101,741 | ||||||||||||
| Derivative losses, net | 307,255 | (2,683,497 | ) | 1,597,662 | 9,422,682 | |||||||||||
| Fair value adjustment of biological assets | (198,558 | ) | (292,751 | ) | (763,091 | ) | (466,484 | ) | ||||||||
| Deferred income tax and social contribution | (265,148 | ) | 2,658,454 | (94,690 | ) | (7,109,120 | ) | |||||||||
| Interest on actuarial liabilities | 13,963 | 13,286 | 55,849 | 53,092 | ||||||||||||
| Provision for judicial liabilities, net | 7,685 | 14,046 | 65,318 | 1,288 | ||||||||||||
| Provision (reversal) for allowance for doubtful accounts, net | (6,322 | ) | 812 | (637 | ) | 6,022 | ||||||||||
| Provision for inventory losses, net | 41,019 | 94,393 | 73,574 | 65,675 | ||||||||||||
| Provision (reversal) for loss of ICMS credits, net | (130,605 | ) | 11,082 | (99,183 | ) | (82,293 | ) | |||||||||
| Tax credits | (72,915 | ) | - | (441,880 | ) | - | ||||||||||
| Other | 6,527 | 9,538 | 26,449 | 35,451 | ||||||||||||
| Decrease (increase) in assets | (1,835,066 | ) | 374,383 | (3,916,667 | ) | 2,250,235 | ||||||||||
| Trade accounts receivables | (1,873,041 | ) | (131,789 | ) | (3,393,787 | ) | 884,451 | |||||||||
| Inventories | 1,980 | 91,186 | (654,757 | ) | 651,203 | |||||||||||
| Recoverable taxes | 224,013 | 397,545 | 186,013 | 659,930 | ||||||||||||
| Other assets | (188,018 | ) | 17,441 | (54,136 | ) | 54,651 | ||||||||||
| Increase (decrease) in liabilities | 451,972 | 342,744 | 1,540,994 | 13,424 | ||||||||||||
| Trade accounts payables | 446,195 | 339,174 | 1,363,478 | 140,480 | ||||||||||||
| Taxes payable | 15,616 | (88,437 | ) | 271,700 | 47,212 | |||||||||||
| Payroll and charges | 40,580 | 13,985 | 97,792 | 92,278 | ||||||||||||
| Other liabilities | (50,419 | ) | 78,022 | (191,976 | ) | (266,546 | ) | |||||||||
| Decrease (increase) in assets | 4,956,199 | 4,588,848 | 20,859,425 | 16,749,409 | ||||||||||||
| Payment of interest with financing, loans and debentures | (319,897 | ) | (361,788 | ) | (2,953,573 | ) | (3,244,949 | ) | ||||||||
| Payment of premium with early settlements | - | 1 | (260,289 | ) | (378,381 | ) | ||||||||||
| Interest received from marketable securities | 44,771 | 40,702 | 98,110 | 186,853 | ||||||||||||
| Payment of income taxes | (24,024 | ) | (58,200 | ) | (106,180 | ) | (188,296 | ) | ||||||||
| Cash provided by operating activities | 4,657,049 | 4,209,563 | 17,637,493 | 13,124,636 | ||||||||||||
| Investing activities | ||||||||||||||||
| Additions to property, plant and equipment | (966,366 | ) | (633,946 | ) | (2,150,584 | ) | (1,503,255 | ) | ||||||||
| Additions to intangible | (69,733 | ) | (881 | ) | (285,278 | ) | (2,307 | ) | ||||||||
| Additions to biological assets | (1,182,650 | ) | (1,075,672 | ) | (3,807,608 | ) | (3,392,298 | ) | ||||||||
| Proceeds from sale of property, plant and equipment | 105,460 | 94,690 | 1,411,251 | 183,504 | ||||||||||||
| Capital increase | - | - | (51,816 | ) | - | |||||||||||
| Marketable securities, net | (2,202,358 | ) | 85,948 | (5,216,921 | ) | 3,841,493 | ||||||||||
| Advance for acquisition (receipt) of wood from operations with development | (64,338 | ) | 47,815 | (257,672 | ) | 135,693 | ||||||||||
| Dividends received | - | - | 6,453 | 753 | ||||||||||||
| Acquisition of non-controlling interests | - | - | (6,516 | ) | - | |||||||||||
| Cash used in investing activities, net | (4,379,985 | ) | (1,482,046 | ) | (10,358,691 | ) | (736,417 | ) | ||||||||
| Fluxos de Caixa das Atividades de Financiamentos | ||||||||||||||||
| Proceeds from loans, financing and debentures | 203,282 | 4,178,624 | 16,991,962 | 14,761,796 | ||||||||||||
| Payment of derivative transactions | (265,997 | ) | (1,318,184 | ) | (1,921,253 | ) | (4,465,640 | ) | ||||||||
| Payment of loans, financing and debentures | (61,495 | ) | (5,340,666 | ) | (15,469,423 | ) | (19,092,810 | ) | ||||||||
| Payment of leases | (314,435 | ) | (247,118 | ) | (1,012,137 | ) | (824,245 | ) | ||||||||
| Payment of dividends | (7,361 | ) | - | (9,683 | ) | - | ||||||||||
| Sale of treasury shares to meet stock-based compensation plan | (2,622 | ) | (13,058 | ) | (153,357 | ) | (164,240 | ) | ||||||||
| Cash provided (used) by financing activities | (448,628 | ) | (2,740,402 | ) | (1,573,891 | ) | (9,785,139 | ) | ||||||||
| Exchange Variation on Cash and Cash Equivalents | 300,373 | (399,242 | ) | 1,050,808 | 982,850 | |||||||||||
| Increase (decrease) in cash and cash equivalents, net | 128,809 | (412,127 | ) | 6,755,719 | 3,585,930 | |||||||||||
| At the beginning for the year | 13,461,967 | 7,247,184 | 6,835,057 | 3,249,127 | ||||||||||||
| At the end for the year | 13,590,776 | 6,835,057 | 13,590,776 | 6,835,057 | ||||||||||||
| Increase (decrease) in cash and cash equivalents, net | 128,809 | (412,127 | ) | 6,755,719 | 3,585,930 | |||||||||||
Page 33 of 36
APPENDIX 5 - EBITDA
| (R$ '000, except where otherwise indicated) | 4Q21 | 4Q20 | 2021 | 2020 | ||||||||||||
| Net income | 2,313,467 | 5,914,351 | 8,635,532 | (10,714,935 | ) | |||||||||||
| Net Financial Result | 2,657,320 | (6,238,407 | ) | 9,347,234 | 26,085,523 | |||||||||||
| Income and Social Contribution Taxes | (216,556 | ) | 2,735,081 | 197,425 | (6,927,194 | ) | ||||||||||
| EBIT | 4,754,231 | 2,411,025 | 18,180,191 | 8,443,394 | ||||||||||||
| Depreciation, Amortization and Depletion | 1,832,940 | 1,761,660 | 7,041,663 | 6,772,780 | ||||||||||||
| EBITDA1 | 6,587,171 | 4,172,685 | 25,221,854 | 15,216,174 | ||||||||||||
| EBITDA Margin | 57.4 | % | 52.1 | % | 61.6 | % | 50.0 | % | ||||||||
| Social actions and operating expenses COVID-19 | 1,376 | 54,884 | 25,285 | 190,698 | ||||||||||||
| Fair Value Update - Biological Asset | (198,558 | ) | (292,751 | ) | (763,091 | ) | (466,484 | ) | ||||||||
| Ibema goodwill write-off | - | - | 125 | - | ||||||||||||
| Write-off of Goodwill on Acquisition of Assets | - | 45,435 | - | 45,435 | ||||||||||||
| Write-off of intangibles | 57,901 | - | 57,901 | - | ||||||||||||
| Tax credits - exclusion of ICMS in the PIS and COFINS calculation basis | (72,915 | ) | - | (441,880 | ) | - | ||||||||||
| Transaction expenses with Fibria | - | 59 | - | 992 | ||||||||||||
| Demobilization of machinery and equipment - FACEPA | - | - | - | 199 | ||||||||||||
| PPA Effect (Write-Off) | - | 5,290 | - | 26,378 | ||||||||||||
| Closing of the Mucuri Project | - | (1,005 | ) | - | 29,679 | |||||||||||
| Equity | 67,911 | (28,740 | ) | (51,912 | ) | (36,142 | ) | |||||||||
| Expenses with ancillary obligations and termination of contracts | - | (1,008 | ) | - | 1,071 | |||||||||||
| Write-off of advance for forestry development program | - | - | 2,702 | - | ||||||||||||
| Provision - Civil Contingency | 32,763 | - | 32,763 | - | ||||||||||||
| Provision - Tax on the transfer of real estate for the regularization of land acquired prior to 2015 | - | - | - | 10,529 | ||||||||||||
| Provision - Complement of ICMS provision | - | 4,363 | - | 2,808 | ||||||||||||
| Provision - ICMS credit loss | (130,605 | ) | 5,714 | (98,683 | ) | (70,756 | ) | |||||||||
| Reversal - Provision of development (Project Losango) | - | - | (9,138 | ) | - | |||||||||||
| Income from the sale and disposal of property, plant and equipment and biological assets | 10,274 | - | (505,003 | ) | (1,092 | ) | ||||||||||
| Adjusted EBITDA | 6,355,317 | 3,964,926 | 23,470,923 | 14,949,489 | ||||||||||||
| Adjusted EBITDA Margin | 55.4 | % | 49.5 | % | 57.3 | % | 49.1 | % | ||||||||
1 The Company's EBITDA is calculated in accordance with CVM Instruction 527 of October 4, 2012.
Page 34 of 36
APPENDIX 6 - Segmented Income Statement
Segmented Financial Statement (R$ '000) | 4Q21 | 4Q20 | ||||||||||||||||||||||||||||||
| Pulp | Paper | Non Segmented | Total Consolidated | Pulp | Paper | Non Segmented | Total Consolidated | |||||||||||||||||||||||||
| Net Revenue | 9,575,959 | 1,894,012 | - | 11,469,971 | 6,546,975 | 1,466,001 | - | 8,012,976 | ||||||||||||||||||||||||
| Cost of Goods Sold | (4,527,352 | ) | (1,165,636 | ) | - | (5,692,988 | ) | (3,915,873 | ) | (967,771 | ) | - | (4,883,644 | ) | ||||||||||||||||||
| Gross Profit | 5,048,607 | 728,376 | - | 5,776,983 | 2,631,102 | 498,230 | - | 3,129,332 | ||||||||||||||||||||||||
| Gross Margin | 52.7 | % | 38.5 | % | - | 50.4 | % | 40.2 | % | 34.0 | % | - | 39.1 | % | ||||||||||||||||||
| Operating Expense/Income | (777,257 | ) | (245,495 | ) | - | (1,022,752 | ) | (594,303 | ) | (124,004 | ) | - | (718,307 | ) | ||||||||||||||||||
| Selling Expenses | (480,120 | ) | (154,801 | ) | - | (634,921 | ) | (467,110 | ) | (122,914 | ) | - | (590,024 | ) | ||||||||||||||||||
| General and Administrative Expenses | (368,906 | ) | (153,855 | ) | - | (522,761 | ) | (336,076 | ) | (143,830 | ) | - | (479,906 | ) | ||||||||||||||||||
| Other Operating Income (Expenses) | 152,270 | 50,571 | - | 202,841 | 230,705 | 92,178 | - | 322,883 | ||||||||||||||||||||||||
| Equity Equivalence | (80,501 | ) | 12,590 | - | (67,911 | ) | (21,822 | ) | 50,562 | - | 28,740 | |||||||||||||||||||||
| EBIT | 4,271,350 | 482,881 | - | 4,754,231 | 2,036,799 | 374,226 | - | 2,411,025 | ||||||||||||||||||||||||
| Depreciation, Amortization & Depletion | 1,665,820 | 167,120 | - | 1,832,940 | 1,596,972 | 164,688 | - | 1,761,660 | ||||||||||||||||||||||||
| EBITDA | 5,937,170 | 650,001 | - | 6,587,171 | 3,633,771 | 538,914 | - | 4,172,685 | ||||||||||||||||||||||||
| EBITDA Margin | 62.0 | % | 34.3 | % | - | 57.4 | % | 55.5 | % | 36.8 | % | - | 52.1 | % | ||||||||||||||||||
| Adjusted EBITDA1 | 5,755,019 | 600,298 | - | 6,355,317 | 3,529,835 | 435,091 | - | 3,964,926 | ||||||||||||||||||||||||
| Adjusted EBITDA Margin1 | 60.1 | % | 31.7 | % | - | 55.4 | % | 53.9 | % | 29.7 | % | - | 49.5 | % | ||||||||||||||||||
| Net Financial Result | - | - | (2,657,320 | ) | (2,657,320 | ) | - | - | 6,238,407 | 6,238,407 | ||||||||||||||||||||||
| Earnings Before Taxes | 4,271,350 | 482,881 | (2,657,320 | ) | 2,096,911 | 2,036,799 | 374,226 | 6,238,407 | 8,649,432 | |||||||||||||||||||||||
| Income and Social Contribution Taxes | - | - | 216,556 | 216,556 | - | - | (2,735,081 | ) | (2,735,081 | ) | ||||||||||||||||||||||
| Net Income (Loss) | 4,271,350 | 482,881 | (2,440,764 | ) | 2,313,467 | 2,036,799 | 374,226 | 3,503,326 | 5,914,351 | |||||||||||||||||||||||
| Net Margin | 44.6 | % | 25.5 | % | 0.0 | % | 20.2 | % | 31.1 | % | 25.5 | % | 0.0 | % | 73.8 | % | ||||||||||||||||
1 Excluding non-recurring items and PPA effects.
Page 35 of 36
| Segmented Financial Statement (R$ '000) | 2021 | 2020 | ||||||||||||||||||||||||||||||
| Pulp | Paper | Non Segmented | Total Consolidated | Pulp | Paper | Non Segmented | Total Consolidated | |||||||||||||||||||||||||
| Net Revenue | 34,715,208 | 6,250,223 | - | 40,965,431 | 25,578,265 | 4,882,012 | - | 30,460,277 | ||||||||||||||||||||||||
| Cost of Goods Sold | (16,727,390 | ) | (3,888,198 | ) | - | (20,615,588 | ) | (15,754,930 | ) | (3,211,401 | ) | - | (18,966,331 | ) | ||||||||||||||||||
| Gross Profit | 17,987,818 | 2,362,025 | - | 20,349,843 | 9,823,335 | 1,670,611 | - | 11,493,946 | ||||||||||||||||||||||||
| Gross Margin | 51.8 | % | 37.8 | % | - | 49.7 | % | 38.4 | % | 34.2 | % | - | 37.7 | % | ||||||||||||||||||
| Operating Expense/Income | (1,690,241 | ) | (479,411 | ) | - | (2,169,652 | ) | (2,409,483 | ) | (641,069 | ) | - | (3,050,552 | ) | ||||||||||||||||||
| Selling Expenses | (1,782,840 | ) | (508,882 | ) | - | (2,291,722 | ) | (1,770,036 | ) | (404,616 | ) | - | (2,174,652 | ) | ||||||||||||||||||
| General and Administrative Expenses | (1,129,597 | ) | (448,312 | ) | - | (1,577,909 | ) | (1,016,093 | ) | (427,099 | ) | - | (1,443,192 | ) | ||||||||||||||||||
| Other Operating Income (Expenses) | 1,223,024 | 425,043 | - | 1,648,067 | 390,178 | 140,972 | - | 531,150 | ||||||||||||||||||||||||
| Equity Equivalence | (828 | ) | 52,740 | - | 51,912 | (13,532 | ) | 49,674 | - | 36,142 | ||||||||||||||||||||||
| EBIT | 16,297,577 | 1,882,614 | - | 18,180,191 | 7,413,852 | 1,029,542 | - | 8,443,394 | ||||||||||||||||||||||||
| Depreciation, Amortization & Depletion | 6,437,832 | 603,831 | - | 7,041,663 | 6,232,376 | 540,404 | - | 6,772,780 | ||||||||||||||||||||||||
| EBITDA | 22,735,409 | 2,486,445 | - | 25,221,854 | 13,646,230 | 1,569,944 | - | 15,216,174 | ||||||||||||||||||||||||
| EBITDA Margin | 65.5 | % | 39.8 | % | - | 61.6 | % | 53.4 | % | 32.2 | % | - | 50.0 | % | ||||||||||||||||||
| Adjusted EBITDA1 | 21,438,604 | 2,032,319 | - | 23,470,923 | 13,484,920 | 1,464,569 | - | 14,949,489 | ||||||||||||||||||||||||
| Adjusted EBITDA Margin1 | 61.8 | % | 32.5 | % | - | 57.3 | % | 52.7 | % | 30.0 | % | - | 49.1 | % | ||||||||||||||||||
| Net Financial Result | - | - | (9,347,234 | ) | (9,347,234 | ) | - | - | (26,085,523 | ) | (26,085,523 | ) | ||||||||||||||||||||
| Earnings Before Taxes | 16,297,577 | 1,882,614 | (9,347,234 | ) | 8,832,957 | 7,413,852 | 1,029,542 | (26,085,523 | ) | (17,642,129 | ) | |||||||||||||||||||||
| Income and Social Contribution Taxes | - | - | (197,425 | ) | (197,425 | ) | - | - | 6,927,194 | 6,927,194 | ||||||||||||||||||||||
| Net Income (Loss) | 16,297,577 | 1,882,614 | (9,544,659 | ) | 8,635,532 | 7,413,852 | 1,029,542 | (19,158,329 | ) | (10,714,935 | ) | |||||||||||||||||||||
| Net Margin | 46.9 | % | 30.1 | % | 0.0 | % | 21.1 | % | 29.0 | % | 21.1 | % | 0.0 | % | -35.2 | % | ||||||||||||||||
1 Excluding non-recurring items and PPA effects.
Page 36 of 36