Exhibit 99.1

Consistent cash generation despite cost pressures and stronger BRL
São Paulo, May 4, 2022. Suzano S.A. (B3: SUZB3 | NYSE: SUZ), one of the world’s largest integrated pulp and paper producers, announces today its consolidated results for the 1st quarter of 2022 (1Q22).
HIGHLIGHTS
| · | Pulp sales of 2,382 thousand tons (-10% vs. 1Q21). |
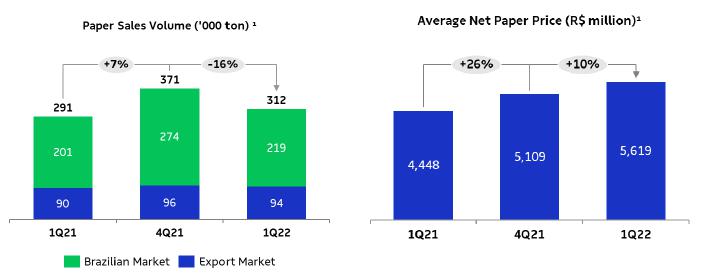
| · | Paper sales³ of 312 thousand tons (+7% vs. 1Q21). |
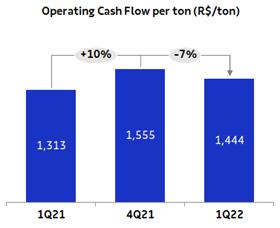
| · | Adjusted EBITDA¹ and Operating cash generation²: R$5.1 billion and R$3.9 billion, respectively. |
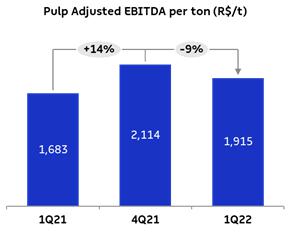
| · | Adjusted EBITDA¹/ton from pulp of R$1,915/ton (+14% vs. 1Q21). |
| · | Adjusted EBITDA¹/ton³ from paper of R$1,797/ton (+31% vs. 1Q21). |
| · | Average net pulp price in export market: US$639/ton (+20% vs. 1Q21). |
| · | Average net paper price³ of R$5,619/ton (+26% vs. 1Q21). |
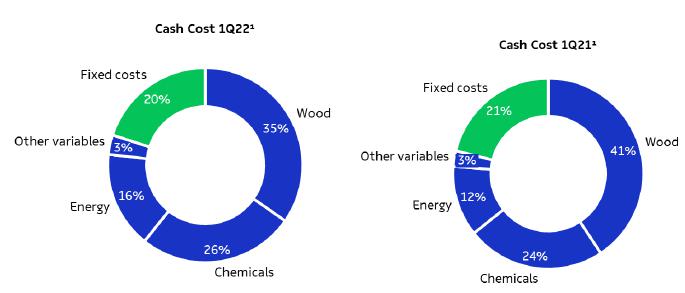
| · | Pulp cash cost ex-downtime of R$868/ton (+39% vs. 1Q21). |
| · | Leverage stable at 2.4 times in USD and down to 2.1 times in BRL. |
| · | In April, the Company announced a purchase agreement (Parkia) in the amount of US$667 million. |
| · | Additional dividends distribution in the amount of R$800 million. |
| Financial Data (R$ million) | | | 1Q22 | | | 4Q21 | | | ΔQ-o-Q | | | 1Q21 | | | ΔY-o-Y | | | LTM 1Q22 | |
| Net Revenue | | | 9,743 | | | 11,470 | | | -15 | % | | 8,889 | | | 10 | % | | 41.819 | |
| Adjusted EBITDA¹ | | | 5,121 | | | 6,355 | | | -19 | % | | 4,864 | | | 5 | % | | 23.728 | |
| Adjusted EBITDA Margin¹ | | | 53 | % | | 55 | % | | -3 p.p. | | | 55 | % | | -2 p.p. | | | 57 | % |
| Net Financial Result | | | 12,935 | | | (2,657 | ) | | - | | | (8,667 | ) | | - | | | 12.255 | |
| Net Income | | | 10,306 | | | 2,313 | | | 347 | % | | (2.755 | ) | | - | | | 21.697 | |
| Operating Cash Generation² | | | 3,890 | | | 4,809 | | | -19 | % | | 3.866 | | | 1 | % | | 18.844 | |
| Net Debt /Adjusted EBITDA¹ (x) - R$ | | | 2.1 x | | | 2.5 x | | | -0.4 x | | | 3.9 x | | | -1.9 x | | | 2.1 x | |
| Net Debt /Adjusted EBITDA¹ (x) - US$ | | | 2.4 x | | | 2.4 x | | | 0.0 x | | | 3.8 x | | | -1.4 x | | | 2.4 x | |
| Operational Data ('000 tons) | | | 1Q22 | | | 4Q21 | | | ΔQ-o-Q | | | 1Q21 | | | ΔY-o-Y | | | LTM 1Q22 | |
| Sales | | | 2,694 | | | 3,093 | | | -13 | % | | 2,945 | | | -9 | % | | 11,629 | |
| Pulp | | | 2,382 | | | 2,722 | | | -13 | % | | 2,653 | | | -10 | % | | 10,314 | |
| Papel3 | | | 312 | | | 371 | | | -16 | % | | 291 | | | 7 | % | | 1,315 | |
1Excludes non-recurring items. | 2Considers Adjusted EBITDA less sustaining capex (cash basis). | 3Considers the results of the Consumer Goods Unit.


The consolidated quarterly information has been prepared in accordance with the Securities and Exchange Commission (CVM) and Accounting Standards Committee (CPC) standards and is in compliance with International Accounting Standard (IFRS) issued by the International Accounting Standard Board (IASB). The data contained in this document was obtained from the financial information as made available to the CVM. The operating and financial information is presented based on consolidated numbers in Reais (R$). Summaries may diverge due to rounding. Non-financial data, such as volume, quantity, average price, average price, in Reais and Dollars, were not reviewed by independent auditors.
CONTENTS
| EXECUTIVE SUMMARY | 3 |
| PULP BUSINESS PERFORMANCE | 3 |
| PULP SALES VOLUME AND REVENUE | 3 |
| PULP CASH COST | 4 |
| PULP SEGMENT EBITDA | 6 |
| OPERATING CASH FLOW FROM THE PULP SEGMENT | 7 |
| PAPER BUSINESS PERFORMANCE | 8 |
| PAPER SALES VOLUME AND REVENUE ¹ | 8 |
| PAPER SEGMENT EBITDA | 9 |
| OPERATING CASH FLOW FROM THE PAPER SEGMENT | 10 |
| FINANCIAL PERFORMANCE | 10 |
| NET REVENUE | 10 |
| CALENDAR OF SCHEDULED MAINTENANCE DOWNTIMES | 11 |
| COST OF GOODS SOLD | 11 |
| SELLING EXPENSES | 12 |
| GENERAL AND ADMINISTRATIVE EXPENSES | 12 |
| DERIVATIVE OPERATIONS | 15 |
| NET INCOME (LOSS) | 18 |
| DEBT | 18 |
| CAPITAL EXPENDITURE | 20 |
| CERRADO PROJECT | 20 |
| OPERATING CASH GENERATION | 21 |
| FREE CASH FLOW | 21 |
| EVOLUTION OF NET DEBT | 22 |
| ESG | 22 |
| TOTAL OPERATIONAL EXPENDITURE - PULP | 22 |
| EVENTS SUBSEQUENT TO THE REPORTING PERIOD | 23 |
| CAPITAL MARKETS | 23 |
| FIXED INCOME | 25 |
| RATING | 25 |
| UPCOMING EVENTS | 26 |
| APPENDICES | 27 |
| APPENDIX 1 - Operating Data | 27 |
| APPENDIX 2 – Consolidated Statement of Income and Goodwill Amortization | 29 |
| APPENDIX 3 – Consolidated Balance Sheet | 30 |
| APPENDIX 4 – Consolidated Statement of Cash Flow | 31 |
| APPENDIX 5 – EBITDA | 32 |
| APPENDIX 6 - Segmented Income Statement | 33 |
| Forward-Looking Statements | 34 |
EXECUTIVE SUMMARY
The first quarter of 2022 was once again marked by significant logistics bottlenecks across global chains and low pulp availability in the market, which drove up pulp prices during the period. The Company maintained its consistent cash generation, although the stronger Real, the continuing increase in global commodity prices and scheduled downtimes played a role in the decline in EBITDA compared to the previous quarter. In the paper segment, EBITDA was a record for a first quarter, driven by the buoyant market in all segments despite higher costs.
With regard to financial management, net debt in USD remained stable in the quarter and leverage in USD, measured by net debt/Adjusted EBITDA in the last twelve months, remained at 2.4 times despite higher capex and dividend payments, compared to last quarter. The result from cash flow hedging operations reaffirmed the long-term consistency of the financial policy in the exchange risk management, with positive mark-to-market and cash adjustments in cash flow operations (ZCC).
Regarding the ESG agenda, the quarter recorded progress with the publication of a new specific policy on Climate Change, available on the Company's investor relations website. On the topic of Corporate Governance, it is worth mentioning the Management's proposal for the Annual General Meeting on the composition of the Board of Directors for the biennium 2022-2023, with 30% gender diversity and mostly independent.
During the quarter, the Cerrado Project followed its physical and financial schedule as planned, maintaining the capex and start of operations expectations as already disclosed to the market.
PULP BUSINESS PERFORMANCE
PULP SALES VOLUME AND REVENUE
The first quarter of the year was marked by positive market fundamentals in which a combination of several factors that mainly affected the supply of pulp in the world. On the demand side, Europe and North America continue to show the solid performance of the main segments with recovery in Tissue demand and greater domestic demand for Printing and Writing, Special and Packaging papers, supported by a lower supply of imported papers to these regions, resulting from the persistent logistical crisis and restriction of international flows. Paper and packaging prices follow an upward trend in all segments.
In China, the quarter saw a steady production pace of Printing & Writing papers (seasonally stronger) and Packaging papers, even during the Chinese New Year period, and a recovery in Tissue production in March, accompanied by increases in prices in all paper segments.
On the supply side, several unexpected factors affected pulp availability in all the regions, they are mainly: i) the persistent global maritime logistics crisis; ii) the disruption of the domestic inbound and outbound logistics chain, starting in British Columbia and later extending to Canada and the United States, and also in Europe, mainly due to the reduction in the availability of truck drivers and rail line operators; iii) truck drivers' strike in Spain affecting local production; iv) strike in Finland impacting pulp production and integrated paper production; v) reduced availability of wood from Russia to Scandinavian countries as a result of sanctions due to the conflict between Russia and Ukraine, as well as loss of certification of Russian wood; vi) concentration of scheduled stoppages in the first quarter, mainly by Latin American producers; vii) postponement of the entry of new capacity in Chile.
In this context, average PIX/FOEX in the quarter for hardwood pulp increased 13% in the Chinese market and by 1% over the already historically high levels in Europe, compared to the previous quarter.
Moreover, the wide gap between softwood and hardwood pulp prices continued, which encouraged the substitution of fibers. According to PIX/FOEX, the difference between softwood and hardwood pulp prices at the end of the quarter was US$165/t in Europe and US$259/t in China.
In this scenario, Suzano’s pulp sales totaled 2,382 thousand tons, down 13% and 10%, respectively, from 4Q21 and 1Q21, reflecting the lower production in the quarter due to maintenance downtimes and low level of inventories.
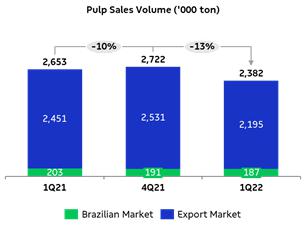
Average net price in USD of pulp sold by Suzano was US$641/t, up 2% from 4Q21. Average net price in the export market was US$639/t (compared to US$630/t in 4Q21 and US$532/t in 1Q21).
Average net price in BRL was R$3,354/ton in 1Q22, increasing 5% from 4Q21, due to the 6% appreciation in average BRL against USD. Compared to the same period the previous year, average net price increased 17%, as a result of the price increase in international market prices.
Net revenue from pulp decreased 17% from 4Q21, due to lower sales volume (-13%), the appreciation in average BRL against USD (6%), which were partially offset by higher net price in USD (+2%). Compared to 1Q21, revenue increased 5% due to the higher price in USD (+23%), partially offset by lower sales volume (-10%) and the 4% increase in average BRL vs. USD.

PULP CASH COST
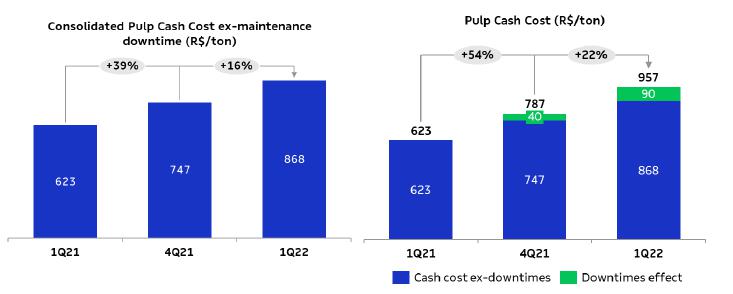
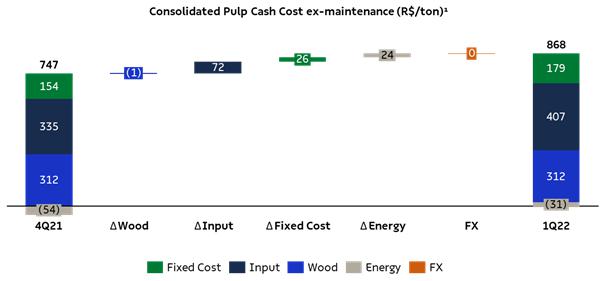
Cash cost excluding downtime in 1Q22 came to R$868/t, 16% higher than in 4Q21, due to: i) higher input costs, mainly on account of higher prices of chemicals (especially of caustic soda as a result of the increase in international prices - IHS, and of chlorine dioxide due to higher sulfuric acid and methanol, components associated with its production) and the impact of Brent energy prices (especially natural gas); ii) the increase in fixed costs due to higher material and service costs and the lower dilution of fixed costs with scheduled downtimes at more efficient mills and greater concentration of routine maintenance during general downtimes; and iii) lower result from utilities due to lower exports, caused by maintenance scheduled downtimes and due to lower price realization. Wood cost remained practically stable, since the negative impact of the higher diesel cost was offset by lower average supply radius and lower share of third-party wood in the period. Despite the appreciation of the average BRL against the USD during the quarter, there was no impact from the exchange rate variation on the cash cost due to the effect of inventory turnover of inputs, which results from a delay of approximately one month between acquisition and consumption.
1Excludes the impact of maintenance and administrative downtimes.
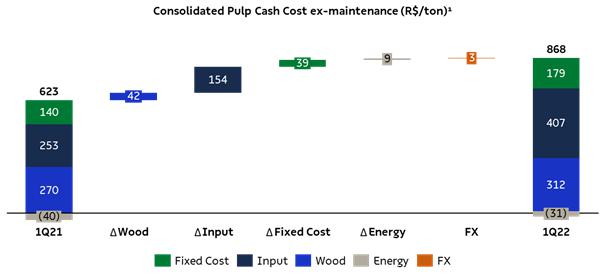
Cash cost excluding downtime in 1Q22 was 39% higher than in 1Q21, due to: i) the increase in input costs on account of the increase in chemical prices (especially caustic soda due to the rise in international prices - IHS and chlorine dioxide price), energy (fuel) prices (higher natural gas and oil prices due to the rise in Brent) and expenses with packaging due to higher steel prices; ii) higher wood costs mainly caused by the increase in diesel prices, which affected harvest and transportation; iii) the increase in fixed costs as a result of higher maintenance costs and lower dilution (absence of downtimes in 1Q21); iv) lower result from utilities on account of lower exports.
1Excludes the impact of maintenance and administrative downtimes.
1Based on cash cost excluding downtimes. Excludes energy sales.
PULP SEGMENT EBITDA
| Pulp segment | | | 1Q22 | | | 4Q21 | | | ΔQ-o-Q | | | 1Q21 | | | ΔY-o-Y | | | LTM 1Q22 | |
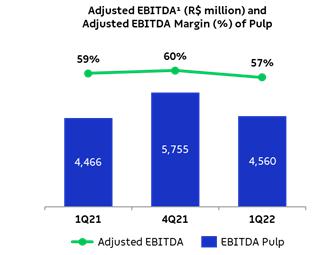
| Adjusted EBITDA (R$ million)¹ | | | 4,560 | | | 5,755 | | | -21 | % | | 4,466 | | | 2 | % | | 21,533 | |
| Sales volume (k ton) | | | 2,382 | | | 2,722 | | | -13 | % | | 2,653 | | | -10 | % | | 10,314 | |
| Pulp adjusted¹ EBITDA (R$/ton) | | | 1,915 | | | 2,114 | | | -9 | % | | 1,683 | | | 14 | % | | 2,088 | |
1Excludes non-recurring items.
Adjusted EBITDA from pulp decreased 21% vs. 4Q21 due to: i) lower sales volume (-13%); ii) increase in average BRL against USD (6%); and iii) higher cash COGS (higher cost of production and higher effect of scheduled maintenance downtimes). These effects were partially offset by the 2% increase in net average price and lower SG&A expenses, in turn caused by lower administrative expenses (lower personnel expenses related to variable compensation and third-party services) and lower selling expenses (lower sales volume and appreciation in average BRL vs. USD). The 9% decline in adjusted EBITDA per ton is due to the exchange rate effect and increase in cash COGS, partially offset by higher prices and lower SG&A expenses.
Compared to 1Q21, the 2% increase in Adjusted EBITDA from pulp is mainly due to the 23% increase in average net price in USD, partially offset by higher cash COGS (higher cost of production and increase in logistics costs caused by the increase in Brent), lower sales volume (-10%) and the appreciation in average BRL against USD (4%). Adjusted EBITDA per ton increased 14% on account of the price factor, partially offset by the increase in cash COGS and by the exchange rate effect.
1Excludes non-recurring items.
OPERATING CASH FLOW FROM THE PULP SEGMENT
| Operating cash flow - Pulp (R$ million) | | | 1Q22 | | | 4Q21 | | | ΔQ-o-Q | | | 1Q21 | | | ΔY-o-Y | | | LTM 1Q22 | |
| Adjusted EBITDA¹ | | | 4,560 | | | 5,755 | | | -21 | % | | 4,466 | | | 2 | % | | 21,533 | |
| Maintenance Capex² | | | (1,132 | ) | | (1,417 | ) | | -20 | % | | (938 | ) | | 21 | % | | (4,509 | ) |
| Operating Cash Flow | | | 3,428 | | | 4,338 | | | -21 | % | | 3,528 | | | -3 | % | | 17,023 | |
1Excludes non-recurring items.
2Cash basis.

Operating cash generation per ton in the pulp segment was 10% lower than in 4Q21, due to the decline in adjusted EBITDA, partially offset by lower sustaining capex. Compared to 1Q21, the 8% increase is due to higher adjusted EBITDA per ton.

PAPER BUSINESS PERFORMANCE
The following data and analyses incorporate the joint results of the paper and consumer goods businesses.
PAPER SALES VOLUME AND REVENUE
According to data published by Brazil's Forestry Industry Association (IBÁ), demand for printing and writing in Brazil grew 1.4% in the first two months of 2022 compared to the same period the previous year.
It is estimated that at the start of the year, around 4.5% of total demand in the printing and writing segment was destined for sales to the cardboard packaging industry. For the rest of the year, there are uncertainties about the continuation of this demand due to the regularization of inventories in the market. Nevertheless, the other segments should offset this effect, with highlights to this year’s elections.
Without this use, domestic sales in the printing and writing segment should have grown 4.4% in the first two months in 2022 compared to the same period the previous year.
Demand for paperboard in Brazil decreased 9% in January and February 2022 compared to the same period the previous year. Important to note that in the beginning of 2021, the demand for paperboard grew above the historical average due to the renewal of inventories after the pandemic period and also due to changes in consumption habits. However, demand for the first two months of 2022, compared to the same period in 2019 (pre-pandemic) shows a growth of 24%, reinforcing a growth trend above the historical average in the period.
Consolidating both market segments (Suzano's accessible paper market), demand decreased 2.3% in the first two months of 2022 in relation to the same period in 2021.
Suzano's paper sales (printing and writing, paperboard and tissue) in the domestic market totaled 219 thousand tons in 1Q22, a 9% increase over 1Q21 and down 20% from 4Q21 due to the historical seasonality of these periods.
Paper sales in the international markets totaled 94 thousand tons, down 3% from 4Q21 and up 4% from 1Q21, accounting for 30% of total sales in 1Q22.
1Includes the Consumer Goods Unit.
Average net price rose 10% from the previous quarter and 26% from 1Q21, due to the increase in both domestic and export prices across all market segments.
Net revenue from paper was R$1,755 million, down 7% from 4Q21, resulting from lower sales volume on account of the seasonality of periods, as mentioned earlier. The 35% increase from 1Q21 was due to price increases in both the domestic and export markets, and due to the strong sales volume for a first quarter.
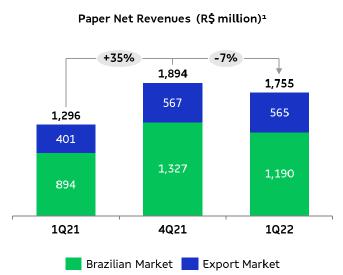
1Includes the Consumer Goods Unit.
PAPER SEGMENT EBITDA
| Paper segment | | | 1Q22 | | | | 4Q21 | | | | ΔQ-o-Q | | | | 1Q21 | | | | ΔY-o-Y | | | | LTM 1Q22 | |
| Adjusted EBITDA (R$ million)¹ | | | 561 | | | | 600 | | | | -7 | % | | | 399 | | | | 41 | % | | | 2,195 | |
| Sales volume (k ton) | | | 312 | | | | 371 | | | | -16 | % | | | 291 | | | | 7 | % | | | 1,315 | |
| Paper adjusted¹ EBITDA (R$/ton) | | | 1,797 | | | | 1,619 | | | | 11 | % | | | 1,368 | | | | 31 | % | | | 1,669 | |
¹Excludes non-recurring items.
Adjusted EBITDA from paper decreased 7% from 4Q21, mainly due to the decrease in sales volume (in turn due to the difference in seasonality between the two quarters) and higher production costs, partially offset by the increase in the average net price. In the analysis of adjusted EBITDA per ton, the 11% increase is due to the higher price level, partially offset by the higher cost.
Compared to 1Q21, the 41% increase was due to the price increase implemented in all product lines, higher sales volume, despite the increase in costs resulting from the macroeconomic scenario. In the analysis of adjusted EBITDA per ton, there was an increase of 31% due to the same factors explained above.

OPERATING CASH FLOW FROM THE PAPER SEGMENT
| Operating cash flow - Paper (R$ million) | | | 1Q22 | | | | 4Q21 | | | | ΔQ-o-Q | | | | 1Q21 | | | | ΔY-o-Y | | | | LTM 1Q22 | |
| Adjusted EBITDA¹ | | | 561 | | | | 600 | | | | -7 | % | | | 399 | | | | 41 | % | | | 2,195 | |
| Maintenance Capex² | | | (99 | ) | | | (129 | ) | | | -23 | % | | | (61 | ) | | | 63 | % | | | (374 | ) |
| Operating Cash Flow | | | 462 | | | | 471 | | | | -2 | % | | | 338 | | | | 37 | % | | | 1,821 | |
¹Excludes non-recurring items.
²Cash basis.
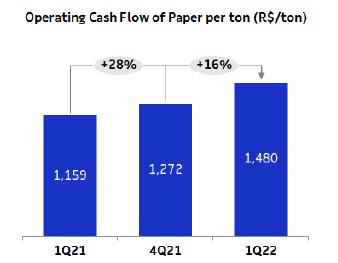
Operating cash generation per ton in the paper segment was R$1,480/t in 1Q22, up 16% from 4Q21, due to higher EBITDA/t and lower Capex in the period. The same factors explain the 28% increase compared to 1Q21.
FINANCIAL PERFORMANCE
NET REVENUE
Suzano’s net revenue in 1Q22 was R$9,743 million, 81% of which came from exports (vs. 83% in 4Q21 and 85% in 1Q21). Compared to 4Q21, the 15% reduction in net revenue was due to lower sales volume (-13%) and the 6% increase in average BRL vs. USD, which were partially offset by higher net average price, especially of pulp. The 10% growth in consolidated net revenue compared to 1Q21 is the result of lower net average price in USD, especially of pulp, partially offset by lower sales volume (-9%) and the 4% appreciation of average BRL vs. USD.
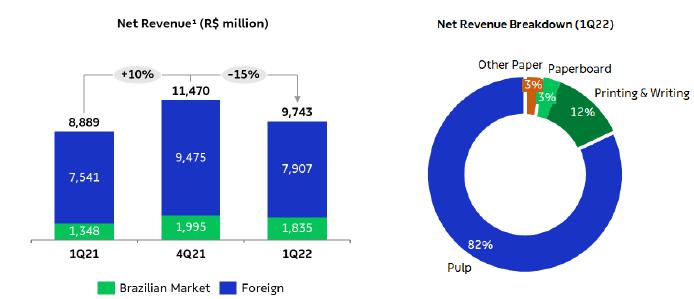
¹Does not include Portocel service revenue.
CALENDAR OF SCHEDULED MAINTENANCE DOWNTIMES
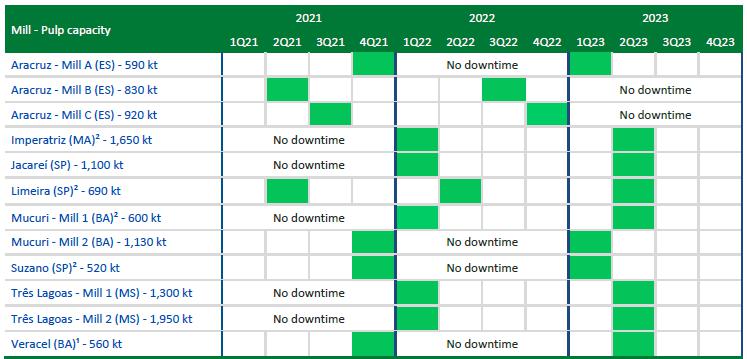
¹ Veracel is a joint operation between Suzano (50%) and Stora Enso (50%) with total annual capacity of 1,120 thousand tons.
² Includes integrated capacities and fluff.
COST OF GOODS SOLD
| COGS (R$ million) | | | 1Q22 | | | | 4Q21 | | | | ΔQ-o-Q | | | | 1Q21 | | | | ΔY-o-Y | | | | LTM 1Q22 | |
| COGS (Income statement) | | | 5,433 | | | | 5,693 | | | | -5 | % | | | 4,845 | | | | 12 | % | | | 21,203 | |
| (-) Depreciation, depletion and amortization | | | 1,463 | | | | 1,568 | | | | -7 | % | | | 1,504 | | | | -3 | % | | | 5,947 | |
| Cash COGS | | | 3,970 | | | | 4,125 | | | | -4 | % | | | 3,341 | | | | 19 | % | | | 15,257 | |
| Sales volume | | | 2,694 | | | | 3,093 | | | | -13 | % | | | 2,945 | | | | -9 | % | | | 11,629 | |
| Cash COGS/ton (R$/ton) | | | 1,474 | | | | 1,333 | | | | 11 | % | | | 1,135 | | | | 30 | % | | | 1,312 | |
Cash COGS in 1Q22 totaled R$3,970 million, or R$1,474/ton. Compared to 4Q21, cash COGS decreased 4%, chiefly due to lower sales volume, partially compensated by the higher cost of production, mainly of pulp, including the greater impact of scheduled maintenance downtimes. COGS per ton increased 11% due to the higher cost of production and the impact of scheduled maintenance downtimes.
Compared to 1Q21, cash COGS increased 19%, chiefly due to the higher cash cost of production and higher Brent prices affecting logistics costs, which were partially offset by lower sales volume (-9%). In relation to the same period last year, cash COGS per ton increased 30% due to the factors mentioned above.
SELLING EXPENSES
| Selling expenses (R$ million) | | | 1Q22 | | | | 4Q21 | | | | ΔQ-o-Q | | | | 1Q21 | | | | ΔY-o-Y | | | | LTM 1Q22 | |
| Selling expenses (Income Statement) | | | 572 | | | | 635 | | | | -10 | % | | | 582 | | | | -2 | % | | | 2,282 | |
| (-) Depreciation, depletion and amortization¹ | | | 238 | | | | 237 | | | | 1 | % | | | 236 | | | | 1 | % | | | 947 | |
| Cash selling expenses | | | 334 | | | | 398 | | | | -16 | % | | | 346 | | | | -3 | % | | | 1,336 | |
| Sales volume | | | 2,694 | | | | 3,093 | | | | -13 | % | | | 2,945 | | | | -9 | % | | | 11,629 | |
| Cash selling expenses/ton (R$/ton) | | | 124 | | | | 129 | | | | -4 | % | | | 118 | | | | 6 | % | | | 115 | |
Cash selling expenses decreased 16% in relation to 4Q21, mainly due to lower sales volume and the increase in average BRL against USD (6%), lower fixed expenses and lower inland logistics expenses. Cash selling expenses per ton decreased 4% mainly due to the exchange rate effect and reduction of fixed and variable expenses, as mentioned above.
Compared to 1Q21, the 3% decrease in cash selling expenses is mainly due to lower sales volume (-9%) and the increase in average BRL against USD (4%), partially offset by the increase in fixed expenses (third party services and labor). Cash selling expenses per ton increased 6% due to the increase of the expenses mentioned above, partially offset by the exchange rate effect.
GENERAL AND ADMINISTRATIVE EXPENSES
| General and Administrative Expenses (R$ million) | | | 1Q22 | | | | 4Q21 | | | | ΔQ-o-Q | | | | 1Q21 | | | | ΔY-o-Y | | | | LTM 1Q22 | |
| General and Administrative Expenses (Income Statament) | | | 336 | | | | 523 | | | | -36 | % | | | 383 | | | | -12 | % | | | 1,532 | |
| (-) Depreciation, depletion and amortization¹ | | | 24 | | | | 27 | | | | -9 | % | | | 26 | | | | -5 | % | | | 103 | |
| Cash general and administrative expenses | | | 312 | | | | 496 | | | | -37 | % | | | 357 | | | | -13 | % | | | 1,429 | |
| Sales volume | | | 2,694 | | | | 3,093 | | | | -13 | % | | | 2,945 | | | | -9 | % | | | 11,629 | |
| Cash general and administrative expenses/t (R$/ton) | | | 116 | | | | 160 | | | | -28 | % | | | 121 | | | | -4 | % | | | 123 | |
Compared to 4Q21, the 37% decrease in cash general and administrative expenses is mainly due to the decline in personnel expenses (variable compensation) and third-party services. On a per-ton basis, these expenses decreased 28% due to the same factors.
Compared to 1Q21, cash general and administrative expenses declined 13%, mainly due to lower expenses with variable compensation, partially offset by higher expenses with maintenance and third-party services. On a per-ton basis, the 4% decrease is explained by the same factors.
Other operating income (expenses) amounted to an expense of R$3 million in 1Q22, compared to income of R$203 million in 4Q21 and R$517 million in 1Q21. The decrease in relation to 4Q21 is mainly due to the absence of the updated fair value of biological assets (which happens in the second and fourth quarter of each year) and the absence of recognition of tax credits related to the right to exclude ICMS from the PIS and COFINS calculation base, which occurred in 4Q21. Compared to 1Q21, the decline is mainly due to lower results from sale of assets, whose effect in 1Q21 was from the sale of land and forests.
ADJUSTED EBITDA
| Consolidated | | | 1Q22 | | | | 4Q21 | | | | ΔQ-o-Q | | | | 1Q21 | | | | ΔY-o-Y | | | | LTM 1Q22 | |
| Adjusted EBITDA (R$ million)¹ | | | 5,121 | | | | 6,355 | | | | -19 | % | | | 4,864 | | | | 5 | % | | | 23,728 | |
| Adjusted EBITDA¹ Margin (%) | | | 53 | % | | | 55 | % | | | -3 p.p. | | | | 55 | % | | | -2 p.p. | | | | 57 | % |
| Sales Volume (k ton) | | | 2,694 | | | | 3,093 | | | | -13 | % | | | 2,945 | | | | -9 | % | | | 11,629 | |
| Consolidated Adjusted EBITDA¹ (R$/ton) | | | 1,901 | | | | 2,055 | | | | -7 | % | | | 1,652 | | | | 15 | % | | | 2,040 | |
¹Excludes non-recurring items.
The 19% decrease in Adjusted EBITDA in 1Q22 compared to 4Q21 is due to lower sales volume (-13%), appreciation of the average BRL against USD (6%) and the 6% increase in cash COGS per ton. These factors were partially offset by the increase in average net price of pulp in USD (+2%) and of paper (+10%); as well as lower SG&A expenses, as mentioned earlier. Adjusted EBITDA per ton decreased 7% due to the exchange rate factor and higher cash COGS, which were partially offset by higher pulp and paper prices and lower SG&A expenses.
Compared to 1Q21, the 5% increase in Adjusted EBITDA was due to the higher net average price of pulp in USD (+23%) and higher paper price (+26%), partially offset mainly by the increase in cash COGS per ton, increase in average BRL against USD (4%) and lower sales volume. Adjusted EBITDA per ton increased 15% due to the price factor, which was partially offset by the foreign exchange effect and higher cash COGS per ton, as explained earlier.
FINANCIAL RESULT
| Financial Result (R$ million) | | | 1Q22 | | | | 4Q21 | | | | ΔQ-o-Q | | | | 1Q21 | | | | ΔY-o-Y | | | | LTM 1Q22 | |
| Financial Expenses | | | (1,050 | ) | | | (1,085 | ) | | | -3 | % | | | (991 | ) | | | 6 | % | | | (4,280 | ) |
| Interest on loans and financing (local currency) | | | (240 | ) | | | (241 | ) | | | -1 | % | | | (132 | ) | | | 81 | % | | | (807 | ) |
| Interest on loans and financing (foreign currency) | | | (652 | ) | | | (673 | ) | | | -3 | % | | | (626 | ) | | | 4 | % | | | (2,534 | ) |
| Capitalized interest¹ | | | 43 | | | | 14 | | | | 214 | % | | | 0 | | | | - | | | | 61 | |
| Other financial expenses | | | (201 | ) | | | (184 | ) | | | 9 | % | | | (233 | ) | | | -14 | % | | | (1.001 | ) |
| Financial Income | | | 158 | | | | 148 | | | | 7 | % | | | 24 | | | | 553 | % | | | 407 | |
| Interest on financial investments | | | 136 | | | | 112 | | | | 21 | % | | | 20 | | | | 581 | % | | | 321 | |
| Other financial income | | | 23 | | | | 36 | | | | -36 | % | | | 4 | | | | 426 | % | | | 85 | |
| Monetary and Exchange Variations | | | 7,631 | | | | (1,412 | ) | | | - | | | | (5,206 | ) | | | - | | | | 9,036 | |
| Foreign exchange variations (Debt) | | | 9,799 | | | | (1,722 | ) | | | - | | | | (5,598 | ) | | | - | | | | 10,549 | |
| Other foreign exchange variations | | | (2,168 | ) | | | 310 | | | | - | | | | 391 | | | | - | | | | (1,513 | ) |
| Derivative income (loss), net² | | | 6,196 | | | | (307 | ) | | | - | | | | (2,494 | ) | | | - | | | | 7,093 | |
| Cash flow hedge | | | 2,322 | | | | (84 | ) | | | - | | | | (1,277 | ) | | | - | | | | (717 | ) |
| Cerrado project hedge | | | 385 | | | | - | | | | - | | | | - | | | | - | | | | 27 | |
| Debt hedge | | | 3,606 | | | | (38 | ) | | | - | | | | (1,185 | ) | | | - | | | | 4,280 | |
| Others³ | | | (117 | ) | | | (185 | ) | | | -37 | % | | | (32 | ) | | | 264 | % | | | (481 | ) |
| Net Financial Result | | | 12,935 | | | | (2,657 | ) | | | - | | | | (8,667 | ) | | | - | | | | 12,255 | |
1Capitalized interest due to work in progress.
2Variation in mark-to-market adjustment (1Q22: R$31 million | 4Q21: -R$6,452 million), plus adjustments paid and received (1Q22 = -R$287 million).
3Includes commodity hedge and embedded derivatives.
Financial expenses were 3% lower than in 4Q21, mainly due to the increase in capitalized interest income in 1Q22, and a reduction in interest expense in foreign currency due to the 10% appreciation of the BRL over the USD, considering the average closing exchange rates for each month of the analyzed periods. These impacts were partially offset by an increase in other financial expenses, in turn due to the variation in the adjustment to present value by IFRS 16. In comparison with 1Q21, the 6% increase originated from the interest line in local currency, whose main index, the CDI, changed from an accumulated rate of 0.48% in 1Q21 to 2.42% in 1Q22. This item was partially offset by capitalized interest income, resulting from the capitalization of the completed stages of the Cerrado Project works.
Financial income grew 7% in relation to 4Q21, due to the increase in CDI in the period, from an accumulated rate of 1.84% in 4Q21 to 2.42% in 1Q22. Compared to 1Q21, the increase is explained by the increase in the Company's cash position, which practically doubled at the end of 1Q22, added to the effect of the positive variation of the CDI on cash in local currency and the increase in remuneration in foreign currency that was of 0.40% in 1Q21 vs. 0.67% in 1Q22.
Inflation adjustment and exchange rate variation had a positive impact of R$7,631 million on the Company’s financial result due to the 15% appreciation of the closing BRL against USD, which impacted the debt in foreign currency, partially offset by the exchange variation of the cash position. Note that the accounting impact of exchange variation on foreign currency debt has a cash impact only on the respective maturities.
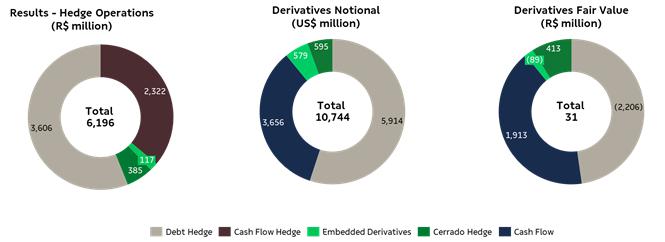
Derivative operations resulted in a gain of R$6,196 million in 1Q22, mainly due to the effect of stronger BRL on debt and cash flow hedge operations, as well as the positive impact of the variation on the fixed, coupon and Libor rate curves on hedging transactions. The mark-to-market adjustment of derivative instruments on March 31, 2022 was positive at R$31 million, compared to an expense of R$6,452 million from the mark-to-market adjustment on December 31, 2021, representing a positive variation of R$6,483 million. Note that the impact of BRL appreciation on the derivatives portfolio generates a cash impact only upon the respective maturities. The net effect on cash, which refers to the maturity of derivative operations in the first quarter, was a negative R$287 million (R$473 million expense from debt hedge and R$186 million gain from operating hedge).
As a result of the above factors, net financial result in 1Q22, considering all financial expense and income lines, was an income of R$12,935 million, compared to an expense of R$2,657 million in 4Q21 and an expense of R$8,667 million in 1Q21.
DERIVATIVE OPERATIONS
Suzano carries out derivative operations exclusively for hedging purposes. The following table reflects the position of derivative instruments on March 31, 2022:
| | | Notional (US$ million) | | | Fair Value (R$ million) | |
| Hedge1 | | Mar/22 | | | Dec/21 | | | Mar/22 | | | Dec/21 | |
| Debt | | | 5,915 | | | | 6,489 | | | | (2,206 | ) | | | (6,286 | ) |
| Cash Flow | | | 3,655 | | | | 3,999 | | | | 1,913 | | | | (222 | ) |
| Cerrado project2 | | | 595 | | | | 525 | | | | 413 | | | | 27 | |
| Others3 | | | 579 | | | | 590 | | | | (89 | ) | | | 28 | |
| Total | | | 10,744 | | | | 11,604 | | | | 31 | | | | (6,452 | ) |
1See note 4 of the 1Q22 Quarterly Financial Statements (ITR) for further details and fair value sensitivity analysis.
2Hedge program related to capex in BRL of the Cerrado Project.
3Includes embedded derivatives.
The Company’s foreign exchange exposure policy seeks to minimize the volatility of its cash generation and to ensure greater flexibility in cash flow management. Currently, the policy stipulates that surplus dollars may be partially hedged (at least 40% and up to 75% of exchange variation exposure over the next 18 months) using plain vanilla instruments such as Zero Cost Collars (ZCC) and Non-Deliverable Forwards (NDF).
Considering the foreign exchange exposure related to Capex in the Cerrado Project, since approximately 67% of Capex is pegged to local currency, the Board of Directors approved on October 28, 2021, a program for contracting additional specific hedge operations to protect from such exposure. The program approved is established in the Derivatives Management Policy available on the Investor Relations website, involving a maximum amount (notional) of up to US$1 billion and a term of operations of up to 36 months. To ensure transparency with regard to the Cerrado Project's hedge program, since 4Q21, the Company has been prominently disclosing the operations contracted.
ZCC transactions establish minimum and maximum limits for the exchange rate that minimize adverse effects in the event of significant appreciation of the BRL. As such, if the exchange rate is within such limits, the Company neither pays nor receives any financial adjustments. This characteristic allows for capturing greater benefits from export revenue in a potential scenario of BRL appreciation versus USD within the range contracted. In cases of extreme BRL appreciation, the Company is protected by the minimum limits, which are considered appropriate for the operation. However, this protection instrument also limits, temporarily and partially, potential gains in scenarios of extreme BRL depreciation when exchange rates exceed the maximum limits contracted.
On March 31, 2022, the outstanding notional value of operations involving forward USD sales through ZCCs related to Cash Flows (including those related to the Cerrado Project) was US$4,250 million, with an average forward rate ranging from R$5.59 to R$6.68 and maturities distributed between April 2022 and August 2024. At the end of 1Q21, the Company did not have forward USD sales through outstanding NDFs. In 1Q22, cash flow and Cerrado Project hedge operations resulted in a gain of R$2,707 million. The mark-to-market adjustment (“MtM” or “fair value”) of ZCC transactions was a gain of R$2,326 million.
The following table presents a sensitivity analysis of the cash impact that the Company could have on its cash flow hedge portfolios (ZCC) if the exchange rate remains the same as at the end of 1Q22 (R$/US$ = 4.74) in the coming quarters, as well as the projected cash impact for R$0.10 variations below/above the strike of put/call options, respectively, defined in each quarter. Note that the figures presented in the table are the Company’s projections based on the end-of-period curves and could vary depending on market conditions.
| | | | | | | | | Cash Adjustment (R$ million) | |
Maturity
(up to) | | Strike Range | | | Notional
(US$ milion) | | | Actual | | | R$ / US$ = 4.74
(1Q22) | | | Sensitivity at R$0.10 /
US$ variation (+/-)1 | |
| | | | | | | | | | | | | | | | |
| Zero Cost Collars | |
| 1T22 | | | - | | | | - | | | | 179 | | | | - | | | | - | |
| 2T22 | | | 5.33 – 6.06 | | | | 971 | | | | - | | | | 578 | | | | 97 | |
| 3T22 | | | 5.34 – 6.07 | | | | 528 | | | | - | | | | 316 | | | | 53 | |
| 4T22 | | | 5.40 – 6.36 | | | | 448 | | | | - | | | | 298 | | | | 45 | |
| 1T23 | | | 5.63 – 7.12 | | | | 672 | | | | - | | | | 596 | | | | 67 | |
| 2T23 | | | 5.85 – 7.10 | | | | 786 | | | | - | | | | 877 | | | | 79 | |
| 3T23 | | | 5.52 – 6.36 | | | | 251 | | | | - | | | | 196 | | | | 25 | |
| Total | | | 5.52 – 6.54 | | | | 3,656 | | | | 179 | | | | 2,861 | | | | 366 | |
| Zero Cost Collars – Cerrado Project |
| 1T22 | | | - | | | | - | | | | - | | | | - | | | | - | |
| 2T23 | | | 5.84 – 7.19 | | | | 167 | | | | - | | | | 184 | | | | 17 | |
| 3T23 | | | 6.00 – 7.60 | | | | 205 | | | | - | | | | 259 | | | | 21 | |
| 4T23 | | | 6.12 – 7.74 | | | | 144 | | | | - | | | | 200 | | | | 14 | |
| 1T24 | | | 6.30 – 7.91 | | | | 36 | | | | - | | | | 56 | | | | 4 | |
| 2T24 | | | 6.37 – 8.05 | | | | 34 | | | | - | | | | 56 | | | | 3 | |
| 3T24 | | | 6.35 – 8.34 | | | | 9 | | | | - | | | | 15 | | | | 1 | |
| Total | | | 6.03 – 7.58 | | | | 595 | | | | - | | | | 770 | | | | 60 | |
1Note: sensitivity of adjustments for exchange rates above the strike.
To mitigate the effects of exchange and interest rate variations on its debt and its cash flows, the Company also uses currency and interest rate swaps. Swap contracts are entered into considering different interest rates and inflation indices in order to mitigate the mismatch between financial assets and liabilities.
On March 31, 2022, the Company had an outstanding amount (notional value) of US$5,915 million in swap contracts as shown in the table below. In 1Q22, the result of debt hedge transactions was a gain of R$3,606 million, mainly due to the appreciation of BRL versus the USD in the period. The mark-to-market adjustment (fair value) of these operations was a loss of R$2,206 million
| | | | | | | | Notional (US$ million) | | | Fair value (R$ million) | |
| Debt Hedge | | Maturity
(up to) | | | Currency | | Mar/22 | | | Dec/21 | | | Mar/22 | | | Dec/21 | |
| Swap (PRÉ x USD) | | | 2024 | | | USD | | | 350 | | | | 350 | | | | (420 | ) | | | (761 | ) |
| Swap (CDI x USD) | | | 2026 | | | USD | | | 2,065 | | | | 2,267 | | | | (2,413 | ) | | | (5,231 | ) |
| Swap (IPCA x USD) | | | 2023 | | | USD | | | 121 | | | | 121 | | | | (1 | ) | | | (149 | ) |
| Swap (LIBOR x USD) | | | 2027 | | | USD | | | 3,200 | | | | 3,600 | | | | 347 | | | | (396 | ) |
| Swap (IPCA x CDI) | | | 2023 | | | BRL | | | 178 | 1 | | | 151 | | | | 281 | | | | 250 | |
| Total | | | | | | | | | 5,915 | | | | 6,489 | | | | (2,206 | ) | | | (6,286 | ) |
1Translated at the closing exchange rate (4.74)
The following table presents a sensitivity analysis1 of the cash impact that the Company could have on its debt hedge portfolio (swaps) if the exchange rate remains the same as at the end of 1Q22 (R$/US$ = 4.74) in the coming quarters, as well as the projected variation in cash impact for each R$ 0.10 variation on the same reference exchange rate (1Q22). Note that the figures presented in the table are the Company’s projections based on the end-of-period curves and could vary depending on market conditions.
| | | | | | Cash Adjustment (R$ million) | |
| Maturity (up to) | | Notional
(US$ million) | | | Actual | | | R$ / US$ = 4.74
(1Q22) | | | Sensitivity at
R$ 0.10 /US$ variation (+/-)1 | |
| 1Q22 | | | - | | | | (473 | ) | | | - | | | | - | |
| 2Q22 | | | 83 | | | | - | | | | 72 | | | | 6 | |
| 3Q22 | | | 285 | | | | - | | | | (155 | ) | | | 23 | |
| 4Q22 | | | 83 | | | | - | | | | 131 | | | | 4 | |
| 2023 | | | 1,876 | | | | - | | | | 623 | | | | 41 | |
| 2024 | | | 1,400 | | | | - | | | | 90 | | | | 41 | |
| 2025 | | | 1,305 | | | | - | | | | (527 | ) | | | 89 | |
| >2026 | | | 882 | | | | - | | | | (688 | ) | | | 85 | |
| Total | | | 5,915 | | | | (473 | ) | | | (454 | ) | | | 289 | |
1Sensitivity analysis considers variation only in the exchange rate (R$/US$), while other variables are presumed constant.
Other transactions involving the Company’s derivatives are related to the embedded derivative resulting from forestry partnerships and commodity hedges, as shown in the table.
| | | | | | | | Notional
(US$ million) | | | Fair value
(R$ million) | | | Cash adjustment (R$
million) | |
| Other hedges | | Maturity
(up to) | | | Index | | Mar/22 | | | Dec/21 | | | Mar/22 | | | Dec/21 | | | Mar/22 | | | Dec/21 | |
| Embedded derivative | | 2035 | | | Fixed Dollar |
US-CPI Dollar | | | 579 | | | | 590 | | | | (89 | ) | | | 28 | | | | - | | | | - | |
| Total | | | | | | | | | 579 | | | | 590 | | | | (89 | ) | | | 28 | | | | - | | | | - | |
Forestry partnership agreements and wood supply agreements signed on December 31, 2013 are denominated in USD per cubic meter of standing timber, adjusted by U.S. inflation measured by the Consumer Price Index (CPI), which is not related to inflation in the economic environment where the forests are located and, hence, constitutes an embedded derivative. This instrument, presented in the table above, consists of a sale swap contract of the variations in the US-CPI during the period of the contracts mentioned below. See note 4 of the 1Q22 Financial Statements for more details and for a sensitivity analysis of the fair value in case of a sharp rise in the US-CPI. On March 31, 2022, the outstanding (notional) value of the operation was US$579 million. The result of this swap in 1Q22 was a loss of R$117 million. The mark-to-market (fair value) of such operations was negative by R$89 million at the end of the quarter.
The Company is also exposed to the price of some commodities and, therefore, continually assesses the contracting of derivative financial instruments to mitigate such risks.
On March 31, 2022, the Company did not have any open commodity hedge transactions. There was no result from these transactions in 1Q22.
NET INCOME (LOSS)
In 1Q22, the Company posted net income of R$10,306 million, compared to R$2,313 million in 4Q21 and net loss of R$2,755 million in 1Q21. The improved performance in relation to 4Q21 and 1Q21 was due to the positive financial result which, in turn, was caused by the positive effect of exchange rate variation on debt and mark-to-market adjustment of derivative operations in relation to the two periods.
DEBT
| Debt (R$ million) | | | 1Q22 | | | | 4Q21 | | | | ΔQ-o-Q | | | | 1Q21 | | | | ΔY-o-Y | |
| Local Currency | | | 13,221 | | | | 13,641 | | | | -3 | % | | | 13,295 | | | | -1 | % |
| Short Term | | | 1,171 | | | | 1,849 | | | | -37 | % | | | 1,027 | | | | 14 | % |
| Long Term | | | 12,050 | | | | 11,791 | | | | 2 | % | | | 12,268 | | | | -2 | % |
| Foreign Currency | | | 55,545 | | | | 65,988 | | | | -16 | % | | | 62,619 | | | | -11 | % |
| Short Term | | | 1,045 | | | | 1,806 | | | | -42 | % | | | 1,117 | | | | -6 | % |
| Long Term | | | 54,500 | | | | 64,182 | | | | -15 | % | | | 61,503 | | | | -11 | % |
| Gross Debt | | | 68,766 | | | | 79,629 | | | | -14 | % | | | 75,914 | | | | -9 | % |
| (-) Cash | | | 19,097 | | | | 21,349 | | | | -11 | % | | | 9,599 | | | | 99 | % |
| Net debt | | | 49,669 | | | | 58,280 | | | | -15 | % | | | 66,315 | | | | -25 | % |
| Net debt/Adjusted EBITDA¹(x) - R$ | | | 2.1 | x | | | 2.5 | x | | | -0.3 | x | | | 3.9 | x | | | -1.8 | x |
| Net debt/Adjusted EBITDA¹(x) - US$ | | | 2.4 | x | | | 2.4 | x | | | -0.3 | x | | | 3.8 | x | | | -1.9 | x |
1Excludes non-recurring items.
On March 31, 2022, gross debt totaled R$68.8 billion and was composed of 97% long-term maturities and 3% short-term maturities. Foreign currency debt corresponded to 81% of the Company's total debt at the end of the quarter. The percentage of gross debt denominated in foreign currency, considering the effect of debt hedge, was 96%. Gross debt decreased 14% (R$10.9 billion) in relation to 4Q21, mainly due to the appreciation of closing BRL against USD and the maturity of a CRA debt (R$762 million of principal and interest).
Suzano contracts debt in foreign currency as a natural hedge, since net operating cash generation is mostly denominated in foreign currency (USD) due to its predominant status as an exporter. This structural exposure allows the Company to match loans and financing payments in USD with receivable flows from sales.
*Corresponding mainly to transaction costs (issue, funding etc.).
On March 31, 2022, the total average cost of debt in USD was 4.4% p.a. (considering debt in BRL adjusted by the market swap curve), compared to 4.3% p.a. on March 31, 2021. The average term of consolidated debt at the end of the quarter was 87 months vs. 89 months at the end of December 2021.
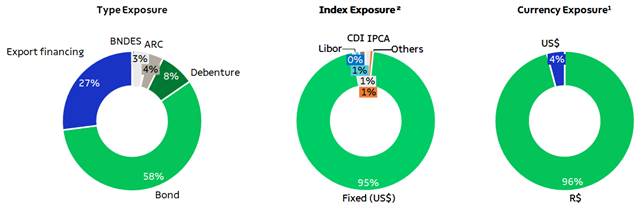
1Considers the portion of debt with currency swaps. The original debt was 81% denominated in USD and 19% in BRL.
2Considers the portion of debt with currency swaps. The exposure of the original debt was: Fixed (US$) – 58%, Libor – 22%, CDI – 12%, Other (Fixed R$, IPCA, TJLP, others) – 8%.
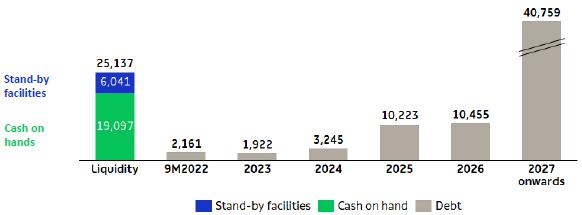
Cash and cash equivalents and financial investments on March 31, 2022 amounted to R$19.1 billion, 74% of which were in foreign currency, allocated to remunerated account or in short-term fixed-income investments. The balance 26% was invested in local currency fixed-income bonds (mainly CDBs, but also in government bonds and others), remunerated at the CDI rate.
On March 31, 2022, the Company also had two stand-by credit facilities totaling R$6 billion (US$1.3 billion in foreign currency) available through February 2024 (US$100 million) and February 2027 (US$1.2 billion). These facilities strengthen the company's liquidity position and can be withdrawn during times of uncertainty. As a result, the cash and equivalents of R$19.1 billion plus the credit facilities described above amounted to a readily available cash position of R$25.1 billion on March 31, 2022.

On March 31, 2022, net debt stood at R$49.7 billion (US$10.5 billion), compared to R$58.3 billion (US$10.4 billion) on December 31, 2021. The net debt reduction in local currency came from the exchange variation during the period.
Financial leverage, measured as the ratio of net debt to Adjusted EBITDA in BRL, stood at 2.1 times on March 31, 2022 (2.5 times in 4Q21). The same ratio in USD, a measure established in Suzano’s financial policy, remained at 2.4 times on March 31, 2022 (2.4 times in 4Q21).
The breakdown of total gross debt between trade and non-trade finance on March 31, 2022 is shown below:
| | | 2022 | | | 2023 | | | 2024 | | | 2025 | | | 2026 | | | 2027 onwards | | | Total | |
| Trade Finance¹ | | | 35 | % | | | 0 | % | | | 96 | % | | | 57 | % | | | 50 | % | | | 9 | % | | | 27 | % |
| Non Trade Finance² | | | 65 | % | | | 100 | % | | | 4 | % | | | 43 | % | | | 50 | % | | | 91 | % | | | 73 | % |
¹ECN, EPP
²Bonds, BNDES, CRA, Debentures, among others.
CAPITAL EXPENDITURE
In 1Q22, capital expenditure (cash basis) totaled R$2,683 million, up 21% from 4Q21, chiefly due to higher investments in the Cerrado Project, partially offset mainly by lower sustaining capex. Compared to 1Q21, the increase is also due to higher investments in the Cerrado Project and higher maintenance costs, which, in turn, were caused by higher investments in forest maintenance.
| Investiments (R$ million) | | | 1Q22 | | | | 4Q21 | | | | ΔQ-o-Q | | | | 1Q21 | | | | ΔY-o-Y | | | | LTM 1Q22 | | | | Guidance 2022 | |
| Maintenance | | | 1,231 | | | | 1,546 | | | | -20 | % | | | 999 | | | | 23 | % | | | 4,884 | | | | 5,036 | |
| Industrial maintenance | | | 184 | | | | 333 | | | | -45 | % | | | 149 | | | | 23 | % | | | 813 | | | | 1,265 | |
| Forestry maintenance | | | 1,037 | | | | 1,164 | | | | -11 | % | | | 845 | | | | 23 | % | | | 3,970 | | | | 3,753 | |
| Others | | | 10 | | | | 49 | | | | -80 | % | | | 5 | | | | 93 | % | | | 101 | | | | 18 | |
| Expansion and modernization | | | 84 | | | | 114 | | | | -26 | % | | | 27 | | | | 212 | % | | | 276 | | | | 489 | |
| Land and forestry | | | 90 | | | | 133 | | | | -33 | % | | | 184 | | | | -51 | % | | | 350 | | | | 604 | |
| Port terminals | | | 45 | | | | 68 | | | | -34 | % | | | 93 | | | | -51 | % | | | 232 | | | | 119 | |
| Others | | | 1 | | | | 11 | | | | - | | | | - | | | | - | | | | 11 | | | | 92 | |
| Cerrado Project | | | 1,232 | | | | 348 | | | | 254 | % | | | 21 | | | | - | | | | 1,950 | | | | 7,276 | |
| Total | | | 2,683 | | | | 2,220 | | | | 21 | % | | | 1,323 | | | | 103 | % | | | 7,702 | | | | 13,616 | |
CERRADO PROJECT
The Cerrado Project is progressing as scheduled, closing the first quarter of 2022 with the “inside the fence” execution (which corresponds to industrial and infrastructure investments) reaching physical progress of 10%, which is in line with the respective financial disbursements.
OPERATING CASH GENERATION
| Operating cash flow - Consolidated (R$ million) | | | 1Q22 | | | | 4Q21 | | | | ΔQ-o-Q | | | | 1Q21 | | | | ΔY-o-Y | | | | LTM 1Q22 | |
| Adjusted EBITDA¹ | | | 5,121 | | | | 6,355 | | | | -19 | % | | | 4,864 | | | | 5 | % | | | 23,728 | |
| Maintenance Capex² | | | (1,231 | ) | | | (1,546 | ) | | | -20 | % | | | (999 | ) | | | 23 | % | | | (4,884 | ) |
| Operating Cash Flow | | | 3,890 | | | | 4,809 | | | | -19 | % | | | 3,866 | | | | 1 | % | | | 18,844 | |
| Operating Cash Flow (R$/ton) | | | 1,444 | | | | 1,555 | | | | -7 | % | | | 1,313 | | | | 10 | % | | | 1,620 | |
¹Excludes non-recurring items.
²Cash basis.
Operating cash generation, measured by adjusted EBITDA less sustaining capex (cash basis), amounted to R$3.9 billion in 1Q22. The 7% decline in operating cash generation per ton in relation to 4Q21 is due to lower adjusted EBITDA per ton, partially offset by lower sustaining capex per ton. The 10% increase in relation to 1Q21 is due to the growth in adjusted EBITDA, as mentioned earlier, partially offset by higher sustaining capex per ton.
FREE CASH FLOW
| Free Cash Flow (R$ million) | | | 1Q22 | | | | 4Q21 | | | | ΔQ-o-Q | | | | 1Q21 | | | | ΔY-o-Y | | | | LTM 1Q22 | |
| Adjusted EBITDA | | | 5,121 | | | | 6,355 | | | | -19 | % | | | 4,864 | | | | 5 | % | | | 23,728 | |
| (-) Total Capex¹ | | | (2,734 | ) | | | (2,219 | ) | | | 23 | % | | | (969 | ) | | | 182 | % | | | (8,009 | ) |
| (-) Leases contracts | | | (255 | ) | | | (314 | ) | | | -19 | % | | | (249 | ) | | | 2 | % | | | (1,018 | ) |
| (+/-)Δ Working capital | | | 920 | | | | (1,383 | ) | | | - | | | | (518 | ) | | | - | | | | (939 | ) |
| (-) Net interest² | | | (1,312 | ) | | | (275 | ) | | | 377 | % | | | (1,194 | ) | | | 10 | % | | | (3,233 | ) |
| (-) Income taxes | | | (70 | ) | | | (24 | ) | | | 190 | % | | | (35 | ) | | | 98 | % | | | (141 | ) |
| (-) Dividend payment | | | (1,000 | ) | | | (7 | ) | | | - | | | | 0 | | | | - | | | | (1,009 | ) |
| (-) Derivative cash adjustment | | | (287 | ) | | | (266 | ) | | | 8 | % | | | (713 | ) | | | -60 | % | | | (1,496 | ) |
| Free cash flow | | | 383 | | | | 1,867 | | | | -79 | % | | | 1,187 | | | | -68 | % | | | 7,883 | |
| (+) Capex ex-maintenance | | | 1,564 | | | | 690 | | | | 127 | % | | | 101 | | | | 1456 | % | | | 2,993 | |
| (+) Dividend payment | | | 1,000 | | | | 7 | | | | - | | | | 0 | | | | - | | | | 1,009 | |
| Free cash flow – Adjusted³ | | | 2,947 | | | | 2,564 | | | | 15 | % | | | 1,288 | | | | 129 | % | | | 11,886 | |
¹Accrual basis.
²Considers interest paid on debt, interest received on financial investments and premiums paid resulting from liability management operations.
3Free cash flow prior to dividend payments and capex ex-maintenance (accrual basis).
Adjusted free cash flow stood at R$2,947 million in 1Q22, compared to R$2,564 million in 4Q21 and R$1,288 million in 1Q21. Compared to the previous period, free cash flow increased 15% due to higher working capital and lower sustaining capex. These effects were partially offset chiefly by the decrease in adjusted EBITDA and higher concentration of interest payments. Note the increase in working capital, especially in accounts receivable (increase in receivables discounting operations, decrease in sales volume and foreign exchange effect).
Compared to 1Q21, the 129% increase was caused by the increase in working capital, lower payments resulting from derivative adjustments and higher adjusted EBITDA, partially offset by the increase in sustaining capex and higher net interest payments (higher payments with bonds due to the issues of bonds 2028 and 2032).
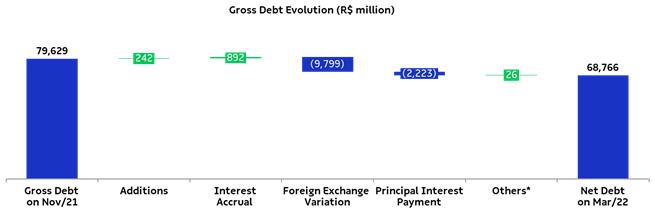
EVOLUTION OF NET DEBT
The changes in net debt in 1Q22 were:
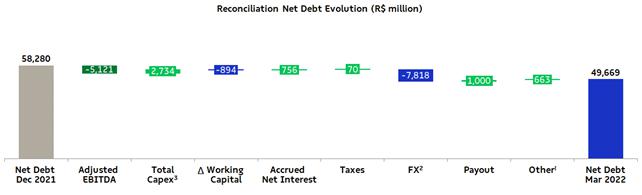
¹Considers amounts related to derivative adjustments, lease agreements and other items.
²Net of exchange variations on cash and financial investments.
³Accrual basis.
ESG
The ESG agenda made further progress in 1Q21. The Company has published a new specific policy on Climate Change, available on its investor relations website. On the topic of Corporate Governance, it is worth mentioning the Management's proposal for the Annual Shareholders' Meeting on the composition of the Board of Directors for the 2022-2023 biennium, with 30% gender diversity and mostly independent.
On the forest front, as a result of work started in 2021, more than 30,000 hectares of Areas of High Value for Conservation (HCVA) by Suzano were registered. These areas are voluntarily identified and protected by the Company, where special forms of management and protection of their values are established. In this way, Suzano has already identified 74 areas defined as HCVA and 7 Private Natural Heritage Reserves¹, totaling more than 90 thousand hectares considered of global importance for the conservation of biodiversity in the three biomes in which the Company operates (Atlantic, Cerrado and Amazonia).
1IV category of the International Union for Conservation of Nature (IUCN)
TOTAL OPERATIONAL EXPENDITURE - PULP
As disclosed through a Material Fact notice on March 30, 2022, the estimated total operating expenditure for 2027 remains at approximately R$1,500/t and the evolution of the indicator continues as planned, considering the foreign exchange and monetary assumptions used.
EVENTS SUBSEQUENT TO THE REPORTING PERIOD
On April 25, Suzano has approved during the Annual Ordinary and Extraordinary Shareholders’ Meetings the distribution of supplementary dividends by the Company, in a total amount of R$ 800 million (R$ 0,592805521 per share). The payment of the supplementary dividends will be made on May 13th, 2022, in national currency, based on the shareholding position held at the end of B3 S.A. trading session, inclusive. The Company’s shares shall be traded “ex-dividend” as of May 5, 2022, inclusive.
On April 28, the Company announced the execution of an agreement for the purchase and sale of equity interest between, on the one hand, as Buyer, the Company and, on the other hand, as sellers, Investimentos Florestais Fundo de Investimento em Participações Multiestratégia, and Arapar Participações S.A., as well as the Target Companies as consenting parties, for whereby the terms and conditions for the acquisition, by the Company, on the closing date, of all the shares held by the Sellers in the following companies were established: (a) Vitex SP Participações S.A.; (b) Vitex BA Participações S.A.; (c) Vitex ES Participações S.A.; (d) Vitex MS Participações S.A.; (e) Parkia SP Participações S.A.; (f) Parkia BA Participações S.A.; (g) Parkia ES Participações S.A.; and (h) Parkia MS Participações S.A..
In consideration for the shares of the target Companies, the Company committed to pay a base price equivalent in BRL to US$667 million (associated with 206 thousand hectares) in 2 installments, the first being due at the closing of the transaction and the second after 12 months from the closing of the transaction. The base price is subject to post-closing price adjustments, based on the change in net debt and working capital of the target Companies.
The conclusion of the transaction is subject to the verification of precedent conditions, commonly practiced by the market in this type of transaction, including the approval of the Transaction by the Administrative Council for Economic Defense (CADE) and the approval by Organs corporate bodies of the Parties.
The Company already uses the existing forestry assets in the target Companies through forest partnership agreements entered into in 2013 by its predecessor, Fibria Celulose S.A. The operation is in line with Suzano’s strategy of being “best-in-class” in terms of total pulp cost, by reducing expenditure on the purchase of wood, as well as guaranteeing a forest base in areas that are strategic to its operations in the long term.
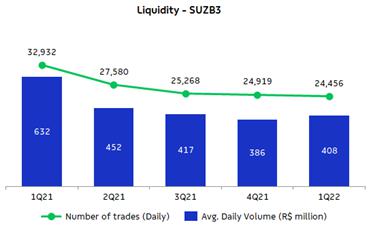
CAPITAL MARKETS
On March 31, 2022, Suzano’s stock was quoted at R$55.15/share (SUZB3) and US$11.62/share (SUZ). The Company’s stock is listed on the Novo Mercado, the listing segment of the São Paulo Stock Exchange (B3 – Brasil, Bolsa e Balcão) with the highest corporate governance standards, and on the New York Stock Exchange (NYSE) - Level II. The stock performance as of January 19, 2022 considers the adjustment due to the payment of dividends (“ex” date for dividends paid on January 27, 2022).

Source: Bloomberg.
Source: Bloomberg.
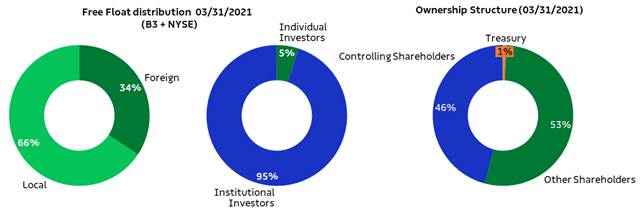
On March 31, 2022, the capital stock of the Company was represented by 1,361,263,584 common shares, of which 11,911,569 were held in treasury. Suzano’s market capitalization on March 31, 2022 (ex-treasury) stood at R$74.4 billion. Free float in 1Q22 corresponded to 53% of total capital.
FIXED INCOME
| | | Unit | | | Dec/21 | | | Sep/21 | | | Dec20 | | | Δ Q-o-Q | | | Δ Y-o-Y | |
| Fibria 2025 - Price | | | USD/k | | | | 101.67 | | | | 105.23 | | | | 107.27 | | | | -3.4 | % | | | -5.2 | % |
| Fibria 2025 - Yield | | | % | | | | 3.36 | | | | 2.21 | | | | 1.99 | | | | 52.4 | % | | | 68.8 | % |
| Suzano 2026 - Price | | | USD/k | | | | 107.18 | | | | 114.31 | | | | 117.34 | | | | -6.2 | % | | | -8.7 | % |
| Suzano 2026 - Yield | | | % | | | | 3.91 | | | | 2.40 | | | | 2.25 | | | | 63.2 | % | | | 74.2 | % |
| Fibria 2027 - Price | | | USD/k | | | | 106.03 | | | | 112.26 | | | | 114.17 | | | | -5.5 | % | | | -7.1 | % |
| Fibria 2027 - Yield | | | % | | | | 4.10 | | | | 2.87 | | | | 2.83 | | | | 42.8 | % | | | 45.0 | % |
| Suzano 2028 - Price | | | USD/k | | | | 90.26 | | | | 96.81 | | | | - | | | | -6.8 | % | | | - | |
| Suzano 2028 - Yield | | | % | | | | 4.24 | | | | 3.03 | | | | - | | | | 40.0 | % | | | - | |
| Suzano 2029 - Price | | | USD/k | | | | 107.85 | | | | 116.01 | | | | 117.32 | | | | -7.0 | % | | | -8.1 | % |
| Suzano 2029 - Yield | | | % | | | | 4.64 | | | | 3.42 | | | | 3.44 | | | | 35.6 | % | | | 34.7 | % |
| Suzano 2030 - Price | | | USD/k | | | | 102.29 | | | | 110.07 | | | | 110.26 | | | | -7.1 | % | | | -7.2 | % |
| Suzano 2030 - Yield | | | % | | | | 4.65 | | | | 3.55 | | | | 3.62 | | | | 31.0 | % | | | 28.2 | % |
| Suzano 2031 - Price | | | USD/k | | | | 94.06 | | | | 102.00 | | | | 103.38 | | | | -7.8 | % | | | -9.0 | % |
| Suzano 2031 - Yield | | | % | | | | 4.58 | | | | 3.49 | | | | 3.34 | | | | 31.2 | % | | | 37.0 | % |
| Suzano 2032 - Price | | | USD/k | | | | 88.98 | | | | 97.14 | | | | - | | | | -8.4 | % | | | - | |
| Suzano 2032 - Yield | | | % | | | | 4.53 | | | | 3.46 | | | | - | | | | 30.8 | % | | | - | |
| Suzano 2047 - Price | | | USD/k | | | | 112.78 | | | | 127.06 | | | | 127.93 | | | | -11.2 | % | | | -11.8 | % |
| Suzano 2047 - Yield | | | % | | | | 6.01 | | | | 5.08 | | | | 5.06 | | | | 18.1 | % | | | 18.8 | % |
| Treasury 10 years | | | % | | | | 2.34 | | | | 1.51 | | | | 1.74 | | | | 54.8 | % | | | 34.3 | % |
Note: Senior Notes issued with face value of 100 USD/k.
RATING
| Agency | | National Scale | | Global Scale | | | Outlook | |
| Fitch Ratings | | AAA | | BBB- | | | Stable | |
| Standard & Poor’s | | br.AAA | | BBB- | | | Stable | |
| Moody’s | | Aaa.br | | Baa3 | | | Stable | |
UPCOMING EVENTS
Earnings Conference Call (1Q22)
Date: May 5, 2022 (Thursday)
| Portuguese (simultaneous translation) | English |
| 10:00 a.m. (Brasília) | 10:00 a.m. (Brasília) |
| 9:00 a.m. (New York) | 9:00 a.m. (New York) |
| 2:00 p.m. (London) | 2:00 p.m. (London) |
| Tel.: +55 (11) 4090-1621 | Tel.: +1 844 204 8942 |
Please connect 10 minutes before the conference call is scheduled to begin.
The conference call will be held in English and feature a presentation, with simultaneous webcast. The access links will be available on the Company’s Investor Relations website www.suzano.com.br/ir.
If you are unable to participate, the webcast link will be available for future consultation on the Investor Relations website of Suzano S.A.
ESG Call
Date: June 23, 2022 (Thursday)
IR CONTACTS
Marcelo Bacci
Camila Nogueira
Larissa Barbosa
Luísa Puccini
Mariana Dutra
Roberto Costa
Tel.: +55 (11) 3503-9330
ri@suzano.com.br
www.suzano.com.br/ir
APPENDICES
APPENDIX 1 - Operating Data
| Revenue Breakdown (R$ '000) | | 1Q22 | | | 4Q21 | | | Δ Q-o-Q | | | 1Q21 | | | Δ Y-o-Y | |
| Exports | | | 7,907,380 | | | | 9,474,662 | | | | -17 | % | | | 7,540,691 | | | | 5 | % |
| Pulp | | | 7,342,773 | | | | 8,907,877 | | | | -18 | % | | | 7,139,229 | | | | 3 | % |
| Paper | | | 564,607 | | | | 566,785 | | | | 0 | % | | | 401,462 | | | | 41 | % |
| Domestic Market | | | 1,835,455 | | | | 1,995,309 | | | | -8 | % | | | 1,348,475 | | | | 36 | % |
| Pulp | | | 645,533 | | | | 668,082 | | | | -3 | % | | | 454,351 | | | | 42 | % |
| Paper | | | 1,189,922 | | | | 1,327,227 | | | | -10 | % | | | 894,124 | | | | 33 | % |
| Total Net Revenue | | | 9,742,835 | | | | 11,469,971 | | | | -15 | % | | | 8,889,166 | | | | 10 | % |
| Pulp | | | 7,988,306 | | | | 9,575,959 | | | | -17 | % | | | 7,593,580 | | | | 5 | % |
| Paper | | | 1,754,529 | | | | 1,894,012 | | | | -7 | % | | | 1,295,586 | | | | 35 | % |
| Sales volume (‘000) | | 1Q22 | | | 4Q21 | | | Δ Q-o-Q | | | 1Q21 | | | Δ Y-o-Y | |
| Exports | | | 2,288,468 | | | | 2,627,747 | | | | -13 | % | | | 2,540,952 | | | | -10 | % |
| Pulp | | | 2,194,853 | | | | 2,531,366 | | | | -13 | % | | | 2,450,654 | | | | -10 | % |
| Paper | | | 93,615 | | | | 96,381 | | | | -3 | % | | | 90,298 | | | | 4 | % |
| Paperboard | | | 8,684 | | | | 8,350 | | | | 4 | % | | | 9,954 | | | | -13 | % |
| Printing & Writing | | | 84,332 | | | | 87,319 | | | | -3 | % | | | 78,208 | | | | 8 | % |
| Other paper¹ | | | 599 | | | | 712 | | | | -16 | % | | | 2,136 | | | | -72 | % |
| Domestic Market | | | 405,287 | | | | 465,396 | | | | -13 | % | | | 403,623 | | | | 0 | % |
| Pulp | | | 186,647 | | | | 191,054 | | | | -2 | % | | | 202,648 | | | | -8 | % |
| Paper | | | 218,640 | | | | 274,342 | | | | -20 | % | | | 200,975 | | | | 9 | % |
| Paperboard | | | 38,480 | | | | 39,917 | | | | -4 | % | | | 39,687 | | | | -3 | % |
| Printing & Writing | | | 147,164 | | | | 199,978 | | | | -26 | % | | | 134,688 | | | | 9 | % |
| Other paper¹ | | | 32,996 | | | | 34,447 | | | | -4 | % | | | 26,600 | | | | 24 | % |
| Total Sales Volume | | | 2,693,755 | | | | 3,093,143 | | | | -13 | % | | | 2,944,575 | | | | -9 | % |
| Pulp | | | 2,381,500 | | | | 2,722,420 | | | | -13 | % | | | 2,653,302 | | | | -10 | % |
| Paper | | | 312,255 | | | | 370,723 | | | | -16 | % | | | 291,273 | | | | 7 | % |
| Paperboard | | | 47,164 | | | | 48,267 | | | | -2 | % | | | 49,641 | | | | -5 | % |
| Printing & Writing | | | 231,496 | | | | 287,297 | | | | -19 | % | | | 212,896 | | | | 9 | % |
| Other paper¹ | | | 33,595 | | | | 35,159 | | | | -4 | % | | | 28,736 | | | | 17 | % |
| Average net price (R$/ton) | | 1Q22 | | | 4Q21 | | | Δ Q-o-Q | | | 1Q21 | | | Δ Y-o-Y | |
| Exports | | | 3,455 | | | | 3,606 | | | | -4 | % | | | 2,968 | | | | 16 | % |
| Pulp | | | 3,345 | | | | 3,519 | | | | -5 | % | | | 2,913 | | | | 15 | % |
| Paper | | | 6,031 | | | | 5,881 | | | | 3 | % | | | 4,446 | | | | 36 | % |
| Domestic Market | | | 4,529 | | | | 4,287 | | | | 6 | % | | | 3,341 | | | | 36 | % |
| Pulp | | | 3,459 | | | | 3,497 | | | | -1 | % | | | 2,242 | | | | 54 | % |
| Paper | | | 5,442 | | | | 4,838 | | | | 12 | % | | | 4,449 | | | | 22 | % |
| Total | | | 3,617 | | | | 3,708 | | | | -2 | % | | | 3,019 | | | | 20 | % |
| Pulp | | | 3,354 | | | | 3,517 | | | | -5 | % | | | 2,862 | | | | 17 | % |
| Paper | | | 5,619 | | | | 5,109 | | | | 10 | % | | | 4,448 | | | | 26 | % |
1 Paper of other manufacturers sold by Suzano and tissue paper.
| Average net price (US$/ton) | | 1Q22 | | | 4Q21 | | | Δ Q-o-Q | | | 1Q21 | | | Δ Y-o-Y | |
| Exports | | | 661 | | | | 646 | | | | 2 | % | | | 543 | | | | 22 | % |
| Pulp | | | 639 | | | | 630 | | | | 2 | % | | | 533 | | | | 20 | % |
| Paper | | | 1,153 | | | | 1,053 | | | | 9 | % | | | 813 | | | | 42 | % |
| Domestic Market | | | 866 | | | | 768 | | | | 13 | % | | | 611 | | | | 42 | % |
| Pulp | | | 661 | | | | 626 | | | | 6 | % | | | 410 | | | | 61 | % |
| Paper | | | 1,041 | | | | 867 | | | | 20 | % | | | 813 | | | | 28 | % |
| Total | | | 692 | | | | 664 | | | | 4 | % | | | 552 | | | | 25 | % |
| Pulp | | | 641 | | | | 630 | | | | 2 | % | | | 523 | | | | 23 | % |
| Paper | | | 1,074 | | | | 915 | | | | 17 | % | | | 813 | | | | 32 | % |
| FX Rate R$/US$ | | 1Q22 | | | 4Q21 | | | Δ Q-o-Q | | | 1Q21 | | | Δ Y-o-Y | |
| Closing | | | 4.74 | | | | 5.58 | | | | 18 | % | | | 5.70 | | | | -17 | % |
| Average | | | 5.23 | | | | 5.58 | | | | 7 | % | | | 5.47 | | | | -4 | % |
APPENDIX 2 – Consolidated Statement of Income and Goodwill Amortization
| Income Statement (R$ ‘000) | | 1Q22 | | | 4Q21 | | | Δ Q-o-Q | | | 1Q21 | | | Δ Y-o-Y | |
| Net Revenue | | | 9,742,835 | | | | 11,469,971 | | | | -15 | % | | | 8,889,166 | | | | 10 | % |
| Cost of Goods Sold | | | (5,432,840 | ) | | | (5,692,988 | ) | | | -5 | % | | | (4,845,034 | ) | | | 12 | % |
| Gross Debt | | | 4,309,995 | | | | 5,776,983 | | | | -25 | % | | | 4,044,132 | | | | 7 | % |
| Gross Margin | | | 44.2 | % | | | 50.4 | % | | | -6 p.p. | | | | 45.5 | % | | | -1 p.p. | |
| | | | | | | | | | | | | | | | | | | | | |
| Operating Expense/Income | | | (920,914 | ) | | | (1,022,752 | ) | | | -10 | % | | | (437,201 | ) | | | 111 | % |
| Selling Expenses | | | (572,141 | ) | | | (634,921 | ) | | | -10 | % | | | (581,766 | ) | | | -2 | % |
| General and Administrative Expenses | | | (336,464 | ) | | | (522,761 | ) | | | -36 | % | | | (382,554 | ) | | | -12 | % |
| Other Operating Income (Expenses) | | | (2,567 | ) | | | 202,841 | | | | -101 | % | | | 516,853 | | | | -100 | % |
| Equity Equivalence | | | (9,742 | ) | | | (67,911 | ) | | | -86 | % | | | 10,266 | | | | -195 | % |
| EBIT | | | 3,389,081 | | | | 4,754,231 | | | | -29 | % | | | 3,606,931 | | | | -6 | % |
| | | | | | | | | | | | | | | | | | | | | |
| Depreciation, Amortization & Depletion | | | 1,724,354 | | | | 1,832,940 | | | | -6 | % | | | 1,766,481 | | | | -2 | % |
| | | | | | | | | | | | | | | | | | | | | |
| EBITDA | | | 5,113,436 | | | | 6,587,171 | | | | -22 | % | | | 5,373,412 | | | | -5 | % |
| EBITDA Margin (%) | | | 52.5 | % | | | 57.4 | % | | | -5 p,p, | | | | 60.5 | % | | | -8 p,p, | |
| | | | | | | | | | | | | | | | | | | | | |
| Adjusted EBITDA¹ | | | 5,121,098 | | | | 6,355,317 | | | | -19 | % | | | 4,864,298 | | | | 5 | % |
| Adjusted EBITDA Margin¹ | | | 52.6 | % | | | 55.4 | % | | | -3 p,p, | | | | 54.7 | % | | | -2 p,p, | |
| | | | | | | | | | | | | | | | | | | | | |
| Net Financial Result | | | 12,935,279 | | | | (2,657,320 | ) | | | -587 | % | | | (8,667,121 | ) | | | -249 | % |
| Financial Expenses | | | 158,284 | | | | 147,622 | | | | 7 | % | | | 24,227 | | | | 553 | % |
| Financial Revenues | | | (1,050,121 | ) | | | (1,085,450 | ) | | | -3 | % | | | (990,933 | ) | | | 6 | % |
| Exchange Rate Variation | | | 7,630,673 | | | | (1,412,237 | ) | | | -640 | % | | | (5,206,465 | ) | | | -247 | % |
| Net Proceeds Generated by Derivatives | | | 6,196,443 | | | | (307,255 | ) | | | -2117 | % | | | (2,493,950 | ) | | | -348 | % |
| Earnings Before Taxes | | | 16,324,360 | | | | 2,096,911 | | | | 678 | % | | | (5,060,190 | ) | | | -423 | % |
| | | | | | | | | | | | | | | | | | | | | |
| Income and Social Contribution Taxes | | | (6,018,250 | ) | | | 216,556 | | | | -2879 | % | | | 2,304,931 | | | | -361 | % |
| | | | | | | | | | | | | | | | | | | | | |
| Net Income (Loss) | | | 10,306,110 | | | | 2,313,467 | | | | 345 | % | | | (2,755,259 | ) | | | -474 | % |
| Net Margin | | | 105.8 | % | | | 20.2 | % | | | 86 p,p, | | | | -31.0 | % | | | 137 p,p, | |
1 Excluding non-recurring items and PPA effects.
| Goodwill amortization - PPA (R$ ‘000) | | 1Q22 | | | 4Q21 | | | Δ Q-o-Q | | | 1Q21 | | | Δ Y-o-Y | |
| COGS | | | (122,883 | ) | | | (144,122 | ) | | | -15 | % | | | (142,737 | ) | | | -14 | % |
| Selling Expenses | | | (207,757 | ) | | | (207,925 | ) | | | 0 | % | | | (207,591 | ) | | | 0 | % |
| General and administrative expenses | | | (1,090 | ) | | | (2,732 | ) | | | -60 | % | | | (2,149 | ) | | | -49 | % |
| Other operational revenues (expenses) | | | (1,085 | ) | | | (50,207 | ) | | | -98 | % | | | 2,259 | | | | -148 | % |
| Financial results | | | (4,722 | ) | | | (4,722 | ) | | | 0 | % | | | (3,054 | ) | | | 55 | % |
APPENDIX 3 – Consolidated Balance Sheet
| Assets (R$ ’000) | | 03/31/2022 | | 12/31/2021 | | | 03/31/2021 | |
| Current Assets | | | | | | | | | |
| Cash and cash equivalents | | | 9,797,437 | | | | 13,590,776 | | | | 5,334,508 | |
| Financial investments | | | 9,047,064 | | | | 7,508,275 | | | | 4,028,038 | |
| Trade accounts receivable | | | 4,515,673 | | | | 6,531,465 | | | | 3,692,928 | |
| Inventories | | | 5,133,522 | | | | 4,637,485 | | | | 3,989,789 | |
| Recoverable taxes | | | 447,468 | | | | 360,725 | | | | 406,352 | |
| Derivative financial instruments | | | 1,870,977 | | | | 470,261 | | | | 414,094 | |
| Advance to suppliers | | | 50,332 | | | | 59,564 | | | | 41,492 | |
| Dividend’s receivable | | | 6,604 | | | | 6,604 | | | | - | |
| Other assets | | | 878,827 | | | | 937,786 | | | | 752,011 | |
| Total Current Assets | | | 31,747,904 | | | | 34,102,941 | | | | 18,659,212 | |
| | | | | | | | | | | | | |
| Non-Current Assets | | | | | | | | | | | | |
| Financial investments | | | 252,227 | | | | 250,054 | | | | 236,344 | |
| Recoverable taxes | | | 1,258,690 | | | | 1,269,164 | | | | 832,173 | |
| Deferred taxes | | | 2,772,622 | | | | 8,729,929 | | | | 11,044,593 | |
| Derivative financial instruments | | | 2,242,272 | | | | 971,879 | | | | 856,828 | |
| Advance to suppliers | | | 1,373,504 | | | | 1,282,763 | | | | 1,203,265 | |
| Judicial deposits | | | 307,143 | | | | 300,715 | | | | 275,118 | |
| Other assets | | | 267,249 | | | | 296,844 | | | | 224,663 | |
| Biological assets | | | 12,321,547 | | | | 12,248,732 | | | | 11,094,744 | |
| Investments | | | 502,559 | | | | 524,066 | | | | 379,564 | |
| Property, plant and equipment | | | 39,137,734 | | | | 38,169,703 | | | | 38,580,957 | |
| Right of use on lease agreements | | | 4,908,555 | | | | 4,794,023 | | | | 4,566,956 | |
| Intangible | | | 15,843,938 | | | | 16,034,339 | | | | 16,572,051 | |
| Total Non-Current Assets | | | 81,188,040 | | | | 84,872,211 | | | | 85,867,256 | |
| | | | | | | | | | | | | |
| Total Assets | | | 112,935,944 | | | | 118,975,152 | | | | 104,526,468 | |
| Liabilities and Equity (R$ ´000) | | 03/31/2022 | | 12/31/2021 | | 03/31/2021 | |
| Current Liabilities | | | | | | | | | | | | |
| Trade accounts payable | | | 3,241,621 | | | | 3,288,897 | | | | 2,393,144 | |
| Loans, financing and debentures | | | 2,216,304 | | | | 3,655,537 | | | | 2,143,255 | |
| Accounts payable for lease operations | | | 580,282 | | | | 623,282 | | | | 632,812 | |
| Derivative financial instruments | | | 429,723 | | | | 1,563,459 | | | | 2,670,708 | |
| Taxes payable | | | 398,852 | | | | 339,553 | | | | 239,910 | |
| Payroll and charges | | | 389,344 | | | | 590,529 | | | | 349,263 | |
| Liabilities for assets acquisitions and subsidiaries | | | 93,571 | | | | 99,040 | | | | 114,889 | |
| Dividends payable | | | 6,059 | | | | 919,073 | | | | 6,228 | |
| Advance from customers | | | 84,874 | | | | 103,656 | | | | 92,505 | |
| Other liabilities | | | 266,733 | | | | 368,198 | | | | 336,480 | |
| Total Current Liabilities | | | 7,707,363 | | | | 11,551,224 | | | | 8,979,194 | |
| | | | | | | | | | | | | |
| Non-Current Liabilities | | | | | | | | | | | | |
| Loans, financing and debentures | | | 66,549,620 | | | | 75,973,092 | | | | 73,770,784 | |
| Accounts payable for lease operations | | | 5,034,988 | | | | 5,269,912 | | | | 5,045,285 | |
| Derivative financial instruments | | | 3,652,449 | | | | 6,331,069 | | | | 7,157,597 | |
| Liabilities for assets acquisitions and subsidiaries | | | 277,687 | | | | 306,912 | | | | 428,678 | |
| Provision for judicial liabilities | | | 3,222,375 | | | | 3,232,612 | | | | 3,255,140 | |
| Actuarial liabilities | | | 675,612 | | | | 675,158 | | | | 788,948 | |
| Deferred taxes | | | 1,118 | | | | - | | | | - | |
| Share-based compensation plans | | | 147,058 | | | | 166,998 | | | | 223,915 | |
| Advance from customers | | | 149,540 | | | | 149,540 | | | | 199,595 | |
| Other liabilities | | | 136,028 | | | | 143,505 | | | | 112,991 | |
| Total Non-Current Liabilities | | | 79,846,475 | | | | 92,248,798 | | | | 90,982,933 | |
| | | | | | | | | | | | | |
| Shareholders’ Equity | | | | | | | | | | | | |
| Share capital | | | 9,235,546 | | | | 9,235,546 | | | | 9,235,546 | |
| Capital reserves | | | 14,424 | | | | 15,455 | | | | 11,822 | |
| Treasury shares | | | (215,900 | ) | | | (218,265 | ) | | | (218,265 | ) |
| Retained earnings reserves | | | 3,840,935 | | | | 3,927,824 | | | | - | |
| Other reserves | | | 2,071,992 | | | | 2,114,907 | | | | 2,065,162 | |
| Retained earnings | | | 10,335,249 | | | | - | | | | (6,636,122 | ) |
| Controlling shareholders’ | | | 25,282,246 | | | | 15,075,467 | | | | 4,458,143 | |
| | | | | | | | | | | | | |
| Non-controlling interest | | | 99,860 | | | | 99,663 | | | | 106,198 | |
| Total Equity | | | 25,382,106 | | | | 15,175,130 | | | | 4,564,341 | |
| Total Liabilities and Equity | | | 112,935,944 | | | | 118,975,152 | | | | 104,526,468 | |
APPENDIX 4 – Consolidated Statement of Cash Flow
| Cash Flow (R$ ‘000) | | 1Q22 | | | 1Q21 | |
| Cash flow from operating activities | | | | | | |
| Net income/(loss) for the period | | | 10,306,110 | | | | (2,755,259 | ) |
| Adjustment to | | | | | | | | |
| Depreciation, depletion and amortization | | | 1,680,930 | | | | 1,734,134 | |
| Depreciation of right of use | | | 56,098 | | | | 46,821 | |
| Sublease of ships | | | (7,952 | ) | | | (11,420 | ) |
| Interest expense on lease liabilities | | | 108,105 | | | | 109,040 | |
| Results from sale, disposals and provision for losses (impairment) of property, plant and equipment and biological assets, net | | | (17,424 | ) | | | (496,844 | ) |
| Income (loss) from associates and joint ventures | | | 9,742 | | | | (10,266 | ) |
| Exchange rate and monetary variations, net | | | (7,630,673 | ) | | | 5,206,465 | |
| Interest expenses with financing, loans and debentures, net | | | 891,604 | | | | 758,171 | |
| Capitalized interest | | | - | | | | (402 | ) |
| Premium on early settlements | | | (42,535 | ) | | | 32,933 | |
| Accrual of interest on marketable securities | | | (129,740 | ) | | | (15,111 | ) |
| Amortization of fundraising costs | | | 20,998 | | | | 41,020 | |
| Derivative (gains) losses, net | | | (6,196,443 | ) | | | 2,493,950 | |
| Deferred income tax and social contribution | | | 5,959,316 | | | | (2,369,080 | ) |
| Interest on employee benefits | | | 14,815 | | | | 13,964 | |
| Provision for (reversal of) judicial liabilities, net | | | 21,764 | | | | 4,311 | |
| Allowance for doubtful accounts, net | | | 600 | | | | 1,762 | |
| Provision for inventory losses, net | | | (13,727 | ) | | | 5,462 | |
| Provision for loss of ICMS credits, net | | | 18,671 | | | | 7,458 | |
| Other | | | 4,339 | | | | 551 | |
| Decrease (increase) in assets | | | 954,928 | | | | (535.478 | ) |
| Trade accounts receivables | | | 1,274,406 | | | | (514,616 | ) |
| Inventories | | | (359,437 | ) | | | (56,458 | ) |
| Recoverable taxes | | | (103,175 | ) | | | (2,390 | ) |
| Other assets | | | 168,327 | | | | 37,986 | |
| Increase (decrease) in liabilities | | | (60,491 | ) | | | 25.351 | |
| Trade accounts payables | | | 155,492 | | | | 88,245 | |
| Taxes payable | | | 157,724 | | | | 102,603 | |
| Payroll and charges | | | (201,184 | ) | | | (143,474 | ) |
| Other liabilities | | | (172,523 | ) | | | (29,577 | ) |
| Cash provided by operations, net | | | 5,974,228 | | | | 4,279,979 | |
| Payment of interest with financing, loans and debentures | | | (1,425,025 | ) | | | (1,175,388 | ) |
| Premium on early settlements | | | - | | | | (32,933 | ) |
| Interest received from marketable securities | | | 113,263 | | | | 14,049 | |
| Payment of income taxes | | | (69,621 | ) | | | (35,144 | ) |
| Cash provided by operating activities | | | 4,592,845 | | | | 3,050,563 | |
| | | | | | | | | |
| Investing activities | | | | | | | | |
| Additions to property, plant and equipment | | | (1,663,402 | ) | | | (263,979 | ) |
| Additions to intangible assets | | | (49,677 | ) | | | (734 | ) |
| Additions to biological assets | | | (1,021,392 | ) | | | (703,830 | ) |
| Proceeds from sale of property, plant and equipment | | | 57,378 | | | | 1,164,928 | |
| Increase of capital in subsidiaries and associates | | | (1,920 | ) | | | (6,328 | ) |
| Marketable securities, net | | | (2,075,606 | ) | | | (1,866,464 | ) |
| Advance for acquisition of wood from operations with development | | | (103,568 | ) | | | (167,176 | ) |
| Acquisition of minority interests | | | - | | | | (6,482 | ) |
| Cash used in investing activities, net | | | (4,858,187 | ) | | | (1,850,065 | ) |
| | | | | | | | | |
| Financing activities | | | | | | | | |
| Proceeds from loans, financing and debentures | | | 242,070 | | | | 8,969,521 | |
| Payment of derivative transactions | | | (287,023 | ) | | | (712,547 | ) |
| Payment of loans, financing and debentures | | | (797,865 | ) | | | (11,177,120 | ) |
| Payment of leases | | | (255,065 | ) | | | (249,128 | ) |
| Payment of dividends | | | (999,753 | ) | | | - | |
| Liabilities for assets acquisitions and associates | | | (109 | ) | | | - | |
| Cash provided (used) by financing activities, net | | | (2,097,745 | ) | | | (3,169,274 | ) |
| | | | | | | | | |
| Exchange variation on cash and cash equivalents | | | (1,430,252 | ) | | | 468,227 | |
| | | | | | | | | |
| Increase (reduction) in cash and cash equivalents, net | | | (3,793,339 | ) | | | (1,500,549 | ) |
| Cash and cash equivalents at the beginning for the period | | | 13,590,776 | | | | 6,835,057 | |
| Cash and cash equivalents at the end for the period | | | 9,797,437 | | | | 5,334,508 | |
| Increase (reduction) in cash and cash equivalents, net | | | (3,793,339 | ) | | | (1,500,549 | ) |
APPENDIX 5 – EBITDA
| (R$ '000, except where otherwise indicated) | | 1Q22 | | | 1Q21 | |
| Net income | | | 10,306,110 | | | | (2,755,259 | ) |
| Net Financial Result | | | (12,935,279 | ) | | | 8,667,121 | |
| Income and Social Contribution Taxes | | | 6,018,250 | | | | (2,304,931 | ) |
| EBIT | | | 3,389,081 | | | | 3,606,931 | |
| Depreciation, Amortization and Depletion | | | 1,724,354 | | | | 1,766,481 | |
| EBITDA¹ | | | 5,113,436 | | | | 5,373,412 | |
| EBITDA Margin | | | 52.5 | % | | | 60.4 | % |
| | | | | | | | | |
| COVID-19 - Expenses related to social actions to combat the virus | | | 174 | | | | 4,555 | |
| Tax Credits | | | 1,324 | | | | - | |
| Equity method | | | 9,742 | | | | (10,266 | ) |
| Accruals for losses on ICMS credits | | | 18,670 | | | | 6,978 | |
| Adjustments - Losango Project | | | - | | | | (9,138 | ) |
| Sales of fixed assets and biological assets | | | (22,250 | ) | | | (501,243 | ) |
| Adjusted EBITDA | | | 5,121,098 | | | | 4,864,298 | |
| Adjusted EBITDA Margin | | | 52.6 | % | | | 54.7 | % |
1 The Company's EBITDA is calculated in accordance with CVM Instruction 527 of October 4, 2012.
APPENDIX 6 - Segmented Income Statement
| Segmented Financial Statement (R$ '000) | | 1Q22 | | | 1Q21 | |
| | | Pulp | | | Paper | | | Non
Segmented | | | Total
Consolidated | | | Pulp | | | Paper | | | Non
Segmented | | | Total
Consolidated | |
| Net Revenue | | | 7,988,306 | | | | 1,754,529 | | | | - | | | | 9,742,835 | | | | 7,593,580 | | | | 1,295,586 | | | | - | | | | 8,889,166 | |
| Cost of Goods Sold | | | (4,336,336 | ) | | | (1,096,504 | ) | | | - | | | | (5,432,840 | ) | | | (4,015,712 | ) | | | (829,322 | ) | | | - | | | | (4,845,034 | ) |
| Gross Profit | | | 3,651,970 | | | | 658,025 | | | | - | | | | 4,309,995 | | | | 3,577,868 | | | | 466,264 | | | | - | | | | 4,044,132 | |
| Gross Margin | | | 45.7 | % | | | 37.5 | % | | | - | | | | 44.2 | % | | | 47.1 | % | | | 36.0 | % | | | - | | | | 45.5 | % |
| | | | | | | | | | | | | | | | | | | | | | | | | | | | | | | | | |
| Operating Expense/Income | | | (653,347 | ) | | | (267,567 | ) | | | - | | | | (920,914 | ) | | | (382,677 | ) | | | (54,524 | ) | | | - | | | | (437,201 | ) |
| Selling Expenses | | | (434,053 | ) | | | (138,088 | ) | | | - | | | | (572,141 | ) | | | (477,598 | ) | | | (104,168 | ) | | | - | | | | (581,766 | ) |
| General and Administrative Expenses | | | (239,931 | ) | | | (96,533 | ) | | | - | | | | (336,464 | ) | | | (278,406 | ) | | | (104,148 | ) | | | - | | | | (382,554 | ) |
| Other Operating Income (Expenses) | | | (4,090 | ) | | | 1,523 | | | | - | | | | (2,567 | ) | | | 375,582 | | | | 141,271 | | | | - | | | | 516,853 | |
| Equity Equivalence | | | 24,727 | | | | (34,469 | ) | | | - | | | | (9,742 | ) | | | (2,255 | ) | | | 12,521 | | | | - | | | | 10,266 | |
| EBIT | | | 2,998,623 | | | | 390,458 | | | | - | | | | 3,389,081 | | | | 3,195,191 | | | | 411,740 | | | | - | | | | 3,606,931 | |
| | | | | | | | | | | | | | | | | | | | | | | | | | | | | | | | | |
Depreciation, Amortization &
Depletion | | | 1,561,129 | | | | 163,225 | | | | - | | | | 1,724,354 | | | | 1,629,575 | | | | 136,906 | | | | - | | | | 1,766,481 | |
| | | | | | | | | | | | | | | | | | | | | | | | | | | | | | | | | |
| EBITDA | | | 4,559,752 | | | | 553,683 | | | | - | | | | 5,113,436 | | | | 4,824,766 | | | | 548,646 | | | | - | | | | 5,373,412 | |
| EBITDA Margin | | | 57.1 | % | | | 31.6 | % | | | - | | | | 52.5 | % | | | 63.5 | % | | | 42.3 | % | | | - | | | | 60.4 | % |
| | | | | | | | | | | | | | | | | | | | | | | | | | | | | | | | | |
| Adjusted EBITDA¹ | | | 4,559,891 | | | | 561,207 | | | | - | | | | 5,121,098 | | | | 4,465,793 | | | | 398,505 | | | | - | | | | 4,864,298 | |
| Adjusted EBITDA Margin¹ | | | 57.1 | % | | | 32.0 | % | | | - | | | | 52.6 | % | | | 58.8 | % | | | 30.8 | % | | | - | | | | 54.7 | % |
| | | | | | | | | | | | | | | | | | | | | | | | | | | | | | | | | |
| Net Financial Result | | | - | | | | - | | | | 12,935,279 | | | | 12,935,279 | | | | - | | | | - | | | | (8,667,121 | ) | | | (8,667,121 | ) |
| | | | | | | | | | | | | | | | | | | | | | | | | | | | | | | | | |
| Earnings Before Taxes | | | 2,998,622 | | | | 390,459 | | | | 12,935,279 | | | | 16,324,360 | | | | 3,195,191 | | | | 411,740 | | | | (8,667,121 | ) | | | (5,060,190 | ) |
| | | | | | | | | | | | | | | | | | | | | | | | | | | | | | | | | |
Income and Social Contribution
Taxes | | | - | | | | - | | | | (6,018,250 | ) | | | (6,018,250 | ) | | | - | | | | - | | | | 2,304,931 | | | | 2,304,931 | |
| | | | | | | | | | | | | | | | | | | | | | | | | | | | | | | | | |
| Net Income (Loss) | | | 2,998,622 | | | | 390,459 | | | | 6,917,029 | | | | 10,306,110 | | | | 3,195,191 | | | | 411,740 | | | | (6,362,190 | ) | | | (2,755,259 | ) |
| Net Margin | | | 37.5 | % | | | 22.3 | % | | | - | | | | 105.8 | % | | | 42.1 | % | | | 31.8 | % | | | - | | | | -31.0 | % |
1 Excluding non-recurring items and PPA effects.
Forward-Looking Statements
This release may contain forward-looking statements. Such statements are subject to known and unknown risks and uncertainties that could cause the expectations expressed to not materialize or differ substantially from expected results. These risks include. among others. changes in future demand for the Company’s products. changes in factors affecting domestic and international product prices. changes in the cost structure. changes in the seasonal patterns of markets. changes in prices charged by competitors. foreign exchange variations. changes in the political or economic situation of Brazil. as well as emerging and international markets. The forward-looking statements were not reviewed by our independent auditors.