Exhibit 99.1

Record cash generation and advances on strategic agenda
São Paulo, October 27, 2022. Suzano S.A. (B3: SUZB3 | NYSE: SUZ), one of the world’s largest integrated pulp and paper producers, announces today its consolidated results for the 3rd quarter of 2022 (3Q22).
HIGHLIGHTS
| • | Pulp sales of 2,797 thousand tons (+5% vs. 3Q21). |
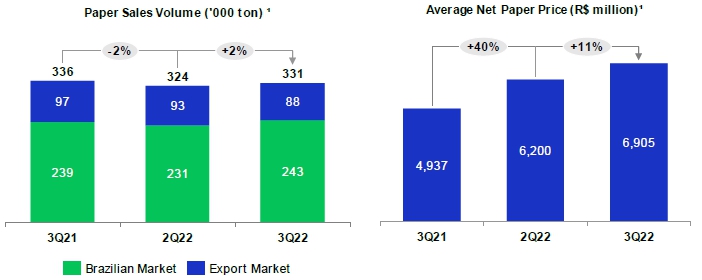
| • | Paper sales³ of 331 thousand tons (-2% vs. 3Q21). |
| • | Adjusted EBITDA1 and Operating cash generation²: R$8.6 billion and R$7.2 billion, respectively. |
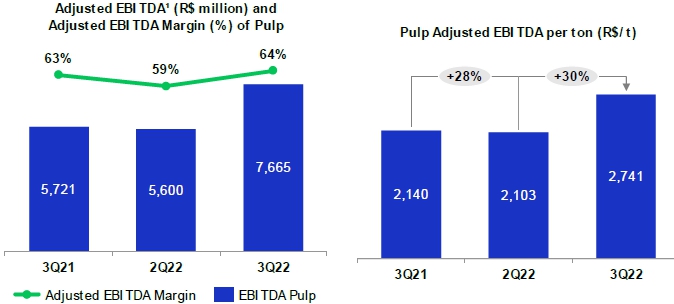
| • | Adjusted EBITDA¹/ton from pulp of R$2,741/ton (+28% vs. 3Q21). |
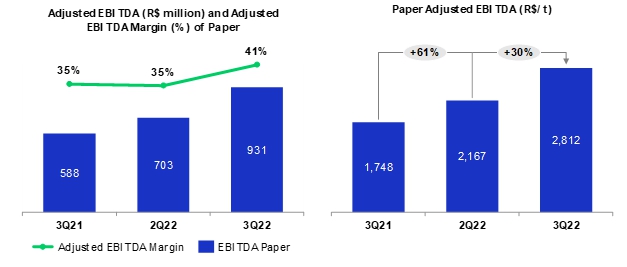
| • | Adjusted EBITDA1/ton3 of paper of R$2,812/ton (+61% vs. 3Q21). |
| • | Average net pulp price in export market: US$821/ton (+25% vs. 3Q21). |
| • | Average net paper price3 of R$6,905/ton (+40% vs. 3Q21). |
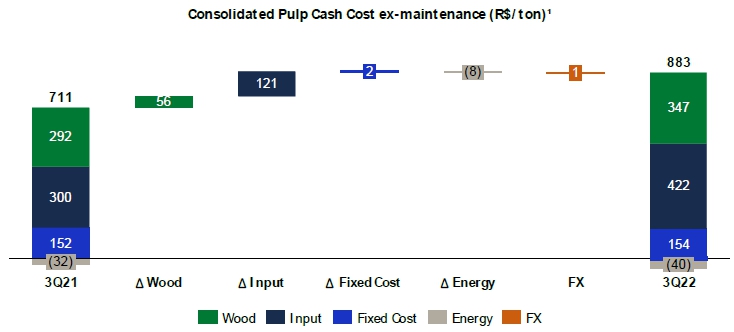
| • | Pulp cash cost ex-downtime of R$883/ton (+24% vs. 3Q21). |
| • | Leverage ratio declines to 2.1 times in USD and 2.2 times in BRL, despite the investment cycle. |
| • | Cerrado Project completes 31% of physical progress and 24% of financial progress. |
| Financial Data (R$ million) | 3Q22 | 2Q22 | Δ Q-o-Q | 3Q21 | Δ Y-o-Y | LTM 3Q22 | ||||||||||||||||||
| Net Revenue | 14,199 | 11,520 | 23 | % | 10,762 | 32 | % | 46,931 | ||||||||||||||||
| Adjusted EBITDA¹ | 8,596 | 6,303 | 36 | % | 6,310 | 36 | % | 26,375 | ||||||||||||||||
| Adjusted EBITDA Margin¹ | 61 | % | 55 | % | 6 p.p. | 59 | % | 2 p.p. | 56 | % | ||||||||||||||
| Net Financial Result | (1,528 | ) | (6,975 | ) | - | (7,765 | ) | -80 | % | 1,776 | ||||||||||||||
| Net Income | 5,448 | 182 | - | (959 | ) | - | 18,249 | |||||||||||||||||
| Operating Cash Generation² | 7,155 | 5,055 | 42 | % | 5,204 | 37 | % | 20,909 | ||||||||||||||||
| Net Debt /Adjusted EBITDA¹ (x) - R$ | 2.2x | 2.3x | -0.1x | 2.8x | -0.6x | 2.2x | ||||||||||||||||||
| Net Debt /Adjusted EBITDA¹ (x) - US$ | 2.1x | 2.3x | -0.2x | 2.7x | -0.6x | 2.1x |

| Operational Data ('000 tons) | 3Q22 | 2Q22 | Δ Q-o-Q | 3Q21 | Δ Y-o-Y | LTM 3Q22 | ||||||||||||||||||
| Sales | 3,128 | 2,987 | 5 | % | 3,010 | 4 | % | 11,902 | ||||||||||||||||
| Pulp | 2,797 | 2,663 | 5 | % | 2,673 | 5 | % | 10,563 | ||||||||||||||||
| Paper3 | 331 | 324 | 2 | % | 337 | -2 | % | 1,338 |
¹Excludes non-recurring items. | 2Considers Adjusted EBITDA less sustaining capex (cash basis). | 3Considers the results of the Consumer Goods Unit (tissue).

The consolidated quarterly information was prepared in accordance with the standards of the Securities and Exchange Commission of Brazil (CVM) and complies with the International Financial Reporting Standards (IFRS) issued by the International Accounting Standards Board (IASB). The operating and financial information is presented on a consolidated basis and in Brazilian real (R$). Note that figures may present discrepancies due to rounding.
Page 2 of 47
CONTENTS
| EXECUTIVE SUMMARY | 4 |
| PULP BUSINESS PERFORMANCE | 5 |
| PULP SALES VOLUME AND REVENUE | 5 |
| PULP CASH COST | 7 |
| PULP SEGMENT EBITDA | 9 |
| OPERATING CASH FLOW FROM THE PULP SEGMENT | 10 |
| PAPER BUSINESS PERFORMANCE | 11 |
| PAPER SALES VOLUME AND REVENUE | 11 |
| PAPER SEGMENT EBITDA | 13 |
| OPERATING CASH FLOW FROM THE PAPER SEGMENT | 14 |
| FINANCIAL PERFORMANCE | 15 |
| NET REVENUE | 15 |
| CALENDAR OF SCHEDULED MAINTENANCE DOWNTIMES | 16 |
| COST OF GOODS SOLD | 16 |
| SELLING EXPENSES | 16 |
| GENERAL AND ADMINISTRATIVE EXPENSES | 18 |
| ADJUSTED EBITDA | 18 |
| FINANCIAL RESULT | 19 |
| DERIVATIVE OPERATIONS | 21 |
| NET INCOME (LOSS) | 26 |
| DEBT | 26 |
| CAPEX | 29 |
| CERRADO PROJECT | 30 |
| OPERATING CASH GENERATION | 30 |
| FREE CASH FLOW | 31 |
| EVOLUTION OF NET DEBT | 32 |
| ESG | 33 |
| TOTAL OPERATIONAL EXPENDITURE - PULP | 33 |
| CAPITAL MARKETS | 34 |
| FIXED INCOME | 36 |
| RATING | 36 |
| UPCOMING EVENTS | 37 |
Page 3 of 47
| APPENDICES | 38 |
| APPENDIX 1 – Operating Data | 38 |
| APPENDIX 2 – Consolidated Statement of Income and Goodwill Amortization | 40 |
| APPENDIX 3 – Consolidated Balance Sheet | 41 |
| APPENDIX 4 – Consolidated Statement of Cash Flow | 43 |
| APPENDIX 5 – EBITDA | 44 |
| APPENDIX 6 – Segmented Income Statement | 45 |
| APPENDIX 6 – Segmented Income Statement | 46 |
| Forward-Looking Statements | 47 |
EXECUTIVE SUMMARY
The third quarter of 2022 was marked by strong hardwood pulp prices, thanks to solid demand and the lack of new production capacities. In a scenario of sustained high market prices, the Company showed sharp increase in realized pulp prices, which, combined with higher sales volume (the highest since 1Q20), resulted in record EBITDA generation by the segment. Pulp production cash cost varied slightly, still pressured by high chemical and energy prices. The paper segment set a new EBITDA record, up 58% year on year, driven by strong demand in all market segments and by operating efficiency. Adjusted EBITDA was a record R$8.6 billion, growing significantly over the already high result of the previous quarter.
Regarding financial management, leverage in USD, measured by net debt/Adjusted EBITDA in the last 12 months, fell to 2.1 times, despite the investments made and is in line with the Company’s capital allocation strategy. The result of cash flow hedge operations once again attested to the long-term consistency of the financial policy in managing foreign exchange risk, with positive mark-to-market and cash adjustments in cash flow operations (ZCC). Finally, the hedge policy was streamlined, with a wider range of net debt dollarized and the maximum term of foreign exchange exposure extended from 18 to 24 months. The Company thus seeks to hedge its cash flows more effectively in the long term amid the current foreign exchange scenario.
The Company also made progress on its strategic avenues. In October, announced the acquisition of all the shares held by KC Brasil in a new company that will hold the assets related to the production, marketing, distribution and/or sale in the country of tissue, such as toilet paper, paper towels, napkins, wipes and other paper products, as well as ownership of the NEVE brand. The base purchase price of the transaction is US$175 million, subject to the usual adjustments of this type of transaction, will be paid in full on the date of completion of the transaction. As part of the deal, the other global brands currently used by KC Brasil will be licensed to the Company for a specific term. The main asset included in the Transaction consists on a tissue production plant, located in the municipality of Mogi das Cruzes, in the State of São Paulo, with an annual production capacity of approximately 130 thousand tons. The Transaction is aligned with the Company’s long-term strategy to “advance in the links of the value chain”, as is widely public knowledge, representing geographic complementarity and synergy gains with its current consumer goods business (tissue). The conclusion of the Transaction is subject to the verification of conditions precedent commonly practiced by the market in this type of transaction, including the approval by the Administrative Council for Economic Defense (CADE).
Suzano also made progress on share buyback programs, concluding the two programs approved (each involving 20 million shares), repurchasing 40 million shares at an average price of R$48.33/share in the May 2022 Program and R$46.84/share in the July 2022 Program. The operations totaled R$1,904 million.
Lastly, the Cerrado Project remained on schedule on the physical (31%) and financial (24%) fronts, maintaining the expectations about capex and operational startup earlier disclosed to the market.
Page 4 of 47
PULP BUSINESS PERFORMANCE
PULP SALES VOLUME AND REVENUE
The third quarter of the year showed solid hardwood demand, that supported higher prices throughout the quarter, when compared to the last quarter. Demand for pulp in the tissue and Printing and Writing paper markets remained solid in both North America and Europe. As for packaging, there was a healthy demand for cartonboard in these regions and a reduction in the demand for cartonboard packaging, a segment in which hardwood pulp has a smaller share in the composition.
In the Chinese market, the segments of sanitary, packaging and Printing and Writing papers were stable, the latter being driven by higher export volumes when compared to previous periods, mainly to other Asian markets. In addition, the price difference between long and short fiber continued to favor greater consumption of this fiber.
Page 5 of 47
On the supply side, new disruptions related to unplanned downtimes due to climate questions and the continued effect of sanctions on Russian wood in Europe added to delays in the startup of new projects in Latin America have restricted the availability of hardwood.
In this context, average PIX/FOEX prices in the quarter for hardwood pulp increased 7% in the Chinese market and by 10% in Europe compared to the previous quarter. The difference between softwood and hardwood fibers in the quarter was US$112/t in both regions, declining 16% in Europe and 38% in China compared to the 2Q22 average.
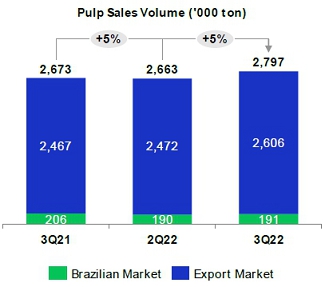
In this scenario, Suzano’s pulp sales totaled 2,797 thousand tons, increasing 5% from both 2Q22 and 3Q21. Average net price in USD of the pulp sold by Suzano was US$812/t, an increase of 12% from 2Q22. In the export market, average net price charged by the Company was US$821/t, increasing 12%.
Average net price in BRL was R$4,260/ton in 3Q22, increasing 19% and 25% respectively, from 2Q22 and 3Q21, due to higher average net price in USD and the 7% rise in average USD vs. BRL compared to 2Q22.
Net revenue from pulp increased 25% and 31% from 2Q22 and 3Q21, respectively, due to the higher net average price in USD (+12% and +25%) and higher sales volume in both periods (+5% and +5%).
Page 6 of 47
PULP CASH COST
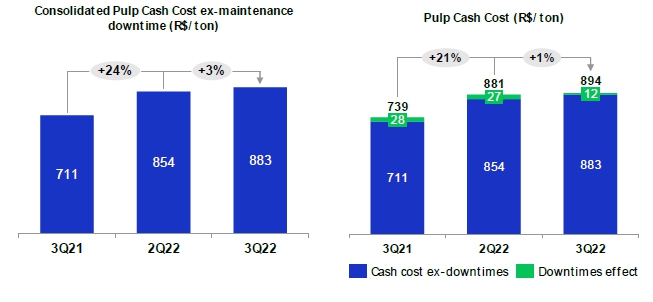
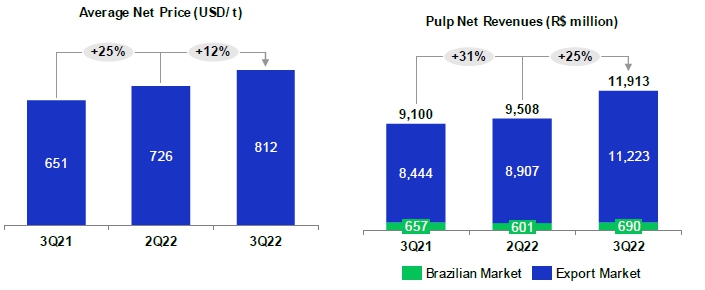
Cash cost excluding downtime in 3Q22 stood at R$883/t, increasing 3% from 2Q22, due to: i) higher expenses with wood, mainly due to the hike in diesel prices, which affected harvest and transport, as well as the greater average supply radius and the higher share of third-party wood; ii) the 7% rise in USD against BRL; iii) higher costs with inputs, resulting from higher Brent impacting natural gas and the increase in chemical prices (especially caustic soda due to higher international prices - IHS and hydrogen peroxide). It is important to note that the variation in Brent and part of the chemical inputs are recognized in the Company's cash cost with delay, due to inventory turnover and contractual dynamics. These effects were partially offset by the higher dilution of fixed costs, thanks to greater operating efficiency of mills and higher result from utilities due to better operational use of the Três Lagoas mill turbogenerator.
Page 7 of 47
¹Excludes the impact of maintenance and administrative downtimes.
Cash cost excluding downtime in 3Q22 was 24% higher than in 3Q21, due to: i) higher input costs, caused by higher energy prices (mainly natural gas due to the increase in Brent prices) and higher chemical prices (mainly caustic soda due to higher international prices – IHS and hydrogen peroxide); ii) higher wood costs, mainly due to the increase in diesel prices, which affected harvest and transportation, partially offset by lower average radius in the period; and iii) higher fixed costs due to the increase in labor and maintenance costs. These effects were partially offset by better results from utilities, mainly due to the effect of the turbogenerator restart at the Imperatriz mill.
¹Excludes the impact of maintenance and administrative downtimes.
Page 8 of 47
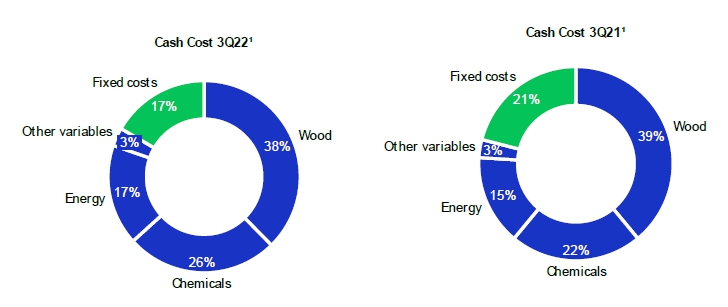
¹Based on cash cost excluding downtimes. Excludes energy sales.
PULP SEGMENT EBITDA
| Pulp Segment | 3Q22 | 2Q22 | Δ Q-o-Q | 3Q21 | Δ Y-o-Y | LTM 3Q22 | ||||||||||||||||||
| Adjusted EBITDA (R$ million)¹ | 7,665 | 5,600 | 37 | % | 5,721 | 34 | % | 23,580 | ||||||||||||||||
| Sales volume (k ton) | 2,797 | 2,663 | 5 | % | 2,673 | 5 | % | 10,563 | ||||||||||||||||
| Pulp adjusted¹ EBITDA (R$/ton) | 2,741 | 2,103 | 30 | % | 2,140 | 28 | % | 2,232 |
¹Excludes non-recurring items.
Adjusted EBITDA from pulp increased 37% from 2Q22 due to: i) the 12% increase in net average pulp price; ii) the 7% rise average USD against BRL; and ii) the 5% growth in sales volume. These effects were partially offset by higher cash COGS. The 30% growth in adjusted EBITDA per ton was driven by higher prices in the quarter and by the FX factor.
Compared to 3Q21, the 34% increase in Adjusted EBITDA from pulp mainly reflects the increase in net average price in USD (+25%) and higher sales volume (+5%). The increase in Adjusted EBITDA was largely offset by higher production costs (due to strong pressure on commodity prices) and higher SG&A expenses (mainly general and administrative expenses, resulting from higher expenses with third-party services, variable compensation and salaries). Adjusted EBITDA per ton increased 28%, due to higher prices in the quarter, and was partially offset by the cost factor and higher SG&A expenses, as explained above.
Page 9 of 47
¹Excludes non-recurring items.
OPERATING CASH FLOW FROM THE PULP SEGMENT
Operating Cash Flow - Pulp (R$ million) | 3Q22 | 2Q22 | Δ Q-o-Q | 3Q21 | Δ Y-o-Y | LTM 3Q22 | ||||||||||||||||||
| Adjusted EBITDA1 | 7,665 | 5,600 | 37 | % | 5,721 | 34 | % | 23,580 | ||||||||||||||||
| Maintenance Capex2 | (1,314 | ) | (1,149 | ) | 14 | % | (1,025 | ) | 28 | % | (5,012 | ) | ||||||||||||
| Operating Cash Flow | 6,351 | 4,450 | 43 | % | 4,696 | 35 | % | 18,567 |
¹Excludes non-recurring items.
²Cash basis.
Page 10 of 47
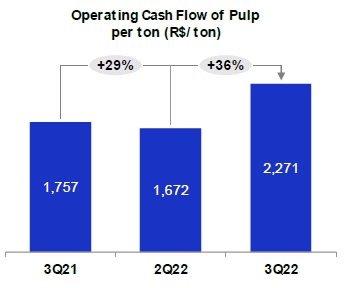
Operating cash generation per ton in the pulp segment increased 36% and 29% respectively, from 2Q22 and 3Q21, driven by higher EBITDA per ton, which was partially offset by higher sustaining capex per ton in both periods.
PAPER BUSINESS PERFORMANCE
The following data and analyses incorporate the joint results of the consumer goods and paper businesses.
PAPER SALES VOLUME AND REVENUE
According to data published by Brazil's Forestry Industry Association (IBÁ), demand for Printing & Writing paper in Brazil, considering domestic sales and imports, grew 8.5% in July and August 2022 compared to the same period in 2020. The heated demand in the period, due to the elections, was partially met by the increase in coated paper imports in the quarter.
Domestic sales of Printing & Writing paper, excluding sales to the paperboard segment, grew 15.8% in July and August 2022 in relation to the same period last year, driven by strong demand in publishing, notebooks and school and office papers (cutsize). Considering sales to the paperboard segment, domestic sales of Printing & Writing paper are estimated to have dropped 0.9% in the period due to the strong comparison base in 2021.
Page 11 of 47
Paperboard demand in Brazil increased 11.7 % in July and August 2022 in relation to the same period last year, with domestic sales growing 5.9% in July and August 2022, from the same period last year.
Consolidating both market segments (Suzano's accessible paper market), domestic demand grew 9.5%.
Suzano’s paper sales (printing & writing, paperboard and tissue) in the domestic market totaled 243 thousand tons in 3Q22, increasing 5% from 2Q22 and 2% from 3Q21.
International paper sales totaled 88 thousand tons, down 5% from 2Q22 and 9% from 3Q21, and corresponded to 27% of total sales volume in 3Q22.
¹Includes the Consumer Goods Unit.
Net average price rose 11% from 2Q22 and 40% from 3Q21, reflecting the price increases across all segments in the domestic and export markets during 2022, in addition to the depreciation of the average BRL against the USD in both comparisons.
Page 12 of 47
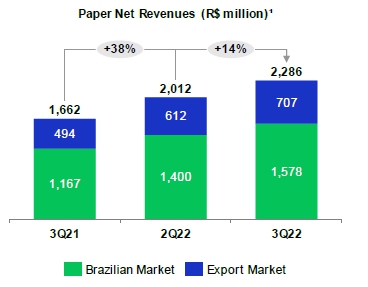
Net revenue from paper was R$2,286 million, increasing 14% from 2Q22, due to implementation of price increases in all segments that took place throughout 2022, the depreciation of the BRL against the USD and the higher sales volume (+2%). Compared to 3Q21, the 38% increase was also due to the implementation of price increases, partially offset by the drop in sales volume (-2%).
¹Includes the Consumer Goods Unit.
PAPER SEGMENT EBITDA
| Paper Segment | 3Q22 | 2Q22 | Δ Q-o-Q | 3Q21 | Δ Y-o-Y | LTM 3Q22 | ||||||||||||||||||
| Adjusted EBITDA (R$ million) | 931 | 703 | 32 | % | 588 | 58 | % | 2,796 | ||||||||||||||||
| Sales volume (k ton) | 331 | 324 | 2 | % | 337 | -2 | % | 1,338 | ||||||||||||||||
| Paper adjusted¹ EBITDA (R$/ton) | 2,812 | 2,167 | 30 | % | 1,748 | 61 | % | 2,089 |
¹Excludes non-recurring items.
Adjusted EBITDA from paper increased 32% from 2Q22 mainly due to the increase in net average price. The 7% decline in average BRL vs. USD and growth in sales volume also had a positive impact, which was partially offset by higher production costs. Adjusted EBITDA per ton increased 30%, mainly driven by higher prices.
Compared to 3Q21, the 58% increase was due to price increases across all product lines, despite the increase in costs and administrative, commercial and logistics expenses, resulting from the macroeconomic scenario and the slight drop in sales volume. Adjusted EBITDA per ton increased 61% due to the price factor, partially offset by higher costs, as explained earlier.
Page 13 of 47
OPERATING CASH FLOW FROM THE PAPER SEGMENT
Operating Cash Flow - Paper (R$ million) | 3Q22 | 2Q22 | Δ Q-o-Q | 3Q21 | Δ Y-o-Y | LTM 3Q22 | ||||||||||||||||||
| Adjusted EBITDA1 | 931 | 703 | 32 | % | 588 | 58 | % | 2,796 | ||||||||||||||||
| Maintenance Capex2 | (128 | ) | (99 | ) | 29 | % | (80 | ) | 59 | % | (454 | ) | ||||||||||||
| Operating Cash Flow | 803 | 604 | 33 | % | 508 | 58 | % | 2,342 |
¹Excludes non-recurring items.
²Cash basis.
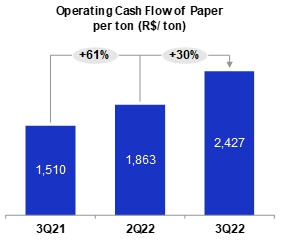
Operating cash generation per ton in the paper segment was R$2,427 in 3Q22, increasing 30% and 61%, respectively, from 2Q22 and 3Q21, driven by higher EBITDA per ton, which was partially offset by higher sustaining capex per ton.
Page 14 of 47
FINANCIAL PERFORMANCE
NET REVENUE
Suzano’s net revenue in 3Q22 was R$14,199 million, 84% of which came from exports (vs. 83% in both 2Q22 and 3Q21). Compared to 2Q22, the 23% growth in net revenue was the result of higher net average pulp and paper prices, 7% rise in USD vs. BRL and the 5% growth in sales volume. The 32% growth in consolidated net revenue compared to 3Q21 is mainly due to the increase in net average pulp price in USD (+25%) and paper (+40%); as well as the growth in sales volume (+5%).
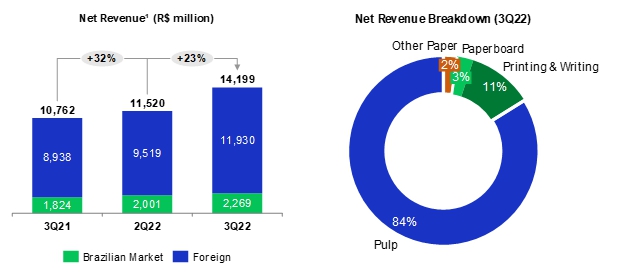
¹Does not include Portocel service revenue.
Page 15 of 47
CALENDAR OF SCHEDULED MAINTENANCE DOWNTIMES
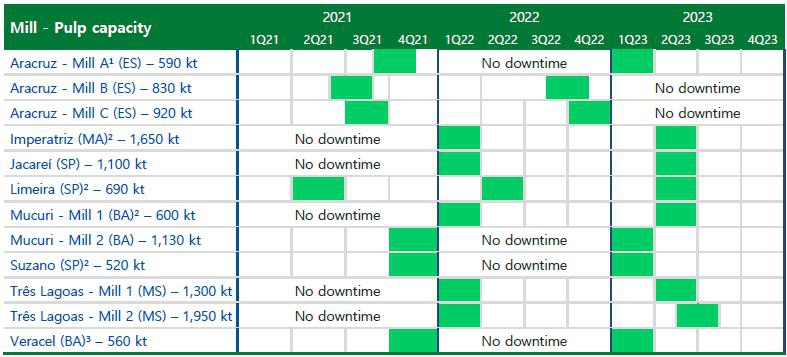
¹ Temporary downtime of production line A at Aracruz occurs in 4Q22, due to the partial retrofit of the Unit's recovery boiler.
² Includes integrated capacities and fluff.
³ Veracel is a joint operation between Suzano (50%) and Stora Enso (50%) with total annual capacity of 1,120 thousand tons.
COST OF GOODS SOLD
| COGS (R$ million) | 3Q22 | 2Q22 | Δ Q-o-Q | 3Q21 | Δ Y-o-Y | LTM 3Q22 | ||||||||||||||||||
| COGS (Income statement) | 6,473 | 6,123 | 6 | % | 5,300 | 22 | % | 23,721 | ||||||||||||||||
| (-) Depreciation, depletion and amortization | 1,640 | 1,625 | 1 | % | 1,482 | 11 | % | 6,297 | ||||||||||||||||
| Cash COGS | 4,833 | 4,498 | 7 | % | 3,818 | 27 | % | 17,425 | ||||||||||||||||
| Sales volume | 3,128 | 2,987 | 5 | % | 3,010 | 4 | % | 11,902 | ||||||||||||||||
| Cash COGS/ton (R$/ton) | 1,545 | 1,506 | 3 | % | 1,269 | 22 | % | 1,464 |
Cash COGS in 3Q22 totaled R$4,833 million, or R$1,545/ton. Compared to 2Q22, cash COGS increased 7%, due to higher sales volume, higher pulp and paper production costs and the 7% decline in average BRL against USD, which were partially offset by lower impact of maintenance downtimes. Although benefiting from the lower bunker, logistics costs were impacted by other effects, mainly the exchange rate. Cash COGS per ton increased 3% due to higher production costs and the foreign exchange effect.
Page 16 of 47
Compared to 3Q21, cash COGS increased 27%, chiefly due to the higher cash production cost, higher Brent prices affecting logistics costs and growth in sales volume, which were partially offset by lower impact of scheduled maintenance downtimes. In relation to the same period last year, cash COGS per ton increased 22% due to the factors mentioned above.
SELLING EXPENSES
| Selling Expenses (R$ million) | 3Q22 | 2Q22 | Δ Q-o-Q | 3Q21 | Δ Y-o-Y | LTM 3Q22 | ||||||||||||||||||
| Selling expenses (Income Statement) | 625 | 626 | 0 | % | 578 | 8 | % | 2,458 | ||||||||||||||||
| (-) Depreciation, depletion and amortization1 | 238 | 236 | 1 | % | 237 | 1 | % | 949 | ||||||||||||||||
| Cash selling expenses | 387 | 389 | -1 | % | 341 | 13 | % | 1,508 | ||||||||||||||||
| Sales volume | 3,128 | 2,987 | 5 | % | 3,010 | 4 | % | 11,902 | ||||||||||||||||
| Cash selling expenses/ton (R$/ton) | 124 | 130 | -5 | % | 113 | 9 | % | 127 |
Cash selling expenses decreased 1% from 2Q22, mainly due to the sales mix per region and lower Brent, partially offset by the 5% growth in sales volume and the 7% drop in BRL against USD. Cash selling expenses per ton decreased 5% due to the sales mix per region, partially offset by the foreign exchange variation.
Compared to 3Q21, the 13% increase in cash selling expenses mainly resulted from the increase in inland logistics expenses abroad (region mix and higher Brent) and higher sales volume (+4%). Cash selling expenses per ton increased 9% due to the increase in logistics expenses, as mentioned above.
Page 17 of 47
GENERAL AND ADMINISTRATIVE EXPENSES
General and Administrative Expenses (R$ million) | 3Q22 | 2Q22 | Δ Q-o-Q | 3Q21 | Δ Y-o-Y | LTM 3Q22 | ||||||||||||||||||
| General and Administrative Expenses | 393 | 365 | 8 | % | 320 | 23 | % | 1,617 | ||||||||||||||||
| Depreciation, depletion and amortization1 | 25 | 27 | -9 | % | 25 | -2 | % | 103 | ||||||||||||||||
| Cash general and administrative expenses | 368 | 338 | 9 | % | 294 | 25 | % | 1,513 | ||||||||||||||||
| Sales volume | 3,128 | 2,987 | 5 | % | 3,010 | 4 | % | 11,902 | ||||||||||||||||
| Cash general and administrative expenses/t (R$/ton) | 118 | 113 | 4 | % | 98 | 20 | % | 127 |
Compared to 2Q22, the 9% increase in cash general and administrative expenses is mainly due to higher expenses with third-party services. On a per-ton basis, these expenses increased 4% due to the same factor.
Compared to 3Q21, cash general and administrative expenses increased 25% mainly due to higher expenses with third-party services, salaries and variable compensation. On a per-ton basis, the 20% increase was driven by the same factors.
Other operating income (expenses) amounted to an expense of R$19 million in 3Q22, compared to an income of R$162 million in 2Q22 and R$19 million in 3Q21. The variation in relation to 2Q22 is essentially due to the absence of the updated fair value of biological assets (which happens in the second and fourth quarters of each year). Compared to 3Q21, the variation is mainly due to the lack of recognition of tax credits related to the right to exclude ICMS from the PIS and COFINS calculation base, which occurred in 3Q21, and higher provision for legal liabilities.
ADJUSTED EBITDA
| Consolidated | 3Q22 | 2Q22 | Δ Q-o-Q | 3Q21 | Δ Y-o-Y | LTM 3Q22 | ||||||||||||||||||
| Adjusted EBITDA (R$ million)¹ | 8,596 | 6,303 | 36 | % | 6,310 | 36 | % | 26,375 | ||||||||||||||||
| Adjusted EBITDA¹ Margin | 61 | % | 55 | % | 6 p.p. | 59 | % | 2 p.p. | 56 | % | ||||||||||||||
| Sales Volume (k ton) | 3,128 | 2,987 | 5 | % | 3,010 | 4 | % | 11,902 | ||||||||||||||||
| Adjusted EBITDA¹/ton (R$/ton) | 2,748 | 2,110 | 30 | % | 2,097 | 31 | % | 2,216 |
¹Excludes non-recurring items.
The 36% increase in Adjusted EBITDA in 3Q22 compared to 2Q22 is explained by: i) the increase of 12% in average net pulp price in USD and 11% in average net paper price in BRL; (ii) the 7% rise in average USD vs. BRL; and ii) the 5% growth in sales volume. Adjusted EBITDA was partially impacted by higher cash COGS per ton and higher SG&A expenses, as mentioned earlier. Adjusted EBITDA per ton increased 30% due to the price and FX factors, which was partially offset by higher cash COGS and SG&A expenses.
Page 18 of 47
Compared to 3Q21, the 36% increase in Adjusted EBITDA was due to the increase of 25% in net average price of pulp in USD and 40% in net average paper price in BRL, as well as the 4% growth in sales volume in the quarter, which were partially offset mainly by the increase in cash COGS per ton and higher SG&A expenses. Adjusted EBITDA per ton increased 31%, mainly due to the price factor, which was offset by the factors explained above.
FINANCIAL RESULT
| Financial Result (R$ million) | 3Q22 | 2Q22 | Δ Q-o-Q | 3Q21 | Δ Y-o-Y | LTM 3Q22 | |||||||||||||||||
| Financial Expenses | (1,216 | ) | (1,133 | ) | 7 | % | (1,213 | ) | 0 | % | (3,269 | ) | |||||||||||
| Interest on loans and financing (local currency) | (359 | ) | (355 | ) | 1 | % | (180 | ) | 99 | % | (897 | ) | |||||||||||
| Interest on loans and financing (foreign currency) | (692 | ) | (605 | ) | 14 | % | (619 | ) | 12 | % | (1,870 | ) | |||||||||||
| Capitalized interest1 | 97 | 66 | 47 | % | 4 | - | 123 | ||||||||||||||||
| Other financial expenses | (263 | ) | (239 | ) | 10 | % | (418 | ) | -37 | % | (625 | ) | |||||||||||
| Financial Income | 270 | 194 | 39 | % | 54 | 395 | % | 500 | |||||||||||||||
| Interest on financial investments | 229 | 168 | 36 | % | 44 | 416 | % | 416 | |||||||||||||||
| Other financial income | 41 | 26 | 57 | % | 10 | 303 | % | 84 | |||||||||||||||
| Monetary and Exchange Variations | (1,470 | ) | (4,460 | ) | - | (4,078 | ) | - | 1,758 | ||||||||||||||
| Foreign exchange variations (Debt) | (2,026 | ) | (5,986 | ) | - | (5,191 | ) | - | 2,091 | ||||||||||||||
| Other foreign exchange variations | 555 | 1,526 | - | 1,113 | - | (332 | ) | ||||||||||||||||
| Derivative income (loss), net2 | 890 | (1,576 | ) | - | (2,529 | ) | - | 4,313 | |||||||||||||||
| Operating Cash flow hedge | 139 | (945 | ) | - | (1,077 | ) | - | 189 | |||||||||||||||
| Cash flow - Cerrado project hedge | 44 | (147 | ) | - | - | - | 265 | ||||||||||||||||
| Debt hedge | 609 | (549 | ) | - | (1,303 | ) | - | 1,716 | |||||||||||||||
| Others3 | 97 | 65 | 50 | % | (149 | ) | - | (386 | ) | ||||||||||||||
| Net Financial Result | (1,527 | ) | (6,975 | ) | - | (7,765 | ) | - | 3,303 | ||||||||||||||
1Capitalized interest related to work in progress.
2Variation in mark-to-market adjustment (3Q22: -R$968 million | 2Q22: R$2,018 million), plus adjustments paid and received (3Q22 = R$160 million).
3Includes commodity hedge and embedded derivatives.
Page 19 of 47
Financial expenses were 7% higher than in 2Q22, mainly due to higher interest expenses in foreign currency resulting from the 7% drop in average BRL against USD. This impact was partially offset by the increase in capitalized interest arising from the capitalization of funds invested in the concluded phases of the Cerrado Project. Compared to 3Q21, financial expenses remained stable. Interest expenses in local currency increased due to the increase in the CDI in the period (3Q22: 3.27% | 3Q21: 1.23%), the main index of the debt in local currency, and the increase in interest expenses in foreign currency is mainly due to the impact of the Libor rate on Export Prepayment Agreements (EPPs). These effects were offset by: i) the reduction in other financial expenses, in turn explained by the premium incurred in the total repurchase of Senior Notes 2024 (R$ 227 million), which took place in 3Q21, as opposed to the absence of expenses of this nature in 3Q22; and (ii) increase in capitalized interest income (linked to the evolution of the Cerrado Project).
Financial income grew 39% and 395% compared to 2Q22 and 3Q21, respectively, due to the increase in the CDI in the period, reflecting the Company's cash position in local currency (CDI accumulated in the periods per quarter: 3Q22: 3.27% | 2Q22: 2.91% | 3Q21: 1.23%).
Inflation adjustment and exchange variation reduced the Company’s financial result by R$1,470 million, with the depreciation of closing BRL against USD of 3%, impacting the share of foreign currency debt (US$11.7 billion at the end of 3Q22). This effect was partially offset by the positive result of the weaker BRL on the Company’s cash held in foreign currency (75% at the end of 3Q22). Note that the accounting impact of exchange variation on foreign currency debt has a cash impact only on the respective maturities.
Operations with derivatives resulted in an income of R$890 million in 3Q22, due to the positive impact of variations in the fixed, coupon and Libor curves on debt and cash flow hedges, with the rise in the US interest rate, despite the negative effect of weaker BRL on hedge transactions. The mark-to-market adjustment of derivative instruments on September 30, 2022 generated a loss of R$968 million, compared to a loss of R$2,018 million on June 30, 2022, down R$1,050 million. Note that the impact of BRL depreciation on the derivatives portfolio generates a cash impact only upon the respective maturities. The net effect on cash, which refers to the maturity of derivative operations in the second quarter, was a negative R$160 million (R$236 million expense from debt hedge and R$76 million gain from operating hedge).
As a result of the above factors, net financial result in 3Q22, considering all financial expense and income lines, was an expense of R$1,527 million, compared to R$6,975 million in 2Q22 and R$7,765 million in 3Q21.
Page 20 of 47
DERIVATIVE OPERATIONS
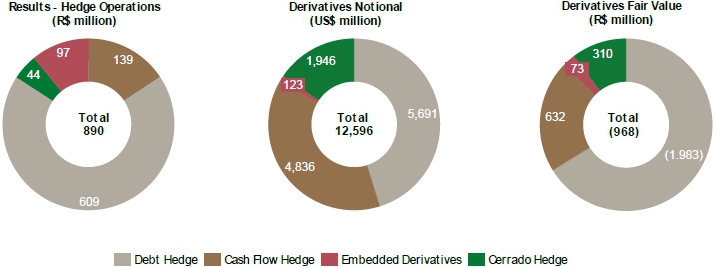
Suzano carries out derivative operations exclusively for hedging purposes. The following table reflects the position of derivative hedging instruments on September 30, 2022:
| Notional (US$ milion) | Fair Value (R$ million) | |||||||||||||||
| Hedge1 | Sep/22 | Jun/22 | Sep/22 | Jun/22 | ||||||||||||
| Debt | 5,691 | 5,898 | (1,983 | ) | (2,829 | ) | ||||||||||
| Cash Flow – Operating (ZCC + NDF) | 4,836 | 4,025 | 632 | 569 | ||||||||||||
| Cash Flow - Cerrado2 (ZCC + NDF) | 1,946 | 675 | 310 | 266 | ||||||||||||
| Others3 | 123 | 121 | 73 | (24 | ) | |||||||||||
| Total | 12,596 | 10,719 | (968 | ) | (2,018 | ) | ||||||||||
¹See note 4 of the 3Q22 Quarterly Financial Statements (ITR) for further details and fair value sensitivity analysis.
2Hedge program related to capex in BRL (ZCC) and EUR (NDF) of the Cerrado Project.
3Considers the hedge of embedded derivative.
The Company’s foreign exchange exposure policy seeks to minimize the volatility of its cash generation and to ensure greater flexibility in cash flow management. On October 27, 2022, the Company's Board of Directors authorized the increase in the maximum term for contracting operational hedging instruments from 18 months to 24 months, seeking greater protection of its cash flow in the long term. Therefore, currently, the policy stipulates that surplus dollars can be partially hedged (at least 40% and up to 75% of of exchange variation exposure over the next 24 months) through plain vanilla instruments such as Zero Cost Collar (ZCC) and Non-Deliverable Forward (NDF). At the end of 3Q22, coverage was at 66% of foreign exchange exposure (still considering 18 months in effect at the end of the quarter).
Considering the foreign exchange exposure related to Capex in the Cerrado Project, since approximately 67% of Capex is pegged to local currency, the Board of Directors approved on October 28, 2021, a program for contracting additional specific hedge operations to protect from such exposure. The program approved is established in the Derivatives Management Policy available on the Investor Relations website, which initially involved a maximum amount (notional) of up to US$1 billion and a term of operations of up to 36 months. On July 27th, the Board of Directors approved the expansion of the program, increasing the maximum amount (notional) to US$1.5 billion while maintaining the previously established term. To ensure transparency with regard to the Cerrado Project's hedge program, since 4Q21, the Company has been prominently disclosing the operations contracted.
Given that around 33% of the Cerrado Project's CAPEX is denominated in the foreign currency Euro, in 3Q22, the Company contracted hedges through NDFs to protect the Cerrado Project’s capex exposure in EUR, converting it to USD. These hedges are established in the Derivatives Management Policy available on the Investor Relations website.
ZCC transactions establish minimum and maximum limits for the exchange rate that minimize adverse effects in the event of significant appreciation of the BRL. As such, if the exchange rate is within such limits, the Company neither pays nor receives any financial adjustments. This characteristic allows for capturing greater benefits from export revenue in a potential scenario of BRL appreciation versus USD within the range contracted. In cases of extreme BRL appreciation, the Company is protected by the minimum limits, which are considered appropriate for the operation. However, this protection instrument also limits, temporarily and partially, potential gains in scenarios of extreme BRL depreciation when exchange rates exceed the maximum limits contracted.
Page 21 of 47
On September 30, 2022, the outstanding notional value of operations involving forward USD sales through ZCCs related to Cash Flows (including those related to the Cerrado Project) was US$5,815 million, with an average forward rate ranging from R$5.60 to R$6.61 and maturities distributed between October 2022 and August 2024. On the same date, the outstanding notional value of operations involving forward USD sales through NDFs was US$248 million, whose maturities are distributed between August and November 2023 and with an average rate of R$5.54. Regarding hedge for foreign exchange exposure in EUR, the outstanding notional value of forward EUR purchases at the end of 3Q22 was €708 million (US$720 million), with an average contracted of 1.02 EUR/USD and maturities through July 2024. In 3Q22, cash flow and Cerrado Project hedge operations resulted in a gain of R$183 million. The mark-to-market adjustment (“MtM” or “fair value”) of these operations totaled R$942 million, of which R$632 million related to cash flow hedges and R$310 million related to the Cerrado Project hedge.
The following table presents a sensitivity analysis of the cash impact that the Company could have on its cash flow hedge portfolios (ZCC and NDF) if the exchange rate remains the same as at the end of 3Q22 (R$/US$ = 5.41) in the coming quarters, as well as the projected cash impact for R$0.10 variations below/above the strike of put/call options, respectively, defined in each quarter. Note that the figures presented in the table are the Company’s projections based on the end-of-period curves and could vary depending on market conditions.
| Cash Adjustment (R$ million) | |||||||||||||||||||||
| Maturity (up to) | Strike Range | Notional (US$ million) | Actual | Exchange rate 3Q22 (R$5.41) | Sensitivity at R$0.10 / US$ variation (+/-)1 | ||||||||||||||||
| Zero Cost Collars | |||||||||||||||||||||
| 3Q22 | - | - | 74 | - | - | ||||||||||||||||
| 4Q22 | 5.40 - 6.36 | 448 | - | 35 | (45 | ) | |||||||||||||||
| 1Q23 | 5.56 - 6.85 | 915 | - | 159 | (91 | ) | |||||||||||||||
| 2Q23 | 5.73 - 6.84 | 1,074 | - | 360 | (107 | ) | |||||||||||||||
| 3Q23 | 5.42 - 6.20 | 729 | - | 60 | (73 | ) | |||||||||||||||
| 4Q23 | 5.55 - 6.34 | 1,046 | - | 152 | (105 | ) | |||||||||||||||
| 1Q24 | 5.44 - 6.17 | 377 | - | 19 | (38 | ) | |||||||||||||||
| Total | 5.55 - 6.53 | 4,588 | 74 | 784 | (459 | ) | |||||||||||||||
| NDF | |||||||||||||||||||||
| 2Q22 | - | - | 2 | - | - | ||||||||||||||||
| 3Q23 | 5.53 | 215 | - | 26 | (21 | ) | |||||||||||||||
| 4Q23 | 5.64 | 34 | - | 8 | (3 | ) | |||||||||||||||
| Total | 5.54 | 248 | 2 | 34 | (25 | ) | |||||||||||||||
| Zero Cost Collars Cerrado | |||||||||||||||||||||
| 1Q23 | 5.42 - 6.13 | 133 | - | 4 | (13 | ) | |||||||||||||||
| 2Q23 | 5.68 - 6.78 | 292 | - | 80 | (29 | ) | |||||||||||||||
| 3Q23 | 5.87 - 7.22 | 300 | - | 140 | (30 | ) | |||||||||||||||
| 4Q23 | 5.85 - 7.00 | 341 | - | 150 | (34 | ) | |||||||||||||||
| 1Q24 | 5.87 - 6.98 | 95 | - | 44 | (9 | ) | |||||||||||||||
| 2Q24 | 6.10 - 7.44 | 58 | - | 40 | (6 | ) | |||||||||||||||
| 3Q24 | 6.35 - 8.34 | 9 | - | 8 | (1 | ) | |||||||||||||||
| Total | 5.78 - 6.94 | 1,227 | - | 466 | (123 | ) | |||||||||||||||
Page 22 of 47
| Cash Adjustment (R$ million) | |||||||||||||||||||||
| Maturity (up to) | Strike Range | Notional (US$ million) | Actual | Exchange rate 3Q22 (€0.98) | Sensitivity at | ||||||||||||||||
| NDF – Cerrado Project (EUR/USD) | |||||||||||||||||||||
| 3T22 | - | - | - | - | - | ||||||||||||||||
| 4T22 | 1.00 | 115 | - | (12 | ) | 62 | |||||||||||||||
| 1T23 | 1.00 | 100 | - | (13 | ) | 54 | |||||||||||||||
| 2T23 | 1.01 | 49 | - | (8 | ) | 26 | |||||||||||||||
| 3T23 | 1.01 | 96 | - | (17 | ) | 51 | |||||||||||||||
| 4T23 | 1.02 | 97 | - | (21 | ) | 51 | |||||||||||||||
| 1T24 | 1.03 | 98 | - | (26 | ) | 51 | |||||||||||||||
| 2T24 | 1.03 | 96 | - | (26 | ) | 50 | |||||||||||||||
| 3T24 | 1.04 | 69 | - | (21 | ) | 36 | |||||||||||||||
| Total | 1.02 | 720 | - | (145 | ) | 383 | |||||||||||||||
¹Note: sensitivity of adjustments for exchange rates above the strike.
Page 23 of 47
To mitigate the effects of exchange and interest rate variations on its debt and its cash flows, the Company also uses currency and interest rate swaps. Swap contracts are entered into considering different interest rates and inflation indices in order to mitigate the mismatch between financial assets and liabilities.
On September 30, 2022, the Company had an outstanding amount (notional value) of US$5,691 million in swap contracts as shown in the table below. In 3Q22, the result of debt hedge transactions was a gain of R$609 million, mainly due to the positive impact of fixed, coupon and Libor curves in the period. The mark-to-market adjustment (fair value) of these operations was a loss of R$1,983 million.
| Notional (US$ million) | Fair Value (R$ million) | |||||||||||||||||||||||
| Debt Hedge | Maturity (up to) | Currency | Sep/22 | Jun/22 | Sep/22 | Jun/22 | ||||||||||||||||||
| Swap (PRÉ x USD) | 2024 | USD | 350 | 350 | (582 | ) | (597 | ) | ||||||||||||||||
| Swap (CDI x USD) | 2026 | USD | 1,864 | 2,065 | (2,694 | ) | (3,100 | ) | ||||||||||||||||
| Swap (IPCA x USD) | 2023 | USD | 121 | 121 | (52 | ) | (37 | ) | ||||||||||||||||
| Swap (LIBOR x USD) | 2027 | USD | 3,200 | 3,200 | 1,073 | 617 | ||||||||||||||||||
| Swap (IPCA x CDI) | 2023 | BRL | 156¹ | 161 | 271 | 290 | ||||||||||||||||||
| Total | 5,691 | 5,898 | (1,983 | ) | (2,827 | ) | ||||||||||||||||||
1Translated at the closing exchange rate (5.24).
The following table presents a sensitivity analysis1 of the cash impact that the Company could have on its debt hedge portfolio (swaps) if the exchange rate remains the same as at the end of 3Q22 (R$/US$ = 5.41) in the coming quarters, as well as the projected variation in cash impact for each R$0.10 variation on the same reference exchange rate (3Q22). Note that the figures presented in the table are the Company’s projections based on the end-of-period curves and could vary depending on market conditions.
Page 24 of 47
| Cash Adjustment (R$ million) | ||||||||||||||||
| Maturity (up to) | Notional (US$ million) | Actual | R$ / US$ = 5.41 (3Q22) | Sensitivity at R$ 0.10 / US$ variation (+/-)1 | ||||||||||||
| 3Q22 | - | (236 | ) | - | - | |||||||||||
| 4Q22 | 83 | - | 148 | (4 | ) | |||||||||||
| 2023 | 1,854 | - | 716 | (37 | ) | |||||||||||
| 2024 | 1,474 | - | (8 | ) | (38 | ) | ||||||||||
| 2025 | 1,379 | - | (1,019 | ) | (87 | ) | ||||||||||
| >2026 | 901 | - | (1,214 | ) | (85 | ) | ||||||||||
| Total | 5,691 | (236 | ) | (1,377 | ) | (251 | ) | |||||||||
1Sensitivity analysis considers variation only in the exchange rate (R$/US$), while other variables are presumed constant.
Other transactions involving the Company’s derivatives are related to the embedded derivative resulting from forestry partnerships and commodity hedges, as shown in the table.
| Notional (US$ million) | Fair Value (R$ million) | Cash Adjustment (R$ million) | ||||||||||||||||||||||||||||
| Other hedges | Maturity (up to) | Index | Sep/22 | Jun/22 | Sep/22 | Jun/22 | Sep/22 | Jun/22 | ||||||||||||||||||||||
| Embedded derivative | 2038 | Fixed USD | USD US-CPI | 123 | 121 | 73 | (24 | ) | - | - | |||||||||||||||||||||
| Total | 123 | 121 | 73 | (24 | ) | - | - | |||||||||||||||||||||||
A portion of the forestry partnership agreements and standing timber supply agreements is denominated in USD per cubic meter of standing timber, adjusted by U.S. inflation measured by the Consumer Price Index (CPI), which is not related to inflation in the economic environment where the forests are located and, hence, constitutes an embedded derivative. This instrument, presented in the table above, consists of a sale swap contract of the variations in the US-CPI during the period of the contracts. See note 4 of the 3Q22 Financial Statements for more details and for a sensitivity analysis of the fair value in case of a sharp rise in the US-CPI and USD. On September 30, 2022, the outstanding (notional) value of the operation was US$123 million. The result from this swap in 3Q22 was a gain of R$97 million. The mark-to-market (fair value) adjustment of these operations generated a gain of R$73 million at the end of the quarter.
The Company is also exposed to the price of some commodities and, therefore, continually assesses the contracting of derivative financial instruments to mitigate such risks.
On September 30, 2022, the Company did not have any outstanding commodity hedge transactions.
Page 25 of 47
NET INCOME (LOSS)
In 3Q22, the Company posted net income of R$5,448 million, compared to R$182 million in 2Q22 and net loss of R$959 million in 3Q21. Net income growth in relation to 2Q22 is due to the higher financial result, which in turn was caused by the lower negative effect of exchange rate depreciation on debt and the positive result of derivative operations, as well as the increase in operating result. Income growth in relation to 3Q21 is explained by the same factors.
DEBT
| Debt (R$ million) | 3Q22 | 2Q22 | Δ Q-o-Q | 3Q21 | Δ Y-o-Y | |||||||||||||||
| Local Currency | 12,611 | 13,224 | -5 | % | 13,364 | -6 | % | |||||||||||||
| Short Term | 1,615 | 1,754 | -8 | % | 1,831 | -12 | % | |||||||||||||
| Long Term | 10,996 | 11,470 | -4 | % | 11,534 | -5 | % | |||||||||||||
| Foreign Currency | 63,449 | 61,982 | 2 | % | 63,783 | -1 | % | |||||||||||||
| Short Term | 1,236 | 1,718 | -28 | % | 455 | 171 | % | |||||||||||||
| Long Term | 62,213 | 60,264 | 3 | % | 63,328 | -2 | % | |||||||||||||
| Gross Debt | 76,060 | 75,206 | 1 | % | 77,148 | -1 | % | |||||||||||||
| (-) Cash | 18,272 | 20,307 | -10 | % | 18,930 | -3 | % | |||||||||||||
| Net debt | 57,788 | 54,899 | 5 | % | 58,218 | -1 | % | |||||||||||||
| Net debt/Adjusted EBITDA¹(x) - R$ | 2.2 | x | 2.3 | x | -0.1 | x | 2.8 | x | -0.6 | x | ||||||||||
| Net debt/Adjusted EBITDA¹(x) - US$ | 2.1 | x | 2.3 | x | -0.2 | x | 2.7 | x | -0.6 | x |
1Excludes non-recurring items.
Page 26 of 47
On September 30, 2022, gross debt totaled R$76.1 billion and was composed of 96% long-term maturities and 4% short-term maturities. Foreign currency debt corresponded to 83% of the Company's total debt at the end of the quarter. The percentage of gross debt denominated in foreign currency, considering the effect of debt hedge, was 96%. Compared to 2Q22, gross debt increased 1%, mainly due to the decline in end-of-period BRL against USD (3%), partially offset by the payments of principal and interest in the period.
Suzano contracts debt in foreign currency as a natural hedge, since net operating cash generation is mostly denominated in foreign currency (USD) due to its predominant status as an exporter. This structural exposure allows the Company to match loans and financing payments in USD with receivable flows from sales.
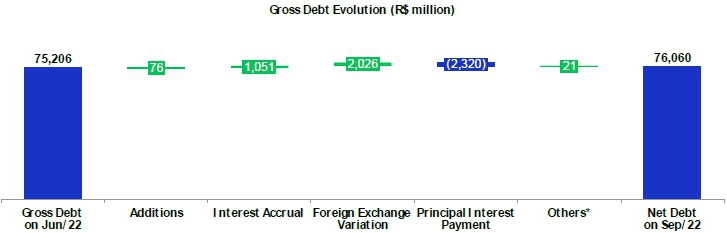
*Corresponding mainly to transaction costs (issue, funding goodwill, discount and loss on business combinations, etc.).
On September 30, 2022, the total average cost of debt in USD was 4.7% p.a. (considering the debt in BRL adjusted by the market swap curve), compared to 4.5% p.a. on June 30, 2022. The average term of consolidated debt at the end of the quarter was 82 months, compared to 84 months at the end of June 2022.
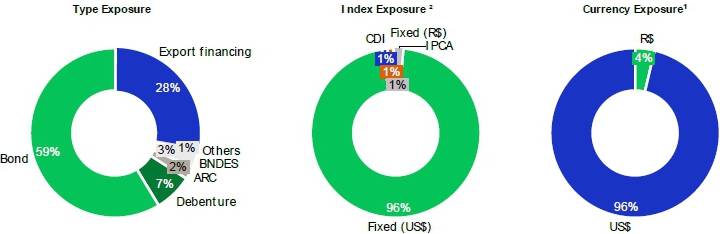
1Considers the portion of debt with currency swaps. The original debt was 83% denominated in USD and 17% in BRL.
2Considers the portion of debt with currency swaps. The exposure of the original debt was: Fixed (US$) – 60%, Libor – 23%, CDI – 11%, Other (Fixed R$, IPCA, TJLP, others) – 6%.
Page 27 of 47
Cash and cash equivalents and financial investments on September 30, 2022 amounted to R$18.3 billion, 75% of which was in foreign currency, allocated in remunerated accounts or in short-term fixed-income investments. The remaining 25% was invested in local currency fixed-income bonds (mainly CDBs, but also in government bonds and others), remunerated at the CDI rate.
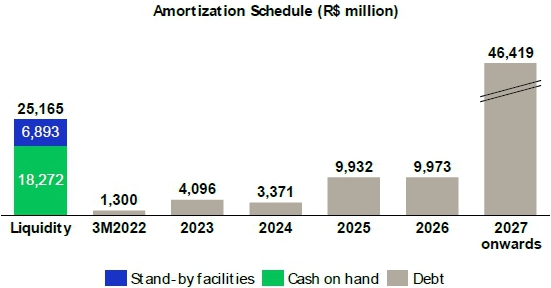
On September 30, 2022, the Company also had two stand-by credit facilities totaling R$6.9 billion (US$1.3 billion) available through February 2024 (US$100 million) and February 2027 (US$1.2 billion). These facilities strengthen the company's liquidity position and can be withdrawn during times of uncertainty. As a result, the cash and equivalents of R$18.3 billion plus the credit facilities described above amounted to a readily available cash position of R$25.2 billion on September 30, 2022.
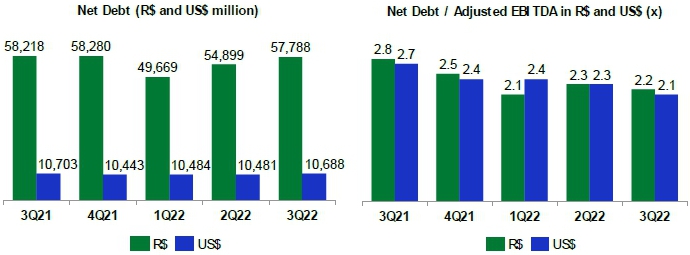
On September 30, 2022, net debt stood at R$57.8 billion (US$10.7 billion), compared to R$54.9 billion (US$10.5 billion) on June 30, 2022. The increase in net debt is explained by the reduction in the Company’s cash position.
Financial leverage, measured as the ratio of net debt to Adjusted EBITDA in BRL, was 2.2 times on September 30, 2022, compared to 2.3 times in 2Q22. The same ratio in USD (the measure established in Suzano’s financial policy) fell to 2.1 times on September 30, 2022 (2.3 times in 2Q22).
Page 28 of 47
The breakdown of total gross debt between trade and non-trade finance on September 30, 2022 is shown below:
| 2022 | 2023 | 2024 | 2025 | 2026 | 2027 onwards | Total | ||||||||||||||||||||||
| Trade Finance¹ | 76 | % | 4 | % | 96 | % | 59 | % | 51 | % | 9 | % | 27 | % | ||||||||||||||
| Non Trade Finance² | 24 | % | 96 | % | 4 | % | 41 | % | 49 | % | 91 | % | 73 | % | ||||||||||||||
1ECN, EPP
2Bonds, BNDES, CRA, Debentures, among others.
CAPEX
In 3Q22, capital expenditures (cash basis) totaled R$4,043 million, down 9% from 2Q22, due to lower investments in Land and Forests as a result of the payment made for acquiring interest in Parkia the previous quarter, as disclosed in the Material Fact notice of June 29, 2022. The reduction was partially offset by the evolution of the Cerrado Project and the increase in forestry maintenance.
Compared to 3Q21, the increase is mainly due to the progress of the Cerrado Project and higher spending on Land and Forests, notably the Caravelas acquisition, as disclosed in the Material Fact notice of August 9, 2022.
Page 29 of 47
| Investments (R$ million) | 3Q22 | 2Q22 | Δ Q-o-Q | 3Q21 | Δ Y-o-Y | LTM 3Q22 | Guidance | |||||||||||||||||||||
| Maintenance | 1,441 | 1,248 | 15 | % | 1,105 | 30 | % | 5,466 | 5,471 | |||||||||||||||||||
| Industrial maintenance | 219 | 247 | -11 | % | 154 | 42 | % | 984 | 1,050 | |||||||||||||||||||
| Forestry maintenance | 1,183 | 987 | 20 | % | 919 | 29 | % | 4,372 | 4,392 | |||||||||||||||||||
| Others | 39 | 14 | 182 | % | 32 | 20 | % | 110 | 30 | |||||||||||||||||||
| Expansion and modernization | 127 | 114 | 11 | % | 49 | 158 | % | 439 | 534 | |||||||||||||||||||
| Land and forestry | 583 | 1,769 | -67 | % | 77 | 654 | % | 2,575 | 2,647 | |||||||||||||||||||
| Port terminals | 12 | 34 | -64 | % | 107 | -89 | % | 159 | 119 | |||||||||||||||||||
| Others | 15 | 4 | - | 0 | - | 30 | 92 | |||||||||||||||||||||
| Cerrado Project | 1,866 | 1,270 | 47 | % | 196 | 851 | % | 4,716 | 7,276 | |||||||||||||||||||
| Total | 4,043 | 4,439 | -9 | % | 1,535 | 163 | % | 13,385 | 16,139 |
CERRADO PROJECT
The Cerrado Project is progressing according to schedule on its physical and financial curves (on time and on budget), closing the third quarter of 2022 with the “inside the fence” execution (which corresponds to industrial and infrastructure investments) reaching physical progress of 31% and 24% of financial progress (R$3,505 million). The Company estimates the start-up of the new pulp mill, located in the municipality of Ribas do Rio Pardo (MS) and with an annual capacity of 2,550 thousand tons, for the second half of 2022.
OPERATING CASH GENERATION
| Operating Cash Flow - Consolidated (R$ million) | 3Q22 | 2Q22 | Δ Q-o-Q | 3Q21 | Δ Y-o-Y | LTM 3Q22 | ||||||||||||||||||
| Adjusted EBITDA1 | 8,596 | 6,303 | 36 | % | 6,310 | 36 | % | 26,375 | ||||||||||||||||
| Maintenance Capex2 | (1,441 | ) | (1,248 | ) | 15 | % | (1,105 | ) | 30 | % | (5,466 | ) | ||||||||||||
| Operating Cash Flow | 7,155 | 5,055 | 42 | % | 5,204 | 37 | % | 20,909 | ||||||||||||||||
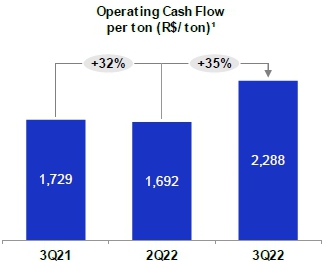
| Operating Cash Flow (R$/ton) | 2,288 | 1,692 | 35 | % | 1,729 | 32 | % | 1,757 |
1Excludes non-recurring items.
2Cash basis.
Operating cash generation, measured by adjusted EBITDA less sustaining capex (cash basis), amounted to R$7.2 billion in 3Q22. The increase of 35% and 32%, respectively, in operating cash generation per ton in relation to 2Q22 and 3Q21, is due to higher adjusted EBITDA per ton, partially offset by higher sustaining capex in both periods.
Page 30 of 47
FREE CASH FLOW
| Free Cash Flow (R$ million) | 3Q22 | 2Q22 | Δ Q-o-Q | 3Q21 | Δ Y-o-Y | LTM 3Q22 | ||||||||||||||||||
| Adjusted EBITDA | 8,596 | 6,303 | 36 | % | 6,310 | 36 | % | 26,375 | ||||||||||||||||
| (-) Total Capex¹ | (5,527 | ) | (4,568 | ) | 21 | % | (1,724 | ) | 221 | % | (15,049 | ) | ||||||||||||
| (-) Leases contracts – IFRS 16 | (244 | ) | (244 | ) | 0 | % | (222 | ) | 10 | % | (1,058 | ) | ||||||||||||
| (+/-)Δ Working capital | (1,315 | ) | (349 | ) | 277 | % | 98 | - | (2,127 | ) | ||||||||||||||
| (-) Net interest² | (1,381 | ) | (378 | ) | 266 | % | (1,365 | ) | 1 | % | (3,739 | ) | ||||||||||||
| (-) Income taxes | (122 | ) | (25 | ) | 391 | % | (11 | ) | 965 | % | (240 | ) | ||||||||||||
| (-) Dividend payment/Share Buyback Program | (1,402 | ) | (1,304 | ) | 8 | % | 0 | - | (3,713 | ) | ||||||||||||||
| (+/-) Derivative cash adjustment | (160 | ) | 473 | - | (221 | ) | -28 | % | (240 | ) | ||||||||||||||
| Free cash flow | (1,556 | ) | (92 | ) | - | 2,864 | - | 209 | ||||||||||||||||
| (+) Capex ex-maintenance | 2,885 | 3,276 | -10 | % | 499 | 492 | % | 10,183 | ||||||||||||||||
| (+) Dividend payment/Share Buyback Program | 1,402 | 1,304 | 8 | % | 0 | - | 3,713 | |||||||||||||||||
| Free cash flow - Adjusted | 2,732 | 4,488 | -38 | % | 3,363 | -17 | % | 14,106 |
1Accrual basis, except for the Parkia deal in cash basis (disbursement of R$1.7 billion, according to the Cash Flow Statement).
2Considers interest paid on debt, interest received on financial investments and premiums paid resulting from liability management operations.
3Free cash flow prior to dividend payments and capex ex-maintenance (accrual basis).
Page 31 of 47
Adjusted free cash flow stood at R$2,732 million in 3Q22, compared to R$4,488 million in 2Q22 and R$3,363 million in 3Q21. Compared to the previous quarter, free cash flow decreased 38%, due to: (i) the increase in sustaining capex on the accrual basis; (ii) the higher concentration of net interest payments (especially related to bonds); (iii) the variation in working capital, notably the decline in accounts receivable caused by the increase in pulp prices and higher sales volume, partially offset by the increase in trade accounts payable accruals; and (iv) the disbursement resulting from derivative adjustments, in turn explained by swap operations, as opposed to the positive cash adjustment in the previous quarter. These effects were partially compensated by the increase in adjusted EBITDA, as discussed earlier.
Compared to 3Q21, the 17% decrease was mainly due to: (i) higher sustaining capex on an accrual basis; (ii) decline in working capital, mainly the decrease in accounts receivable as against an increase in 3Q21; and (iii) the higher income tax and social contribution payments.
EVOLUTION OF NET DEBT
The changes in net debt in 3Q22 were:
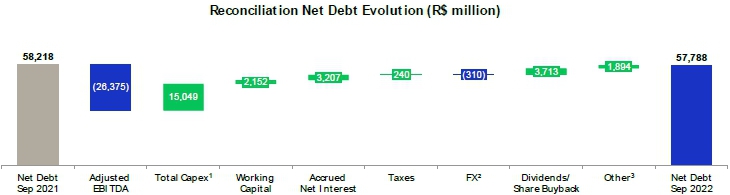
1Accrual basis, except for the Parkia deal (cash effect of R$1.7 billion in 2Q22, according to the Cash Flow Statement).
2Net of exchange variations on cash and financial investments.
3Considers amounts related to derivative adjustments, lease agreements and other items.
Page 32 of 47
ESG
Regarding the biodiversity commitment, Suzano concluded during the first semester of 2022 the definition of the executive project and the governance model, which resulted, in this third quarter, in the beginning of the journey to connect the fragments of native forests, with the planting of the first hectares of habitat restoration along the ecological corridors. This was an important milestone in the evolution of the commitment to connect half a million hectares of priority areas for biodiversity conservation in the Cerrado, Atlantic Forest and Amazon, by 2030. Highlighting that Suzano's long-term commitment to biodiversity represents the most ambitious objective in the world on the topic already announced by companies, not only in the Pulp & Paper sector but also in other industries.
TOTAL OPERATIONAL EXPENDITURE - PULP
As disclosed through a Material Fact notice on March 30, 2022, the estimated total operating expenditure for 2027 is approximately R$1,500/t and the trend for the indicator remains as planned, considering the foreign exchange and monetary assumptions used.
EVENTS SUBSEQUENT TO THE REPORTING PERIOD
On October 24, 2022, the Company announced all the quotas held by KC Brasil in a new company that will be the holder of the assets related to the business of manufacturing, marketing, distributing and/or selling of tissue products, including toilet paper, paper towels, napkins, tissues, as well as other paper products in Brazil, including ownership of the brand “NEVE”. As part of the deal, the other global brands currently used by KC Brasil will be licensed to the Company for a specific term. The base price of the transaction is US$175 million, subject to the usual adjustments for this type of transaction and will be paid in full on its completion date.
The main asset included in the Transaction consists on a tissue production plant, located in the municipality of Mogi das Cruzes, in the State of São Paulo, with an annual production capacity of approximately 130 thousand tons.
Page 33 of 47
The Transaction is aligned with the Company’s long-term strategy to “advance in the links of the value chain”, as is widely public knowledge, representing geographic complementarity and synergy gains with its current consumer goods business (tissue).
The Company informs that the Transaction does not have materiality to its financial leverage and/or indebtedness.
The conclusion of the Transaction is subject to the verification of conditions precedent commonly practiced by the market in this type of transaction, including the approval by the Administrative Council for Economic Defense (CADE) and the conclusion of the corporate reorganization of KC Brasil for the incorporation and contribution of assets related to the tissue business in the Target Company. The Transaction does not depend on the approval of the Company's General Shareholders' Meeting, as it does not meet the parameters established in article 256 of the Brazilian Corporation Law.
CAPITAL MARKETS
On September 30, 2022, Suzano’s stock was quoted at R$44.50/share (SUZB3) and US$8.25/share (SUZ). The Company’s stock is listed on the Novo Mercado, the listing segment of the São Paulo Stock Exchange (B3 – Brasil, Bolsa e Balcão) with the highest corporate governance standards, and on the New York Stock Exchange (NYSE) - Level II.
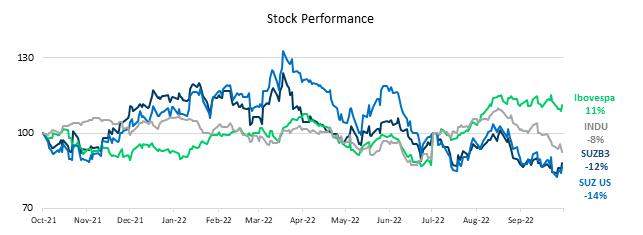
Source: Bloomberg.
Page 34 of 47
Source: Bloomberg.
According to Notices to the Market disclosed on August 3 and September 27, 2022, Suzano made progress on its share buyback programs, concluding two programs in effect during the previous quarter (both involving 20 million shares), repurchasing 40 million shares at an average price of R$48.33/share in the May 2022 Program and R$46.84 share in the July 2022 Program. The operations totaled R$1,904 million.
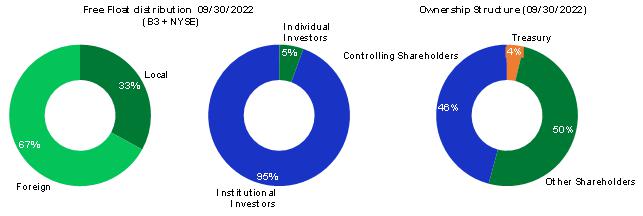
Suzano’s market capitalization (ex-treasury shares) on September 30, 2022 stood at R$58.3 billion. Free float in 3Q22 corresponded to 50% of total capital.
As disclosed in a Material Fact notice on October 27th, the Board of Directors approved approved a new share buyback program (Program “October/22”) by which the Company may repurchase up to 20 million common shares. The maximum period for acquisitions under the new buyback program is 18 months from the date of approval by the Board of Directors, ending on April 27, 2024 (including).
Page 35 of 47
FIXED INCOME
| Unit | Sep/22 | Jun/22 | Sep/21 | Δ Q-o-Q | Δ Y-o-Y | |||||||||||||||||
| Fibria 2025 - Price | USD/k | 95.72 | 99.32 | 107.02 | -3.6 | % | -10.6 | % | ||||||||||||||
| Fibria 2025 - Yield | % | 6.04 | 4.29 | 1.79 | 40.8 | % | 238.2 | % | ||||||||||||||
| Suzano 2026 - Price | USD/k | 97.18 | 102.23 | 116.49 | -4.9 | % | -16.6 | % | ||||||||||||||
| Suzano 2026 - Yield | % | 6.60 | 5.13 | 2.10 | 28.7 | % | 213.9 | % | ||||||||||||||
| Fibria 2027 - Price | USD/k | 95.88 | 99.31 | 114.49 | -3.5 | % | -16.3 | % | ||||||||||||||
| Fibria 2027 - Yield | % | 6.62 | 5.67 | 2.55 | 16.6 | % | 159.3 | % | ||||||||||||||
| Suzano 2028 - Price | USD/k | 77.75 | 81.57 | 97.84 | -4.7 | % | -20.5 | % | ||||||||||||||
| Suzano 2028 - Yield | % | 7.16 | 6.12 | 2.84 | 17.0 | % | 151.7 | % | ||||||||||||||
| Suzano 2029 - Price | USD/k | 93.06 | 99.24 | 118.12 | -6.2 | % | -21.2 | % | ||||||||||||||
| Suzano 2029 - Yield | % | 7.40 | 6.14 | 3.19 | 20.4 | % | 131.9 | % | ||||||||||||||
| Suzano 2030 - Price | USD/k | 86.29 | 92.01 | 111.69 | -6.2 | % | -22.7 | % | ||||||||||||||
| Suzano 2030 - Yield | % | 7.47 | 6.35 | 3.37 | 17.7 | % | 121.8 | % | ||||||||||||||
| Suzano 2031 - Price | USD/k | 77.99 | 81.33 | 103.28 | -4.1 | % | -24.5 | % | ||||||||||||||
| Suzano 2031 - Yield | % | 7.34 | 6.66 | 3.34 | 10.3 | % | 120.1 | % | ||||||||||||||
| Suzano 2032 - Price | USD/k | 71.54 | 75.66 | 96.96 | -5.4 | % | -26.2 | % | ||||||||||||||
| Suzano 2032 - Yield | % | 7.42 | 6.61 | 3.48 | 12.3 | % | 113.4 | % | ||||||||||||||
| Suzano 2047 - Price | USD/k | 90.06 | 95.44 | 131.75 | -5.6 | % | -31.6 | % | ||||||||||||||
| Suzano 2047 - Yield | % | 7.93 | 7.40 | 4.82 | 7.1 | % | 64.4 | % | ||||||||||||||
| Treasury 10 years | % | 3.83 | 3.01 | 1.49 | 27.1 | % | 157.5 | % | ||||||||||||||
Note: Senior Notes issued with face value of 100 USD/k.
RATING
| Agency | National Scale | Global Scale | Outlook | |||
| Fitch Ratings | AAA | BBB- | Stable | |||
| Standard & Poor’s | br.AAA | BBB- | Stable | |||
| Moody’s | Aaa.br | Baa3 | Stable |
Page 36 of 47
UPCOMING EVENTS
Earnings Conference Call (3Q22)
Date: October 28, 2022 (Friday)
| Portuguese (simultaneous translation) | English |
| 10:00 a.m. (Brasília) | 10:00 a.m. (Brasília) |
| 9:00 a.m. (New York time) | 9:00 a.m. (New York) |
| 2:00 p.m. (London) | 2:00 p.m. (London) |
| Tel: +55 (11) 4090-1621 | Tel: +1 844 204 8942 |
Please connect 10 minutes before the conference call is scheduled to begin.
The conference call will be held in English and feature a presentation, with simultaneous webcast. The access links will be available on the Company’s Investor Relations website https:/ir.suzano.com.br/
If you are unable to participate, the webcast link will be available for future consultation on the Investor Relations website of Suzano S.A.
IR CONTACTS
Marcelo Bacci
Camila Nogueira
Roberto Costa
Mariana Dutra
Luísa Puccini
Arthur Trovo
Tel: +55 (11) 3503-9330
ri@suzano.com.br
https://ir.suzano.com.br/
Page 37 of 47
APPENDICES
APPENDIX 1 – Operating Data
| Revenue Breakdown (R$ '000) | 3Q22 | 2Q22 | Δ Q-o-Q | 3Q21 | Δ Y-o-Y | 9M22 | 9M21 | Δ Y-o-Y | ||||||||||||||||||||||||
| Exports | 11,930,133 | 9,518,474 | 25 | % | 8,937,959 | 33 | % | 29,355,987 | 24,771,375 | 19 | % | |||||||||||||||||||||
| Pulp | 11,222,662 | 8,906,683 | 26 | % | 8,443,713 | 33 | % | 27,472,118 | 23,468,522 | 17 | % | |||||||||||||||||||||
| Paper | 707,471 | 611,791 | 16 | % | 494,246 | 43 | % | 1,883,869 | 1,302,853 | 45 | % | |||||||||||||||||||||
| Domestic Market | 2,268,616 | 2,001,181 | 13 | % | 1,823,896 | 24 | % | 6,105,252 | 4,724,085 | 29 | % | |||||||||||||||||||||
| Pulp | 690,326 | 601,432 | 15 | % | 656,579 | 5 | % | 1,937,291 | 1,670,727 | 16 | % | |||||||||||||||||||||
| Paper | 1,578,290 | 1,399,749 | 13 | % | 1,167,317 | 35 | % | 4,167,961 | 3,053,358 | 37 | % | |||||||||||||||||||||
| Total Net Revenue | 14,198,749 | 11,519,655 | 23 | % | 10,761,855 | 32 | % | 35,461,239 | 29,495,460 | 20 | % | |||||||||||||||||||||
| Pulp | 11,912,988 | 9,508,115 | 25 | % | 9,100,292 | 31 | % | 29,409,409 | 25,139,249 | 17 | % | |||||||||||||||||||||
| Paper | 2,285,761 | 2,011,540 | 14 | % | 1,661,563 | 38 | % | 6,051,830 | 4,356,211 | 39 | % |
| Sales volume (‘000) | 3Q22 | 2Q22 | Δ Q-o-Q | 3Q21 | Δ Y-o-Y | 9M22 | 9M21 | Δ Y-o-Y | ||||||||||||||||||||||||
| Exports | 2,693,404 | 2,565,397 | 5 | % | 2,564,315 | 5 | % | 7,547,269 | 7,532,720 | 0 | % | |||||||||||||||||||||
| Pulp | 2,605,408 | 2,472,402 | 5 | % | 2,467,203 | 6 | % | 7,272,663 | 7,257,763 | 0 | % | |||||||||||||||||||||
| Paper | 87,996 | 92,995 | -5 | % | 97,112 | -9 | % | 274,606 | 274,957 | 0 | % | |||||||||||||||||||||
| Paperboard | 8,339 | 8,571 | -3 | % | 7,984 | 4 | % | 25,594 | 26,585 | -4 | % | |||||||||||||||||||||
| Printing & Writing | 79,246 | 83,971 | -6 | % | 87,177 | -9 | % | 247,549 | 241,117 | 3 | % | |||||||||||||||||||||
| Other paper¹ | 411 | 453 | -9 | % | 1,951 | -79 | % | 1,463 | 7,255 | -80 | % | |||||||||||||||||||||
| Domestic Market | 434,256 | 421,573 | 3 | % | 445,227 | -2 | % | 1,261,116 | 1,254,221 | 1 | % | |||||||||||||||||||||
| Pulp | 191,210 | 190,104 | 1 | % | 205,813 | -7 | % | 567,961 | 605,654 | -6 | % | |||||||||||||||||||||
| Paper | 243,046 | 231,469 | 5 | % | 239,414 | 2 | % | 693,155 | 648,567 | 7 | % | |||||||||||||||||||||
| Paperboard | 41,303 | 40,767 | 1 | % | 42,516 | -3 | % | 120,550 | 123,704 | -3 | % | |||||||||||||||||||||
| Printing & Writing | 165,825 | 155,911 | 6 | % | 164,647 | 1 | % | 468,900 | 437,783 | 7 | % | |||||||||||||||||||||
| Other paper1 | 35,918 | 34,791 | 3 | % | 32,251 | 11 | % | 103,705 | 87,080 | 19 | % | |||||||||||||||||||||
| Total Sales Volume | 3,127,660 | 2,986,970 | 5 | % | 3,009,542 | 4 | % | 8,808,385 | 8,786,941 | 0 | % | |||||||||||||||||||||
| Pulp | 2,796,618 | 2,662,506 | 5 | % | 2,673,016 | 5 | % | 7,840,624 | 7,863,417 | 0 | % | |||||||||||||||||||||
| Paper | 331,042 | 324,464 | 2 | % | 336,526 | -2 | % | 967,761 | 923,524 | 5 | % | |||||||||||||||||||||
| Paperboard | 49,642 | 49,338 | 1 | % | 50,500 | -2 | % | 146,144 | 150,289 | -3 | % | |||||||||||||||||||||
| Printing & Writing | 245,071 | 239,882 | 2 | % | 251,824 | -3 | % | 716,449 | 678,900 | 6 | % | |||||||||||||||||||||
| Other paper1 | 36,329 | 35,244 | 3 | % | 34,202 | 6 | % | 105,168 | 94,335 | 11 | % |
1Paper of other manufacturers sold by Suzano and tissue paper.
Page 38 of 47
| Average net price (R$/ton) | 3Q22 | 2Q22 | Δ Q-o-Q | 3Q21 | Δ Y-o-Y | 9M22 | 9M21 | Δ Y-o-Y | ||||||||||||||||||||||||
| Exports | 4,429 | 3,710 | 19 | % | 3,486 | 27 | % | 3,890 | 3,289 | 18 | % | |||||||||||||||||||||
| Pulp | 4,307 | 3,602 | 20 | % | 3,422 | 26 | % | 3,777 | 3,234 | 17 | % | |||||||||||||||||||||
| Paper | 8,040 | 6,579 | 22 | % | 5,089 | 58 | % | 6,860 | 4,738 | 45 | % | |||||||||||||||||||||
| Domestic Market | 5,224 | 4,747 | 10 | % | 4,097 | 28 | % | 4,841 | 3,767 | 29 | % | |||||||||||||||||||||
| Pulp | 3,610 | 3,164 | 14 | % | 3,190 | 13 | % | 3,411 | 2,759 | 24 | % | |||||||||||||||||||||
| Paper | 6,494 | 6,047 | 7 | % | 4,876 | 33 | % | 6,013 | 4,708 | 28 | % | |||||||||||||||||||||
| Total | 4,540 | 3,857 | 18 | % | 3,576 | 27 | % | 4,026 | 3,357 | 20 | % | |||||||||||||||||||||
| Pulp | 4,260 | 3,571 | 19 | % | 3,405 | 25 | % | 3,751 | 3,197 | 17 | % | |||||||||||||||||||||
| Paper | 6,905 | 6,200 | 11 | % | 4,937 | 40 | % | 6,253 | 4,717 | 33 | % |
| Average net price (US$/ton) | 3Q22 | 2Q22 | Δ Q-o-Q | 3Q21 | Δ Y-o-Y | 9M22 | 9M21 | Δ Y-o-Y | ||||||||||||||||||||||||
| Exports | 844 | 754 | 12 | % | 667 | 27 | % | 766 | 617 | 24 | % | |||||||||||||||||||||
| Pulp | 821 | 732 | 12 | % | 654 | 26 | % | 744 | 607 | 23 | % | |||||||||||||||||||||
| Paper | 1,533 | 1,337 | 15 | % | 973 | 58 | % | 1,351 | 889 | 52 | % | |||||||||||||||||||||
| Domestic Market | 996 | 965 | 3 | % | 784 | 27 | % | 953 | 707 | 35 | % | |||||||||||||||||||||
| Pulp | 688 | 643 | 7 | % | 610 | 13 | % | 672 | 517 | 30 | % | |||||||||||||||||||||
| Paper | 1,238 | 1,229 | 1 | % | 933 | 33 | % | 1,184 | 883 | 34 | % | |||||||||||||||||||||
| Total | 865 | 784 | 10 | % | 684 | 26 | % | 793 | 630 | 26 | % | |||||||||||||||||||||
| Pulp | 812 | 726 | 12 | % | 651 | 25 | % | 739 | 600 | 23 | % | |||||||||||||||||||||
| Paper | 1,316 | 1,260 | 4 | % | 944 | 39 | % | 1,231 | 885 | 39 | % |
1Paper of other manufacturers sold by Suzano and tissue paper.
| FX Rate R$/US$ | 3Q22 | 2Q22 | Δ Q-o-Q | 3Q21 | Δ Y-o-Y | 9M22 | 9M21 | Δ Y-o-Y | ||||||||||||||||||||||||
| Closing | 5.41 | 5.24 | 3 | % | 5.44 | -1 | % | 5.24 | 5.44 | -4 | % | |||||||||||||||||||||
| Average | 5.25 | 4.92 | 7 | % | 5.23 | 0 | % | 5.08 | 5.33 | -5 | % |
Page 39 of 47
APPENDIX 2 – Consolidated Statement of Income and Goodwill Amortization
| Income Statement (R$ ‘000) | 3Q22 | 2Q22 | Δ Q-o-Q | 3Q21 | Δ Y-o-Y | 9M22 | 9M21 | Δ Y-o-Y | ||||||||||||||||||||||||
| Net Revenue | 14,198,749 | 11,519,655 | 23 | % | 10,761,855 | 32 | % | 35,461,239 | 29,495,460 | 20 | % | |||||||||||||||||||||
| Cost of Goods Sold | (6,472,670 | ) | (6,122,925 | ) | 6 | % | (5,299,911 | ) | 22 | % | (18,028,435 | ) | (14,922,600 | ) | 21 | % | ||||||||||||||||
| Gross Debt | 7,726,079 | 5,396,730 | 43 | % | 5,461,944 | 41 | % | 17,432,804 | 14,572,860 | 20 | % | |||||||||||||||||||||
| Gross Margin | 54 | % | 47 | % | 7 p.p. | 51 | % | 4 p.p. | 49 | % | 49 | % | 0 p.p. | |||||||||||||||||||
| Operating Expense/Income | (778,701 | ) | (809,293 | ) | -4 | % | (849,402 | ) | -8 | % | (2,508,908 | ) | (1,146,900 | ) | 119 | % | ||||||||||||||||
| Selling Expenses | (625,114 | ) | (625,567 | ) | 0 | % | (578,101 | ) | 8 | % | (1,822,822 | ) | (1,656,801 | ) | 10 | % | ||||||||||||||||
| General and Administrative Expenses | (392,663 | ) | (364,768 | ) | 8 | % | (319,590 | ) | 23 | % | (1,093,895 | ) | (1,055,148 | ) | 4 | % | ||||||||||||||||
| Other Operating Income (Expenses) | (18,562 | ) | 161,993 | -111 | % | 18,830 | -199 | % | 140,864 | 1,445,226 | -90 | % | ||||||||||||||||||||
| Equity Equivalence | 257,638 | 19,049 | 1253 | % | 29,459 | 775 | % | 266,945 | 119,823 | 123 | % | |||||||||||||||||||||
| EBIT | 6,947,378 | 4,587,437 | 51 | % | 4,612,542 | 51 | % | 14,923,896 | 13,425,960 | 11 | % | |||||||||||||||||||||
| Depreciation, Amortization & Depletion | 1,902,668 | 1,870,609 | 2 | % | 1,745,487 | 9 | % | 5,497,631 | 5,208,723 | 6 | % | |||||||||||||||||||||
| EBITDA | 8,850,046 | 6,458,046 | 37 | % | 6,358,029 | 39 | % | 20,421,527 | 18,634,683 | 10 | % | |||||||||||||||||||||
| EBITDA Margin (%) | 62 | % | 56 | % | 6 p.p. | 59 | % | 3 p.p. | 58 | % | 63 | % | -6 p.p. | |||||||||||||||||||
| Adjusted EBITDA1 | 8,595,987 | 6,302,719 | 36 | % | 6,309,558 | 36 | % | 20,019,804 | 17,115,606 | 17 | % | |||||||||||||||||||||
| Adjusted EBITDA Margin1 | 61 | % | 55 | % | 6 p.p. | 59 | % | 2 p.p. | 56 | % | 58 | % | -2 p.p. | |||||||||||||||||||
| Net Financial Result | (1,527,776 | ) | (6,974,660 | ) | -78 | % | (7,765,377 | ) | -80 | % | 4,432,843 | (6,689,914 | ) | -166 | % | |||||||||||||||||
| Financial Expenses | 269,505 | 194,283 | 39 | % | 54,444 | 395 | % | 622,072 | 124,934 | 398 | % | |||||||||||||||||||||
| Financial Revenues | (1,216,422 | ) | (1,133,402 | ) | 7 | % | (1,212,759 | ) | 0 | % | (3,399,945 | ) | (3,135,851 | ) | 8 | % | ||||||||||||||||
| Exchange Rate Variation | (1,470,487 | ) | (4,459,984 | ) | -67 | % | (4,077,782 | ) | -64 | % | 1,700,202 | (2,388,590 | ) | -171 | % | |||||||||||||||||
| Net Proceeds Generated by Derivatives | 889,628 | (1,575,557 | ) | -156 | % | (2,529,280 | ) | -135 | % | 5,510,514 | (1,290,407 | ) | -527 | % | ||||||||||||||||||
| Earnings Before Taxes | 5,419,602 | (2,387,223 | ) | - | (3,152,835 | ) | - | 19,356,739 | 6,736,046 | 187 | % | |||||||||||||||||||||
| Income and Social Contribution Taxes | 28,496 | 2,569,012 | -99 | % | 2,193,460 | -99 | % | (3,420,742 | ) | (413,981 | ) | 726 | % | |||||||||||||||||||
| Net Income (Loss) | 5,448,098 | 181,789 | 2897 | % | (959,375 | ) | - | 15,935,997 | 6,322,065 | 152 | % | |||||||||||||||||||||
| Net Margin | 38 | % | 2 | % | 36 p.p. | -9 | % | 47 p.p. | 45 | % | 21 | % | 24 p.p. |
1Excluding non-recurring items and PPA effects.
| Goodwill amortization - PPA (R$ ‘000) | 3Q22 | 2Q22 | Δ Q-o-Q | 3Q21 | Δ Y-o-Y | |||||||||||||||
| COGS | (140,861 | ) | (138,908 | ) | 15 | % | (149,176 | ) | -6 | % | ||||||||||
| Selling Expenses | (207,740 | ) | (207,157 | ) | 0 | % | (207,763 | ) | 0 | % | ||||||||||
| General and administrative expenses | (2,625 | ) | (2,625 | ) | 141 | % | (1,844 | ) | 42 | % | ||||||||||
| Other operational revenues (expenses) | (16,837 | ) | (1,053 | ) | - | (18,886 | ) | -11 | % | |||||||||||
| Financial results | (4,722 | ) | (4,419 | ) | 0 | % | 14,397 | -133 | % |
Page 40 of 47

APPENDIX 3 – Consolidated Balance Sheet
| Assets (R$ ’000) | 09/30/2022 | 06/30/2022 | 09/30/2021 | |||||||||
| Current Assets | ||||||||||||
| Cash and cash equivalents | 6,958,161 | 7,712,081 | 13,461,967 | |||||||||
| Financial investments | 10,907,907 | 12,337,762 | 5,228,075 | |||||||||
| Trade accounts receivable | 8,664,852 | 5,865,962 | 4,577,069 | |||||||||
| Inventories | 5,942,174 | 5,548,095 | 4,652,459 | |||||||||
| Recoverable taxes | 502,163 | 422,129 | 427,987 | |||||||||
| Derivative financial instruments | 2,308,110 | 1,710,964 | 515,204 | |||||||||
| Advance to suppliers | 58,771 | 64,115 | 39,327 | |||||||||
| Other assets | 876,603 | 914,823 | 783,943 | |||||||||
| Total Current Assets | 36,218,741 | 34,575,931 | 29,686,031 | |||||||||
| Non-Current Assets | ||||||||||||
| Financial investments | 405,956 | 257,292 | 240,329 | |||||||||
| Recoverable taxes | 1,401,316 | 1,336,891 | 1,219,207 | |||||||||
| Deferred taxes | 5,637,742 | 5,404,862 | 8,505,573 | |||||||||
| Derivative financial instruments | 1,680,712 | 1,562,932 | 753,791 | |||||||||
| Advance to suppliers | 1,487,207 | 1,441,853 | 1,220,625 | |||||||||
| Judicial deposits | 364,093 | 335,736 | 322,879 | |||||||||
| Other assets | 279,075 | 273,608 | 237,742 | |||||||||
| Biological assets | 13,066,433 | 12,664,046 | 11,807,705 | |||||||||
| Investments | 558,111 | 551,290 | 518,977 | |||||||||
| Property, plant and equipment | 47,012,355 | 43,617,187 | 38,027,466 | |||||||||
| Right of use on lease agreements | 5,105,422 | 4,996,460 | 4,593,241 | |||||||||
| Intangible | 15,397,201 | 15,624,401 | 16,249,726 | |||||||||
| Total Non-Current Assets | 92,395,623 | 88,066,558 | 83,697,261 | |||||||||
| Total Assets | 128,614,364 | 122,642,489 | 113,383,292 | |||||||||
Page 41 of 47

| Passivo e Patrimônio Líquido (R$ mil) | 09/30/2022 | 06/30/2022 | 09/30/2021 | |||||||||
| Current Liabilities | ||||||||||||
| Trade accounts payable | 5,272,119 | 4,036,414 | 2,966,600 | |||||||||
| Loans, financing and debentures | 2,850,556 | 3,471,739 | 2,286,040 | |||||||||
| Accounts payable for lease operations | 654,133 | 625,680 | 623,136 | |||||||||
| Derivative financial instruments | 750,396 | 686,498 | 1,619,081 | |||||||||
| Taxes payable | 420,897 | 354,890 | 346,285 | |||||||||
| Payroll and charges | 647,541 | 523,732 | 549,949 | |||||||||
| Liabilities for assets acquisitions and subsidiaries | 1,919,150 | 1,870,699 | 91,828 | |||||||||
| Dividends payable | 1,923 | 4,055 | 11,173 | |||||||||
| Advance from customers | 112,915 | 88,785 | 92,567 | |||||||||
| Other liabilities | 273,990 | 398,090 | 359,754 | |||||||||
| Total Current Liabilities | 12,903,620 | 12,060,582 | 8,946,413 | |||||||||
| Non-Current Liabilities | ||||||||||||
| Loans, financing and debentures | 73,209,230 | 71,734,198 | 74,861,856 | |||||||||
| Accounts payable for lease operations | 5,595,755 | 5,370,465 | 5,030,297 | |||||||||
| Derivative financial instruments | 4,206,646 | 4,605,212 | 6,061,046 | |||||||||
| Liabilities for assets acquisitions and subsidiaries | 210,510 | 299,568 | 301,893 | |||||||||
| Provision for judicial liabilities | 3,317,720 | 3,284,999 | 3,273,411 | |||||||||
| Actuarial liabilities | 676,699 | 675,513 | 795,090 | |||||||||
| Deferred taxes | 1,118 | 1,118 | ||||||||||
| Share-based compensation plans | 149,700 | 144,267 | 206,961 | |||||||||
| Advance from customers | 136,161 | 149,540 | 165,439 | |||||||||
| Other liabilities | 149,004 | 150,339 | 122,040 | |||||||||
| Total Non-Current Liabilities | 87,652,543 | 86,415,219 | 90,818,033 | |||||||||
| Shareholders’ Equity | ||||||||||||
| Share capital | 9,235,546 | 9,235,546 | 9,235,546 | |||||||||
| Capital reserves | 17,091 | 15,758 | 14,244 | |||||||||
| Treasury shares | (2,120,324 | ) | (817,451 | ) | (218,265 | ) | ||||||
| Retained earnings reserves | 3,040,935 | 3,040,935 | ||||||||||
| Other reserves | 1,766,711 | 2,048,838 | 1,988,711 | |||||||||
| Retained earnings | 16,011,694 | 10,538,381 | 2,498,255 | |||||||||
| Controlling shareholders’ | 27,951,653 | 24,062,007 | 13,518,491 | |||||||||
| Non-controlling interest | 106,548 | 104,681 | 100,355 | |||||||||
| Total Equity | 28,058,201 | 24,166,688 | 13,618,846 | |||||||||
| Total Liabilities and Equity | 128,614,364 | 122,642,489 | 113,383,292 | |||||||||
Page 42 of 47

APPENDIX 4 – Consolidated Statement of Cash Flow
| Cash Flow (R$ ’000) | 3Q22 | 3Q21 | 9M22 | 9M21 | ||||||||||||
| Cash flow from operating activities | ||||||||||||||||
| Net income/(loss) for the period | 5,448,098 | (959,375 | ) | 15,935,997 | 6,322,065 | |||||||||||
| Depreciation, depletion and amortization | 1,846,329 | 1,691,415 | 5,352,198 | 5,081,318 | ||||||||||||
| Depreciation of right of use | 61,050 | 51,138 | 170,910 | 151,314 | ||||||||||||
| Sublease of ships | - | (11,463 | ) | (11,314 | ) | (32,198 | ) | |||||||||
| Interest expense on lease liabilities | 110,769 | 105,310 | 321,366 | 317,850 | ||||||||||||
| Result from sale and disposal of property, plant and equipment and biological assets, net | (18,586 | ) | 28,789 | (26,627 | ) | (492,384 | ) | |||||||||
| Income (expense) from associates and joint ventures | (257,638 | ) | (29,459 | ) | (266,945 | ) | (119,823 | ) | ||||||||
| Exchange rate and monetary variations, net | 1,470,487 | 4,077,782 | (1,700,202 | ) | 2,388,590 | |||||||||||
| Interest expenses with financing, loans and debentures, net | 1,050,589 | 798,942 | 2,902,537 | 2,292,512 | ||||||||||||
| Premium expenses with early settlements | - | 226,570 | - | 260,289 | ||||||||||||
| Capitalized loan costs | (97,472 | ) | (4,011 | ) | (206,444 | ) | (5,060 | ) | ||||||||
| Accrual of interest on marketable securities | (208,798 | ) | (36,801 | ) | (487,890 | ) | (75,408 | ) | ||||||||
| Amortization of transaction costs | 16,569 | 33,768 | 53,407 | 90,270 | ||||||||||||
| Result from derivative, net | (889,628 | ) | 2,529,280 | (5,510,514 | ) | 1,290,407 | ||||||||||
| Fair value adjustment of biological assets | - | - | (171,618 | ) | (564,533 | ) | ||||||||||
| Deferred income tax and social contribution | (232,533 | ) | (2,281,320 | ) | 3,094,068 | 170,458 | ||||||||||
| Interest on actuarial liabilities | 14,827 | 13,961 | 44,443 | 41,886 | ||||||||||||
| Provision for judicial liabilities, net | 38,716 | 24,108 | 101,717 | 57,633 | ||||||||||||
| Provision for allowance for doubtful accounts, net | 543 | 1,529 | 2,631 | 5,685 | ||||||||||||
| Provision (reversal) for inventory losses, net | 23,664 | 21,888 | 14,145 | 32,555 | ||||||||||||
| Provision for loss of ICMS credits, net | 27,331 | 8,027 | 62,007 | 31,422 | ||||||||||||
| Tax credits | - | (53,534 | ) | 1,324 | (368,965 | ) | ||||||||||
| Other | 1,691 | 8,920 | 7,868 | 19,922 | ||||||||||||
| Decrease (increase) in assets | (2,934,821 | ) | (537,712 | ) | (3,204,823 | ) | (2,081,601 | ) | ||||||||
| Trade accounts receivables | (2,538,887 | ) | (298,356 | ) | (2,074,641 | ) | (1,520,746 | ) | ||||||||
| Inventories | (348,540 | ) | (203,885 | ) | (1,092,801 | ) | (656,737 | ) | ||||||||
| Recoverable taxes | (173,900 | ) | (50,185 | ) | (342,011 | ) | (38,000 | ) | ||||||||
| Other assets | 126,506 | 14,714 | 304,630 | 133,882 | ||||||||||||
| Increase (decrease) in liabilities | 1,619,885 | 636,025 | 2,460,772 | 1,089,022 | ||||||||||||
| Trade accounts payables | 1,352,846 | 465,575 | 2,350,136 | 917,283 | ||||||||||||
| Taxes payable | 195,553 | 123,178 | 286,491 | 256,084 | ||||||||||||
| Payroll and charges | 123,808 | 105,011 | 56,758 | 57,212 | ||||||||||||
| Other liabilities | (52,322 | ) | (57,739 | ) | (232,613 | ) | (141,557 | ) | ||||||||
| Cash provided by operations, net | 7,091,072 | 6,343,777 | 18,939,013 | 15,903,226 | ||||||||||||
| Payment of interest with financing, loans and debentures | (1,499,635 | ) | (1,153,851 | ) | (3,419,037 | ) | (2,633,676 | ) | ||||||||
| Premium on early settlements | - | (226,570 | ) | - | (260,289 | ) | ||||||||||
| Interest received from marketable securities | 118,611 | 15,272 | 348,536 | 53,339 | ||||||||||||
| Payment of income taxes | (121,671 | ) | (11,427 | ) | (216,064 | ) | (82,156 | ) | ||||||||
| Cash provided by operating activities | 5,588,377 | 4,967,201 | 15,652,448 | 12,980,444 | ||||||||||||
| Investing activities | ||||||||||||||||
| Additions to property, plant and equipment | (3,749,354 | ) | (513,630 | ) | (7,147,236 | ) | (1,184,218 | ) | ||||||||
| Additions to intangible assets | (11,551 | ) | (197,402 | ) | (80,651 | ) | (215,545 | ) | ||||||||
| Additions to biological assets | (1,386,878 | ) | (1,013,284 | ) | (3,522,875 | ) | (2,624,958 | ) | ||||||||
| Proceeds from sale of property, plant and equipment | 67,729 | 44,783 | 166,057 | 1,305,791 | ||||||||||||
| Increase of capital in subsidiaries and associates | (5,281 | ) | (998 | ) | (32,144 | ) | (51,816 | ) | ||||||||
| Marketable securities, net | 1,595,328 | (2,726,348 | ) | (3,096,515 | ) | (3,014,563 | ) | |||||||||
| Advance for acquisition of wood from operations with development | (57,146 | ) | 38,823 | (231,636 | ) | (193,334 | ) | |||||||||
| Dividends received | - | - | 6,604 | 6,453 | ||||||||||||
| Acquisition of subsidiaries | (390,193 | ) | - | (2,090,062 | ) | |||||||||||
| Cash and cash equivalents from asset acquisition | 10,590 | - | 10,590 | - | ||||||||||||
| Acquisition of minority interests | - | (34 | ) | - | (6,516 | ) | ||||||||||
| Cash used in investing activities, net | (3,926,756 | ) | (4,368,090 | ) | (16,017,868 | ) | (5,978,706 | ) | ||||||||
| Financing activities | ||||||||||||||||
| Proceeds from loans, financing and debentures | 76,391 | 7,482,066 | 341,481 | 16,788,680 | ||||||||||||
| Receipt (payment) of derivative transactions | (159,966 | ) | (220,968 | ) | 26,346 | (1,655,256 | ) | |||||||||
| Payment of loans, financing and debentures | (820,360 | ) | (3,675,376 | ) | (1,673,985 | ) | (15,407,928 | ) | ||||||||
| Payment of leases | (244,247 | ) | (222,219 | ) | (743,619 | ) | (697,702 | ) | ||||||||
| Payment of dividends | (17 | ) | - | (1,801,579 | ) | (2,322 | ) | |||||||||
| Liabilities for assets acquisitions and associates | (107,411 | ) | (149,215 | ) | (107,520 | ) | (150,735 | ) | ||||||||
| Share repurchase | (1,402,359 | ) | - | (1,904,424 | ) | - | ||||||||||
| Cash provided (used) by financing activities, net | (2,657,969 | ) | 3,214,288 | (5,863,300 | ) | (1,125,263 | ) | |||||||||
| Exchange variation on cash and cash equivalents | 242,428 | 1,062,998 | (403,895 | ) | 750,435 | |||||||||||
| Increase (reduction) in cash and cash equivalents, net | (753,920 | ) | 4,876,397 | (6,632,615 | ) | 6,626,910 | ||||||||||
| Cash and cash equivalents at the beginning for the period | 7,712,081 | 8,585,570 | 13,590,776 | 6,835,057 | ||||||||||||
| Cash and cash equivalents at the end for the period | 6,958,161 | 13,461,967 | 6,958,161 | 13,461,967 | ||||||||||||
| Increase (reduction) in cash and cash equivalents, net | (753,920 | ) | 4,876,397 | (6,632,615 | ) | 6,626,910 |
Page 43 of 47

APPENDIX 5 – EBITDA
| (R$ '000, except where otherwise indicated) | 3Q22 | 3Q21 | 9M22 | 9M21 | ||||||||||||
| Net income | 5,448,098 | (959,375 | ) | 15,935,997 | 6,322,065 | |||||||||||
| Net Financial Result | 1,527,776 | 7,765,377 | (4,432,843 | ) | 6,689,914 | |||||||||||
| Income and Social Contribution Taxes | (28,496 | ) | (2,193,460 | ) | 3,420,742 | 413,981 | ||||||||||
| EBIT | 6,947,378 | 4,612,542 | 14,923,896 | 13,425,960 | ||||||||||||
| Depreciation, Amortization and Depletion | 1,902,668 | 1,745,487 | 5,497,631 | 5,208,723 | ||||||||||||
| EBITDA¹ | 8,850,046 | 6,358,029 | 20,421,527 | 18,634,683 | ||||||||||||
| Margem EBITDA | 62 | % | 59 | % | 58 | % | 63 | % | ||||||||
| COVID-19 - Expenses related to social actions to combat the virus | - | 214 | 178 | 23,910 | ||||||||||||
| Fair Value Update - Biological Asset | - | - | (171,618 | ) | (564,533 | ) | ||||||||||
| Ibema's goodwill write-off | - | - | - | 125 | ||||||||||||
| Tax credits - exclusion of ICMS in the PIS and COFINS calculation basis | - | (53,534 | ) | 1,324 | (368,965 | ) | ||||||||||
| Equity | (257,638 | ) | (29,459 | ) | (266,945 | ) | (119,823 | ) | ||||||||
| Accruals for losses on ICMS credits | 27,327 | 8,789 | 74,977 | 31,923 | ||||||||||||
| Provision - Regularization of development contract | - | 2,586 | - | 2,700 | ||||||||||||
| Provision - Provision for loss of biological assets | - | 30,712 | - | 30,712 | ||||||||||||
| Adjustments - Losango Project | - | - | - | (9,138 | ) | |||||||||||
| Sales of fixed assets and biological assets | (23,748 | ) | (7,779 | ) | (39,639 | ) | (545,988 | ) | ||||||||
| Adjusted EBITDA | 8,595,987 | 6,309,558 | 20,019,804 | 17,115,606 | ||||||||||||
| Adjusted EBITDA Margin | 61 | % | 59 | % | 56 | % | 58 | % |
¹The Company's EBITDA is calculated in accordance with CVM Instruction 527 of October 4, 2012.
Page 44 of 47

APPENDIX 6 – Segmented Income Statement
| 3Q22 | 3Q21 | |||||||||||||||||||||||||||||||
| Segmented Financial Statement (R$ '000) | Pulp | Paper | Non Segmented | Total Consolidated | Pulp | Paper | Non Segmented | Total Consolidated | ||||||||||||||||||||||||
| Net Revenue | 11,912,988 | 2,285,761 | - | 14,198,749 | 9,100,292 | 1,661,563 | - | 10,761,855 | ||||||||||||||||||||||||
| Cost of Goods Sold | (5,218,062 | ) | (1,254,608 | ) | - | (6,472,670 | ) | (4,294,260 | ) | (1,005,651 | ) | - | (5,299,911 | ) | ||||||||||||||||||
| Gross Profit | 6,694,926 | 1,031,153 | - | 7,726,079 | 4,806,032 | 655,912 | - | 5,461,944 | ||||||||||||||||||||||||
| Gross Margin | 56 | % | 45 | % | - | 54 | % | 53 | % | 39 | % | - | 51 | % | ||||||||||||||||||
| Operating Expense/Income | (562,469 | ) | (216,232 | ) | - | (778,701 | ) | (672,144 | ) | (177,258 | ) | - | (849,402 | ) | ||||||||||||||||||
| Selling Expenses | (470,973 | ) | (154,141 | ) | - | (625,114 | ) | (446,938 | ) | (131,163 | ) | - | (578,101 | ) | ||||||||||||||||||
| General and Administrative Expenses | (280,608 | ) | (112,055 | ) | - | (392,663 | ) | (228,239 | ) | (91,351 | ) | - | (319,590 | ) | ||||||||||||||||||
| Other Operating Income (Expenses) | (27,404 | ) | 8,842 | - | (18,562 | ) | (372 | ) | 19,202 | - | 18,830 | |||||||||||||||||||||
| Equity Equivalence | 216,516 | 41,122 | - | 257,638 | 3,405 | 26,054 | - | 29,459 | ||||||||||||||||||||||||
| EBIT | 6,132,457 | 814,921 | - | 6,947,378 | 4,133,888 | 478,654 | - | 4,612,542 | ||||||||||||||||||||||||
| Depreciation, Amortization & Depletion | 1,735,663 | 167,005 | - | 1,902,668 | 1,592,378 | 153,109 | - | 1,745,487 | ||||||||||||||||||||||||
| EBITDA | 7,868,120 | 981,926 | - | 8,850,046 | 5,726,266 | 631,763 | - | 6,358,029 | ||||||||||||||||||||||||
| EBITDA Margin | 66 | % | 43 | % | 62 | % | 63 | % | 38 | % | 59 | % | ||||||||||||||||||||
| Adjusted EBITDA¹ | 7,665,035 | 930,952 | - | 8,595,987 | 5,721,444 | 588,114 | - | 6,309,558 | ||||||||||||||||||||||||
| Adjusted EBITDA Margin¹ | 64 | % | 41 | % | - | 61 | % | 63 | % | 35 | % | - | 59 | % | ||||||||||||||||||
| Net Financial Result | - | - | (1,527,776 | ) | (1,527,776 | ) | - | - | (7,765,377 | ) | (7,765,377 | ) | ||||||||||||||||||||
| Earnings Before Taxes | 6,132,455 | 814,923 | (1,527,776 | ) | 5,419,602 | 4,133,892 | 478,650 | (7,765,377 | ) | (3,152,835 | ) | |||||||||||||||||||||
| Income and Social Contribution Taxes | - | - | 28,496 | 28,496 | - | - | 2,193,460 | 2,193,460 | ||||||||||||||||||||||||
| Net Income (Loss) | 6,132,455 | 814,923 | (1,499,280 | ) | 5,448,098 | 4,133,892 | 478,650 | (5,571,917 | ) | (959,375 | ) | |||||||||||||||||||||
| Net Margin | 51 | % | 36 | % | - | 38 | % | 45 | % | 29 | % | - | -9 | % | ||||||||||||||||||
1Excluding non-recurring items and PPA effects.
Page 45 of 47

APPENDIX 6 – Segmented Income Statement
| 9M22 | 9M21 | |||||||||||||||||||||||||||||||
| Segmented Financial Statement (R$ '000) | Pulp | Paper | Non Segmented | Total Consolidated | Pulp | Paper | Non Segmented | Total Consolidated | ||||||||||||||||||||||||
| Net Revenue | 29,409,409 | 6,051,830 | - | 35,461,239 | 25,139,249 | 4,356,211 | - | 29,495,460 | ||||||||||||||||||||||||
| Cost of Goods Sold | (14,460,942 | ) | (3,567,493 | ) | - | (18,028,435 | ) | (12,200,038 | ) | (2,722,562 | ) | - | (14,922,600 | ) | ||||||||||||||||||
| Gross Profit | 14,948,467 | 2,484,337 | - | 17,432,804 | 12,939,211 | 1,633,649 | - | 14,572,860 | ||||||||||||||||||||||||
| Gross Margin | 51 | % | 41 | % | - | 49 | % | 51 | % | 38 | % | - | 49 | % | ||||||||||||||||||
| Operating Expense/Income | (1,904,736 | ) | (604,172 | ) | - | (2,508,908 | ) | (912,984 | ) | (233,916 | ) | - | (1,146,900 | ) | ||||||||||||||||||
| Selling Expenses | (1,375,048 | ) | (447,774 | ) | - | (1,822,822 | ) | (1,302,720 | ) | (354,081 | ) | - | (1,656,801 | ) | ||||||||||||||||||
| General and Administrative Expenses | (779,590 | ) | (314,305 | ) | - | (1,093,895 | ) | (760,691 | ) | (294,457 | ) | - | (1,055,148 | ) | ||||||||||||||||||
| Other Operating Income (Expenses) | 32,844 | 108,020 | - | 140,864 | 1,070,754 | 374,472 | - | 1,445,226 | ||||||||||||||||||||||||
| Equity Equivalence | 217,058 | 49,887 | - | 266,945 | 79,673 | 40,150 | - | 119,823 | ||||||||||||||||||||||||
| EBIT | 13,043,731 | 1,880,165 | - | 14,923,896 | 12,026,227 | 1,399,733 | - | 13,425,960 | ||||||||||||||||||||||||
| Depreciation, Amortization & Depletion | 4,992,972 | 504,659 | - | 5,497,631 | 4,772,011 | 436,712 | - | 5,208,723 | ||||||||||||||||||||||||
| EBITDA | 18,036,703 | 2,384,824 | - | 20,421,527 | 16,798,238 | 1,836,445 | - | 18,634,683 | ||||||||||||||||||||||||
| EBITDA Margin | 61 | % | 39 | % | 58 | % | 67 | % | 42 | % | 63 | % | ||||||||||||||||||||
| Adjusted EBITDA¹ | 17,849,083 | 2,170,721 | - | 20,019,804 | 15,683,584 | 1,432,022 | - | 17,115,606 | ||||||||||||||||||||||||
| Adjusted EBITDA Margin¹ | 61 | % | 36 | % | - | 56 | % | 62 | % | 33 | % | - | 58 | % | ||||||||||||||||||
| Net Financial Result | - | - | 4,432,843 | 4,432,843 | - | - | (6,689,914 | ) | (6,689,914 | ) | ||||||||||||||||||||||
| Earnings Before Taxes | 13,043,731 | 1,880,165 | 4,432,843 | 19,356,739 | 12,026,227 | 1,399,733 | (6,689,914 | ) | 6,736,046 | |||||||||||||||||||||||
| Income and Social Contribution Taxes | - | - | (3,420,742 | ) | (3,420,742 | ) | - | - | (413,981 | ) | (413,981 | ) | ||||||||||||||||||||
| Net Income (Loss) | 13,043,731 | 1,880,165 | 1,012,101 | 15,935,997 | 12,026,227 | 1,399,733 | (7,103,895 | ) | 6,322,065 | |||||||||||||||||||||||
| Net Margin | 44 | % | 31 | % | - | 45 | % | 48 | % | 32 | % | - | 21 | % | ||||||||||||||||||
1Excluding non-recurring items and PPA effects.
Page 46 of 47

Forward-Looking Statements
This release may contain forward-looking statements. Such statements are subject to known and unknown risks and uncertainties due to which such expectations may not happen at all or may substantially differ from what was expected. These risks include, among others, changes in future demand for the Company’s products, changes in factors affecting domestic and international product prices, changes in the cost structure, changes in the seasonal patterns of markets, changes in prices charged by competitors, foreign exchange variations, changes in the political or economic situation of Brazil, as well as emerging and international markets. The forward-looking statements were not reviewed by our independent auditors.
Page 47 of 47