Exhibit 99.1

Highest ever annual EBITDA in 2022
Net Debt/EBITDA at 2.0 times
São Paulo, February 28, 2023. Suzano S.A. (B3: SUZB3 | NYSE: SUZ), one of the world’s largest integrated pulp and paper producers, announces today its consolidated results for the 4th quarter of 2022 (4Q22).
HIGHLIGHTS
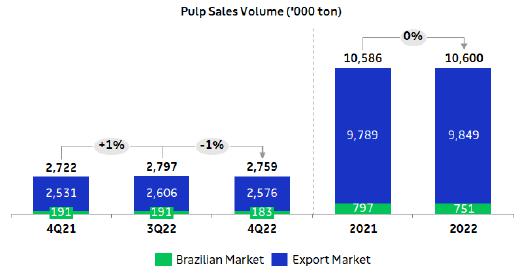
| • | Pulp sales of 2,759 thousand tons (+1% vs. 4Q21). | |
| • | Paper sales3 of 338 thousand tons (-9% vs. 4Q21). | |
| • | Adjusted EBITDA1 and Operating cash generation2: R$8.2 billion and R$6.5 billion, respectively. | |
| • | Adjusted EBITDA1/ton from pulp of R$2,636 (+25% vs. 4Q21). | |
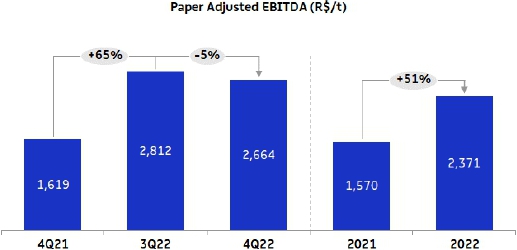
| • | Adjusted EBITDA1/ton3 from paper of R$2,664 (+65% vs. 4Q21). | |
| • | Average net pulp price in export market: US$831/ton (+32% vs. 4Q21). | |
| • | Average net paper price3 of R$7,079/ton (+39% vs. 4Q21). | |
| • | Pulp cash cost ex-downtime of R$937/ton (+25% vs. 4Q21). | |
| • | Leverage ratio declines to 2.0 times in USD and 2.0 times in BRL, despite the investment cycle. | |
| • | Cerrado Project completes 45% of physical progress and 41% of financial progress. |
| Financial Data (R$ million) | 4Q22 | 3Q22 | Δ Q-o-Q | 4Q21 | Δ Y-o-Y | 2022 | 2021 | Δ Y-o-Y | |||||||||
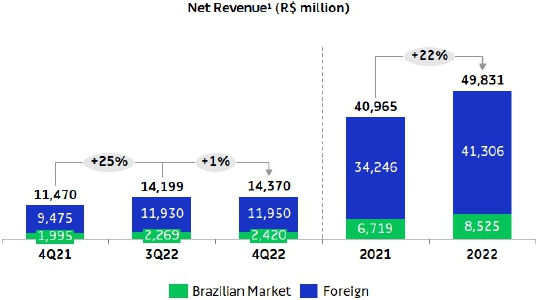
| Net Revenue | 14,370 | 14,199 | 1 | % | 11,470 | 25 | % | 49,831 | 40,965 | 22 | % | ||||||
| Adjusted EBITDA1 | 8,175 | 8,596 | -5 | % | 6,355 | 29 | % | 28,195 | 23,471 | 20 | % | ||||||
| Adjusted EBITDA Margin1 | 57 | % | 61 | % | -4 | p.p. | 55 | % | 2 | p.p. | 57 | % | 57 | % | 0 | p.p. | |
| Net Financial Result | 2,000 | (1,528 | ) | - | (2,657 | ) | - | 6,433 | (9,347 | ) | - | ||||||
| Net Income | 7,459 | 5,448 | 37 | % | 2,313 | 222 | % | 23,395 | 8,636 | 171 | % | ||||||
| Operating Cash Generation2 | 6,463 | 7,155 | -10 | % | 4,809 | 34 | % | 22,563 | 18,819 | 20 | % | ||||||
| Net Debt /Adjusted EBITDA1 (x) - R$ | 2.0 | x | 2.2 | x | -0.2 | x | 2.5 | x | -0.5 | x | 2.0 | x | 2.5 | x | -0.5 | x | |
| Net Debt /Adjusted EBITDA1 (x) - US$ | 2.0x | 2.1 | x | -0.2 | x | 2.4 | x | -0.4 | x | 2.0 | x | 2.4 | x | -0.4 | x |
| Operational Data ('000 tons) | 4Q22 | 3Q22 | Δ Q-o-Q | 4Q21 | Δ Y-o-Y | 2022 | 2021 | Δ Y-o-Y | |||||||||
| Sales | 3,097 | 3,128 | -1 | % | 3,093 | 0 | % | 11,906 | 11,880 | 0 | % | ||||||
| Pulp | 2,759 | 2,797 | -1 | % | 2,722 | 1 | % | 10,600 | 10,586 | 0 | % | ||||||
| Paper3 | 338 | 331 | 2 | % | 371 | -9 | % | 1,306 | 1,294 | 1 | % |
1Excludes non-recurring items. | 2Considers Adjusted EBITDA less sustaining capex (cash basis). | 3Considers the results of the Consumer Goods Unit (tissue).


The consolidated quarterly information has been prepared in accordance with the Securities and Exchange Commission (CVM) and Accounting Standards Committee (CPC) standards and is in compliance with International Accounting Standard (IFRS) issued by the International Accounting Standard Board (IASB). The data contained in this document was obtained from the financial information as made available to the CVM. The operating and financial information is presented based on consolidated numbers in Reais (R$). Summaries may diverge due to rounding.
CONTENTS
| EXECUTIVE SUMMARY | 3 |
| PULP BUSINESS PERFORMANCE | 4 |
| PULP SALES VOLUME AND REVENUE | 4 |
| PULP CASH COST | 5 |
| PULP SEGMENT EBITDA | 8 |
| OPERATING CASH GENERATION FROM THE PULP SEGMENT | 10 |
| PAPER BUSINESS PERFORMANCE | 10 |
| PAPER SALES VOLUME AND REVENUE | 10 |
| PAPER SEGMENT EBITDA | 12 |
| OPERATING CASH GENERATION FROM THE PAPER SEGMENT | 13 |
| FINANCIAL PERFORMANCE | 14 |
| NET REVENUE | 14 |
| CALENDAR OF SCHEDULED MAINTENANCE DOWNTIMES | 15 |
| COST OF GOODS SOLD | 15 |
| SELLING EXPENSES | 16 |
| GENERAL AND ADMINISTRATIVE EXPENSES | 16 |
| ADJUSTED EBITDA | 17 |
| FINANCIAL RESULT | 17 |
| DERIVATIVE OPERATIONS | 18 |
| NET INCOME (LOSS) 0} | 22 |
| DEBT | 22 |
| CAPEX | 25 |
| CERRADO PROJECT | 25 |
| OPERATING CASH GENERATION | 25 |
| FREE CASH FLOW | 26 |
| EVOLUTION OF NET DEBT | 27 |
| ESG | 27 |
| TOTAL OPERATIONAL EXPENDITURE – PULP | 28 |
| Capital Markets | 28 |
| Fixed Income | 30 |
| Ratings | 30 |
| UPCOMING EVENTS | 30 |
| Appendices | 32 |
| APPENDIX 1 - Operating Data | 32 |
| APPENDIX 2 - Consolidated Statement of Income and Goodwill Amortization | 34 |
| APPENDIX 3 - Consolidated Balance Sheet | 35 |
| APPENDIX 4 - Consolidated Statement of Cash Flow | 36 |
| APPENDIX 5 - EBITDA | 37 |
| APPENDIX 6 - Segmented Income Statement | 38 |
| APPENDIX 6 - Segmented Income Statement | 39 |
| Forward-Looking Statements | 40 |
Page 2 of 40
EXECUTIVE SUMMARY
The year 2022 was marked by a new record set by the Company, accompanied by a series of achievements in its strategy. The upward trend of pulp prices throughout the year, contrary to market expectations, combined with strong sales volume resulted in record adjusted EBITDA in 2022, despite continued cost pressures during the period, mainly as a result of the global commodity prices increase. In the paper segment, EBITDA surpassed R$3 billion for the first time in a one-year period, up 52% from the previous year, due to the implementation of announced prices in all segments. As a result, adjusted EBITDA for the year reached the highest level in its history in one year (R$ 28.2 billion), an increase of 20% compared to 2021.
Regarding financial management, leverage in USD, measured by net debt/adjusted EBITDA in the last 12 months, fell once again to 2.0 times, despite the investments made and is in line with the Company’s capital allocation strategy, which included higher shareholder remuneration via dividends and share buybacks. The result of cash flow hedge operations once again attested to the long-term consistency of the financial policy in managing foreign exchange risk, with positive mark-to-market and cash adjustments in cash flow (ZCC) and swap operations.
At the end of 2022, Suzano contracted a new credit line (Export Credit Supported Facility) to finance the acquisition of equipment and services for the Cerrado project. This credit facility of up to US$800 million or its equivalent in euros will be financed by Finnish Export Credit (FEC) and guaranteed by Finnvera, the Finnish export credit agency. The transaction has a condition precedent for the release of funds, which is an environmental and social action plan subsequently agreed with IFC (International Finance Corporation) for compliance with the IFC Performance Standards. The Company also contracted a new Sustainability-Linked Loan (SLL) through a new credit facility to finance the Cerrado Project. The US$600 million loan, granted by IFC and a syndicate of commercial banks, has Sustainability Performance Targets (SPTs) associated with: (a) reducing the intensity of greenhouse gas (GHG) emissions; and (b) increasing the percentage of women in leadership positions in the Company. Still on the ESG front, Suzano continued to evolve in the main ESG indices and ratings, with highlights for the upgrade in the MSCI rating to “BB”, selection for the CDP “A-list” in the Water theme and selection to compose the index DJSI Emerging Markets.
Company’s financial discipline enabled us to allocate capital efficiently on strategic avenues. Grounded on strategic avenues of “being the best in class in total pulp costs” and “being an important player in pulp through solid projects,” it was announced the acquisitions of Parkia and Caravelas for R$2.0 billion, the modernization of Jacareí and Aracruz mills were executed and the biggest planting project in Suzano’s history was launched. The Company invested R$7.4 billion in the Cerrado project, whose physical and financial progress is going according to plan. Suzano also announced the acquisition of Kimberly-Clark’s tissue unit in Brazil for US$175 million, in line with the strategic avenue “advancing in the links across the chain,” which has not yet been concluded and is awaiting approval from Brazil’s antitrust agency CADE. As for the avenue “boldly expand into new markets,” the WoodSpin mill in Finland, a joint venture with Spinnova, and the MFC plant at the Limeira mill, went operational according to schedule. One more announcement marked the year: the creation of Suzano Ventures, the Company’s corporate venture capital fund with US$70 million available for investments in startups.
Finally, in the context of the avenues “Maintain relevance in Pulp, through good projects” and “Be ‘Best-in-Class’ in the Total Pulp Cost vision”, the physical schedule of Cerrado Project keeps going as expected and reached 45% and 41% of financial progress, maintaining the expectations regarding operational startup already disclosed to the market.
Page 3 of 40
PULP BUSINESS PERFORMANCE
PULP SALES VOLUME AND REVENUE
The demand for chemical pulp during the last quarter has been marked by different dynamics in the different regions.
In America and Europe, the demand for sanitary paper has remained solid, while a slowing has been noticed in Printing and Writing demand and also specialties paper, given the stocking levels of these products in distributors, converters and printers, and a beginning of destocking.
In China, even with a bigger opening after the review of covid related measures a more pessimist sentiment has affected demand, mainly due to an increase in the infection rates as well as the tight margin for paper producers. This has caused a reduction in pulp orders for the paper and board producers in this market, even with solid rates of local production, strongly supported by the high export rates in printing and writing and packaging products.
On the supply side, unplanned downtimes have been noticed due to climate factors such as water scarcity as well as geopolitical impacts of the Russia Ukraine conflict, given the sanctions to the russian wood impacting european pulp production, besides the continuity of delays for new capacities projects.
In this context, PIX/FOEX index for hardwood pulp has maintened historical high levels, keeping stable in european and chinese markets when compared to 3Q22. The spread between short and long fibers in the quarter was US$ 83/t in Europe and US$ 60/t in China, showing a 26% and 46% reduction, respectively, when comparing to 3rd quarter average.
Suzano’s pulp sales volume remained strong during the quarter and came to 2,759 thousand tonnes, down 1% from 3Q22 and up 1% in relation to 4Q21. The average net price in USD of the pulp sold by Suzano was US$ 826/t, increasing 2% and 31% compared to 3Q22 and 4Q21, respectively. In the export market, Suzano’s average net price was US$831/t, increasing 1% and 32% on the same comparison basis. In whole of the year, sales volume was stable in relation to 2021 and the average net pulp price in USD increased by 24%.
Average net price in BRL was R$4,340/ton in 4Q22, up 2% and 23%, respectively, from 3Q22 and 4Q21, mainly due to higher average net price in USD in the period.
Page 4 of 40

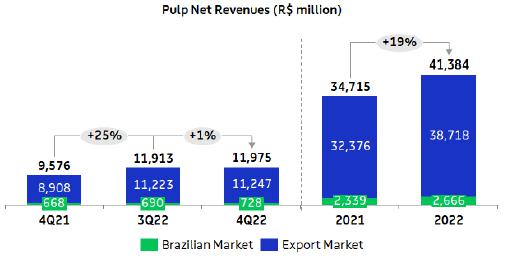
Net revenue from pulp increased 1% from 3Q22, due to higher net average price in USD (+2%), and 25% when compared to 4Q21 mainly due to higher net average price in USD (+31%) and higher sales volume (+1%), being partially offset by the appreciation of the average BRL against the average USD (-6%).
PULP CASH COST

Page 5 of 40
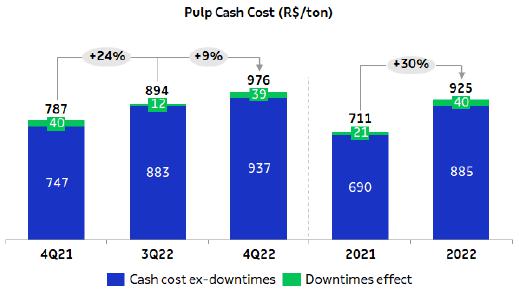
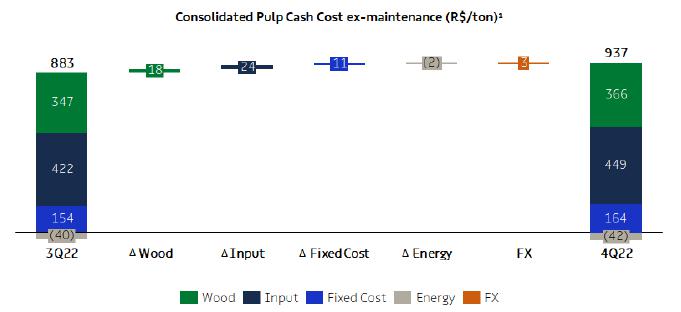
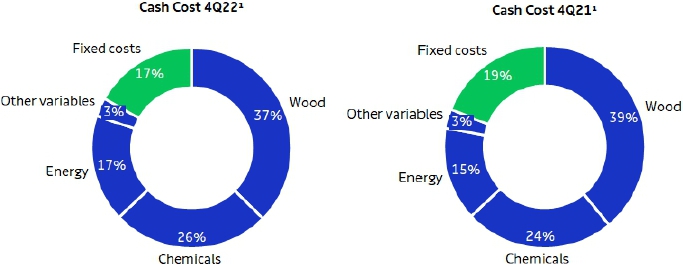
Cash cost excluding downtime in 4Q22 stood at R$937/t, increasing 6% from 3Q22, due to: i) the increase in consumption of inputs, resulting from one-off events at the industrial units, partially offset by lower prices in the period; ii) the increase of wood cost, due to the higher cost of harvesting because of a greater third-party operation, the higher logistical cost due to higher transport tariffs and the larger average radius, partially offset by the reduction in the price of diesel in the period; and iii) higher labor costs and lower dilution of fixed costs, given the lower production volume, due to the maintenance stoppages.
1Excludes the impact of maintenance and administrative downtimes.
Cash cost excluding downtime in 4Q22 was 25% higher than in 4Q21, due to: i) higher input costs, caused by higher chemical prices (especially of caustic soda due to higher international prices (HIS)) and higher energy prices (mainly natural gas due to the increase in Brent prices); ii) the increase in wood costs, mainly due to the increase in logistics costs resulting from the increase in transport tariffs and the higher share of third-party wood, as well as the increase in diesel prices, partially offset by the lower average radius in the period; iii) the lower result from utilities due to lower energy exports; and iv) higher fixed costs on account of the increase in labor and maintenance costs. These effects were partially offset by the appreciation of BRL against USD (-6%).
Page 6 of 40

1Excludes the impact of maintenance and administrative downtimes.

1Excludes the impact of maintenance and administrative downtimes.
Cash cost excluding downtime in 2022 was 28% higher than in 2021, due to higher input costs, specially brent and caustic soda, as well as wood and fixed costs.
Page 7 of 40
1Based on cash cost excluding downtimes. Excludes energy sales.
PULP SEGMENT EBITDA
| Pulp Segment | 4Q22 | 3Q22 | ΔQ-o-Q | 4Q21 | ΔY-o-Y | 2022 | 2021 | ΔY-o-Y | |||||||||||||||||
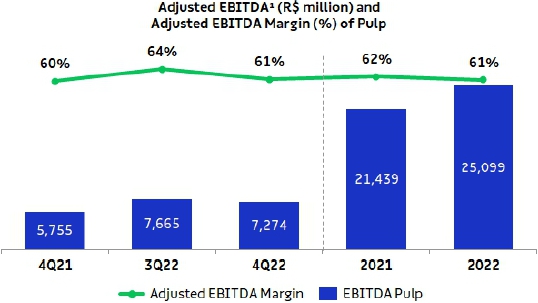
| Adjusted EBITDA (R$ million)1 | 7,274 | 7,665 | -5 | % | 5,755 | 26 | % | 25,099 | 21,439 | 17 | % | ||||||||||||||
| Sales volume (k ton) | 2,759 | 2,797 | -1 | % | 2,722 | 1 | % | 10,600 | 10,586 | 0 | % | ||||||||||||||
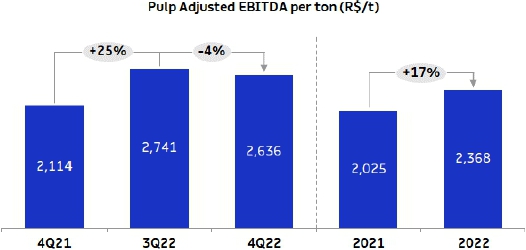
| Pulp adjusted1 EBITDA (R$/ton) | 2,636 | 2,741 | -4 | % | 2,114 | 25 | % | 2,368 | 2,025 | 17 | % | ||||||||||||||
1Excludes non-recurring items.
Adjusted EBITDA from pulp fell 5% from 3Q22 due to higher production cash cost, as explained above, higher SG&A with more administrative expenses (+54%), in turn, due to the increase in expenses with variable compensation and the lower volume sold (-1%), partially offset by the higher price level (+2%). The 4% reduction in adjusted EBITDA per ton is explained by the same factors, except for the volume factor.
Compared to 4Q21, the 26% increase in Adjusted EBITDA from pulp reflects the increase in net average price in USD (+31%) and higher sales volume (+1%). The increase in Adjusted EBITDA was partially offset by the decline in average USD against BRL (-6%), higher production costs (+25%), mainly due to strong pressure on commodity prices and higher SG&A expenses resulting from higher administrative expenses, in turn caused by the increase in expenses with personnel (variable compensation). Adjusted EBITDA per ton increased 25% mainly due to higher prices in the quarter, partially offset by the cost factor and higher SG&A expenses, as explained above.
Page 8 of 40
1Excludes non-recurring items.
Page 9 of 40
OPERATING CASH GENERATION FROM THE PULP SEGMENT
| Operating Cash Flow - Pulp (R$ million) | 4Q22 | 3Q22 | ΔQ-o-Q | 4Q21 | ΔY-o-Y | 2022 | 2021 | ΔY-o-Y | |||||||||||||||||
| Adjusted EBITDA1 | 7,274 | 7,665 | -5 | % | 5,755 | 26 | % | 25,099 | 21,439 | 17 | % | ||||||||||||||
| Maintenance Capex2 | (1,554 | ) | (1,314 | ) | 18 | % | (1,417 | ) | 10 | % | (5,149 | ) | (4,315 | ) | 19 | % | |||||||||
| Operating Cash Flow | 5,720 | 6,351 | -10 | % | 4,338 | 32 | % | 19,949 | 17,124 | 17 | % | ||||||||||||||
1Excludes non-recurring items.
2Cash basis.
Operating cash generation per ton in the pulp segment was 9% lower than in 3Q22, due to lower EBITDA per ton and higher sustaining capex per ton. In relation to 4Q21, operating cash generation per ton in the pulp segment increased 30% due to higher EBITDA per ton, which was partially offset by higher sustaining capex per ton.

PAPER BUSINESS PERFORMANCE
The following data and analyses incorporate the joint results of the consumer goods and paper businesses (tissue).
PAPER SALES VOLUME AND REVENUE
According to data published by Brazil's Forestry Industry Association (IBÁ), demand for Printing and Writing in Brazil, including imports, decreased 2.2% in 4Q22 compared to the same period last year. This reduction is due to a very strong comparison base in 2021, due to uncoated paper volumes allocated to the paperboard segment in the period.
We expect domestic sales in the traditional Printing & Writing paper segment to remain solid during 4Q22, driven by the publishing and educational materials markets, as well as school and office supplies (cutsize paper), whose seasonal demand is historically stronger in the second half of the year. When compared to 3Q22, Printing & Writing demand grow 9.6%.
In international markets, despite some differences between regions, there was robust demand in markets. The normalization of the logistical situation brought freight prices closer to historic levels, in addition to reducing congestion. In this way, supply imbalances are dissipating and markets are returning to historical trends, but still sustaining favorable price levels.
With demand remaining strong, inventories across the paper chain remained below normal during most of 2022, with some replenishment in the last quarter, when the logistic chain were close to normalization.
Domestic paperboard sales in Brazil remain strong, increasing 5.1% in 4Q22 compared to the same period last year and 2.5% when compared to 3Q22, driven by the maintenance of consumption levels, combined with strong seasonality during the period.
Page 10 of 40
Consolidating both market segments (Suzano's accessible paper market), domestic demand fell 2.2% compared to the same period last year, mainly due to the very strong comparison base in 2021 and lower available inventories in 2022.
Suzano’s paper sales (printing & writing, paperboard and tissue) in the domestic market totaled 258 thousand tons in 4Q22, increasing 6% from 3Q22 and decreasing 6% from 4Q21.
International paper sales totaled 80 thousand tons, down 9% from 3Q22 and 17% from 4Q21, corresponding to 24% of total sales volume in 4Q22.

1Includes the Consumer Goods Unit.
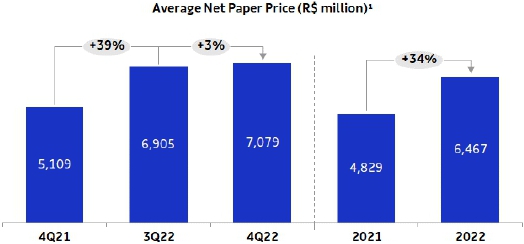
Net average price rose 3% from 3Q22 and 39% from 4Q21, reflecting the price increases across all segments in the domestic and export markets, despite the depreciation of average USD vs average BRL (-6%) when compared to 4Q21.
Net revenue from paper was R$2,395 million, increasing 5% from 3Q22, due to the implementation of price increases, higher sales volume (+2%) and the appreciation of the average USD vs average BRL. Compared to 4Q21, the 26% increase was due to price increases implemented throughout 2022 and allocation of supplies to more profitable markets and segments, partially offset by the drop in sales volume (-9%) and the depreciation of average USD vs average BRL (-6%).
Page 11 of 40

1Includes the Consumer Goods Unit.
PAPER SEGMENT EBITDA
| Paper Segment | 4Q22 | 3Q22 | ΔQ-o-Q | 4Q21 | ΔY-o-Y | 2022 | 2021 | ΔY-o-Y | |||||||||||||||||
| Adjusted EBITDA (R$ million) | 901 | 931 | -3 | % | 600 | 50 | % | 3,096 | 2,032 | 52 | % | ||||||||||||||
| Sales volume (k ton) | 338 | 331 | 2 | % | 371 | -9 | % | 1,306 | 1,294 | 1 | % | ||||||||||||||
| Paper adjusted1 EBITDA (R$/ton) | 2,664 | 2,812 | -5 | % | 1,619 | 65 | % | 2,371 | 1,570 | 51 | % | ||||||||||||||
1Excludes non-recurring items.
Adjusted EBITDA from paper decreased 3% from 3Q22 mainly due to the increase in administrative expenses, in turn due to the increase in personnel costs (higher provision with variable compensation) and higher cash COGS (higher production costs). These effects were partially offset by the increase in net average price. Adjusted EBITDA per ton decreased 5%, mainly due to higher administrative expenses and higher costs, partially offset by the price effect.
Compared to 4Q21, the 50% increase was due to price increases, despite the drop in sales volume, increase in costs and in administrative and commercial and logistics expenses. Adjusted EBITDA per ton increased 65% due to the price factor, partially offset by higher costs, as explained earlier.

Page 12 of 40
OPERATING CASH GENERATION FROM THE PAPER SEGMENT
| Operating Cash Flow – Paper (R$ million) | 4Q22 | 3Q22 | ΔQ-o-Q | 4Q21 | ΔY-o-Y | 2022 | 2021 | ΔY-o-Y | |||||||||||||||||
| Adjusted EBITDA1 | 901 | 931 | -3 | % | 600 | 50 | % | 3,096 | 2,032 | 52 | % | ||||||||||||||
| Maintenance Capex2 | (158 | ) | (128 | ) | 24 | % | (129 | ) | 22 | % | (483 | ) | (336 | ) | 44 | % | |||||||||
| Operating Cash Flow | 744 | 803 | -7 | % | 471 | 58 | % | 2,614 | 1,696 | 54 | % | ||||||||||||||
1Excludes non-recurring items.
2Cash basis.
Operating cash generation per ton in the paper segment was R$2,198/t in 4Q22, down 9% from 3Q22, due to lower EBITDA and higher sustaining capex per ton. Compared to the same period the previous year, the increase of 73% was due to higher EBITDA per ton, partially offset by higher sustaining capex per ton.

Page 13 of 40
FINANCIAL PERFORMANCE
NET REVENUE
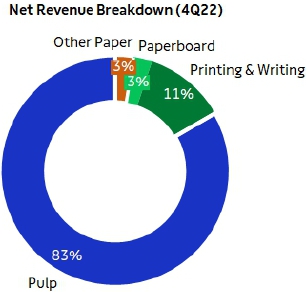
Suzano’s net revenue in 4Q22 was R$14,370 million, 83% of which came from exports (vs. 84% in 3Q22 and 83% in 4Q21). Compared to 3Q22, net revenue increased 1% due to higher net average pulp and paper prices, being partially offset by the lower pulp volume sold. The 25% growth in consolidated net revenue compared to 4Q21 is due to the higher net average pulp price in USD (+31%) and higher net average paper price (+39%), despite the decline in average USD vs. BRL (-6%) and lower volumes sold in the period.
1Does not include Portocel service revenue.
Page 14 of 40
CALENDAR OF SCHEDULED MAINTENANCE DOWNTIMES
| Mill - Pulp capacity | 2021 | 2022 | 2023 | |||||||||||||||||
| 1Q21 | 2Q21 | 3Q21 | 4Q21 | 1Q22 | 2Q22 | 3Q22 | 4Q22 | 1Q23 | 2Q23 | 3Q23 | 4Q23 | |||||||||
| Aracruz - Mill A1 (ES) – 590 kt | No downtime | |||||||||||||||||||
| Aracruz - Mill B (ES) – 830 kt | No downtime | |||||||||||||||||||
| Aracruz - Mill C (ES) – 920 kt | No downtime | |||||||||||||||||||
| Imperatriz (MA)2 – 1,650 kt | No downtime | |||||||||||||||||||
| Jacareí (SP) – 1,100 kt | No downtime | |||||||||||||||||||
| Limeira (SP)2 – 690 kt | ||||||||||||||||||||
| Mucuri - Mill 1 (BA)2 – 600 kt | No downtime | |||||||||||||||||||
| Mucuri - Mill 2 (BA) – 1,130 kt | No downtime | |||||||||||||||||||
| Suzano (SP)2 – 520 kt | No downtime | |||||||||||||||||||
| Três Lagoas - Mill 1 (MS) – 1,300 kt | No downtime | |||||||||||||||||||
| Três Lagoas - Mill 2 (MS) – 1,950 kt | No downtime | |||||||||||||||||||
| Veracel (BA)3 – 560 kt | No downtime | |||||||||||||||||||
1 Temporary downtime of production line A at Aracruz in 4Q22 due to the partial retrofitting of the Unit's recovery boiler.
2 Includes integrated capacities and fluff.
3 Veracel is a joint operation between Suzano (50%) and Stora Enso (50%) with total annual capacity of 1,120 thousand tons.
COST OF GOODS SOLD
| COGS (R$ million) | 4Q22 | 3Q22 | ΔQ-o-Q | 4Q21 | ΔY-o-Y | 2022 | 2021 | ΔY-o-Y | |||||||||||||||||
| COGS (Income statement) | 6,793 | 6,473 | 5 | % | 5,693 | 19 | % | 24,821 | 20,616 | 20 | % | ||||||||||||||
| (-) Depreciation, depletion and amortization | 1,678 | 1,640 | 2 | % | 1,568 | 7 | % | 6,407 | 5,988 | 7 | % | ||||||||||||||
| Cash COGS | 5,115 | 4,833 | 6 | % | 4,125 | 24 | % | 18,415 | 14,628 | 26 | % | ||||||||||||||
| Sales volume | 3,097 | 3,128 | -1 | % | 3,093 | 0 | % | 11,906 | 11,880 | 0 | % | ||||||||||||||
| Cash COGS/ton (R$/ton) | 1,651 | 1,545 | 7 | % | 1,333 | 24 | % | 1,547 | 1,231 | 26 | % | ||||||||||||||
Cash COGS in 4Q22 totaled R$5,115 million, or R$1,651/ton. Compared to 3Q22, cash COGS increased 6%, due to higher pulp and paper production costs, greater impact of maintenance downtimes and appreciation in average USD against BRL, which were partially offset by lower pulp volumes sold and lower logistics costs (mainly due to the decrease in bunker price). Cash COGS per ton increased 7% due to higher production costs and maintenance downtimes effect, partially offset by the reduction in logistics costs.
Compared to 4Q21, cash COGS increased 24%, chiefly due to the higher cash cost of production and higher logistics costs, both heavily impacted by the increase in Brent, being partially offset by lower impact of scheduled maintenance downtimes and the 6% drop in average USD against BRL, in addition to the lower volume sold in the paper segment (-9%). In relation to the same period last year, cash COGS per ton increased 24% due to the factors mentioned above.
Page 15 of 40
SELLING EXPENSES
| Selling Expenses (R$ million) | 4Q22 | 3Q22 | ΔQ-o-Q | 4Q21 | ΔY-o-Y | 2022 | 2021 | ΔY-o-Y | |||||||||||||||||
| Selling expenses (Income Statement) | 660 | 625 | 6 | % | 635 | 4 | % | 2,483 | 2,292 | 8 | % | ||||||||||||||
| (-) Depreciation, depletion and amortization1 | 239 | 238 | 0 | % | 237 | 1 | % | 952 | 944 | 1 | % | ||||||||||||||
| Cash selling expenses | 421 | 387 | 9 | % | 398 | 6 | % | 1,532 | 1,348 | 14 | % | ||||||||||||||
| Sales volume | 3,097 | 3,128 | -1 | % | 3,093 | 0 | % | 11,906 | 11,880 | 0 | % | ||||||||||||||
| Cash selling expenses/ton (R$/ton) | 136 | 124 | 10 | % | 129 | 6 | % | 129 | 113 | 13 | % | ||||||||||||||
Cash selling expenses increased 9% from 3Q22, mainly due to higher third-party expenses and labor. Cash selling expenses per ton increased 10% due to the same factors.
Compared to 4Q21, the 6% increase in cash selling expenses was due to the increase in third-party expenses, labor and logistics expenses in the paper segment, partially offset by the drop in average USD vs. BRL (-6%). Cash selling expenses per ton increased 6% due to the factors mentioned above.
GENERAL AND ADMINISTRATIVE EXPENSES
| General and Administrative Expenses (R$ million) | 4Q22 | 3Q22 | ΔQ-o-Q | 4Q21 | ΔY-o-Y | 2022 | 2021 | ΔY-o-Y | |||||||||||||||||
| General and Administrative Expenses | 616 | 393 | 57 | % | 523 | 18 | % | 1,710 | 1,578 | 8 | % | ||||||||||||||
| Depreciation, depletion and amortization1 | 25 | 25 | 1 | % | 27 | -5 | % | 102 | 104 | -2 | % | ||||||||||||||
| Cash general and administrative expenses | 591 | 368 | 61 | % | 496 | 19 | % | 1,608 | 1,474 | 9 | % | ||||||||||||||
| Sales volume | 3,097 | 3,128 | -1 | % | 3,093 | 0 | % | 11,906 | 11,880 | 0 | % | ||||||||||||||
| Cash general and administrative expenses/t (R$/ton) | 191 | 118 | 62 | % | 160 | 19 | % | 135 | 124 | 9 | % | ||||||||||||||
The respective increase of 61% and 19% in cash general and administrative expenses compared to 3Q22 and 4Q21 is mainly due to higher personnel expenses (variable compensation). The same factors explain the change on a per-ton basis.
Other operating income (expenses) amounted to income of R$981 million in 4Q22, compared to an expense of R$19 million in 3Q22 and income of R$203 million in 4Q21. The variation in relation to 3Q22 and 4Q21 is mainly due to the updated fair value of biological assets (which happens in the second and fourth quarters of each year).
Page 16 of 40
ADJUSTED EBITDA
| Consolidated | 4Q22 | 3Q22 | ΔQ-o-Q | 4Q21 | ΔY-o-Y | 2022 | 2021 | ΔY-o-Y | |||||||||||||||||
| Adjusted EBITDA (R$ million)1 | 8,175 | 8,596 | -5 | % | 6,355 | 29 | % | 28,195 | 23,471 | 20 | % | ||||||||||||||
| Adjusted EBITDA1 Margin | 57 | % | 61 | % | -4 p.p. | 55 | % | 1 p.p. | 57 | % | 57 | % | -1 p.p. | ||||||||||||
| Sales Volume (k ton) | 3,097 | 3,128 | -1 | % | 3,093 | 0 | % | 11,906 | 11,880 | 0 | % | ||||||||||||||
| Adjusted EBITDA1/ton (R$/ton) | 2,639 | 2,748 | -4 | % | 2,055 | 28 | % | 2,368 | 1,976 | 20 | % | ||||||||||||||
1Excludes non-recurring items.
The 5% decrease in Adjusted EBITDA in 4Q22 compared to 3Q22 is explained mainly by the higher cash COGS per ton and by the higher SG&A expenses, mainly due to higher administrative expenses as a result of the increase in expenses with personnel (variable compensation), as explained above. Adjusted EBITDA was partially offset by the increase of 2% in average net pulp price in USD and 3% in average net paper price in BRL. Adjusted EBITDA per ton decreased 4%, mainly due to the higher SG&A and cost factor, which was partially offset by the factors explained above.
Compared to 4Q21, the 29% increase in Adjusted EBITDA was due to the increase of 31% in net average pulp price in USD and 39% in net average paper price in BRL, which were partially offset mainly by the increase in cash COGS per ton, the 6% decline in average USD vs. BRL and higher SG&A expenses. Adjusted EBITDA per ton increased 28% due to the same factors.
FINANCIAL RESULT
| Financial Result (R$ million) | 4Q22 | 3Q22 | ΔQ-o-Q | 4Q21 | ΔY-o-Y | 2022 | 2021 | ΔY-o-Y | |||||||||||||||||
| Financial Expenses | (1,190 | ) | (1,216 | ) | -2 | % | (1,085 | ) | 10 | % | (4,590 | ) | (4,221 | ) | 9 | % | |||||||||
| Interest on loans and financing (local currency) | (338 | ) | (359 | ) | -6 | % | (241 | ) | 40 | % | (1,352 | ) | (699 | ) | 93 | % | |||||||||
| Interest on loans and financing (foreign currency) | (768 | ) | (692 | ) | 11 | % | (673 | ) | 14 | % | (2,656 | ) | (2,508 | ) | 6 | % | |||||||||
| Capitalized interest1 | 153 | 97 | 57 | % | 14 | - | 359 | 19 | - | ||||||||||||||||
| Other financial expenses | (238 | ) | (263 | ) | -10 | % | (184 | ) | 29 | % | (942 | ) | (1,033 | ) | -9 | % | |||||||||
| Financial Income | 345 | 270 | 28 | % | 148 | 134 | % | 967 | 273 | 255 | % | ||||||||||||||
| Interest on financial investments | 286 | 229 | 25 | % | 112 | 156 | % | 819 | 206 | 298 | % | ||||||||||||||
| Other financial income | 59 | 41 | 43 | % | 36 | 64 | % | 148 | 67 | 121 | % | ||||||||||||||
| Monetary and Exchange Variations | 1,594 | (1,470 | ) | - | (1,412 | ) | - | 3,295 | (3,801 | ) | - | ||||||||||||||
| Foreign exchange variations (Debt) | 2,162 | (2,026 | ) | - | (1,722 | ) | - | 3,949 | (4,847 | ) | - | ||||||||||||||
| Other foreign exchange variations | (567 | ) | 555 | - | 310 | - | (654 | ) | 1,046 | - | |||||||||||||||
| Derivative income (loss), net2 | 1,251 | 890 | 41 | % | (307 | ) | - | 6,762 | (1,597 | ) | - | ||||||||||||||
| Operating Cash flow hedge | 545 | 139 | 292 | % | (111 | ) | - | 2,061 | (717 | ) | - | ||||||||||||||
| Cash flow - Cerrado project hedge | 340 | 44 | - | 27 | - | 623 | 27 | - | |||||||||||||||||
| Debt hedge | 399 | 609 | - | (38 | ) | - | 4,066 | (511 | ) | - | |||||||||||||||
| Others3 | (33 | ) | 97 | - | (185 | ) | - | 12 | (396 | ) | - | ||||||||||||||
| Net Financial Result | 2,000 | (1,527 | ) | - | (2,657 | ) | - | 6,433 | (9,347 | ) | - | ||||||||||||||
1Capitalized interest related to work in progress.
2Variation in mark-to-market adjustment (4Q22: R$27 million | 3Q22: -R$968 million), plus adjustments paid and received (4Q22 = R$256 million).
3Includes commodity hedge and embedded derivatives.
Financial expenses were 2% lower than in 3Q22, mainly due to: (i) increase in capitalized interest (linked to the progress of the Cerrado Project); (ii) drop in other financial expenses, in turn due to charges on several obligations; and (iii) decrease in interest on loans and financing in local currency, mainly as a result of a CRA settlement at the end of September. These effects were partially offset by higher interest expenses in foreign currency, in turn explained by the increase in Libor rate (4Q22: 1.10% | 3Q22: 0.75%), the indexer of export prepayment agreements (PPEs). Compared to 4Q21, financial expenses increased 10%, due to the increase of CDI (4Q22: 3.20% | 4Q21: 1.84%) and Libor rate (4Q22: 1.10% | 4Q21: 0.04%), which impacted the interest expenses in local and foreign currency, and increase in other financial expenses (higher charges), which were partially offset by higher capitalized interest.
Page 17 of 40
Financial income grew 28% in relation to 3Q22, mainly due to higher average cash position in BRL. Compared to 4Q21, the 134% increase is explained by higher CDI in the period (4Q22: 3.20% | 4Q21: 1.84%) charged on the cash portion in local currency.
Inflation adjustment and exchange variation had a positive impact of R$1,594 million on the Company’s financial result due to the 3.5% increase in the end-of-period rate of BRL against USD in 3Q22, affecting the debt in foreign currency in R$2,162 million (US$11,732 million at the end of 4Q22). This effect was partially offset by the negative result of the exchange variation on other items of the balance sheet in foreign currency (R$567 million), especially on Company’s cash position (72% at the end of 4Q22). Note that the accounting impact of exchange variation on foreign currency debt has a cash impact only on the respective maturities.
Derivative operations resulted in an income of R$1,251 million in 4Q22, due to the stronger BRL (3.5%) and the changes in the coupon and Libor curves (with the increase in U.S. interest rate) on both debt and cash flow hedges. The mark-to-market adjustment of derivative instruments on December 31, 2022 was positive at R$27 million, compared to an expense of R$968 million on September 30, 2022, representing a positive variation of R$995 million. Note that the impact of BRL appreciation on the derivatives portfolio generates a cash impact only upon the respective maturities. The net effect on cash, which refers to the maturity of derivative operations in the fourth quarter, was a positive R$256 million (R$184 million gain from debt hedge and R$72 million gain from cash flow hedge).
As a result of the above factors, net financial result in 4Q22, considering all financial expense and income lines, was an income of R$2,000 million, compared to an expense of R$1,527 million in 3Q22 and R$2,657 million in 4Q21.
DERIVATIVE OPERATIONS
Suzano carries out derivative operations exclusively for hedging purposes. The following table reflects the position of derivative hedging instruments on December 31, 2022:
| Notional (US$ milion) | Fair Value (R$ million) | |||||||||||||||
| Hedge1 | Dec/22 | Sep/22 | Dec/22 | Sep/22 | ||||||||||||
| Debt | 5,868 | 5,691 | (1,768 | ) | (1,983 | ) | ||||||||||
| Cash Flow – Operating (ZCC + NDF) | 5,888 | 4,836 | 1,112 | 632 | ||||||||||||
| Cash Flow - Cerrado2 (ZCC + NDF) | 1,771 | 1,946 | 643 | 310 | ||||||||||||
| Others3 | 125 | 123 | 40 | 73 | ||||||||||||
| Total | 13,653 | 12,596 | 27 | (968 | ) | |||||||||||
1See note 4 of the 4Q22 Quarterly Financial Statements (ITR) for further details and fair value sensitivity analysis.
2Hedge program related to capex in BRL (ZCC) and EUR (NDF) of the Cerrado Project.
3Considers the hedge of embedded derivative.
The Company’s foreign exchange exposure policy seeks to minimize the volatility of its cash generation and to ensure greater flexibility in cash flow management. On October 27, 2022, the Board of Directors authorized the extension of the term for foreign exchange exposure to contract operational hedge instruments from 18 to 24 months allowing the improvement of cash flow hedge. As such, currently the policy stipulates that surplus dollars may be partially hedged (at least 40% and up to 75% of exchange variation exposure over the next 24 months) using plain vanilla instruments such as Zero Cost Collars (ZCC) and Non-Deliverable Forwards (NDF). At the end of 4Q22, 61% of the exchange variation exposure was covered.
Considering the foreign exchange exposure related to Capex in the Cerrado Project, since approximately 67% of Capex is pegged to local currency, the Board of Directors approved on October 28, 2021, a program for contracting additional specific hedge operations to protect from such exposure. The program approved (established in the Derivative Management Policy available on the Investor Relations website) initially involved a maximum amount (notional) of up to US$1 billion and a term of operations of up to 36 months. On July 27th, 2022, the Board of Directors approved the expansion of the program, increasing the maximum amount (notional) to US$1.5 billion while maintaining the previously established term. To ensure transparency with regard to the Cerrado Project's hedge program, since 4Q21 the Company has been prominently disclosing the operations contracted.
Page 18 of 40
Since about 33% of the Capex of the Cerrado Project is denominated in EUR, in 3Q22, the Company contracted hedge operations through NDFs to protect the exposure in EUR of the Capex of the Cerrado Project, converting it into USD. This type of hedge is established in the Derivatives Management Policy available on the Investor Relations website.
ZCC transactions establish minimum and maximum limits for the exchange rate that minimize adverse effects in the event of significant appreciation of the BRL. As such, if the exchange rate is within such limits, the Company neither pays nor receives any financial adjustments. This characteristic allows for capturing greater benefits from export revenue in a potential scenario of BRL appreciation versus USD within the range contracted. In cases of extreme BRL appreciation, the Company is protected by the minimum limits, which are considered appropriate for the operation. However, this protection instrument also limits, temporarily and partially, potential gains in scenarios of extreme BRL depreciation when exchange rates exceed the maximum limits contracted.
On December 31, 2022, the outstanding notional value of operations involving forward USD sales through ZCCs related to Cash Flows (including those related to the Cerrado Project) was US$6,867 million, with an average forward rate ranging from R$5.62 to R$6.60 and maturities distributed between January 2023 and November 2024. On the same date, the outstanding notional value of operations involving forward USD sales through NDFs was US$248 million, whose maturities are distributed between August and November 2023 and with an average rate of R$5.54. Regarding hedge for foreign exchange exposure in EUR, the outstanding notional value of forward EUR purchases at the end of 4Q22 was €533 million (USD545 million), with an average contracted rate of 1.02 EUR/USD and maturities through July 2024. In 4Q22, cash flow and Cerrado Project hedging operations resulted in a gain of R$885 million. The mark-to-market (“MtM” or “fair value”) value of these operations totaled R$1,755 million, with R$1,112 million related to operational cash flow hedge and R$643 million related to operational hedge of the Cerrado Project.
The following table presents a sensitivity analysis of the cash impact that the Company could have on its cash flow hedge portfolios (ZCC and NDF) if the exchange rate remains the same as at the end of 4Q22 (BRL/USD = 5.22) in the coming quarters, as well as the projected cash impact for R$0.10 variations below / above the strike of put/call options, respectively, defined in each quarter. Note that the figures presented in the table are the Company’s projections based on the end-of-period curves and could vary depending on market conditions.
| Cash Adjustment (R$ million) | ||||||||||||||||||||
| Maturity (up to) | Strike Range | Notional (US$ million) | Actual | Exchange rate 4T22 (R$ 5.22) | Sensitivity at R$ 0.10 / US$ variation (+/-) | |||||||||||||||
| Zero Cost Collars | ||||||||||||||||||||
| 4Q22 | - | - | 67 | - | - | |||||||||||||||
| 1Q23 | 5.56 – 6.85 | 915 | - | 317 | 91 | |||||||||||||||
| 2Q23 | 5.73 – 6.84 | 1,074 | - | 553 | 107 | |||||||||||||||
| 3Q23 | 5.42 – 6.20 | 729 | - | 165 | 73 | |||||||||||||||
| 4Q23 | 5.55 – 6.34 | 1,046 | - | 344 | 105 | |||||||||||||||
| 1Q24 | 5.45 – 6.20 | 577 | - | 136 | 58 | |||||||||||||||
| 2Q24 | 5.56 – 6.39 | 520 | - | 177 | 52 | |||||||||||||||
| 3Q24 | 5.67 – 6.53 | 520 | - | 233 | 52 | |||||||||||||||
| 4Q24 | 5.76 – 6.65 | 260 | - | 141 | 26 | |||||||||||||||
| Total | 5.58 – 6.52 | 5,640 | 67 | 2,065 | 564 | |||||||||||||||
| NDF | ||||||||||||||||||||
| 4Q22 | - | - | (2 | ) | - | - | ||||||||||||||
| 3Q23 | 5.53 | 215 | - | 66 | 21 | |||||||||||||||
| 4Q23 | 5.64 | 34 | - | 14 | 3 | |||||||||||||||
| Total | 5.54 | 248 | (2 | ) | 80 | 25 | ||||||||||||||
| Zero Cost Collars Cerrado | ||||||||||||||||||||
| 4Q22 | - | - | - | - | - | |||||||||||||||
| 1Q23 | 5.42 – 6.13 | 133 | - | 27 | 13 | |||||||||||||||
| 2Q23 | 5.68 – 6.78 | 292 | - | 135 | 29 | |||||||||||||||
| 3Q23 | 5.87 – 7.22 | 300 | - | 196 | 30 | |||||||||||||||
| 4Q23 | 5.85 – 7.00 | 341 | - | 214 | 34 | |||||||||||||||
| 1Q24 | 5.87 – 6.98 | 95 | - | 62 | 9 | |||||||||||||||
| 2Q24 | 6.10 – 7.44 | 58 | - | 51 | 6 | |||||||||||||||
| 3Q24 | 6.35 – 8.34 | 9 | - | 10 | 1 | |||||||||||||||
| Total | 5.78 – 6.94 | 1,227 | - | 696 | 123 | |||||||||||||||
Page 19 of 40
| Cash Adjustment (R$ million) | ||||||||||||||||||||
| Maturity (up to) | Strike Range | Notional (US$ million) | Actual | Exchange rate 4T22 (€ 1,07) | Sensitivity at € 0,10 / US$ variation (+/-) | |||||||||||||||
| NDF – Cerrado Projet (EUR/USD) | ||||||||||||||||||||
| 4Q22 | - | - | 7 | - | - | |||||||||||||||
| 1Q23 | 1.00 | 40 | - | 13 | 21 | |||||||||||||||
| 2Q23 | 1.01 | 49 | - | 15 | 26 | |||||||||||||||
| 3Q23 | 1.01 | 96 | - | 27 | 50 | |||||||||||||||
| 4Q23 | 1.02 | 97 | - | 23 | 50 | |||||||||||||||
| 1Q24 | 1.03 | 98 | - | 19 | 50 | |||||||||||||||
| 2Q24 | 1.03 | 96 | - | 18 | 49 | |||||||||||||||
| 3Q24 | 1.04 | 69 | - | 10 | 34 | |||||||||||||||
| Total | 1.02 | 545 | 7 | 126 | 278 | |||||||||||||||
To mitigate the effects of exchange and interest rate variations on its debt and its cash flows, the Company also uses currency and interest rate swaps. Swap contracts are entered into considering different interest rates and inflation indices in order to mitigate the mismatch between financial assets and liabilities.
On December 31, 2022, the Company had an outstanding amount (notional value) of US$5,868 million in swap contracts as shown in the table below. In 4Q22, the result of debt hedge transactions was a gain of R$399 million, mainly due to the positive impact of fixed, coupon and Libor curves, as well as a stronger BRL during the period. The mark-to-market adjustment (fair value) of these operations was a loss of R$1,768 million.
| Notional (US$ million) | Fair Value (R$ million) | |||||||||||||||||||||||
| Debt Hedge | Maturity (up to) | Currency | Dec/22 | Sep/22 | Dec/22 | Sep/22 | ||||||||||||||||||
| Swap (PRÉ x USD) | 2024 | USD | 350 | 350 | (504 | ) | (582 | ) | ||||||||||||||||
| Swap (CDI x USD) | 2026 | USD | 1,864 | 1,864 | (2,566 | ) | (2,694 | ) | ||||||||||||||||
| Swap (IPCA x USD) | 2023 | USD | 121 | 121 | (30 | ) | (52 | ) | ||||||||||||||||
| Swap (LIBOR x USD) | 2027 | USD | 3,200 | 3,200 | 1,053 | 1,073 | ||||||||||||||||||
| Swap (IPCA x CDI) | 2036 | BRL | 334 | 1 | 156 | 279 | 271 | |||||||||||||||||
| Total | 5,868 | 5,691 | (1,768 | ) | (1,983 | ) | ||||||||||||||||||
1Translated at the closing exchange rate (5.22).
Page 20 of 40
The following table presents a sensitivity analysis1 of the cash impact that the Company could have on its debt hedge portfolio (swaps) if the exchange rate remains the same as at the end of 4Q22 (BRL/USD = 5.22) in the coming quarters, as well as the projected variation in cash impact for each R$0.10 variation on the same reference exchange rate (4Q22). Note that the figures presented in the table are the Company’s projections based on the end-of-period curves and could vary depending on market conditions.
| Cash Adjustment (R$ million) | ||||||||||||||||
| Maturity (up to) | Notional (US$ million) | Actual | R$ / US$ = 5,22 (4T22) | Sensitivity at R$ 0.10 / US$ variation (+/-)1 | ||||||||||||
| 4Q22 | - | 184 | - | - | ||||||||||||
| 2023 | 1,862 | - | 844 | 37 | ||||||||||||
| 2024 | 1,514 | - | 146 | 38 | ||||||||||||
| 2025 | 1,419 | - | (824 | ) | 87 | |||||||||||
| >=2026 | 1,073 | - | (1,098 | ) | 85 | |||||||||||
| Total | 5,868 | 184 | (932 | ) | 247 | |||||||||||
1Sensitivity analysis considers variation only in the exchange rate (R$/US$), while other variables are presumed constant.
Other transactions involving the Company’s derivatives are related to the embedded derivative resulting from forestry partnerships and commodity hedges, as shown in the table.
| Notional | Fair Value | Cash Adjustment | |||||||||||||||
| Maturity | (US$ million) | (R$ million) | (R$ million) | ||||||||||||||
| Other hedges | (up to) | Indexador | Dec/22 | Sep/22 | Dec/22 | Sep/22 | Dec/22 | Sep/22 | |||||||||
| Embedded derivative | 2038 | Fixed USD | USD US-CPI | 125 | 123 | 40 | 73 | - | - | |||||||||
| Total | 125 | 123 | 40 | 73 | - | - | |||||||||||
A portion of the forestry partnership agreements and standing timber supply agreements is denominated in USD per cubic meter of standing timber, adjusted by U.S. inflation measured by the Consumer Price Index (CPI), which is not related to inflation in the economic environment where the forests are located and, hence, constitutes an embedded derivative. This instrument, presented in the table above, consists of a sale swap contract of the variations in the US-CPI during the period of the contracts. See note 4 of the 4Q22 Financial Statements for more details and for a sensitivity analysis of the fair value in case of a sharp rise in the US-CPI and USD. On December 31, 2022, the outstanding (notional) value of the operation was US$125 million. The result of this swap in 4Q22 was a loss of R$33 million. The mark-to-market (fair value) adjustment of these operations generated a gain of R$40 million at the end of the quarter.
The Company is also exposed to the price of some commodities and, therefore, continually assesses the contracting of derivative financial instruments to mitigate such risks.
On December 31, 2022, the Company did not have any open commodity hedge transactions.
Page 21 of 40

NET INCOME (LOSS)
In 4Q22, the Company posted net income of R$7,459 million, as against R$5,448 million in 3Q22 and R$2,313 million in 4Q21. The increase in relation to 3Q22 is due to: i) by the increase in financial income, caused by the positive impact of a stronger BRL on debt and the positive result from operations with derivatives; and ii) higher operating profit resulting from the growth in other operating income and net revenue, which offset the increase in COGS and SG&A expenses, as described earlier.
The higher net income in relation to 4Q21 is also explained by the positive variation in the financial result, as a result of the exchange rate appreciation on the debt and on the mark-to-market positive result of operations with derivatives, as well as by higher operating result driven by net revenue growth and other operating income, despite the increase in COGS and higher SG&A.
DEBT
| Debt (R$ million) | 4Q22 | 3Q22 | Δ Q-o-Q | 4Q21 | Δ Y-o-Y | |||||||||||||||
| Local Currency | 13,360 | 12,611 | 6 | % | 13,641 | -2 | % | |||||||||||||
| Short Term | 2,231 | 1,615 | 38 | % | 1,849 | 21 | % | |||||||||||||
| Long Term | 11,129 | 10,996 | 1 | % | 11,791 | -6 | % | |||||||||||||
| Foreign Currency | 61,215 | 63,449 | -4 | % | 65,988 | -7 | % | |||||||||||||
| Short Term | 1,104 | 1,236 | -11 | % | 1,806 | -39 | % | |||||||||||||
| Long Term | 60,111 | 62,213 | -3 | % | 64,182 | -6 | % | |||||||||||||
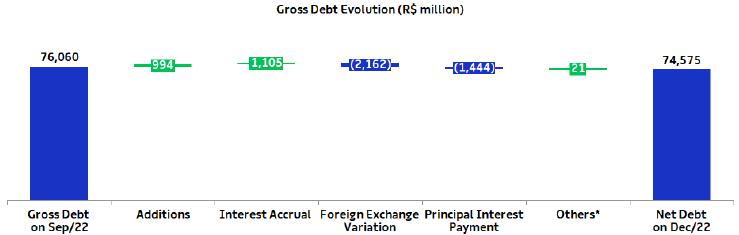
| Gross Debt | 74,575 | 76,060 | -2 | % | 79,629 | -6 | % | |||||||||||||
| (-) Cash | 17,472 | 18,272 | -4 | % | 21,349 | -18 | % | |||||||||||||
| Net debt | 57,103 | 57,788 | -1 | % | 58,280 | -2 | % | |||||||||||||
| Net debt/Adjusted EBITDA1(x) - R$ | 2.0 | x | 2.2 | x | -0.2 | x | 2.5 | x | -0.5 | x | ||||||||||
| Net debt/Adjusted EBITDA1(x) - US$ | 2.0 | x | 2.1 | x | -0.1 | x | 2.4 | x | -0.4 | x | ||||||||||
1Excluding non-recurring items.
On December 31, 2022, gross debt totaled R$74.6 billion and was composed of 96% long-term maturities and 4% short-term maturities. Foreign currency debt corresponded to 82% of the Company's total debt at the end of the quarter. The percentage of gross debt denominated in foreign currency, considering the effect of debt hedge, was 95%. Compared to 3Q22, gross debt decreased 2%, mainly due to the appreciation of the closing BRL against the USD (-3.5%), which was partially offset by fresh funding during the period, especially the disbursement of R$800 million from a credit line with the BNDES.
Page 22 of 40
Suzano contracts debt in foreign currency as a natural hedge, since net operating cash generation is mostly denominated in foreign currency (USD) due to its predominant status as an exporter. This structural exposure allows the Company to match loans and financing payments in USD with receivable flows from sales.
*Corresponding mainly to transaction costs (issue, funding, goodwill, discount and loss on business combinations, etc.).
On December 31, 2022, the total average cost of debt in USD was 4.7% p.a. (considering debt in BRL adjusted by the market swap curve), stable compared to September 30, 2022. The average term of consolidated debt at the end of the quarter was 80 months, compared to 82 months at the end of 3Q22.
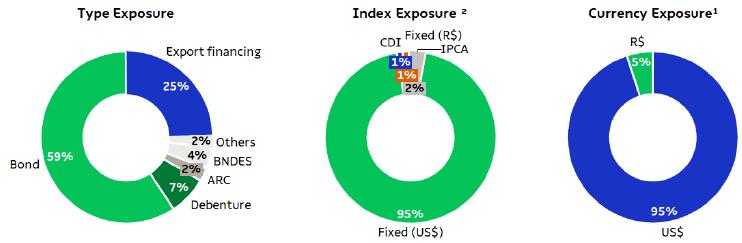
1Considers the portion of debt with currency swaps. The original debt was 82% denominated in USD and 18% in BRL.
2Considers the portion of debt with currency swaps. The exposure of the original debt was: Fixed (US$) – 59%, Libor/SOFR– 23%, CDI – 11%, Other (Fixed R$, IPCA, TJLP, others) – 7%.
Cash and cash equivalents and financial investments on December 31, 2022 amounted to R$17.5 billion, 72% of which were in foreign currency, allocated in remunerated account or in short-term fixed-income investments abroad. The remaining 28% was invested in local currency fixed-income bonds (mainly CDBs, but also in government bonds and others), remunerated at the CDI rate.
On December 31, 2022, the Company also had two stand-by credit facilities totaling R$6.7 billion (US$1.3 billion) available through February 2024 (US$100 million) and February 2027 (US$1.2 billion). These facilities strengthen the company's liquidity position and can be withdrawn during times of uncertainty. As a result, the cash and equivalents of R$17.5 billion plus the credit facilities described above amounted to a readily available cash position of R$24.1 billion on December 31, 2022.
Page 23 of 40

On December 31, 2022, net debt stood at R$57.1 billion (US$10.9 billion), compared to R$57.8 billion (US$10.7 billion) on September 30, 2022. The increase in net debt in USD is mainly due to exchange variation impact on the debt and balance in BRL.
Financial leverage, measured as the ratio of net debt to Adjusted EBITDA in BRL, was 2.0 times on December 31, 2022 (2.2 times in 3Q22). The same ratio in USD (the measure established in Suzano’s financial policy) fell to 2.0 times on December 31, 2022 (2.1 times in 3Q22).

The breakdown of gross debt between trade and non-trade finance on December 31, 2022 is shown below:
| 2023 | 2024 | 2025 | 2026 | 2027 | 2028 onwards | Total | ||||||||||||||||||||||
| Trade Finance1 | 9 | % | 95 | % | 58 | % | 50 | % | 51 | % | 0 | % | 26 | % | ||||||||||||||
| Non-Trade Finance2 | 91 | % | 5 | % | 42 | % | 50 | % | 49 | % | 100 | % | 74 | % | ||||||||||||||
1ECN, EPP
2Bonds, BNDES, CRA, Debentures, among others.
Page 24 of 40
CAPEX
In 4Q22, capital expenditure (cash basis) totaled R$ 5,144 million, an increase of 27% from 3Q22, mainly due to higher investments in the Cerrado Project, with its advances. The increase in capex was also driven by higher maintenance expenses on account of maintenance downtimes, increase in planting and price increases in forestry formation, partially offset mainly by the lower disbursements with Land and Forests.
Compared to 4Q21, Capex increased mainly due to the progress of the Cerrado Project and the increase in maintenance due to the factors explained above.
For 2023, Management has approved a capital budget of R$18.5 billion, of which R$6.3 billion will be allocated to industrial and forestry maintenance and R$8.9 billion will be invested in the Cerrado Project, among others.
Investments (R$ million) | 4Q22 | 3Q22 | Δ Q-o-Q | 4Q21 | Δ Y-o-Y | 2022 | 2021 | ΔY-o-Y | Guidance 2023 | ||||||||||
| Maintenance | 1,712 | 1,441 | 19 | % | 1,546 | 11 | % | 5,632 | 4,652 | 21 | % | 6,360 | |||||||
| Industrial maintenance | 391 | 219 | 78 | % | 333 | 17 | % | 1,042 | 778 | 34 | % | 1,301 | |||||||
| Forestry maintenance | 1,241 | 1,183 | 5 | % | 1,164 | 7 | % | 4,449 | 3,777 | 18 | % | 4,809 | |||||||
| Others | 80 | 39 | 107 | % | 49 | 64 | % | 141 | 97 | 46 | % | 250 | |||||||
| Expansion and modernization | 137 | 127 | 8 | % | 114 | 20 | % | 462 | 219 | 111 | % | 732 | |||||||
| Land and forestry | 193 | 583 | -67 | % | 133 | 45 | % | 2,635 | 444 | 494 | % | 2,420 | |||||||
| Port terminals | 4 | 12 | -70 | % | 68 | -95 | % | 95 | 279 | -66 | % | 12 | |||||||
| Others | 100 | 15 | - | 11 | - | 119 | 11 | - | 34 | ||||||||||
| Cerrado Project | 2,999 | 1,866 | 61 | % | 348 | 761 | % | 7,367 | 739 | 898 | % | 8,937 | |||||||
| Total | 5,144 | 4,043 | 27 | % | 2,220 | 132 | % | 16,309 | 6,342 | 157 | % | 18,495 |
CERRADO PROJECT
The Cerrado Project is progressing according to schedule on its physical and financial curves, closing the fourth quarter of 2022 with the “inside the fence” execution (which corresponds to industrial and infrastructure investments) reaching physical progress of 45% and 41% of financial progress (R$5,585 million). The Company expects the new pulp mill located in Ribas do Rio Pardo, Mato Grosso do Sul, with annual capacity of 2,550 thousand tons, to startup in the 2nd half of 2024.
OPERATING CASH GENERATION
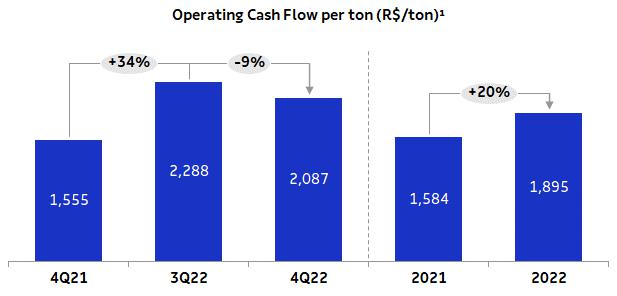
| Operating Cash Flow - Consolidated (R$ million) | 4Q22 | 3Q22 | Δ Q-o-Q | 4Q21 | Δ Y-o-Y | 2022 | 2021 | Δ Y-o-Y | |||||||||
| Adjusted EBITDA1 | 8,175 | 8,596 | -5 | % | 6,355 | 29 | % | 28,195 | 23,471 | 20 | % | ||||||
| Maintenance Capex2 | (1,712 | ) | (1,441 | ) | 19 | % | (1,546 | ) | 11 | % | (5,632 | ) | (4,652 | ) | 21 | % | |
| Operating Cash Flow | 6,463 | 7,155 | -10 | % | 4,809 | 34 | % | 22,563 | 18,819 | 20 | % | ||||||
| Operating Cash Flow (R$/ton) | 2,087 | 2,288 | -9 | % | 1,555 | 34 | % | 1,895 | 1,584 | 20 | % |
1Excluding non-recurring items.
2Cash basis.
Operating cash generation, measured by adjusted EBITDA less sustaining capex (cash basis), amounted to R$6.5 billion in 4Q22. The 9% decrease in operating cash generation per ton in relation to 3Q22 is due to lower Adjusted EBITDA per ton and higher sustaining capex per ton. Compared to 4Q21, operating cash generation per ton increased 34%, due to higher Adjusted EBITDA per ton, which was partially offset by higher sustaining capex per ton.
Page 25 of 40

FREE CASH FLOW
| Free Cash Flow (R$ million) | 4Q22 | 3Q22 | Δ Q-o-Q | 4Q21 | Δ Y-o-Y | 2022 | 2021 | Δ Y-o-Y | |||||||||
| Adjusted EBITDA | 8,175 | 8,596 | -5 | % | 6,355 | 29 | % | 28,195 | 23,471 | 20 | % | ||||||
| (-) Total Capex1 | (4,088 | ) | (5,527 | ) | -26 | % | (2,219 | ) | 84 | % | (16,919 | ) | (6,243 | ) | 171 | % | |
| (-) Leases contracts – IFRS 16 | (301 | ) | (244 | ) | 23 | % | (314 | ) | -4 | % | (1,044 | ) | (1,012 | ) | 3 | % | |
| (+/-) Δ Working capital | (1,578 | ) | (1,315 | ) | 20 | % | (1,383 | ) | 14 | % | (2,347 | ) | (2,376 | ) | -1 | % | |
| (-) Net interest2 | (404 | ) | (1,381 | ) | -71 | % | (275 | ) | 47 | % | (3,474 | ) | (3,116 | ) | 12 | % | |
| (-) Income taxes | (90 | ) | (122 | ) | -26 | % | (24 | ) | 276 | % | (306 | ) | (106 | ) | 189 | % | |
| (-) Dividend payment/Share Buyback Program | (2,349 | ) | (1,402 | ) | 68 | % | (7 | ) | - | (4,151 | ) | (10 | ) | - | |||
| (+/-) Derivative cash adjustment | 256 | (160 | ) | -260 | % | (266 | ) | -196 | % | 282 | (1,921 | ) | - | ||||
| Free cash flow | (379 | ) | (1,556 | ) | -76 | % | 1,867 | -120 | % | 235 | 8,687 | -97 | % | ||||
| (+) Capex ex-maintenance | 1,731 | 2,885 | -40 | % | 690 | 151 | % | 9,456 | 1,530 | 518 | % | ||||||
| (+) Dividend payment/Share Buyback Program | 2,349 | 1,402 | 68 | % | 7 | - | 4,151 | 10 | - | ||||||||
| Free cash flow - Adjusted | 3,701 | 2,732 | 35 | % | 2,564 | 44 | % | 13,842 | 10,227 | 35 | % |
1Accrual basis, except for the Parkia deal (cash effect of R$1.7 billion in 2Q22, as per the Cash Flow Statement) and excludes the non-cash effect of R$1,832 million related to the Cerrado Project, as per explanatory note 15 of the Financial Statements.
2Considers interest paid on debt, interest received on financial investments and premiums paid resulting from liability management operations.
3Free cash flow prior to dividend payments and capex ex-maintenance (accrual basis).
Page 26 of 40
Adjusted Free Cash Flow in 4Q22 was R$3,701 million, compared to R$2,732 million in 3Q22 and R$2,564 million in 4Q21. The increase of 35% from the previous quarter is mainly due to: (i) few net interest payments (especially on bonds); and (ii) the positive derivative adjustment, as mentioned earlier, as opposed to payments in the previous quarter. These effects were partially offset by the decline in adjusted EBITDA, as discussed earlier, and changes in working capital, in turn explained by the increase in accounts receivable and variation in suppliers (impact of R$ 1,833 million as a non-cash effect in the period referring to Cerrado Project investments, whose impact was reflected in the Cash Flow Statement).
In relation to 4Q21, the increase of 44% was primarily due to: (i) the 29% growth in Adjusted EBITDA; and (ii) the positive derivative adjustment, as opposed to the negative effect in 4Q21. These effects were partially offset mainly by higher sustaining capex (accrual basis) and changes in working capital.
EVOLUTION OF NET DEBT
Following were the changes in net debt in 4Q22:
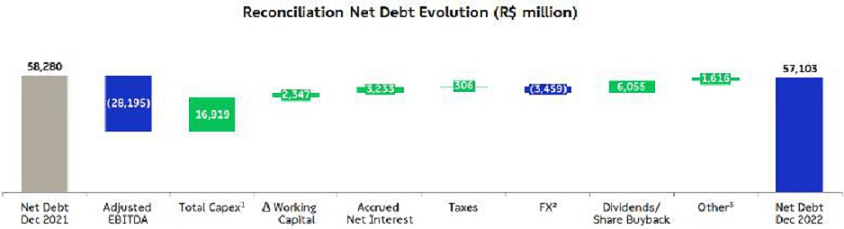
1Accrual basis, except for the Parkia deal (cash effect of R$1.7 billion in 2Q22, as per the Cash Flow Statement).
2Net of exchange variations on cash and financial investments.
3Considers amounts related to derivative adjustments, lease agreements and other items.
ESG
The final quarter of the year was marked by important advances and continuation of Suzano's sustainability agenda.
In November of 2022, Suzano contracted a new credit line (Export Credit Supported Facility) to finance the acquisition of equipment and services for the Cerrado project. This credit facility of up to US$800 million or its equivalent in euros will be financed by Finnish Export Credit (FEC) and guaranteed by Finnvera, the Finnish export credit agency. The transaction has a condition precedent for the release of funds, which is an environmental and social action plan subsequently agreed with IFC (International Finance Corporation) for compliance with the IFC Performance Standards. The Company also contracted a new Sustainability-Linked Loan (SLL) through a new credit facility to finance the Cerrado Project. The US$600 million loan, granted by IFC and a syndicate of commercial banks, has Sustainability Performance Targets (SPTs) associated with: (a) reducing the intensity of greenhouse gas (GHG) emissions; and (b) increasing the percentage of women in leadership positions in the Company.
To influence and actively participate in discussions on the bioeconomy, during the quarter Suzano participated in important events and discussion forums such as COP15 on Biodiversity and COP27 on Climate, when it launched Biomas, a company dedicated to the restoration, conservation and preservation of forests across Brazil, in partnership with Itaú Unibanco, Marfrig, Rabobank, Santander and Vale.
Page 27 of 40
In recognition of its efforts to provide sustainability to its clients, Suzano received the Supplier Sustainability Award from Procter&Gamble. Suzano was the only Latin American company among the six awardees, which were recognized by P&G for their contributions to its core sustainability pillars of climate, waste, water and nature.
Finally, Suzano improved in all ESG indices and ratings during the year: it was once again selected to the DJSI - Emerging Markets Index and B3’s Corporate Sustainability Index (ISE). In the renowned CDP list, the Company joined the Water A-list and retained its high “A-“ score in Climate and Forests. Other ratings in which it improved are Sustainalytics, where it rose to the “Low Risk” category, and MSCI, which upgraded its ESG rating from “B” to “BB”. These achievements reflect the company’s constant pursuit of improvement in performance, communication, transparency and engagement.
TOTAL OPERATIONAL EXPENDITURE – PULP
The total operational disbursement in 2022 was BRL 2,022 per ton, 21% higher than in 2021, mainly due to inflation and higher prices of commodities and inputs. The TOD estimate for 2027 was updated to BRL 1,750 per ton, as detailed in the Material Fact on 02/28/2023.
EVENTS SUBSEQUENT TO THE REPORTING PERIOD
Cancellation of shares held in treasury
On February 28, 2023, the Company resolved to cancel 37,145,969 common shares, which were being held in treasury, without changing the capital stock and against the balances of available profit reserves. After the cancellation of shares, the share capital of R$9,269,281 is now divided into 1,324,117,615 common shares, all registered, book-entry and without par value.
Capital Markets
On December 31, 2022, Suzano’s stock was quoted at R$48.24/share (SUZB3) and US$9.24/share (SUZ). The Company’s stock is listed on the Novo Mercado, the listing segment of the São Paulo Stock Exchange (B3 – Brasil, Bolsa e Balcão) with the highest corporate governance standards, and on the New York Stock Exchange (NYSE) - Level II.
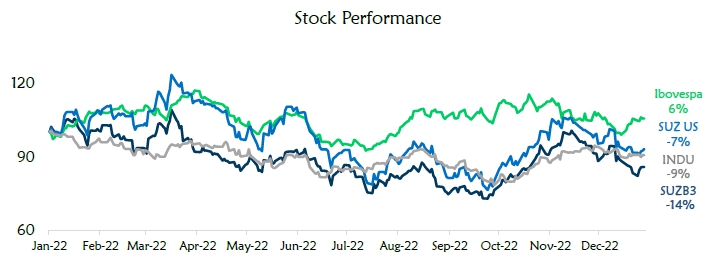
Source: Bloomberg.
Page 28 of 40
Source: Bloomberg.
Suzano’s market capitalization (ex-treasury shares) on December 31, 2022 stood at R$63.2 billion. Free float in 4Q22 corresponded to 50% of total capital.

According to the Material Fact notice disclosed on October 27th, the Board of Directors approved a new share buyback program (“October/22 Program”) by which the Company can repurchase up to 20 million common shares issued by it. The deadline for acquiring shares as part of the new buyback program is 18 months from the date of its approval by the Board of Directors, i.e., April 27, 2024 (inclusive).
Page 29 of 40
Fixed Income
| Unit | Dec/22 | Sep/22 | Dec/21 | Δ Q-o-Q | Δ Y-o-Y | |||||||||||||||||||
| Fibria 2025 - Price | USD/k | 97.39 | 95.72 | 105.23 | 2 | % | -7 | % | ||||||||||||||||
| Fibria 2025 - Yield | % | 5.37 | 6.04 | 2.21 | -11 | % | 143 | % | ||||||||||||||||
| Suzano 2026 - Price | USD/k | 100.41 | 97.18 | 114.31 | 3 | % | -12 | % | ||||||||||||||||
| Suzano 2026 - Yield | % | 5.62 | 6.60 | 2.40 | -15 | % | 135 | % | ||||||||||||||||
| Fibria 2027 - Price | USD/k | 100.62 | 95.88 | 112.26 | 5 | % | -10 | % | ||||||||||||||||
| Fibria 2027 - Yield | % | 5.33 | 6.62 | 2.87 | -20 | % | 86 | % | ||||||||||||||||
| Suzano 2028 - Price | USD/k | 84.08 | 77.75 | 96.81 | 8 | % | -13 | % | ||||||||||||||||
| Suzano 2028 - Yield | % | 5.82 | 7.16 | 3.03 | -19 | % | 92 | % | ||||||||||||||||
| Suzano 2029 - Price | USD/k | 99.61 | 93.06 | 116.01 | 7 | % | -14 | % | ||||||||||||||||
| Suzano 2029 - Yield | % | 6.08 | 7.40 | 3.42 | -18 | % | 78 | % | ||||||||||||||||
| Suzano 2030 - Price | USD/k | 93.94 | 86.29 | 110.07 | 9 | % | -15 | % | ||||||||||||||||
| Suzano 2030 - Yield | % | 6.07 | 7.47 | 3.55 | -19 | % | 71 | % | ||||||||||||||||
| Suzano 2031 - Price | USD/k | 83.87 | 77.99 | 102.00 | 8 | % | -18 | % | ||||||||||||||||
| Suzano 2031 - Yield | % | 6.34 | 7.34 | 3.49 | -14 | % | 82 | % | ||||||||||||||||
| Suzano 2032 - Price | USD/k | 78.28 | 71.54 | 97.14 | 9 | % | -19 | % | ||||||||||||||||
| Suzano 2032 - Yield | % | 6.32 | 7.42 | 3.46 | -15 | % | 82 | % | ||||||||||||||||
| Suzano 2047 - Price | USD/k | 100.50 | 90.06 | 127.06 | 12 | % | -21 | % | ||||||||||||||||
| Suzano 2047 - Yield | % | 6.96 | 7.93 | 5.08 | -12 | % | 37 | % | ||||||||||||||||
| Treasury 10 years | % | 3.88 | 3.83 | 1.51 | 1 | % | 157 | % | ||||||||||||||||
Note: Senior Notes issued with face value of 100 USD/k.
Ratings
| Agency | National Scale | Global Scale | Outlook | |||||
| Fitch Ratings | AAA | BBB- | Stable | |||||
| Standard & Poor’s | br.AAA | BBB- | Stable | |||||
| Moody’s | Aaa.br | Baa3 | Stable |
| UPCOMING EVENTS | ||
| Earnings Conference Call (4Q22) | ||
| Date: March 1, 2023 (Wednesday) | ||
| Portuguese (simultaneous translation) | English | |
| 10:00 a.m. (Brasília) | 10:00 a.m. (Brasília) | |
| 8:00 a.m. (New York) | 8:00 a.m. (New York) | |
| 1:00 p.m. (London) | 1:00 p.m. (London) | |
| Tel.: +55 (11) 4090-1621 | Tel.: +1 844 204 8942 |
Page 30 of 40
Please connect 10 minutes before the conference call is scheduled to begin.
The conference call will be held in English and feature a presentation, with simultaneous webcast. The access links will be available on the Company’s Investor Relations website (www.suzano.com.br/ri).
If you are unable to participate, the webcast link will be available for future consultation on the Investor Relations website of Suzano S.A.
IR CONTACTS
Marcelo Bacci
Camila Nogueira
Roberto Costa
Mariana Dutra
Luísa Puccini
Arthur Trovo
Tel.: +55 (11) 3503-9330
ri@suzano.com.br
www.suzano.com.br/ri
Page 31 of 40

Appendices
APPENDIX 1 - Operating Data
| Revenue Breakdown (R$ '000) | 4Q22 | 3Q22 | Δ Q-o-Q | 4Q21 | Δ Y-o-Y | 2022 | 2021 | Δ Y-o-Y | ||||||||||||||||||||||||
| Exports | 11,950,321 | 11,930,133 | 0 | % | 9,474,662 | 26 | % | 41,306,308 | 34,246,037 | 21 | % | |||||||||||||||||||||
| Pulp | 11,246,458 | 11,222,662 | 0 | % | 8,907,877 | 26 | % | 38,718,576 | 32,376,399 | 20 | % | |||||||||||||||||||||
| Paper | 703,863 | 707,471 | -1 | % | 566,785 | 24 | % | 2,587,732 | 1,869,638 | 38 | % | |||||||||||||||||||||
| Domestic Market | 2,419,386 | 2,268,616 | 7 | % | 1,995,309 | 21 | % | 8,524,638 | 6,719,394 | 27 | % | |||||||||||||||||||||
| Pulp | 728,455 | 690,326 | 6 | % | 668,082 | 9 | % | 2,665,746 | 2,338,809 | 14 | % | |||||||||||||||||||||
| Paper | 1,690,931 | 1,578,290 | 7 | % | 1,327,227 | 27 | % | 5,858,892 | 4,380,585 | 34 | % | |||||||||||||||||||||
| Total Net Revenue | 14,369,707 | 14,198,749 | 1 | % | 11,469,971 | 25 | % | 49,830,946 | 40,965,431 | 22 | % | |||||||||||||||||||||
| Pulp | 11,974,913 | 11,912,988 | 1 | % | 9,575,959 | 25 | % | 41,384,322 | 34,715,208 | 19 | % | |||||||||||||||||||||
| Paper | 2,394,794 | 2,285,761 | 5 | % | 1,894,012 | 26 | % | 8,446,624 | 6,250,223 | 35 | % | |||||||||||||||||||||
| Sales volume (‘000) | 4Q22 | 3Q22 | Δ Q-o-Q | 4Q21 | Δ Y-o-Y | 2022 | 2021 | Δ Y-o-Y | ||||||||||||||||||||||||
| Exports | 2,655,960 | 2,693,404 | -1 | % | 2,627,747 | 1 | % | 10,203,229 | 10,160,467 | 0 | % | |||||||||||||||||||||
| Pulp | 2,575,778 | 2,605,408 | -1 | % | 2,531,366 | 2 | % | 9,848,441 | 9,789,129 | 1 | % | |||||||||||||||||||||
| Paper | 80,182 | 87,996 | -9 | % | 96,381 | -17 | % | 354,788 | 371,338 | -4 | % | |||||||||||||||||||||
| Paperboard | 6,059 | 8,339 | -27 | % | 8,350 | -27 | % | 31,653 | 34,935 | -9 | % | |||||||||||||||||||||
| Printing & Writing | 73,599 | 79,246 | -7 | % | 87,319 | -16 | % | 321,148 | 328,436 | -2 | % | |||||||||||||||||||||
| Other paper1 | 524 | 411 | 27 | % | 712 | -26 | % | 1,987 | 7,967 | -75 | % | |||||||||||||||||||||
| Domestic Market | 441,372 | 434,256 | 2 | % | 465,396 | -5 | % | 1,702,488 | 1,719,617 | -1 | % | |||||||||||||||||||||
| Pulp | 183,251 | 191,210 | -4 | % | 191,054 | -4 | % | 751,212 | 796,708 | -6 | % | |||||||||||||||||||||
| Paper | 258,121 | 243,046 | 6 | % | 274,342 | -6 | % | 951,276 | 922,909 | 3 | % | |||||||||||||||||||||
| Paperboard | 39,443 | 41,303 | -5 | % | 39,917 | -1 | % | 159,993 | 163,621 | -2 | % | |||||||||||||||||||||
| Printing & Writing | 180,139 | 165,825 | 9 | % | 199,978 | -10 | % | 649,039 | 637,761 | 2 | % | |||||||||||||||||||||
| Other paper1 | 38,539 | 35,918 | 7 | % | 34,447 | 12 | % | 142,244 | 121,527 | 17 | % | |||||||||||||||||||||
| Total Sales Volume | 3,097,332 | 3,127,660 | -1 | % | 3,093,143 | 0 | % | 11,905,717 | 11,880,084 | 0 | % | |||||||||||||||||||||
| Pulp | 2,759,029 | 2,796,618 | -1 | % | 2,722,420 | 1 | % | 10,599,653 | 10,585,837 | 0 | % | |||||||||||||||||||||
| Paper | 338,303 | 331,042 | 2 | % | 370,723 | -9 | % | 1,306,064 | 1,294,247 | 1 | % | |||||||||||||||||||||
| Paperboard | 45,502 | 49,642 | -8 | % | 48,267 | -6 | % | 191,646 | 198,556 | -3 | % | |||||||||||||||||||||
| Printing & Writing | 253,738 | 245,071 | 4 | % | 287,297 | -12 | % | 970,187 | 966,197 | 0 | % | |||||||||||||||||||||
| Other paper1 | 39,063 | 36,329 | 8 | % | 35,159 | 11 | % | 144,231 | 129,494 | 11 | % | |||||||||||||||||||||
1Paper of other manufacturers sold by Suzano and tissue paper.
Page 32 of 40
| Average net price (R$/ton) | 4Q22 | 3Q22 | Δ Q-o-Q | 4Q21 | Δ Y-o-Y | 2022 | 2021 | Δ Y-o-Y | ||||||||||||||||||||||||
| Exports | 4,499 | 4,429 | 2 | % | 3,606 | 25 | % | 4,048 | 3,371 | 20 | % | |||||||||||||||||||||
| Pulp | 4,366 | 4,307 | 1 | % | 3,519 | 24 | % | 3,931 | 3,307 | 19 | % | |||||||||||||||||||||
| Paper | 8,778 | 8,040 | 9 | % | 5,881 | 49 | % | 7,294 | 5,035 | 45 | % | |||||||||||||||||||||
| Domestic Market | 5,482 | 5,224 | 5 | % | 4,287 | 28 | % | 5,007 | 3,907 | 28 | % | |||||||||||||||||||||
| Pulp | 3,975 | 3,610 | 10 | % | 3,497 | 14 | % | 3,549 | 2,936 | 21 | % | |||||||||||||||||||||
| Paper | 6,551 | 6,494 | 1 | % | 4,838 | 35 | % | 6,159 | 4,746 | 30 | % | |||||||||||||||||||||
| Total | 4,639 | 4,540 | 2 | % | 3,708 | 25 | % | 4,185 | 3,448 | 21 | % | |||||||||||||||||||||
| Pulp | 4,340 | 4,260 | 2 | % | 3,517 | 23 | % | 3,904 | 3,279 | 19 | % | |||||||||||||||||||||
| Paper | 7,079 | 6,905 | 3 | % | 5,109 | 39 | % | 6,467 | 4,829 | 34 | % | |||||||||||||||||||||
| Average net price (US$/ton) | 4Q22 | 3Q22 | Δ Q-o-Q | 4Q21 | Δ Y-o-Y | 2022 | 2021 | Δ Y-o-Y | ||||||||||||||||||||||||
| Exports | 856 | 844 | 1 | % | 646 | 33 | % | 784 | 625 | 25 | % | |||||||||||||||||||||
| Pulp | 831 | 821 | 1 | % | 630 | 32 | % | 761 | 613 | 24 | % | |||||||||||||||||||||
| Paper | 1,670 | 1,533 | 9 | % | 1,053 | 59 | % | 1,412 | 933 | 51 | % | |||||||||||||||||||||
| Domestic Market | 1,043 | 996 | 5 | % | 768 | 36 | % | 969 | 724 | 34 | % | |||||||||||||||||||||
| Pulp | 756 | 688 | 10 | % | 626 | 21 | % | 687 | 544 | 26 | % | |||||||||||||||||||||
| Paper | 1,247 | 1,238 | 1 | % | 867 | 44 | % | 1,192 | 880 | 35 | % | |||||||||||||||||||||
| Total | 883 | 865 | 2 | % | 664 | 33 | % | 810 | 639 | 27 | % | |||||||||||||||||||||
| Pulp | 826 | 812 | 2 | % | 630 | 31 | % | 756 | 608 | 24 | % | |||||||||||||||||||||
| Paper | 1,347 | 1,316 | 2 | % | 915 | 47 | % | 1,252 | 895 | 40 | % | |||||||||||||||||||||
1Paper of other manufacturers sold by Suzano and tissue paper.
| FX Rate R$/US$ | 4Q22 | 3Q22 | Δ Q-o-Q | 4Q21 | Δ Y-o-Y | 2022 | 2021 | Δ Y-o-Y | ||||||||||||||||||||||||
| Closing | 5.22 | 5.41 | -3 | % | 5.58 | -7 | % | 5.22 | 5.58 | -7 | % | |||||||||||||||||||||
| Average | 5.26 | 5.25 | 0 | % | 5.58 | -6 | % | 5.17 | 5.40 | -4 | % | |||||||||||||||||||||
Page 33 of 40
APPENDIX 2 - Consolidated Statement of Income and Goodwill Amortization
| Income Statement (R$ ‘000) | 4Q22 | 3Q22 | Δ Q-o-Q | 4Q21 | Δ Y-o-Y | 2022 | 2021 | Δ Y-o-Y | ||||||||||||||||||||||||
| Net Revenue | 14,369,707 | 14,198,749 | 1 | % | 11,469,971 | 25 | % | 49,830,946 | 40,965,431 | 22 | % | |||||||||||||||||||||
| Cost of Goods Sold | (6,792,853 | ) | (6,472,670 | ) | 5 | % | (5,692,988 | ) | 19 | % | (24,821,288 | ) | (20,615,588 | ) | 20 | % | ||||||||||||||||
| Gross Debt | 7,576,854 | 7,726,079 | -2 | % | 5,776,983 | 31 | % | 25,009,658 | 20,349,843 | 23 | % | |||||||||||||||||||||
| Gross Margin | 53 | % | 54 | % | -1 p.p. | 50 | % | 3 p.p. | 50 | % | 50 | % | 0 p.p. | |||||||||||||||||||
| Operating Expense/Income | (277,969 | ) | (778,701 | ) | -64 | % | (1,022,752 | ) | -73 | % | (2,786,877 | ) | (2,169,652 | ) | 28 | % | ||||||||||||||||
| Selling Expenses | (660,372 | ) | (625,114 | ) | 6 | % | (634,921 | ) | 4 | % | (2,483,194 | ) | (2,291,722 | ) | 8 | % | ||||||||||||||||
| General and Administrative Expenses | (615,872 | ) | (392,663 | ) | 57 | % | (522,761 | ) | 18 | % | (1,709,767 | ) | (1,577,909 | ) | 8 | % | ||||||||||||||||
| Other Operating Income (Expenses) | 980,852 | (18,562 | ) | - | 202,841 | 384 | % | 1,121,716 | 1,648,067 | -32 | % | |||||||||||||||||||||
| Equity Equivalence | 17,423 | 257,638 | -93 | % | (67,911 | ) | - | 284,368 | 51,912 | 448 | % | |||||||||||||||||||||
| EBIT | 7,298,885 | 6,947,378 | 5 | % | 4,754,231 | 54 | % | 22,222,781 | 18,180,191 | 22 | % | |||||||||||||||||||||
| Depreciation, Amortization & Depletion | 1,910,259 | 1,902,668 | 0 | % | 1,832,940 | 4 | % | 7,407,890 | 7,041,663 | 5 | % | |||||||||||||||||||||
| EBITDA | 9,209,144 | 8,850,046 | 4 | % | 6,587,171 | 40 | % | 29,630,671 | 25,221,854 | 17 | % | |||||||||||||||||||||
| EBITDA Margin (%) | 64 | % | 62 | % | 2 p.p. | 57 | % | 7 p.p. | 59 | % | 62 | % | -3 p.p. | |||||||||||||||||||
| - | ||||||||||||||||||||||||||||||||
| Adjusted EBITDA1 | 8,175,098 | 8,595,987 | -5 | % | 6,355,317 | 29 | % | 28,194,902 | 23,470,923 | 20 | % | |||||||||||||||||||||
| Adjusted EBITDA Margin1 | 57 | % | 61 | % | -4 p.p. | 55 | % | 2 p.p. | 57 | % | 57 | % | 0 p.p. | |||||||||||||||||||
| Net Financial Result | 1,999,957 | (1,527,776 | ) | - | (2,657,320 | ) | - | 6,432,800 | (9,347,234 | ) | - | |||||||||||||||||||||
| Financial Expenses | 344,938 | 269,505 | 28 | % | 147,622 | 134 | % | 967,010 | 272,556 | 255 | % | |||||||||||||||||||||
| Financial Revenues | (1,190,425 | ) | (1,216,422 | ) | -2 | % | (1,085,450 | ) | 10 | % | (4,590,370 | ) | (4,221,301 | ) | 9 | % | ||||||||||||||||
| Exchange Rate Variation | 1,594,391 | (1,470,487 | ) | - | (1,412,237 | ) | - | 3,294,593 | (3,800,827 | ) | - | |||||||||||||||||||||
| Net Proceeds Generated by Derivatives | 1,251,053 | 889,628 | 41 | % | (307,255 | ) | - | 6,761,567 | (1,597,662 | ) | - | |||||||||||||||||||||
| Earnings Before Taxes | 9,298,842 | 5,419,602 | 72 | % | 2,096,911 | 343 | % | 28,655,581 | 8,832,957 | 224 | % | |||||||||||||||||||||
| Income and Social Contribution Taxes | (1,839,952 | ) | 28,496 | - | 216,556 | - | (5,260,694 | ) | (197,425 | ) | - | |||||||||||||||||||||
| Net Income (Loss) | 7,458,890 | 5,448,098 | 37 | % | 2,313,467 | 222 | % | 23,394,887 | 8,635,532 | 171 | % | |||||||||||||||||||||
| Net Margin | 52 | % | 38 | % | 14 p.p. | 20 | % | 32 p.p. | 47 | % | 21 | % | 26 p.p. | |||||||||||||||||||
1Excluding non-recurring items and PPA effects.
| Goodwill amortization - PPA (R$ ‘000) | 4Q22 | 3Q22 | Δ Q-o-Q | 4Q21 | Δ Y-o-Y | |||||||||||||||
| COGS | (113,657 | ) | (140,861 | ) | -19 | % | (144,122 | ) | -21 | % | ||||||||||
| Selling Expenses | (207,740 | ) | (207,740 | ) | 0 | % | (207,925 | ) | 0 | % | ||||||||||
| General and administrative expenses | (2,625 | ) | (2,625 | ) | 0 | % | (2,732 | ) | -4 | % | ||||||||||
| Other operational revenues (expenses) | (2,161 | ) | (16,837 | ) | -87 | % | (50,207 | ) | -96 | % | ||||||||||
| Financial results | (4,722 | ) | (4,722 | ) | 0 | % | (4,722 | ) | 0 | % | ||||||||||
Page 34 of 40
APPENDIX 3 - Consolidated Balance Sheet
| Assets (R$ ’000) | 12/31/2022 | 09/30/2022 | 12/31/2021 | |||||||||
| Current Assets | ||||||||||||
| Cash and cash equivalents | 9,505,951 | 6,958,161 | 13,590,776 | |||||||||
| Financial investments | 7,546,639 | 10,907,907 | 7,508,275 | |||||||||
| Trade accounts receivable | 9,607,012 | 8,664,852 | 6,531,465 | |||||||||
| Inventories | 5,728,261 | 5,942,174 | 4,637,485 | |||||||||
| Recoverable taxes | 549,580 | 502,163 | 360,725 | |||||||||
| Derivative financial instruments | 3,048,493 | 2,308,110 | 470,261 | |||||||||
| Advance to suppliers | 108,146 | 58,771 | 59,564 | |||||||||
| Dividend’s receivable | 7,334 | 6,604 | ||||||||||
| Other assets | 1,021,234 | 876,603 | 937,786 | |||||||||
| Total Current Assets | 37,122,650 | 36,218,741 | 34,102,941 | |||||||||
| Non-Current Assets | ||||||||||||
| Financial investments | 419,103 | 405,956 | 250,054 | |||||||||
| Recoverable taxes | 1,406,363 | 1,401,316 | 1,269,164 | |||||||||
| Deferred taxes | 3,986,415 | 5,637,742 | 8,729,929 | |||||||||
| Derivative financial instruments | 1,825,256 | 1,680,712 | 971,879 | |||||||||
| Advance to suppliers | 1,592,132 | 1,487,207 | 1,282,763 | |||||||||
| Judicial deposits | 362,561 | 364,093 | 300,715 | |||||||||
| Other assets | 279,955 | 279,075 | 296,844 | |||||||||
| Biological assets | 14,632,186 | 13,066,433 | 12,248,732 | |||||||||
| Investments | 612,516 | 558,111 | 524,066 | |||||||||
| Property, plant and equipment | 50,656,634 | 47,012,355 | 38,169,703 | |||||||||
| Right of use on lease agreements | 5,109,226 | 5,105,422 | 4,794,023 | |||||||||
| Intangible | 15,192,971 | 15,397,201 | 16,034,339 | |||||||||
| Total Non-Current Assets | 96,075,318 | 92,395,623 | 84,872,211 | |||||||||
| Total Assets | 133,197,968 | 128,614,364 | 118,975,152 | |||||||||
| Liabilities and Equity (R$ ´000) | 12/31/2022 | 09/30/2022 | 12/31/2021 | |||||||||
| Current Liabilities | ||||||||||||
| Trade accounts payable | 6,206,570 | 5,272,119 | 3,288,897 | |||||||||
| Loans, financing and debentures | 3,335,029 | 2,850,556 | 3,655,537 | |||||||||
| Accounts payable for lease operations | 672,174 | 654,133 | 623,282 | |||||||||
| Derivative financial instruments | 667,681 | 750,396 | 1,563,459 | |||||||||
| Taxes payable | 449,122 | 420,897 | 339,553 | |||||||||
| Payroll and charges | 674,525 | 647,541 | 590,529 | |||||||||
| Liabilities for assets acquisitions and subsidiaries | 1,856,763 | 1,919,150 | 99,040 | |||||||||
| Dividends payable | 5,094 | 1,923 | 919,073 | |||||||||
| Advance from customers | 131,355 | 112,915 | 103,656 | |||||||||
| Other liabilities | 494,230 | 273,990 | 368,198 | |||||||||
| Total Current Liabilities | 14,492,543 | 12,903,620 | 11,551,224 | |||||||||
| Non-Current Liabilities | ||||||||||||
| Loans, financing and debentures | 71,239,562 | 73,209,230 | 75,973,092 | |||||||||
| Accounts payable for lease operations | 5,510,356 | 5,595,755 | 5,269,912 | |||||||||
| Derivative financial instruments | 4,179,114 | 4,206,646 | 6,331,069 | |||||||||
| Liabilities for assets acquisitions and subsidiaries | 205,559 | 210,510 | 306,912 | |||||||||
| Provision for judicial liabilities | 3,256,310 | 3,317,720 | 3,232,612 | |||||||||
| Actuarial liabilities | 691,424 | 676,699 | 675,158 | |||||||||
| Deferred taxes | 1,118 | 1,118 | - | |||||||||
| Share-based compensation plans | 162,117 | 149,700 | 166,998 | |||||||||
| Advance from customers | 136,161 | 136,161 | 149,540 | |||||||||
| Other liabilities | 157,339 | 149,004 | 143,505 | |||||||||
| Total Non-Current Liabilities | 85,539,060 | 87,652,543 | 92,248,798 | |||||||||
| Shareholders’ Equity | ||||||||||||
| Share capital | 9,235,546 | 9,235,546 | 9,235,546 | |||||||||
| Capital reserves | 18,425 | 17,091 | 15,455 | |||||||||
| Treasury shares | (2,120,324 | ) | (2,120,324 | ) | (218,265 | ) | ||||||
| Retained earnings reserves | 24,207,869 | 3,040,935 | 3,927,824 | |||||||||
| Other reserves | 1,719,516 | 1,766,711 | 2,114,907 | |||||||||
| Retained earnings | - | 16,011,694 | - | |||||||||
| Controlling shareholders’ | 33,061,032 | 27,951,653 | 15,075,467 | |||||||||
| Non-controlling interest | 105,333 | 106,548 | 99,663 | |||||||||
| Total Equity | 33,166,365 | 28,058,201 | 15,175,130 | |||||||||
| Total Liabilities and Equity | 133,197,968 | 128,614,364 | 118,975,152 | |||||||||
Page 35 of 40
APPENDIX 4 - Consolidated Statement of Cash Flow
| Cash Flow (R$ ’000) | 4Q22 | 4Q21 | 2022 | 2021 | ||||||||||||
| Cash flow from operating activities | ||||||||||||||||
| Net income/(loss) for the period | 7,458,890 | 2,313,467 | 23,394,887 | 8,635,532 | ||||||||||||
| Depreciation, depletion and amortization | 1,853,927 | 1,797,814 | 7,206,125 | 6,879,132 | ||||||||||||
| Depreciation of right of use | 61,056 | 52,356 | 231,966 | 203,670 | ||||||||||||
| Sublease of ships | - | (12,508 | ) | (11,314 | ) | (44,706 | ) | |||||||||
| Interest expense on lease liabilities | 112,247 | 110,084 | 433,613 | 427,934 | ||||||||||||
| Result from sale and disposal of property, plant and equipment and biological assets, net | 27,136 | 79,772 | 509 | (412,612 | ) | |||||||||||
| Income (expense) from associates and joint ventures | (17,423 | ) | 67,911 | (284,368 | ) | (51,912 | ) | |||||||||
| Exchange rate and monetary variations, net | (1,594,391 | ) | 1,412,237 | (3,294,593 | ) | 3,800,827 | ||||||||||
| Interest expenses on financing, loans and debentures, net | 1,105,200 | 914,766 | 4,007,737 | 3,207,278 | ||||||||||||
| Expenses with early settlements premium | - | - | - | 260,289 | ||||||||||||
| Capitalized loan costs | (152,963 | ) | (13,564 | ) | (359,407 | ) | (18,624 | ) | ||||||||
| Accrual of interest on marketable securities | (219,321 | ) | (102,912 | ) | (707,211 | ) | (178,320 | ) | ||||||||
| Amortization of transaction costs | 16,474 | 16,969 | 69,881 | 107,239 | ||||||||||||
| Derivative losses, net | (1,251,053 | ) | 307,255 | (6,761,567 | ) | 1,597,662 | ||||||||||
| Fair value adjustment of biological assets | (1,028,141 | ) | (198,558 | ) | (1,199,759 | ) | (763,091 | ) | ||||||||
| Deferred income tax and social contribution | 1,655,730 | (265,148 | ) | 4,749,798 | (94,690 | ) | ||||||||||
| Interest on actuarial liabilities | 14,815 | 13,963 | 59,258 | 55,849 | ||||||||||||
| Provision for judicial liabilities, net | (13,519 | ) | 7,685 | 88,198 | 65,318 | |||||||||||
| (Reversal of) provision for doubtful accounts, net | (979 | ) | (6,322 | ) | 1,652 | (637 | ) | |||||||||
| Provision for inventory losses, net | 41,915 | 41,019 | 56,060 | 73,574 | ||||||||||||
| Provision (reversal) for loss of ICMS credits, net | (4,004 | ) | (130,605 | ) | 58,003 | (99,183 | ) | |||||||||
| Tax credits | - | (72,915 | ) | 1,324 | (441,880 | ) | ||||||||||
| Other | (5,074 | ) | 6,527 | 2,794 | 26,449 | |||||||||||
| Decrease (increase) in assets | (1,147,911 | ) | (1,835,066 | ) | (4,352,734 | ) | (3,916,667 | ) | ||||||||
| Trade accounts receivable | (1,192,715 | ) | (1,873,041 | ) | (3,267,356 | ) | (3,393,787 | ) | ||||||||
| Inventories | 124,806 | 1,980 | (967,995 | ) | (654,757 | ) | ||||||||||
| Recoverable taxes | (39,397 | ) | 224,013 | (381,408 | ) | 186,013 | ||||||||||
| Other assets | (40,605 | ) | (188,018 | ) | 264,025 | (54,136 | ) | |||||||||
| Increase (decrease) in liabilities | (430,328 | ) | 451,972 | 2,030,444 | 1,540,994 | |||||||||||
| Trade accounts payable | (817,018 | ) | 446,195 | 1,533,118 | 1,363,478 | |||||||||||
| Taxes payable | 136,100 | 15,616 | 422,591 | 271,700 | ||||||||||||
| Payroll and charges | 26,984 | 40,580 | 83,742 | 97,792 | ||||||||||||
| Other liabilities | 223,606 | (50,419 | ) | (9,007 | ) | (191,976 | ) | |||||||||
| Cash provided by operations, net | 6,482,283 | 4,956,199 | 25,421,296 | 20,859,425 | ||||||||||||
| Payment of interest on financing, loans and debentures | (600,035 | ) | (319,897 | ) | (4,019,072 | ) | (2,953,573 | ) | ||||||||
| Payment of early settlement premiums | - | - | - | (260,289 | ) | |||||||||||
| Interest received on marketable securities | 196,313 | 44,771 | 544,849 | 98,110 | ||||||||||||
| Payment of income taxes | (90,389 | ) | (24,024 | ) | (306,453 | ) | (106,180 | ) | ||||||||
| Cash provided by operating activities | 5,988,172 | 4,657,049 | 21,640,620 | 17,637,493 | ||||||||||||
| Investing activities | ||||||||||||||||
| Additions to property, plant and equipment | (2,644,002 | ) | (966,366 | ) | (9,791,238 | ) | (2,150,584 | ) | ||||||||
| Additions to intangible | (9,848 | ) | (69,733 | ) | (90,499 | ) | (285,278 | ) | ||||||||
| Additions to biological assets | (1,434,505 | ) | (1,182,650 | ) | (4,957,380 | ) | (3,807,608 | ) | ||||||||
| Proceeds from sales of property, plant and equipment | 85,126 | 105,460 | 251,183 | 1,411,251 | ||||||||||||
| Capital increase in subsidiaries and affiliates | (34,876 | ) | - | (67,020 | ) | (51,816 | ) | |||||||||
| Marketable securities, net | 3,163,941 | (2,202,358 | ) | 67,426 | (5,216,921 | ) | ||||||||||
| Advances for acquisition (receipt) of wood from operations with development and partnerships | (123,726 | ) | (64,338 | ) | (355,362 | ) | (257,672 | ) | ||||||||
| Dividends received | - | - | 6,604 | 6,453 | ||||||||||||
| Asset acquisitions | - | - | (2,090,062 | ) | - | |||||||||||
| Cash and cash equivalents from asset acquisitions | - | - | 10,590 | - | ||||||||||||
| Acquisitions of non-controlling interests | - | - | - | (6,516 | ) | |||||||||||
| Cash used in investing activities, net | (997,890 | ) | (4,379,985 | ) | (17,015,758 | ) | (10,358,691 | ) | ||||||||
| Financing activities | ||||||||||||||||
| Proceeds from loans, financing and debentures | 994,234 | 203,282 | 1,335,715 | 16,991,962 | ||||||||||||
| Payment of derivative transactions | 255,879 | (265,997 | ) | 282,225 | (1,921,253 | ) | ||||||||||
| Payment of loans, financing and debentures | (843,949 | ) | (61,495 | ) | (2,517,934 | ) | (15,469,423 | ) | ||||||||
| Payment of leases | (300,500 | ) | (314,435 | ) | (1,044,119 | ) | (1,012,137 | ) | ||||||||
| Payment of dividends | (2,349,203 | ) | (7,361 | ) | (4,150,782 | ) | (9,683 | ) | ||||||||
| Liabilities for assets acquisitions and associates | (368 | ) | (2,622 | ) | (107,888 | ) | (153,357 | ) | ||||||||
| Shares repurchased | - | - | (1,904,424 | ) | - | |||||||||||
| Cash provided (used) by financing activities, net | (2,243,907 | ) | (448,628 | ) | (8,107,207 | ) | (1,573,891 | ) | ||||||||
| Exchange variation on cash and cash equivalents | (198,585 | ) | 300,373 | (602,480 | ) | 1,050,808 | ||||||||||
| Increase (reduction) in cash and cash equivalents, net | 2,547,790 | 128,809 | (4,084,825 | ) | 6,755,719 | |||||||||||
| Cash and cash equivalents at the beginning for the period | 6,958,161 | 13,461,967 | 13,590,776 | 6,835,057 | ||||||||||||
| Cash and cash equivalents at the end for the period | 9,505,951 | 13,590,776 | 9,505,951 | 13,590,776 | ||||||||||||
| Increase (reduction) in cash and cash equivalents, net | 2,547,790 | 128,809 | (4,084,825 | ) | 6,755,719 | |||||||||||
Page 36 of 40
APPENDIX 5 - EBITDA
| (R$ '000, except where otherwise indicated) | 4Q22 | 4Q21 | 2022 | 2021 | ||||||||||||
| Net income | 7,458,890 | 2,313,467 | 23,394,887 | 8,635,532 | ||||||||||||
| Net Financial Result | (1,999,957 | ) | 2,657,320 | (6,432,800 | ) | 9,347,234 | ||||||||||
| Income and Social Contribution Taxes | 1,839,952 | (216,556 | ) | 5,260,694 | 197,425 | |||||||||||
| EBIT | 7,298,885 | 4,754,231 | 22,222,781 | 18,180,191 | ||||||||||||
| Depreciation, Amortization and Depletion | 1,910,259 | 1,832,940 | 7,407,890 | 7,041,663 | ||||||||||||
| EBITDA1 | 9,209,144 | 6,587,171 | 29,630,671 | 25,221,854 | ||||||||||||
| Margem EBITDA | 64 | % | 57 | % | 59 | % | 62 | % | ||||||||
| Social actions and operating expenses COVID-19 | - | 1,376 | 178 | 25,285 | ||||||||||||
| Fair Value Update - Biological Asset | (1,028,141 | ) | (198,558 | ) | (1,199,759 | ) | (763,091 | ) | ||||||||
| Ibema's goodwill write-off | - | - | - | 125 | ||||||||||||
| Write-off of Futuragene's intangibles | - | 57,901 | - | 57,901 | ||||||||||||
| Tax credits - Exclusion of ICMS in the PIS and COFINS calculation base | - | (72,915 | ) | 1,324 | (441,880 | ) | ||||||||||
| Equity | (17,423 | ) | 67,911 | (284,368 | ) | (51,912 | ) | |||||||||
| Extension of the PCHM concession | (7,711 | ) | - | (7,711 | ) | - | ||||||||||
| Fines and contract terminations | 16,000 | - | 16,000 | - | ||||||||||||
| Effective loss of the development contract advance program | - | - | - | 2,702 | ||||||||||||
| Provision - Civil Contingency | - | 32,763 | - | 32,763 | ||||||||||||
| Provision (Reversal of) - Loss of ICMS credit | (16,978 | ) | (130,605 | ) | 58,003 | (98,683 | ) | |||||||||
| Reversal - Provision for Development (Lozenge Project) | - | - | - | (9,138 | ) | |||||||||||
| Income from disposal and write-off of property, plant and equipment and biological assets | 20,207 | 10,273 | (19,436 | ) | (505,003 | ) | ||||||||||
| Adjusted EBITDA | 8,175,098 | 6,355,317 | 28,194,902 | 23,470,923 | ||||||||||||
| Adjusted EBITDA Margin | 57 | % | 55 | % | 57 | % | 57 | % |
1The Company's EBITDA is calculated in accordance with CVM Instruction 527 of October 4, 2012.
Page 37 of 40
APPENDIX 6 - Segmented Income Statement
4Q22 | 4Q21 | |||||||||||||||||||||||||||||||
| Segmented Financial Statement (R$ '000) | Pulp | Paper | Non Segmented | Total Consolidated | Pulp | Paper | Non Segmented | Total Consolidated | ||||||||||||||||||||||||
| Net Revenue | 11,974,913 | 2,394,794 | - | 14,369,707 | 9,575,959 | 1,894,012 | - | 11,469,971 | ||||||||||||||||||||||||
| Cost of Goods Sold | (5,497,058 | ) | (1,295,795 | ) | - | (6,792,853 | ) | (4,527,352 | ) | (1,165,636 | ) | - | (5,692,988 | ) | ||||||||||||||||||
| Gross Profit | 6,477,855 | 1,098,999 | - | 7,576,854 | 5,048,607 | 728,376 | - | 5,776,983 | ||||||||||||||||||||||||
| Gross Margin | 54 | % | 46 | % | - | 53 | % | 53 | % | 39 | % | - | 50 | % | ||||||||||||||||||
| Operating Expense/Income | (182,770 | ) | (95,199 | ) | - | (277,969 | ) | (777,257 | ) | (245,495 | ) | - | (1,022,752 | ) | ||||||||||||||||||
| Selling Expenses | (483,324 | ) | (177,048 | ) | - | (660,372 | ) | (480,120 | ) | (154,801 | ) | - | (634,921 | ) | ||||||||||||||||||
| General and Administrative Expenses | (431,950 | ) | (183,922 | ) | - | (615,872 | ) | (368,906 | ) | (153,855 | ) | - | (522,761 | ) | ||||||||||||||||||
| Other Operating Income (Expenses) | 735,712 | 245,140 | - | 980,852 | 152,270 | 50,571 | - | 202,841 | ||||||||||||||||||||||||
| Equity Equivalence | (3,208 | ) | 20,631 | - | 17,423 | (80,501 | ) | 12,590 | - | (67,911 | ) | |||||||||||||||||||||
| EBIT | 6,295,085 | 1,003,800 | - | 7,298,885 | 4,271,350 | 482,881 | - | 4,754,231 | ||||||||||||||||||||||||
| Depreciation, Amortization & Depletion | 1,744,893 | 165,366 | - | 1,910,259 | 1,665,820 | 167,120 | - | 1,832,940 | ||||||||||||||||||||||||
| EBITDA | 8,039,978 | 1,169,166 | - | 9,209,144 | 5,937,170 | 650,001 | - | 6,587,171 | ||||||||||||||||||||||||
| EBITDA Margin | 67 | % | 49 | % | - | 64 | % | 62 | % | 34 | % | - | 57 | % | ||||||||||||||||||
| Adjusted EBITDA1 | 7,273,957 | 901,141 | - | 8,175,098 | 5,755,019 | 600,298 | - | 6,355,317 | ||||||||||||||||||||||||
| Adjusted EBITDA Margin1 | 61 | % | 38 | % | - | 57 | % | 60 | % | 32 | % | - | 55 | % | ||||||||||||||||||
| Net Financial Result | - | - | 1,999,957 | 1,999,957 | - | - | (2,657,320 | ) | (2,657,320 | ) | ||||||||||||||||||||||
| Earnings Before Taxes | 6,295,085 | 1,003,800 | 1,999,957 | 9,298,842 | 4,271,350 | 482,881 | (2,657,320 | ) | 2,096,911 | |||||||||||||||||||||||
| Income and Social Contribution Taxes | - | - | (1,839,952 | ) | (1,839,952 | ) | - | - | 216,556 | 216,556 | ||||||||||||||||||||||
| Net Income (Loss) | 6,295,085 | 1,003,800 | 160,005 | 7,458,890 | 4,271,350 | 482,881 | (2,440,764 | ) | 2,313,467 | |||||||||||||||||||||||
| Net Margin | 53 | % | 42 | % | - | 52 | % | 45 | % | 25 | % | - | 20 | % | ||||||||||||||||||
1Excluding non-recurring items and PPA effects..
Page 38 of 40
APPENDIX 6 - Segmented Income Statement
2022 | 2021 | |||||||||||||||||||||||||||||||
| Segmented Financial Statement (R$ '000) | Pulp | Paper | Non Segmented | Total Consolidated | Pulp | Paper | Non Segmented | Total Consolidated | ||||||||||||||||||||||||
| Net Revenue | 41,384,322 | 8,446,624 | - | 49,830,946 | 34,715,208 | 6,250,223 | - | 40,965,431 | ||||||||||||||||||||||||
| Cost of Goods Sold | (19,958,000 | ) | (4,863,288 | ) | - | (24,821,288 | ) | (16,727,390 | ) | (3,888,198 | ) | - | (20,615,588 | ) | ||||||||||||||||||
| Gross Profit | 21,426,322 | 3,583,336 | - | 25,009,658 | 17,987,818 | 2,362,025 | - | 20,349,843 | ||||||||||||||||||||||||
| Gross Margin | 52 | % | 42 | % | - | 50 | % | 52 | % | 38 | % | - | 50 | % | ||||||||||||||||||
| Operating Expense/Income | (2,065,877 | ) | (721,000 | ) | - | (2,786,877 | ) | (1,690,241 | ) | (479,411 | ) | - | (2,169,652 | ) | ||||||||||||||||||
| Selling Expenses | (1,858,371 | ) | (624,823 | ) | - | (2,483,194 | ) | (1,782,840 | ) | (508,882 | ) | - | (2,291,722 | ) | ||||||||||||||||||
| General and Administrative Expenses | (1,211,539 | ) | (498,228 | ) | - | (1,709,767 | ) | (1,129,597 | ) | (448,312 | ) | - | (1,577,909 | ) | ||||||||||||||||||
| Other Operating Income (Expenses) | 768,556 | 353,160 | - | 1,121,716 | 1,223,024 | 425,043 | - | 1,648,067 | ||||||||||||||||||||||||
| Equity Equivalence | 235,477 | 48,891 | - | 284,368 | (828 | ) | 52,740 | - | 51,912 | |||||||||||||||||||||||
| EBIT | 19,360,445 | 2,862,336 | - | 22,222,781 | 16,297,577 | 1,882,614 | - | 18,180,191 | ||||||||||||||||||||||||
| Depreciation, Amortization & Depletion | 6,737,864 | 670,026 | - | 7,407,890 | 6,437,832 | 603,831 | - | 7,041,663 | ||||||||||||||||||||||||
| EBITDA | 26,098,309 | 3,532,362 | - | 29,630,671 | 22,735,409 | 2,486,445 | - | 25,221,854 | ||||||||||||||||||||||||
| EBITDA Margin | 63 | % | 42 | % | - | 59 | % | 66 | % | 40 | % | - | 62 | % | ||||||||||||||||||
| Adjusted EBITDA1 | 25,098,535 | 3,096,367 | - | 28,194,902 | 21,438,604 | 2,032,319 | - | 23,470,923 | ||||||||||||||||||||||||
| Adjusted EBITDA Margin1 | 61 | % | 36 | % | - | 57 | % | 62 | % | 33 | % | - | 57 | % | ||||||||||||||||||
| Net Financial Result | - | - | 6,432,800 | 6,432,800 | - | - | (9,347,234 | ) | (9,347,234 | ) | ||||||||||||||||||||||
| Earnings Before Taxes | 19,360,445 | 2,862,336 | 6,432,800 | 28,655,581 | 16,297,577 | 1,882,614 | (9,347,234 | ) | 8,832,957 | |||||||||||||||||||||||
| Income and Social Contribution Taxes | - | - | (5,260,694 | ) | (5,260,694 | ) | - | - | (197,425 | ) | (197,425 | ) | ||||||||||||||||||||
| Net Income (Loss) | 19,360,445 | 2,862,336 | 1,172,106 | 23,394,887 | 16,297,577 | 1,882,614 | (9,544,659 | ) | 8,635,532 | |||||||||||||||||||||||
| Net Margin | 47 | % | 34 | % | - | 47 | % | 47 | % | 30 | % | - | 21 | % | ||||||||||||||||||
1Excluding non-recurring items and PPA effects.
Page 39 of 40
Forward-Looking Statements
This release may contain forward-looking statements. Such statements are subject to known and unknown risks and uncertainties due to which such expectations may not happen at all or may substantially differ from what was expected. These risks include, among others, changes in future demand for the Company’s products, changes in factors affecting domestic and international product prices, changes in the cost structure, changes in the seasonal patterns of markets, changes in prices charged by competitors, foreign exchange variations, changes in the political or economic situation of Brazil, as well as emerging and international markets. The forward-looking statements were not reviewed by our independent auditors.
Page 40 of 40