Exhibit 99.1

Resilience amid a challenging scenario and
strong investment cycle
São Paulo, August 2, 2023. Suzano S.A. (B3: SUZB3 | NYSE: SUZ), one of the world’s largest integrated pulp and paper producers, announces today its consolidated results for the 2nd quarter of 2023 (2Q23).
HIGHLIGHTS
| · | Pulp sales of 2,513 thousand tons (-6% vs. 2Q22). |
| · | Paper sales1 of 294 thousand tons (-9% vs. 2Q22). |
| · | Adjusted EBITDA2 and Operating cash generation3: R$3.9 billion and R$2.2 billion, respectively. |
| · | Adjusted EBITDA2/ ton from pulp of R$1,269/ton (-40% vs. 2Q22). |
| · | Adjusted EBITDA2/ton from paper of R$2,481/ton (+14% vs. 2Q22). |
| · | Average net pulp price in export market: US$562/ton (-23% vs. 2Q22). |
| · | Average net paper price1 of R$7,002/ton (+13% vs. 2Q22). |
| · | Pulp cash cost ex-downtime of R$918/ton (+7% vs. 2Q22). |
| · | Leverage of 2.2 times in USD and 2.0 times in BRL. |
| · | Cerrado Project completes 70% of physical progress and 57% of financial progress. Forecast for the start of operations to occur by June 2024. |
| Financial Data (R$ million) | 2Q23 | 1Q23 | Δ Q-o-Q | 2Q22 | Δ Y-o-Y | LTM 2Q23 |
| Net Revenue | 9,160 | 11,276 | -19% | 11,520 | -20% | 49,004 |
| Adjusted EBITDA2 | 3,919 | 6,155 | -36% | 6,303 | -38% | 26,845 |
| Adjusted EBITDA Margin2 | 43% | 55% | -12 p.p. | 55% | -12 p.p. | 55% |
| Net Financial Result | 4,536 | 2,470 | 84% | (6,975) | -165% | 7,478 |
| Net Income | 5,078 | 5,243 | -3% | 182 | - | 23,227 |
| Operating Cash Generation3 | 2,203 | 4,689 | -53% | 5,055 | -56% | 20,510 |
| Net Debt /Adjusted EBITDA2 (x) - R$ | 2.0 x | 1.9 x | 0.1 x | 2.3 x | -0.3 x | 2.0 x |
| Net Debt /Adjusted EBITDA2 (x) - US$ | 2.2 x | 1.9 x | 0.3 x | 2.3 x | -0.1 x | 2.2 x |


Operational Data (‘000 tons) | 2Q23 | 1Q23 | Δ Q-o-Q | 2Q22 | Δ Y-o-Y | LTM 2Q23 |
| Sales | 2,807 | 2,735 | 3% | 2,987 | -6% | 11,768 |
| Pulp | 2,513 | 2,455 | 2% | 2,663 | -6% | 10,524 |
| Paper1 | 294 | 280 | 5% | 324 | -9% | 1,243 |
¹Considers the results of the Consumer Goods Unit (tissue). | 2Excludes non-recurring items. | 3Considers Adjusted EBITDA less sustaining capex (cash basis).

The consolidated quarterly information has been prepared in accordance with the Securities and Exchange Commission (CVM) and Accounting Standards Committee (CPC) standards and is in compliance with International Accounting Standard (IFRS) issued by the International Accounting Standard Board (IASB). The data contained in this document was obtained from the financial information as made available to the CVM. The operating and financial information is presented based on consolidated numbers in Reais (R$). Summaries may diverge due to rounding.

Page 2 of 46
CONTENTS
| EXECUTIVE SUMMARY | 4 |
| PULP BUSINESS PERFORMANCE | 5 |
| PULP SALES VOLUME AND REVENUE | 5 |
| PULP CASH COST | 7 |
| PULP SEGMENT EBITDA | 9 |
| OPERATING CASH GENERATION FROM THE PULP SEGMENT | 10 |
| PAPER BUSINESS PERFORMANCE | 11 |
| PAPER SALES VOLUME AND REVENUE | 11 |
| PAPER SEGMENT EBITDA | 14 |
| OPERATING CASH GENERATION FROM THE PAPER SEGMENT | 15 |
| FINANCIAL PERFORMANCE | 16 |
| NET REVENUE | 16 |
| CALENDAR OF SCHEDULED MAINTENANCE DOWNTIMES | 17 |
| COST OF GOODS SOLD (COGS) | 18 |
| SELLING EXPENSES | 18 |
| GENERAL AND ADMINISTRATIVE EXPENSES | 19 |
| ADJUSTED EBITDA | 20 |
| FINANCIAL RESULT | 21 |
| DERIVATIVE OPERATIONS | 22 |
| NET INCOME (LOSS) | 28 |
| DEBT | 28 |
| CAPEX | 31 |
| CERRADO PROJECT | 32 |
| OPERATING CASH GENERATION | 33 |
| FREE CASH FLOW | 34 |
| EVOLUTION OF NET DEBT | 35 |
| ESG | 35 |
| TOTAL OPERATIONAL EXPENDITURE - PULP | 35 |
| CAPITAL MARKETS | 35 |
| FIXED INCOME | 37 |
| RATINGS | 37 |
| UPCOMING EVENTS | 38 |
| APPENDICES | 39 |
| APPENDIX 1 – Operating Data | 39 |
| APPENDIX 2 – Consolidated Statement of Income and Goodwill Amortization | 41 |
| APPENDIX 3 – Consolidated Balance Sheet | 42 |
| APPENDIX 4 – Consolidated Statement of Cash Flow | 43 |
| APPENDIX 5 – EBITDA | 44 |
| APPENDIX 6 – Segmented Income Statement | 45 |
| Forward-Looking Statements | 46 |
Page 3 of 46
EXECUTIVE SUMMARY
Pulp market scenario remained challenging in the second quarter of 2023, pressuring the quarterly results. The decline in pulp prices and the appreciation of the BRL were the main factors reducing adjusted EBITDA in the segment. In the other hand, cash production cost excluding scheduled maintenance downtimes decreased, mainly due to the drop in commodity, mainly benefiting the cost of inputs. The paper business unit delivered resilient results in the domestic market; however, the decline in export market prices contributed to the drop in EBITDA per ton during the period. Consequently, adjusted EBITDA in the quarter came to R$3.9 billion.
As for financial management, net debt measured in dollars increased slightly, reaching US$11.3 billion, mainly due to the company's largest historical investment cycle, focused on generating significant and sustainable value in the long term. Operating cash generation reached R$ 2.2 billion. Such results demonstrate the company's economic resilience amid the current situation, arising from the quality of its asset portfolio, its business model and the health of its balance sheet. The hedging policy played an important role, with a positive cash inflow of R$1.3 billion, largely explained by the appreciation of the BRL versus the USD in the period.
As per the Notice to the Market of July 7, 2023, the Company completed its third consecutive share buyback program (“October/2022 Program”). A total of 20 million shares were acquired in regular trading sessions on the stock exchange, at an average price of R$44.02/share, totaling R$880 million. Completion of the third program reinforces diligence in capital allocation, also through shareholder remuneration.
Continuing the advances made in its strategy, within the context of the “Maintain relevance in pulp, through good projects” and “Be best-in class in the total pulp cost vision” avenues, the physical progress of Cerrado Project remains as expected, reaching 70%, while financial progress was 57%. Now, with the significant progress already obtained from the project, the company is confident that the start of operations will take place by June 2024.
Finally, in line with the “Advance in the links of the chain” avenue, in June the Company announced the conclusion of the acquisition of Kimberly-Clark Brazil tissue business.
Page 4 of 46
PULP BUSINESS PERFORMANCE
PULP SALES VOLUME AND REVENUE
During the second quarter, the pulp market faced a challenging scenario in prices, with varying impacts in each region due to the complex macroeconomic scenario specific to each one of them.
In China, the sanitary papers sector delivered solid performance, mainly driven by online shopping festivals in the second half of the period, culminating in higher production than in the first quarter of the year. The printing & writing paper segment, the second largest consumer of hardwood pulp in the market, registered higher production than in the previous quarter. On the other hand, in the paperboard segment, though production remained stable, average prices declined due to adverse market fundamentals, mainly affected by the successive entry of new capacities in the first half of 2023. A positive aspect to be highlighted was related to the recovery of margins in the main segments in China, which is due to the lower cost of hardwood, providing a significant competitive advantage for non-integrated producers and for integrated producers, who have benefited from the purchase of market pulp.
In Europe and North America, the sanitary papers segment performed strongly during the quarter. However, in Europe, the printing & writing paper sector continues to witness weak demand, which reflected in the prolonged cycle of destocking of finished products, high inventory levels at ports, and lower operating rates and/or production downtimes at papermakers due to the adverse market scenario.
As for pulp supply, the main global markets received the first hardwood pulp volumes produced by new capacities at the end of quarter. Both scheduled and non-scheduled downtimes increased significantly during the second quarter compared to the previous quarter. The main factors for non-scheduled downtimes were limited wood supply, fires in the Northern Hemisphere and unsatisfactory margins at some producers due to the prevailing pulp prices.
Average PIX/FOEX prices of hardwood pulp in the quarter decreased 31% in China and 18% in Europe compared to 1Q23. The difference between softwood and hardwood pulp prices once again rose to above historical averages in the quarter, which should drive consumption of hardwood pulp, quoted at USD190/t in China and USD209/t in Europe, respectively, compared to the previous quarter.
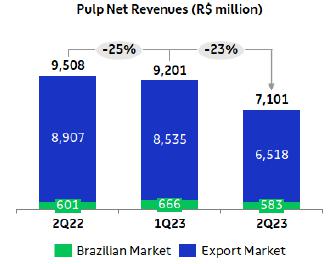
Suzano’s pulp sales increased in relation to the previous quarter due to higher demand in China, totaling 2,513 thousand tons, an increase of 2% from 1Q23 but 6% lower than in 2Q22.
Page 5 of 46

Average net price in USD of pulp sold by Suzano was US$571/ton, decreasing 21% from both 1Q23 and 2Q22. In the export market, average net price was US$562/ton, decreasing 22% and 23%, respectively, in the same comparison basis. Average net price in BRL was R$2,825/ton in 2Q23, down 25% from 1Q23, due to the scenario of more challenging prices, especially in China, and by the depreciation of the average USD against the average BRL (-5%). Compared to 2Q22, the 21% decrease was mainly due to lower net average price in USD during the period.

Net revenue from pulp decreased 23% from 1Q23, due to the lower net average price in USD (-21%) and the decline in average USD against average BRL (-5%). Compared to 2Q22, revenue decreased 25% due to the lower net average price in USD (-21%) and lower sales volume (-6%), partially offset by the increase in average USD versus average BRL (+1%).
Page 6 of 46
PULP CASH COST
 |  |
Cash cost excluding downtime in 2Q23 stood at R$918/t, decreasing 2% from 1Q23, due to: i) lower prices of inputs, especially energy (lower natural gas prices due to the decline in Brent prices) and lower chemical prices (especially of caustic soda due to lower international prices - HIS); ii) lower consumption of inputs (especially lime and caustic soda) due to more efficient plant operations; and iii) the decline in average USD against average BRL (-5%). The positive effects on cash cost were partially offset by higher fixed costs, which resulted from higher labor and maintenance costs and lower dilution of costs on account of lower production volume, as well as lower revenue from utilities due to lower exports (also due to the higher impact of scheduled maintenance downtimes). Cost of wood remained stable due to higher operating costs resulting from inflationary pressures, and the supply mix effect fully offset the benefit obtained from lower diesel prices (Brent).
Page 7 of 46

¹Excludes the impact of maintenance and administrative downtimes.
Cash cost excluding downtime in 2Q23 was 7% higher than in 2Q22, due to: i) higher fixed costs resulting from higher labor and maintenance costs and lower cost dilution due to lower production; ii) higher wood costs, especially due to higher logistics costs in the regions affected by heavy rainfall at the start of the year, in addition to the increase in harvesting costs (higher labor costs and price adjustments in service agreements), partially offset by lower Brent prices and lower average supply radius during the period; iii) lower revenue from utilities resulting from lower export volume (lower production volume), and iv) the increase in average USD versus BRL (+1%). Costs of inputs decreased slightly due to lower prices (especially of natural gas, chlorine dioxide and packaging), most of which was offset by higher consumption, mainly of natural gas and oil, due to lower operating stability associated with the resumption of a few mills after scheduled maintenance downtimes.

¹Excludes the impact of maintenance and administrative downtimes.
Page 8 of 46
 |  |
¹Based on cash cost excluding downtimes. Excludes energy sales.
PULP SEGMENT EBITDA
| Pulp Segment | 2Q23 | 1Q23 | Δ Q-o-Q | 2Q22 | Δ Y-o-Y | LTM 2Q23 |
| Adjusted EBITDA (R$ million)¹ | 3,190 | 5,336 | -40% | 5,600 | -43% | 23,465 |
| Sales volume (k ton) | 2,513 | 2,455 | 2% | 2,663 | -6% | 10,524 |
| Pulp adjusted¹ EBITDA (R$/ton) | 1,269 | 2,174 | -42% | 2,103 | -40% | 2,230 |
¹Excludes non-recurring items.
Adjusted EBITDA from pulp decreased 40% from 1Q23 due to: i) the lower average net pulp price in USD (-21%); (i) higher COGS cash basis (+4%), mainly due to the higher sales volume and higher effect of scheduled maintenance downtimes; and iii) the depreciation of average USD versus average BRL (-5%). These effects were partially offseted by higher sales volume (+2%). The 42% decline in adjusted EBITDA per ton is explained by the same factors, except the volume effect.
Compared to 2Q22, the 43% decrease in Adjusted EBITDA from pulp reflects: i) the decrease in average net price in USD (-21%); ii) lower sales volume (-6%); and iii) higher COGS (+2%), mainly due to higher cash cost of production. These effects were marginally offset by the appreciation of average USD against average BRL (+1%). Adjusted EBITDA per ton declined 40% due to the same factors ex-volumes.
Page 9 of 46

¹Excludes non-recurring items.

OPERATING CASH GENERATION FROM THE PULP SEGMENT
Pulp Segment (R$ million) | 2Q23 | 1Q23 | Δ Q-o-Q | 2Q22 | Δ Y-o-Y | LTM 2Q23 |
| Adjusted EBITDA1 | 3,190 | 5,336 | -40% | 5,600 | -43% | 23,465 |
| Maintenance Capex2 | (1,547) | (1,338) | 16% | (1,149) | 35% | (5,753) |
| Operating Cash Flow | 1,642 | 3,998 | -59% | 4,450 | -63% | 17,712 |
¹Excludes non-recurring items.
²Cash basis.
Page 10 of 46
Operating cash generation per ton in the pulp segment was 60% and 61% lower than in 1Q23 and 2Q22, respectively, due to lower EBITDA per ton and higher sustaining capex per ton.

PAPER BUSINESS PERFORMANCE
The following data and analyses incorporate the joint results of the consumer goods and paper businesses (tissue).
PAPER SALES VOLUME AND REVENUE
According to data published by Brazil's Forestry Industry Association (IBÁ), demand for Printing and Writing in Brazil, including imports, decreased 18% in the first two months of 2Q23 compared to the same period last year.
Page 11 of 46
The impact of reduced demand in the domestic market was felt above all in the coated paper lines destined for the promotional segment, due to a combination of inventory reductions in the chain and a lower level of economic activity in the services sector. Regarding uncoated paper lines, which account for most of Suzano's sales volume, demand has been more resilient and remained stable when compared to the same period of the previous year, sustained by sales to the publishing, corporate and school segments.
In Latin America (excluding Brazil), the main sales region for Suzano's I&E paper in the foreign market, demand in uncoated paper markets grew by 9% up to the month of May, year on year according to PPPC. This result contrasts with the significant reduction in paper demand in the markets of North America and Western Europe, which showed demand retractions between 8% and 20% compared to the same period in 2022, due to the movement of stock reductions in the chain and lower level of economic activity, according to the PPPC.
With regard to paperboard demand in Brazil, Suzano's main market, there was a 2% reduction in the first two months of 2Q23 compared to the same period of the previous year, a result that reflects inventory adjustments in the chain, while it is estimated that the demand for packaging has remained stable in the period.
Consolidating the aforementioned market segments (Suzano's accessible paper market), domestic sales fell by 14% in the first two months of 2Q23 compared to 2Q22. Even in the face of a more challenging scenario, Suzano has been advancing in its strategy of winning over new customers. At the end of the first half of 2023, the Company reached 35,000 active customers, a number 6% higher than the same period in 2022. It is also worth mentioning that, in the best understanding of the Company, the active customer portfolio in 2023 should exceed 43,000 customers active at the end of 2022.
Suzano’s paper sales (printing & writing, paperboard and tissue) in the domestic market totaled 210 thousand tons in 2Q23, stable in relation to the previous quarter. Compared to 2Q22, the 9% decline reflects the market contraction associated with the strategy of rebuilding inventories.
Export paper sales totaled 84 thousand tons, up 21% in relation to 1Q23, resulting from the volume allocation, corresponding to 29% of total sales volume in 2Q23. Compared to 2Q22, the 9% decrease is due to a strong basis for comparison last year, when the movement to rebuild stocks, during the supply restriction period, boosted sales, as opposed to the current destocking cycle, especially in mature markets.
Page 12 of 46

¹Includes the Consumer Goods Unit.
Average net price decreased 5% from the previous quarter, due to the cooling of demand in the international Printing and Writing markets and the greater availability of inventories in the chain, while in the domestic market prices remained stable. Compared to 2Q22, the 13% increase was caused by price increases mainly in the domestic market last year.

Net revenue from paper sales amounted to R$2,058 million, down 1% from 1Q23, reflecting mainly the lower net average price in the export market (-20%), partially offset by the 5% increase in sales volume. Compared to 2Q22, the 2% increase was due to price increases, mainly in the domestic market, partially offset by the drop in sales volume (-9%).
Page 13 of 46

¹Includes the Consumer Goods Unit.
PAPER SEGMENT EBITDA
| Paper Segment | 2Q23 | 1Q23 | Δ Q-o-Q | 2Q22 | Δ Y-o-Y | LTM 2Q23 |
| Adjusted EBITDA (R$ million) 1 | 729 | 818 | -11% | 703 | 4% | 3,380 |
| Sales volume (k ton) | 294 | 280 | 5% | 324 | -9% | 1,243 |
| Paper adjusted1 EBITDA (R$/ton) | 2,481 | 2,921 | -15% | 2,167 | 14% | 2,718 |
¹Excludes non-recurring items.
Adjusted EBITDA from paper decreased 11% from 1Q23 mainly due to lower net average price in the export market in USD (16%) and the depreciation of the average USD against the BRL (5%), partially offset by the increase in sales volume (+5%). Adjusted EBITDA per ton decreased 15%, mainly due to the price effect.
Compared to 2Q22, the 4% increase was due to price increases, mainly in the domestic market, despite the increase in costs and the drop in sales volume. Adjusted EBITDA per ton increased 14% due to the price factor, partially offset by higher costs.
Page 14 of 46


OPERATING CASH GENERATION FROM THE PAPER SEGMENT
Paper Segment (R$ million) | 2Q23 | 1Q23 | Δ Q-o-Q | 2Q22 | Δ Y-o-Y | LTM 2Q23 |
| Adjusted EBITDA1 | 729 | 818 | -11% | 703 | 4% | 3,380 |
| Maintenance Capex2 | (169) | (127) | 33% | (99) | 71% | (581) |
| Operating Cash Flow | 560 | 691 | -19% | 604 | -7% | 2,798 |
¹Excludes non-recurring items.
²Cash basis.
Page 15 of 46
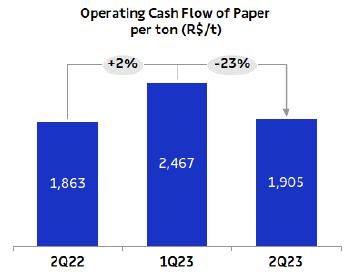
Operating cash generation per ton in the paper segment was R$1,905/ton in 2Q23, down 23% from 1Q23, due to lower EBITDA and higher sustaining capex per ton. Compared to the same period in 2022, the increase of 2% was due to higher EBITDA per ton, partially offset by higher sustaining capex per ton.
FINANCIAL PERFORMANCE
NET REVENUE
Suzano’s net revenue in 2Q23 was R$9,160 million, 77% of which came from exports (vs. 81% in 1Q23 and 83% in 2Q22). In relation to 1Q23, net revenue decreased 19% is explained by the lower average net pulp price in USD (-21%), lower average net paper price in USD on the export market (-16%) and the depreciation of average USD against average BRL (-5%). These effects were partially offset by higher sales volume in the period (+3%). The 20% decrease in consolidated net revenue compared to 2Q22 is mainly due to the lower net average pulp price in USD (-21%) and lower sales volume in the period (-6%). These effects were partially offset by better net average paper price in domestic market (+17%) and export market (+2%), besides the higher average USD versus average BRL (+1%).
Page 16 of 46
 |  |
¹Does not include Portocel service revenue.
CALENDAR OF SCHEDULED MAINTENANCE DOWNTIMES
| Mill – Pulp capacity | 2022 | 2023 | 2024 | |||||||||||||
| 1Q22 | 2Q22 | 3Q22 | 4Q22 | 1Q23 | 2Q23 | 3Q23 | 4Q23 | 1Q24 | 2Q24 | 3Q24 | 4Q24 | |||||
| Aracruz - Mill A (ES) – 590 kt | No downtime | |||||||||||||||
| Aracruz - Mill B (ES) – 830 kt | No downtime | |||||||||||||||
| Aracruz - Mill C (ES) – 920 kt | No downtime | |||||||||||||||
| Imperatriz (MA)1 – 1,650 kt | ||||||||||||||||
| Jacareí (SP) – 1,100 kt | ||||||||||||||||
| Limeira (SP)² – 690 kt | ||||||||||||||||
| Mucuri - Mill 1 (BA)² – 600 kt | No downtime | |||||||||||||||
| Mucuri - Mill 2 (BA) – 1,130 kt | No downtime | |||||||||||||||
| Suzano (SP)¹ – 520 kt | No downtime | |||||||||||||||
| Três Lagoas - Mill 1 (MS) – 1,300 kt | No downtime | |||||||||||||||
| Três Lagoas - Mill 2 (MS) – 1,950 kt | No downtime | |||||||||||||||
| Veracel (BA)² – 560 kt | No downtime | |||||||||||||||
1Includes integrated capacities and fluff.
2Veracel is a joint operation between Suzano (50%) and Stora Enso (50%) with total annual capacity of 1,120 thousand tons.
Page 17 of 46
COST OF GOODS SOLD (COGS)
| COGS (R$ million) | 2Q23 | 1Q23 | Δ Q-o-Q | 2Q22 | Δ Y-o-Y | LTM 2Q23 |
| COGS (Income statement) | 6,228 | 5,969 | 4% | 6,123 | 2% | 25,462 |
| (-) Depreciation, depletion and amortization | 1,624 | 1,520 | 7% | 1,625 | 0% | 6,463 |
| Cash COGS | 4,604 | 4,449 | 3% | 4,498 | 2% | 19,000 |
| Sales volume | 2,807 | 2,735 | 3% | 2,987 | -6% | 11,768 |
| Cash COGS/ton (R$/ton) | 1,640 | 1,627 | 1% | 1,506 | 9% | 1,615 |
Cash COGS in 2Q23 totaled R$4,604 million, or R$1,640/ton. Compared to 1Q23, cash COGS increased 3%, mainly due to higher sales volume and higher impact of maintenance downtimes, partially offset by the 5% depreciation in average USD against BRL, lower production cost excluding downtimes and lower logistics costs linked to the reduction in Brent prices. Cash COGS per ton increased 1% due to the higher impact of downtimes, partially offset by the exchange rate, lower production cash cost excluding downtimes and lower logistics costs.
Compared to 2Q22, cash COGS increased 2%, chiefly due to the higher cash cost of production and higher impact of scheduled maintenance downtimes, which were partially offset by lower sales volume and lower logistics costs (mainly due to the decrease in Brent prices). In relation to the same period last year, cash COGS per ton increased 9% due to the factors mentioned above, except for the volume factor.
SELLING EXPENSES
| Selling Expenses (R$ million) | 2Q23 | 1Q23 | Δ Q-o-Q | 2Q22 | Δ Y-o-Y | LTM 2Q23 |
| Selling expenses (Income Statement) | 627 | 604 | 4% | 626 | 0% | 2,517 |
| (-) Depreciation, depletion and amortization1 | 238 | 238 | 0% | 236 | 1% | 953 |
| Cash selling expenses | 389 | 367 | 6% | 389 | 0% | 1,564 |
| Sales volume | 2,807 | 2,735 | 3% | 2,987 | -6% | 11,768 |
| Cash selling expenses/ton (R$/ton) | 139 | 134 | 3% | 130 | 6% | 133 |
Cash selling expenses increased 6% from 1Q23, mainly due to higher fixed expenses with various own and third parties’ services (credit insurance, IT, marketing, among others). Cash selling expenses per ton increased 3% due to higher costs, as mentioned earlier.
Page 18 of 46
Compared to 2Q22, cash selling expenses remained stable, given that the lower volume sold was offset by higher expenses related to provision for doubtful accounts and higher costs with various fixed services such as labor and third-party services (consultancies and IT, among others). Cash selling expenses per ton increased 6% by the same factors listed above.
GENERAL AND ADMINISTRATIVE EXPENSES
| General and Administrative Expenses (R$ million) | 2Q23 | 1Q23 | Δ Q-o-Q | 2Q22 | Δ Y-o-Y | LTM 2Q23 |
| General and Administrative Expenses | 427 | 390 | 9% | 365 | 17% | 1,826 |
| (-) Depreciation, depletion and amortization1 | 28 | 27 | 7% | 27 | 4% | 105 |
| Cash general and administrative expenses | 399 | 364 | 10% | 338 | 18% | 1,721 |
| Sales volume | 2,807 | 2,735 | 3% | 2,987 | -6% | 11,768 |
| Cash general and administrative expenses/t (R$/ton) | 142 | 133 | 7% | 113 | 26% | 146 |
Compared to 1Q23, the 10% increase in cash general and administrative expenses is mainly due to higher personnel expenses (variable compensation) and third-party services (mainly audit), partially offset by lower labor costs. On a per-ton basis, these expenses increased 7% due to the same factors.
Compared to 2Q22, cash general and administrative expenses increased 18%, mainly due to higher personnel expenses (variable compensation and labor) and costs with third-party services (especially IT). On a per-ton basis, the 26% increase is explained by the same factors.
Page 19 of 46
Other operating income (expenses) amounted to income of R$1,205 million in 2Q23, compared to an expense of R$21 million in 1Q23 and income of R$162 million in 2Q22. The variation in relation to 1Q23 and 2Q22 is due to the updated fair value of biological assets, with no effect in the previous quarter and higher impact in relation to 2Q22.
ADJUSTED EBITDA
| Consolidated | 2Q23 | 1Q23 | Δ Q-o-Q | 2Q22 | Δ Y-o-Y | LTM 2Q23 |
| Adjusted EBITDA (R$ million)¹ | 3,919 | 6,155 | -36% | 6,303 | -38% | 26,845 |
| Adjusted EBITDA¹ Margin | 43% | 55% | -12 p.p. | 55% | -12 p.p. | 55% |
| Sales Volume (k ton) | 2,807 | 2,735 | 3% | 2,987 | -6% | 11,768 |
| Adjusted EBITDA¹/ton (R$/ton) | 1,396 | 2,250 | -38% | 2,110 | -34% | 2,281 |
¹Excludes non-recurring items.
Adjusted EBITDA in 2Q23 decreased 36% in relation to 1Q23, due to: i) lower average net pulp price in USD (-21%) and average net paper price in dollars in the export market (-16%); ii) decline in average USD versus average BRL (-5%); iii) higher SG&A expenses (+6%), mainly due to the increase in administrative expenses resulting from higher personnel expenses (variable compensation); and iv) higher cash COGS (+3%) resulting from the greater impact of scheduled maintenance downtimes, as explained earlier. These effects were partially offset by higher sales volume in the period (+3%). Adjusted EBITDA per ton was 38% lower due to the same factors explained above, except for the volume effect.
Compared to 2Q22, Adjusted EBITDA decreased 38% due to: i) lower net average pulp price in USD (-21%); ii) lower sales volume (-6%); iii) higher cash COGS (+2%), mainly due to higher cash cost of production; and iv) higher G&A expenses cash basis (+18%), mainly due to the increase in administrative expenses caused by higher personnel expenses (mainly variable compensation), as explained earlier. These effects were partially offset by higher net average paper price (+13%) and the appreciation of average USD against average BRL (+1%). Adjusted EBITDA per ton decreased 34% due to the same factors.
Page 20 of 46
FINANCIAL RESULT
| Financial Result (R$ million) | 2Q23 | 1Q23 | Δ Q-o-Q | 2Q22 | Δ Y-o-Y | LTM | |
| Financial Expenses | (1,149) | (1,159) | -1% | (1,133) | 1% | (4,715) | |
Interest on loans and financing (local currency) | (359) | (358) | 0% | (355) | 1% | (1,414) | |
Interest on loans and financing (foreign currency) | (797) | (794) | 0% | (605) | 32% | (3,051) | |
| Capitalized interest¹ | 278 | 233 | 19% | 66 | - | 762 | |
| Other financial expenses | (270) | (240) | 13% | (239) | 13% | (1,012) | |
| Financial Income | 404 | 386 | 5% | 194 | 108% | 1,404 | |
| Interest on financial investments | 407 | 277 | 47% | 168 | 142% | 1,199 | |
| Other financial income | (3) | 109 | - | 26 | -110% | 206 | |
| Monetary and Exchange Variations | 2,377 | 1,248 | 90% | (4,460) | - | 3,749 | |
Foreign exchange variations (Debt) | 3,032 | 1,511 | 101% | (5,986) | - | 4,679 | |
Other foreign exchange variations | (656) | (263) | 150% | 1,526 | - | (930) | |
| Derivative income (loss), net2 | 2,904 | 1,995 | 46% | (1,576) | - | 7,040 | |
| Operating Cash flow hedge | 1,466 | 1,225 | 20% | (945) | - | 3,375 | |
Cash flow - Cerrado project hedge | 298 | 273 | 9% | (147) | - | 956 | |
| Debt hedge | 974 | 484 | 101% | (549) | - | 2,466 | |
| Others³ | 166 | 12 | - | 65 | 155% | 243 | |
| Net Financial Result | 4,536 | 2,470 | 84% | (6,975) | - | 7,478 | |
1Capitalized interest related to work in progress.
2Variation in mark-to-market adjustment (2Q23: R$3,261 million | 1Q23: 1,656 million), plus adjustments paid and received (2Q23: = R$1,299 million).
3Includes commodity hedge and embedded derivatives.
Financial expenses were 1% lower than in 1Q23, mainly due to the increase in capitalized interest (linked to the progress of the Cerrado Project). This effect was partially offset mainly by the increase in other financial expenses, which, in turn, is explained by tax charges (IOF - Financial Transaction Tax) arising from financial transactions. Compared to 2Q22, financial expenses increased 1%, mainly due to: (i) interest rate increase in the US (2Q23: 4.97% p.a. | 2Q22: 0.71% p.a. - SOFR average reference), which affected interest expenses in foreign currency; and (ii) higher expenses with tax charges (IOF - Financial Transaction Tax) arising from financial transactions, which were partially offset by the increase in capitalized interest.
Financial income grew 5% in relation to 1Q23, due to higher interest on financial investments, mainly caused by the increase in U.S. interest rate (2Q23: 4.97% p.a. | 1Q23: 4.50% p.a. - SOFR average reference) levied on the cash portion in foreign currency, which was partially offset by the negative variation in other financial income. Compared to 2Q22, the 108% increase is was caused by higher U.S. interest (2Q23: 4.97% p.a. | 2Q22: 0.71% p.a. - SOFR average reference) on the cash portion in USD and higher CDI rate (2Q23: 13.65% p.a. | 2Q22: 12.38% p.a.) on the cash portion in BRL.
Page 21 of 46
Inflation adjustment and exchange variation had a positive impact of R$2,377 million on the Company’s financial result due to the 5% increase in the end-of-period rate of BRL against USD in 1Q23, which affected foreign currency debt (US$12,485 million at the end of 2Q23) by R$3,032 million. This effect was partially offset by the negative result of exchange variation on other balance sheet items in foreign currency (R$656 million), notably the impact on accounts receivable in foreign currency and on the Company’s cash position (80% in USD at the end of 2Q23). Note that the accounting impact of exchange variation on foreign currency debt and on other balance sheet accounts have a cash impact only on the respective maturities.
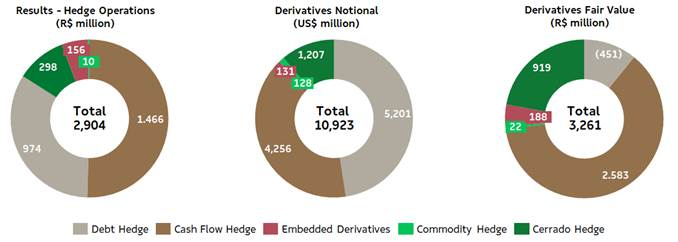
Derivative operations resulted in an income of R$2,904 million in 2Q23, due to the stronger BRL and the decrease in the fixed-rate curves (with the expected reduction in Brazilian interest rate) and increases in coupon and Libor rates on both debt and cash flow hedges. The mark-to-market adjustment of derivative instruments on June 30, 2023 was positive at R$3,261 million, compared to R$1,656 million on March 31, 2023, representing an increase of R$1,605 million. Note that the impact of BRL appreciation on the derivatives portfolio generates a cash impact only upon the respective maturities. The net effect on cash, which refers to the maturity of derivative operations in the second quarter, was a positive R$1,299 million (R$173 million related to debt hedge, as well as gains of R$1,117 million from cash flow hedge and R$9 million from commodities).
As a result of the above factors, net financial result in 2Q23, considering all financial expense and income lines, was an income of R$4,536 million, compared to an income of R$2,470 million in 1Q23 and an expense of R$6,975 million in 2Q22.
DERIVATIVE OPERATIONS
Suzano carries out derivative operations exclusively for hedging purposes. The following table reflects the position of derivative hedging instruments on June 30, 2023:
| Hedge1 | Notional (US$ million) | Fair Value (R$ million) | ||
| Jun/23 | Mar/23 | Jun/23 | Mar/23 | |
| Debt | 5,201 | 5,573 | (451) | (1,251) |
| Cash Flow – Operating (ZCC + NDF) | 4,256 | 5,474 | 2,583 | 1,984 |
| Cash Flow – Cerrado² (ZCC + NDF) | 1,207 | 1,599 | 919 | 871 |
| Others3 | 259 | 228 | 210 | 53 |
| Total | 10,923 | 12,873 | 3,261 | 1,656 |
¹See note 4 of the 2Q23 Quarterly Financial Statements (ITR) for further details and fair value sensitivity analysis.
2Hedge program related to capex in BRL (ZCC) and EUR (NDF) of the Cerrado Project.
³ Includes commodity hedge and embedded derivatives.
Page 22 of 46
The Company’s foreign exchange exposure policy seeks to minimize the volatility of its cash generation and ensure greater flexibility in cash flow management. Currently, the policy stipulates that surplus dollars may be partially hedged (at least 40% and up to 75% of exchange variation exposure over the next 24 months) using plain vanilla instruments such as Zero Cost Collars (ZCC) and Non-Deliverable Forwards (NDF). At the end of 2Q23, 67% of the exchange variation exposure was covered.
Considering the foreign exchange exposure related to Capex in the Cerrado Project, since approximately 67% of Capex is pegged to local currency, the Board of Directors approved on October 28, 2021 a program for contracting additional specific hedge operations to protect from such exposure. The program approved (established in the Derivative Management Policy available on the Investor Relations website) initially involved a maximum amount (notional) of up to US$1 billion and a term of operations of up to 36 months. On July 27, 2022, the Board of Directors approved the expansion of the program, increasing the maximum amount (notional) to US$1.5 billion while maintaining the previously established term. To ensure transparency with regard to the Cerrado Project's hedge program, since 4Q21 the Company has been prominently disclosing the operations contracted.
Since about 33% of the Capex of the Cerrado Project is denominated in EUR, in 3Q22, the Company contracted hedge operations through NDFs to protect the exposure in EUR of the Capex of the Cerrado Project, converting it into USD. This type of hedge is established in the Derivatives Management Policy available on the Investor Relations website.
ZCC transactions establish minimum and maximum limits for the exchange rate that minimize adverse effects in the event of significant appreciation of the BRL. As such, if the exchange rate is within such limits, the Company neither pays nor receives any financial adjustments. This characteristic allows for capturing greater benefits from export revenue in a potential scenario of BRL appreciation versus USD within the range contracted. In cases of extreme BRL appreciation, the Company is protected by the minimum limits, which are considered appropriate for the operation. However, this protection instrument also limits, temporarily and partially, potential gains in scenarios of extreme BRL depreciation when exchange rates exceed the maximum limits contracted.
On June 30, 2023, the outstanding notional value of operations involving forward USD sales through ZCCs related to Cash Flows (including those related to the Cerrado Project) was US$4,815 million, with an average forward rate ranging from R$5.61 to R$6.51 and maturities distributed between July 2023 and April 2025. On the same date, the outstanding notional value of operations involving forward USD sales through NDFs was US$243 million, whose maturities are distributed between August 2023 and April 2025 and with an average rate of R$5.54. Regarding hedge for foreign exchange exposure in EUR, the outstanding notional value of forward EUR purchases at the end of 2Q23 was €394 million (US$404 million), with an average contracted rate of 1.03 EUR/USD and maturities through July 2024. In 2Q23, cash flow hedge operations (Operational and Cerrado Project) resulted in a gain of R$1,764 million. The mark-to-market (“MtM” or “fair value”) value of these operations totaled R$3,502 million, with R$2,583 million related to cash flow operating hedge and R$919 million related to hedge of the Cerrado Project.
Page 23 of 46
The following table presents a sensitivity analysis of the cash impact that the Company could have on its cash flow hedge portfolios (ZCC and NDF) if the exchange rate remains the same as at the end of 2Q23 (BRL/USD = 4.82) in the coming quarters, as well as the projected cash impact for R$0.10 variations below/above the strike of put/call options, respectively, defined in each quarter. Note that the figures presented in the table are the Company’s projections based on the end-of-period curves and could vary depending on market conditions.
| Cash Adjustment (R$ million) | |||||
| Maturity (up to) | Strike Range | Notional (US$ million) | Actual | Exchange Rate 2Q23 (R$ 4.82) | Sensitivity at R$ 0.10 / US$ variation (+/-) |
| Zero Cost Collars | |||||
| 2Q23 | - | - | 862 | - | - |
| 3Q23 | 5.45 - 6.24 | 605 | - | 382 | (61) |
| 4Q23 | 5.56 - 6.35 | 981 | - | 723 | (98) |
| 1Q24 | 5.45 - 6.20 | 577 | - | 366 | (58) |
| 2Q24 | 5.56 - 6.40 | 560 | - | 413 | (56) |
| 3Q24 | 5.66 - 6.53 | 555 | - | 466 | (56) |
| 4Q24 | 5.71 - 6.63 | 505 | - | 448 | (51) |
| 1Q25 | 5.58 - 6.48 | 195 | - | 148 | (20) |
| 2Q25 | 5.20 - 6.31 | 35 | - | 13 | (4) |
| Total | 5.56 - 6.38 | 4,013 | 862 | 2,959 | (401) |
| NDF | |||||
| 2Q23 | - | - | 5 | - | - |
| 3Q23 | 5.53 | 200 | - | 141 | (20) |
| 4Q23 | 5.64 | 34 | - | 27 | (3) |
| 4Q24 | 5.47 | 5 | - | 3 | (1) |
| 4Q25 | 5.54 | 5 | - | 4 | (1) |
| Total | 5.54 | 243 | 5 | 176 | (24) |
| Zero Cost Collars – Projeto Cerrado | |||||
| 2Q23 | - | - | 212 | - | - |
| 3Q23 | 5.87 - 7.22 | 300 | - | 316 | (30) |
| 4Q23 | 5.85 - 7.00 | 341 | - | 350 | (34) |
| 1Q23 | 5.87 - 6.98 | 95 | - | 100 | (9) |
| 2Q24 | 6.10 - 7.44 | 58 | - | 75 | (6) |
| 3Q24 | 6.35 - 8.34 | 9 | - | 14 | (1) |
| Total | 5.88 - 7.13 | 802 | 212 | 854 | (80) |
Page 24 of 46
| Cash Adjustment (R$ million) | |||||||
| Maturity (up to) | Strike Range | Notional (US$ million)¹ | Actual | Exchange Rate | Sensitivity at € 0.10 / US$ | ||
| NDF – Projeto Cerrado (EUR/USD) | |||||||
| 2Q23 | - | - | 39 | - | - | ||
| 3Q23 | 1.01 | 45 | - | 18 | 22 | ||
| 4Q23 | 1.02 | 97 | - | 33 | 46 | ||
| 1Q24 | 1.03 | 98 | - | 29 | 46 | ||
| 2Q24 | 1.03 | 96 | - | 27 | 45 | ||
| 3Q24 | 1.04 | 69 | - | 17 | 32 | ||
| Total | 1.03 | 404 | 39 | 124 | 190 | ||
1Translated at the average contracted rate of 1.03 Euro/USD
To mitigate the effects of exchange and interest rate variations on its debt and its cash flows, the Company also uses currency and interest rate swaps. Swap contracts are entered into considering different interest rates and inflation indices in order to mitigate the mismatch between financial assets and liabilities.
Page 25 of 46
On June 30, 2023, the Company had an outstanding amount (notional value) of US$5,201 million in swap contracts as shown in the table below. In 2Q23, the result of debt hedge transactions was a gain of R$974 million, mainly due to the positive impact of fixed, coupon and Libor curves, as well as a stronger BRL during the period. The mark-to-market adjustment (fair value) of these operations was a loss of R$451 million.
Notional (US$ million) | Fair Value (R$ million) | |||||||||
| Debt Hedge | Maturity (up to) | Currency | Jun/23 | Mar/23 | Jun/23 | Mar/23 | ||||
| Swap (PRÉ x USD) | 2024 | USD | 350 | 350 | (361) | (461) | ||||
| Swap (CDI x USD) | 2026 | USD | 1,265 | 1,650 | (1,262) | (1,986) | ||||
| Swap (IPCA x USD) | 2023 | USD | - | - | - | - | ||||
| Swap (LIBOR x USD) | 2026 | USD | 3,144 | 3,230 | 927 | 890 | ||||
| Swap (IPCA x CDI) | 2036 | BRL | 442¹ | 343 | 245 | 306 | ||||
| Total | 5,201 | 5,573 | (451) | (1,251) | ||||||
1Translated at the closing exchange rate (4.82).
The following table presents a sensitivity analysis1 of the cash impact that the Company could have on its debt hedge portfolio (swaps) if the exchange rate remains the same as at the end of 2Q23 (BRL/USD = 4.82) in the coming quarters, as well as the projected variation in cash impact for each R$0.10 variation on the same reference exchange rate (2Q23). Note that the figures presented in the table are the Company’s projections based on the end-of-period curves and could vary depending on market conditions.
| Cash Adjustment (R$ million) | ||||
| Maturity (up to) | Notional (US$ million) | Actual | R$ / US$ = 4.82 (2Q23) | Sensitivity at R$ 0.10 / US$ variation (+/-)1 |
| 2Q23 | - | 173 | - | - |
| 3Q23 | 479 | - | 264 | 2 |
| 4Q23 | 404 | - | 215 | 0 |
| 2024 | 1,502 | - | 197 | (20) |
| 2025 | 1,490 | - | (510) | (73) |
| 2026 | 957 | - | (671) | (72) |
| >=2027 | 370 | - | 402 | 0 |
| Total | 5,201 | 173 | (104) | (162) |
¹Sensitivity analysis considers variation only in the exchange rate (R$/US$), while other variables are presumed constant.
Page 26 of 46
Other transactions involving the Company’s derivatives are related to the embedded derivative resulting from forestry partnerships and commodity hedges, as shown in the table.
Notional (US$ million) | Fair Value (R$ million) | Cash Adjustment (R$ million) | |||||||||
| Other hedges | Maturity (up to) | Index | Jun/23 | Mar/23 | Jun/23 | Mar/23 | Jun/23 | Mar/23 | |||
Embedded derivative | 2038 | Dólar Fixo | Dólar US-CPI | 131 | 127 | 188 | 31 | - | - | |||
| Commodities | 2024 | Brent/VLSFO/ Outros | 128 | 101 | 22 | 22 | 9 | - | |||
| Total | 259 | 228 | 210 | 53 | 9 | - | |||||
A portion of the forestry partnership agreements and standing timber supply agreements is denominated in USD per cubic meter of standing timber, adjusted by U.S. inflation measured by the Consumer Price Index (CPI), which is not related to inflation in the economic environment where the forests are located and, hence, constitutes an embedded derivative. This instrument, presented in the table above, consists of a sale swap contract of the variations in the US-CPI and USD during the period of the contracts. See note 4 of the 2Q23 Financial Statements for more details and for a sensitivity analysis of the fair value in case of a sharp rise in the US-CPI and USD. On June 30, 2023, the outstanding (notional) value of the operation was US$131 million. The result from this swap in 2Q23 was a gain of R$156 million. The mark-to-market (fair value) adjustment of these operations generated a gain of R$188 million at the end of the quarter.
The Company is also exposed to the price of some commodities and, therefore, continually assesses the contracting of derivative financial instruments to mitigate such risks. On June 30, 2023, the outstanding (notional) value of the operations was US$128 million. The result from this swap in 2Q23 was a gain of R$10 million. The mark-to-market (fair value) adjustment of these operations generated a gain of R$22 million at the end of the quarter.
Page 27 of 46
NET INCOME (LOSS)
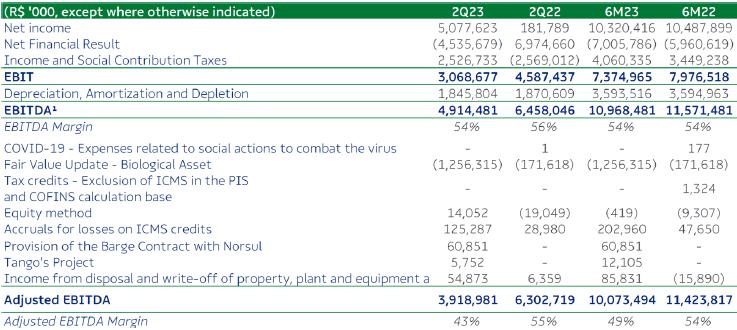
In 2Q23, the Company posted net income of R$5,078 million, as against R$5,243 million in 1Q23 and R$182 million in 2Q22. The 3% decline in relation to 1Q23 was due to lower operational result and higher deffered income tax and social contribution expenses, the latter caused mainly by higher income from exchange variations and derivative operations. These effects were partially offset by positive variations in the financial result and by the positive revaluation of the biological asset on other operating income/expenses.
The increase in net income compared to 2Q22 mainly reflects the increase in financial result caused by the effect of stronger BRL on debt and the mark-to-market result of operations with derivatives, as well as higher impact of the positive revaluation of the biological asset the on other operating income/expenses. These effects were partially offset by lower operating result (lower net revenue) and higher deffered income tax and social contribution expenses, mainly on positive results from exchange variation and derivative operations.
DEBT
| Debt (R$ million) | 2Q23 | 1Q23 | Δ Q-o-Q | 2Q22 | Δ Y-o-Y |
| Local Currency | 14,367 | 13,536 | 6% | 13,224 | 9% |
| Short Term | 2,920 | 3,087 | -5% | 1,754 | 67% |
| Long Term | 11,446 | 10,449 | 10% | 11,470 | 0% |
| Foreign Currency | 60,166 | 59,091 | 2% | 61,982 | -3% |
| Short Term | 2,612 | 1,037 | 152% | 1,718 | 52% |
| Long Term | 57,554 | 58,054 | -1% | 60,264 | -4% |
| Gross Debt | 74,532 | 72,627 | 3% | 75,206 | -1% |
| (-) Cash | 20,215 | 17,400 | 16% | 20,307 | 0% |
| Net debt | 54,317 | 55,227 | -2% | 54,899 | -1% |
| Net debt/Adjusted EBITDA¹ (x) - R$ | 2.0x | 1.9x | 0.1x | 2.3x | -0.3x |
| Net debt/Adjusted EBITDA¹ (x) – US$ | 2.2x | 1.9x | 0.3x | 2.3x | -0.1x |
1Excluding non-recurring items.
Page 28 of 46
On June 30, 2023, gross debt totaled R$74.5 billion and was composed of 93% long-term maturities and 7% short-term maturities. Foreign currency debt corresponded to 81% of the Company's total debt at the end of the quarter. The percentage of gross debt denominated in foreign currency, considering the effect of debt hedge, was 89%. Compared to 1Q23, gross debt increased 3%, mainly due to funding operations carried out during the period: disbursement of the credit line from the International Finance Corporation (IFC) (US$600 million) and from the Brazilian Development Bank (BNDES) (R$500 million), as well as advances on export exchange contracts (ACC) (US$135 million) and the issue of local market debentures (R$1 billion). These effects were partially offset by the 5% appreciation of closing BRL against the USD, as well as amortizations and interest payments made in the quarter. Suzano ended 2Q23 with 40% of total debt linked to ESG instruments.
Suzano contracts debt in foreign currency as a natural hedge, since net operating cash generation is mostly denominated in foreign currency (USD) due to its predominant status as an exporter. This structural exposure allows the Company to match loans and financing payments in USD with receivable flows from sales.

*Corresponding mainly to transaction costs (issue, funding, goodwill, discount and loss on business combinations, etc.).
On June 30, 2023, total average cost of debt in USD was 4.9% p.a. (considering the debt in BRL adjusted by the market swap curve), compared to 4.7% p.a. on March 31, 2023. The average term of consolidated debt at the end of the quarter was 75 months, compared to 77 months at the end of 1Q23.
Page 29 of 46
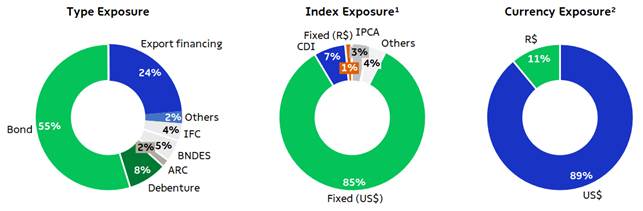
¹Considers the debt portion with swap for foreign currency fixed rate. The exposure of the original debt was: Fixed (US$) – 56%, Libor/SOFR– 25%, CDI – 11%, Other (Fixed R$, IPCA, TJLP, others) – 8%.
²Considers the portion of debt with currency swaps. The original debt was 81% denominated in USD and 19% in BRL.
Cash, cash equivalents and financial investments on June 30, 2023 totaled R$20.2 billion, 80% of which were in foreign currency, allocated to a remunerated account or in short-term fixed-income investments abroad. The remaining 20% was invested in local currency fixed-income bonds (mainly CDBs, but also in government bonds and others), remunerated at the CDI rate.
On June 30, 2023, the company also had a stand-by credit facility of R$6.1 billion (US$1.3 billion) available through February 2027. These facilities strengthen the company's liquidity position and can be withdrawn during times of uncertainty. As a result, the cash and equivalents of R$20.2 billion plus the stand-by credit facilities amounted to a readily available cash position of R$26.3 billion on June 30, 2023. Moreover, the company has a financing agreement with Finnvera (US$800 million) related to the Cerrado Project, as per the Notice to the Market of November 1, 2022, which has not yet been withdrawn, further strengthening its liquidity position.
 |  |
Page 30 of 46
On June 30, 2023, net debt stood at R$54.3 billion (US$11.3 billion), compared to R$55.2 billion (US$10.9 billion) on March 31, 2023. The increase in net debt in foreign currency is mainly due to higher capex disbursement in the period. The decrease in net debt in local currency is mainly due to the impact of exchange variation on the debt in USD.
Financial leverage, measured as the ratio of net debt to Adjusted EBITDA in BRL, stood at 2.0 times on June 30, 2023 (1.9 times in 1Q23). The same ratio in USD, the measure established in Suzano’s financial policy, increased to 2.2 times on June 30, 2023 (1.9 times in 1Q23).

The breakdown of total gross debt between trade and non-trade finance lines on June 30, 2023 is shown below:
| 6M23 | 2024 | 2025 | 2026 | 2027 | 2028 onwards | Total | |
| Trade Finance¹ | 8% | 95% | 56% | 50% | 50% | 0% | 26% |
| Non-Trade Finance² | 92% | 5% | 44% | 50% | 50% | 100% | 74% |
¹EEC, ECN, EPP
²Bonds, BNDES, CRA, Debentures, among others.
CAPEX
In 2Q23, capital expenditure (cash basis) totaled R$6,228 million. The increase of 67% compared to 1Q23 was due to: i) the higher amount paid as second installment for the acquisition of Parkia; ii) higher expenses with the Cerrado Project; and iii) higher spending on forestry maintenance due to higher costs with forestry services.
Page 31 of 46
Compared to 2Q22, the 40% increase is mainly due to the progress in execution of the Cerrado Project, as well as higher costs with forest maintenance mainly in the recovery of roads for forestry logistics.
| Investments¹ (R$ million) | 2Q23 | 1Q23 | Δ Q-o-Q | 2Q22 | Δ Y-o-Y | LTM 2Q23 | Guidance 2023 | ||||||||
| Maintenance | 1,716 | 1,465 | 17% | 1,248 | 38% | 6,335 | 6,360 | ||||||||
| Industrial maintenance | 286 | 209 | 37% | 247 | 16% | 1,105 | 1,301 | ||||||||
| Forestry maintenance | 1,403 | 1,237 | 13% | 987 | 42% | 5,064 | 4,809 | ||||||||
| Others | 27 | 20 | 36% | 14 | 99% | 165 | 250 | ||||||||
| Expansion and modernization | 231 | 128 | 80% | 114 | 103% | 622 | 732 | ||||||||
| Land and forestry | 1,828 | 377 | - | 1,769 | 3% | 2,980 | 2,420 | ||||||||
| Port terminals | 2 | 3 | -53% | 34 | -95% | 21 | 12 | ||||||||
| Others | 6 | 12 | -54% | 4 | 50% | 132 | 34 | ||||||||
| Cerrado Project | 2,446 | 1,735 | 41% | 1,270 | 93% | 9,045 | 8,937 | ||||||||
| Total | 6,228 | 3,720 | 67% | 4,439 | 40% | 19,135 | 18,495 | ||||||||
| dr | |||||||||||||||
¹Does not include the acquisition of Kimberly Clark's tissue assets in Brazil, in the amount of R$1,073 million, as explained in Note 15 of the financial statements.
CERRADO PROJECT
The Cerrado Project is progressing according to schedule on its physical and financial curves, closing the second quarter of 2023 with the “inside the fence” execution (which corresponds to industrial and infrastructure investments) reaching physical progress of 70% and financial progress of 57% (R$8,439 million). The Company expects the new pulp mill located in Ribas do Rio Pardo, Mato Grosso do Sul, with annual capacity of 2,550 thousand tons, to go operational by June 2024.
As disclosed in a Material Fact notice on April 27, 2023, the capex related to the full execution of the Cerrado Project is R$22.2 billion, of which R$15.9 billion refers to industrial capex and R$6.3 billion refers to forest, logistics and others. Production cash cost estimates (not including scheduled maintenance downtimes) are approximately R$500 per ton, from the completion of the learning curve of the new industrial plant, and approximately R$400 per ton from the start of the second forest cycle (2031 onwards). Such capex and cash cost estimates are in real (2023 currency) terms.
Page 32 of 46
OPERATING CASH GENERATION
Operating Cash Flow (R$ million) | 2Q23 | 1Q23 | Δ Q-o-Q | 2Q22 | Δ Y-o-Y | LTM 2Q23 |
| Adjusted EBITDA1 | 3,919 | 6,155 | -36% | 6,303 | -38% | 26,845 |
| Maintenance Capex2 | (1,716) | (1,465) | 17% | (1,248) | 38% | (6,335) |
| Operating Cash Flow | 2,203 | 4,689 | -53% | 5,055 | -56% | 20,510 |
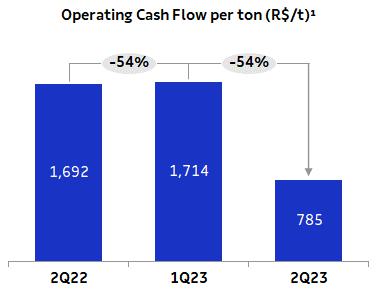
| Operating Cash Flow (R$/ton) | 785 | 1,714 | -54% | 1,692 | -54% | 1,743 |
¹Excludes non-recurring items.
²Cash basis.
Operating cash generation, measured by adjusted EBITDA less sustaining capex (cash basis), amounted to R$2.203 million in 2Q23. The 54% decrease in operating cash generation per ton in relation to 1Q23 and 2Q22 is due to lower Adjusted EBITDA per ton and higher sustaining capex per ton.
Page 33 of 46
FREE CASH FLOW
| Free Cash Flow (R$ million) | 2Q23 | 1Q23 | Δ Q-o-Q | 2Q22 | Δ Y-o-Y | LTM 2Q23 |
| Adjusted EBITDA | 3,919 | 6,155 | -36% | 6,303 | -38% | 26,845 |
| (-) Total Capex¹ | (7,503) | (3,843) | 95% | (4,568) | 64% | (20,962) |
| (-) Leases contracts – IFRS 16 | (284) | (293) | -3% | (244) | 16% | (1,122) |
| (+/-) D Working capital2 | 2,789 | (442) | - | (349) | - | (546) |
| (-) Net interest3 | (532) | (1,429) | -63% | (378) | 41% | (3,746) |
| (-) Income taxes | (47) | (43) | 10% | (25) | 89% | (302) |
| (-) Dividend payment/Share Buyback Program | (636) | (87) | - | (1,304) | -51% | (4,475) |
| (+/-) Derivative cash adjustment | 1,299 | 366 | 255% | 473 | 174% | 1,761 |
| Free cash flow | (996) | 384 | - | (92) | - | (2,547) |
| (+) Capex ex-maintenance | 5,642 | 2,487 | 127% | 3,276 | 72% | 12,745 |
| (+) Dividend payment/Share Buyback Program | 636 | 87 | - | 1,304 | -51% | 4,475 |
| Free cash flow – Adjusted4 | 5,283 | 2,958 | 79% | 4,488 | 18% | 14,673 |
¹Accrual basis, except for the Parkia deal (payments of R$1.7 billion in 2Q22 and R$1.6 billion in 2Q23) and the investment related to the Cerrado Project in 1Q23 and 2Q23, as per note 15 (Property, Plant and Equipment) to the Financial Statements. It also considers the acquisition of Kimberly Clark Brazil's tissue business in the amount of R$ 1,073 million (operation represents business combination and not acquisition of assets).
²Considers costs of capitalized loans paid in the amount of R$512 million.
3Considers interest paid on debt and interest received on financial investments.
4Free cash flow prior to dividend payments and capex ex-maintenance (accrual basis).
Adjusted Free Cash Flow in 2Q23 was R$5,283 million, compared to R$2,958 million in 1Q23 and R$4,488 million in 2Q22. Compared to the previous period, the metric increased 79%, mainly due to working capital release, largely caused by the reduction in receivables (as opposed to working capital investment in 1Q23). The increase was also due to higher net interest rates (lower concentration of interest payments) and higher positive adjustments in derivatives. These effects were partially offset by the decrease in adjusted EBITDA and higher sustaining capex (accrual base).
Compared to 2Q22, the metric increased 18%, also mainly due to the working capital release mentioned above (as opposed to the negative effect registered in the same period last year), increase in positive adjustments in derivatives, partially offset by the reduction in adjusted EBITDA and higher sustaining capex (accrual base).
Page 34 of 46
EVOLUTION OF NET DEBT
Following were the changes in net debt in 2Q23:

1 Accrual basis, except for the capex related to Cerrado Project (cash basis), as per the Cash Flow Statement. Considers the business combination with tissue segment from KC Brazil
2Net of exchange variations on cash and financial investments.
3Considers amounts related to derivative adjustments, lease agreements and other items.
ESG
In May, the Company also announced a new Sustainability, Technology and Innovation Department, led by Fernando Lellis Bertolucci. The new department will maximize synergies among the areas that comprise it to further drive Suzano’s innovability agenda, which represents the approach of "innovation" combined with "sustainability."
TOTAL OPERATIONAL EXPENDITURE - PULP
As disclosed in the Material Fact notice of February 28, 2023, total operational expenditure forecast for 2027 is approximately R$1,750/ton. The indicator has been evolving as planned, considering the exchange rate and monetary premises used. Such estimate refers to the currency in real terms of 2023.
CAPITAL MARKETS
On June 30, 2023, Suzano’s stock was quoted at R$44.22/share (SUZB3) and US$9.22/share (SUZ). The Company’s stock is listed on the Novo Mercado, the listing segment of the São Paulo Stock Exchange (B3 – Brasil, Bolsa e Balcão) with the highest corporate governance standards, and on the New York Stock Exchange (NYSE) - Level II.
Page 35 of 46
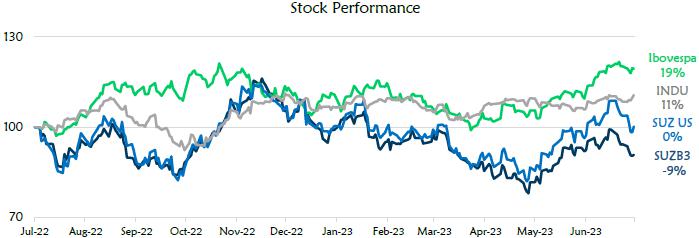
Source: Bloomberg.

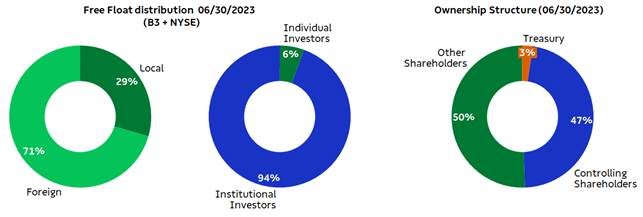
Source: Bloomberg.
On June 30, 2023, the capital stock of the Company was represented by 1,324,117,615 common shares, of which 32,466,900 were held in treasury. Suzano’s market capitalization on the same date (ex-treasury shares) stood at R$57.1 billion. Free float in 2Q23 corresponded to 50% of total capital
Page 36 of 46
As disclosed in the Notice to the Market on July 7th, Suzano concluded the share buyback program (“October 2022 Program”), repurchasing 20 million shares at an average price of R$44.02/share, amounting to R$880 million at market value.
FIXED INCOME
| Unit | Jun/23 | Mar/23 | Jun/22 | Δ Q-o-Q | Δ Y-o-Y | |
| Fibria 2025 – Price | USD/k | 97.08 | 97.43 | 99.32 | 0% | -2% |
| Fibria 2025 – Yield | % | 6.03 | 5.53 | 4.29 | 9% | 41% |
| Suzano 2026 – Price | USD/k | 100.12 | 100.44 | 102.23 | 0% | -2% |
| Suzano 2026 – Yield | % | 5.71 | 5.60 | 5.13 | 2% | 11% |
| Fibria 2027 – Price | USD/k | 100.20 | 100.55 | 99.31 | 0% | 1% |
| Fibria 2027 – Yield | % | 5.44 | 5.34 | 5.67 | 2% | -4% |
| Suzano 2028 – Price | USD/k | 85.19 | 85.58 | 81.57 | 0% | 4% |
| Suzano 2028 – Yield | % | 5.85 | 5.61 | 6.12 | 4% | -4% |
| Suzano 2029 – Price | USD/k | 99.22 | 100.67 | 99.24 | -1% | 0% |
| Suzano 2029 – Yield | % | 6.17 | 5.86 | 6.14 | 5% | 0% |
| Suzano 2030 – Price | USD/k | 93.35 | 95.31 | 92.01 | -2% | 1% |
| Suzano 2030 – Yield | % | 6.26 | 5.85 | 6.35 | 7% | -1% |
| Suzano 2031 – Price | USD/k | 85.16 | 86.89 | 81.33 | -2% | 5% |
| Suzano 2031 – Yield | % | 6.25 | 5.87 | 6.66 | 6% | -6% |
| Suzano 2032 – Price | USD/k | 79.98 | 81.84 | 75.66 | -2% | 6% |
| Suzano 2032 – Yield | % | 6.18 | 5.79 | 6.61 | 7% | -6% |
| Suzano 2047 – Price | USD/k | 101.04 | 102.09 | 95.44 | -1% | 6% |
| Suzano 2047 – Yield | % | 6.91 | 6.82 | 7.40 | 1% | -7% |
| Treasury 10 years | % | 3.84 | 3.47 | 3.01 | 11% | 27% |
Note: Senior Notes issued with face value of 100 USD/k.
RATINGS
| Agency | National Scale | Global Scale | Outlook |
| Fitch Ratings | AAA | BBB- | Stable |
| Standard & Poor’s | br.AAA | BBB- | Stable |
| Moody’s | Aaa.br | Baa3 | Stable |
Page 37 of 46
UPCOMING EVENTS
Earnings Conference Call (2Q23)
Date: August 3, 2023 (Thursday)
| Portuguese (simultaneous translation) | English |
| 10:00 a.m. (Brasília) | 10:00 a.m. (Brasília) |
| 9:00 a.m. (New York) | 9:00 a.m. (New York) |
| 2:00 p.m. (London) | 2:00 p.m. (London) |
| Tel.: (+55) 11 4090 1621 | Tel.: (+1) 844 204 8942 |
Please connect 10 minutes before the conference call is scheduled to begin.
The conference call will be held in English and feature a presentation, with simultaneous webcast. The access links will be available on the Company’s Investor Relations website (www.suzano.com.br/ri).
If you are unable to participate, the webcast link will be available for future consultation on the Investor Relations website of Suzano S.A.
IR CONTACTS
Marcelo Bacci
Camila Nogueira
Roberto Costa
Mariana Dutra
Luísa Puccini
Arthur Trovo
Tel.: +55 (11) 3503-9330
ri@suzano.com.br
www.suzano.com.br/ri
Page 38 of 46
APPENDICES
APPENDIX 1 – Operating Data


¹Paper of other manufacturers sold by Suzano and tissue paper.
Page 39 of 46


Page 40 of 46
APPENDIX 2 – Consolidated Statement of Income and Goodwill Amortization

1Excluding non-recurring items and PPA effects.

Page 41 of 46
APPENDIX 3 – Consolidated Balance Sheet

Page 42 of 46
APPENDIX 4 – Consolidated Statement of Cash Flow

Page 43 of 46
APPENDIX 5 – EBITDA
1The Company's EBITDA is calculated in accordance with CVM Instruction 527 of October 4, 2012.
Page 44 of 46
APPENDIX 6 – Segmented Income Statement

1Excluding non-recurring items and PPA effects.

1Excluding non-recurring items and PPA effects.
Page 45 of 46
Forward-Looking Statements
This release may contain forward-looking statements. Such statements are subject to known and unknown risks and uncertainties due to which such expectations may not happen at all or may substantially differ from what was expected. These risks include, among others, changes in future demand for the Company’s products, changes in factors affecting domestic and international product prices, changes in the cost structure, changes in the seasonal patterns of markets, changes in prices charged by competitors, foreign exchange variations, changes in the political or economic situation of Brazil, as well as emerging and international markets. The forward-looking statements were not reviewed by our independent auditors.
Page 46 of 46