Exhibit 99.1
| Earnings Conference Call 4Q 21 |
| Disclaimer 2 This presentation contains what are considered “forward - looking statements,” as defined in Section 27 A of the 1933 Securities Act and Section 21 E of the 1934 Securities Exchange Act, as amended .. Some of these forward - looking statements are identified with words such as “believe,” “may,” “could,” “would,” “possible,” “will,” “should,” “expect,” “intend,” “plan,” “anticipate,” “estimate,” “potential,” “outlook” or “continue,” as well as the negative forms of these words, other terms of similar meaning or the use of future dates .. The forward - looking statements include, without limitation, statements related to the declaration or payment of dividends, implementation of the key operational and financial strategies and investment plans, guidance about future operations and factors or trends that influence the financial situation, liquidity or operational results .. Such statements reflect the current view of the management and are subject to diverse risks and uncertainties .. These are qualified in accordance with the inherent risks and uncertainties involving future expectations in general, and actual results could differ materially from those currently anticipated due to various risks and uncertainties .. There is no guarantee that the expected events, trends or results will actually occur .. The statements are based on diverse assumptions and factors, including general economic and market conditions, industry conditions and operating factors .. Any changes in such assumptions or factors could cause actual results to differ materially from current expectations .. Suzano does not undertake any obligation to update any such forward - looking statements as a result of new information, future events or otherwise, except as expressly required by law .. All forward - looking statements in this presentation are covered in their entirety by this disclaimer .. In addition, this presentation contains some financial indicators that are not recognized by the BR GAAP or IFRS .. These indicators do not have a standard meaning and may not be comparable to indicators with a similar description used by other companies .. We provide these indicators because we use them as measurements of Suzano's performance ; they should not be considered separately or as a replacement for other financial metrics that have been disclosed in accordance with BR GAAP or IFRS .. |
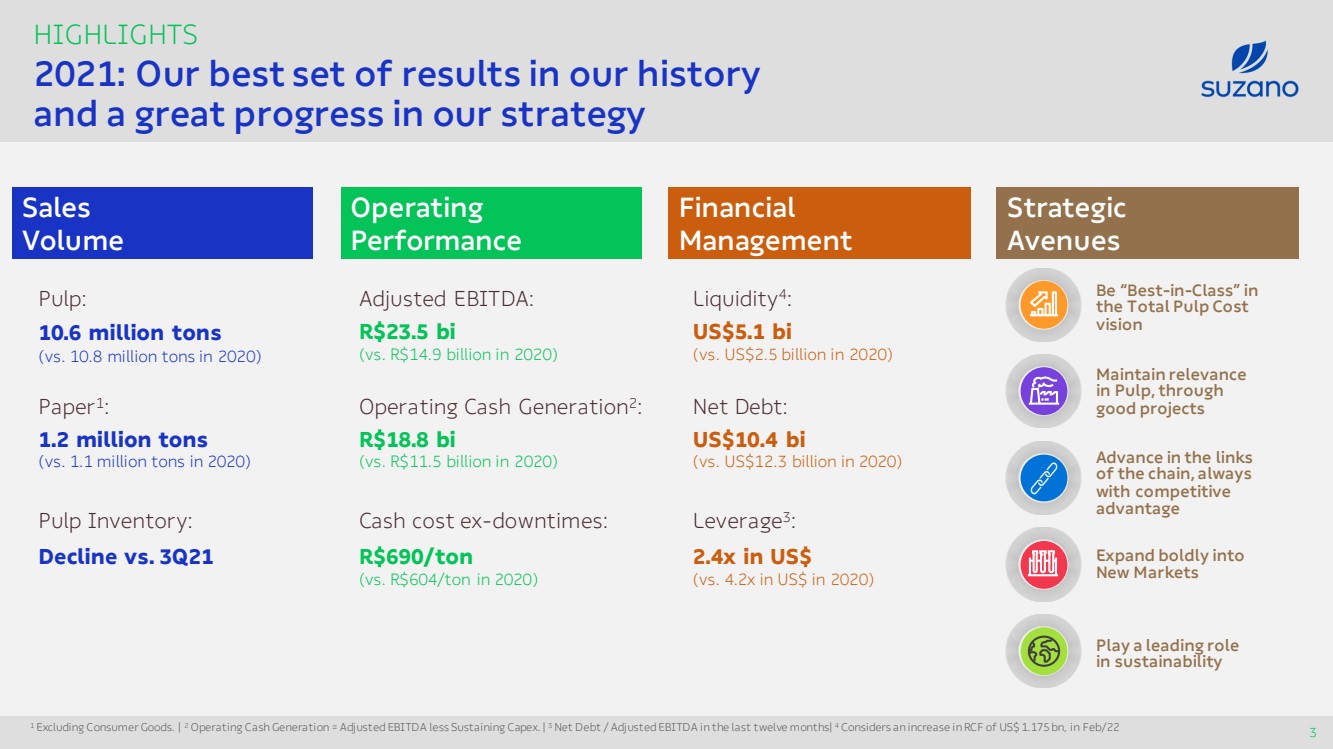
| 2021: Our best set of results in our history and a great progress in our strategy 3 HIGHLIGHTS Paper 1 : Adjusted EBITDA: Liquidity 4 : 1 Excluding Consumer Goods .. | 2 Operating Cash Generation = Adjusted EBITDA less Sustaining Capex .. | 3 Net Debt / Adjusted EBITDA in the last twelve months | 4 Considers an increase in RCF of US$ 1.175 bn , in Feb /22 Be “Best - in - Class” in the Total Pulp Cost vision Maintain relevance in Pulp, through good projects Advance in the links of the chain, always with competitive advantage Expand boldly into New Markets Play a leading role in sustainability Sales Volume Financial Management Operating Performance Strategic Avenues Pulp : 10.6 million tons (vs. 10.8 million tons in 20 20) Pulp Inventory : Decline vs. 3Q21 1.2 million tons (vs. 1 ..1 million tons in 20 20) Operating Cash Generation 2 : Cash cost ex - downtimes : R$23.5 bi (vs. R$ 14.9 billion in 2020) R$18.8 bi (vs. R$ 11.5 billion in 2020 ) R$690/ ton (vs. R$ 604 / ton in 2020 ) Net Debt : Leverage 3 : US$5.1 bi (vs. US$2.5 billion in 2020) US$10.4 bi (vs. US$12.3 billion in 2020) 2.4x in US$ (vs. 4.2x in US$ in 2020) |
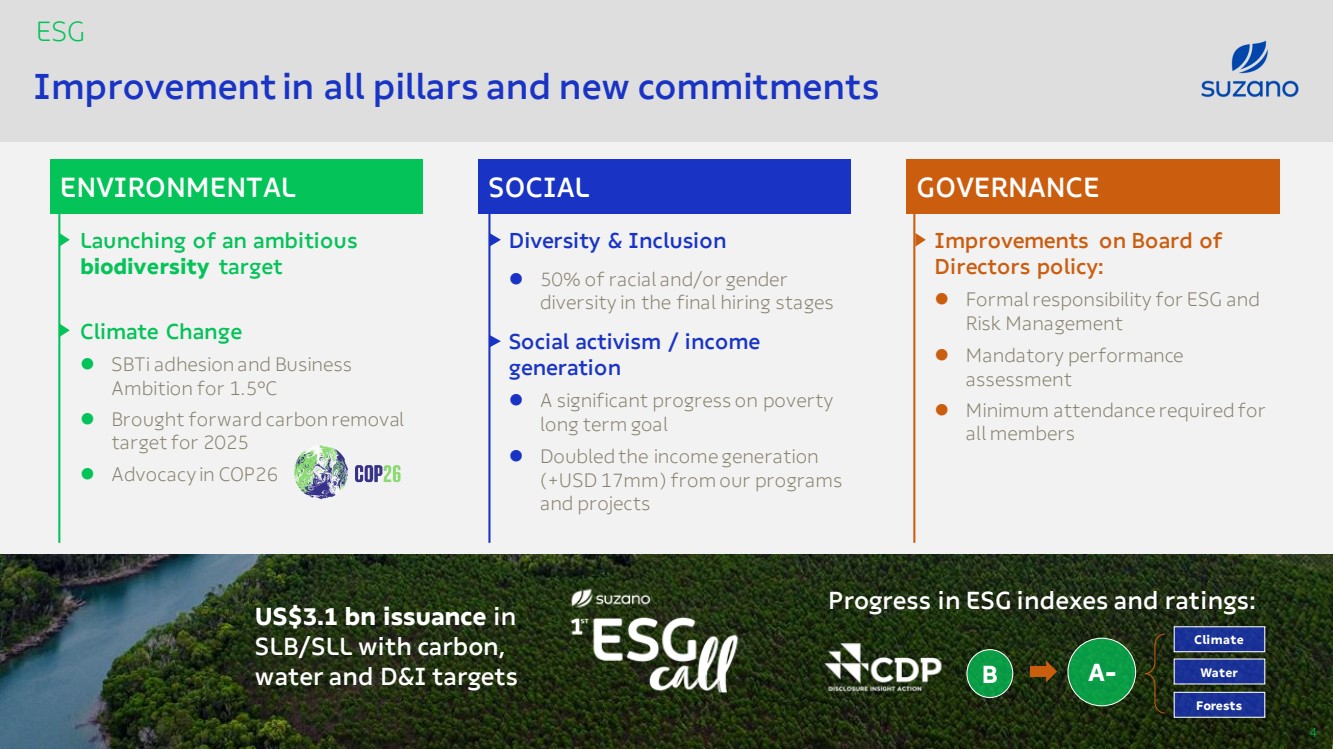
| Launching of an ambitious biodiversity target Climate Change ⚫ SBTi adhesion and Business Ambition for 1.5ºC ⚫ Brought forward carbon removal target for 2025 ⚫ Advocacy in COP26 Progress in ESG indexes and ratings: Improvement in all pillars and new commitments ESG ENVIRONMENTAL GOVERNANCE SOCIAL Diversity & Inclusion ⚫ 50% of racial and / or gender diversity in the final hiring stages Social activism / income generation ⚫ A significant progress on poverty long term goal ⚫ Doubled the income generation (+USD 17mm) from our programs and projects Improvements on Board of Directors policy : ⚫ Formal responsibility for ESG and Risk Management ⚫ Mandatory performance assessment ⚫ Minimum attendance required for all members US$3.1 bn issuance in SLB/SLL with carbon , water and D&I targets B A - 4 Climate Water Forests |
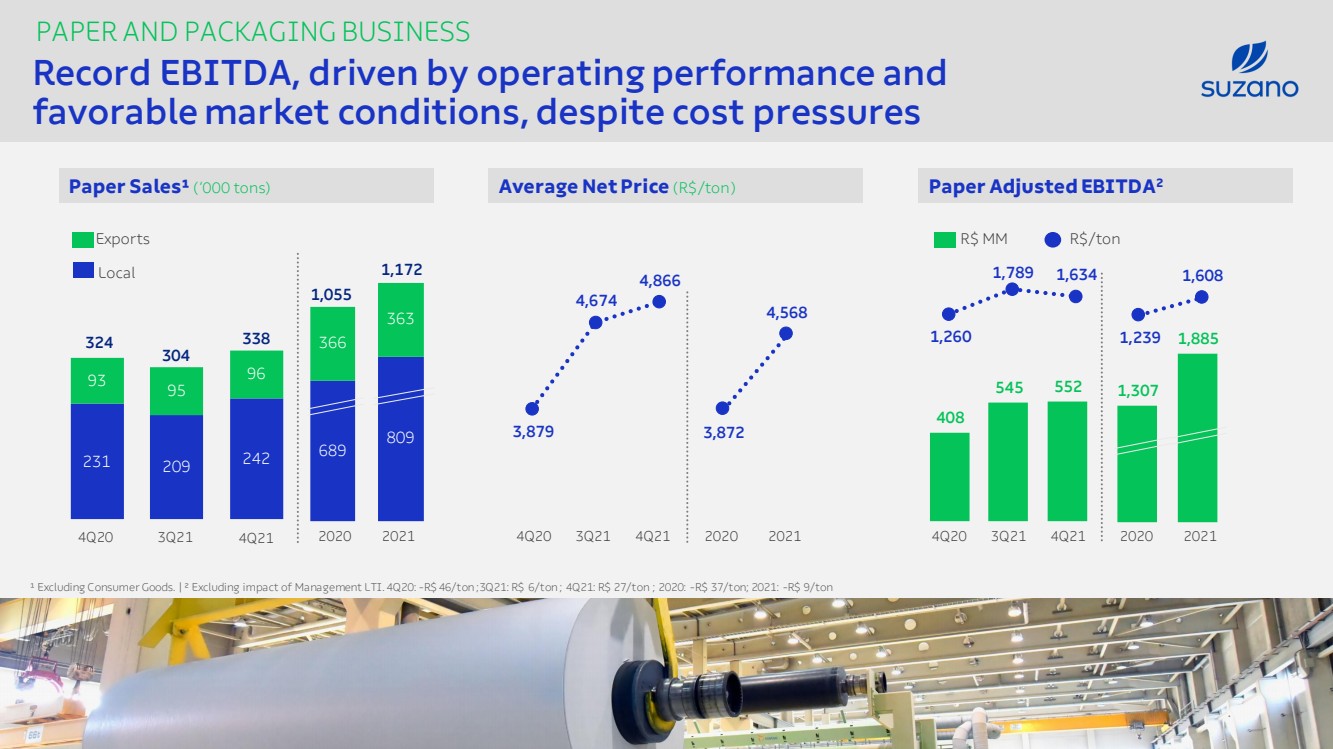
| PAPER AND PACKAGING BUSINESS ¹ Excluding Consumer Goods .. | ² Excluding impact of Management LTI. 4Q20: - R$ 46/ ton ;3Q21: R$ 6/ ton ; 4Q21: R$ 27/ ton ; 2020: - R$ 37/ ton ; 2021: - R$ 9/ ton Paper Sales¹ (‘000 tons) 4Q20 3Q21 4Q21 Exports Local 231 209 242 93 95 96 689 809 366 363 2020 2021 324 304 338 1,055 1,172 Average Net Price (R$/ ton ) 4Q20 3Q21 4Q21 2020 2021 Paper Adjusted EBITDA 2 3,879 4,674 4,866 3,872 4,568 4Q20 3Q21 4Q21 2020 2021 1,260 1,789 1,634 1,239 1,608 408 545 552 Record EBITDA, driven by operating performance and favorable market conditions , despite cost pressures 5 1,307 1,885 R$ MM R$/ ton |
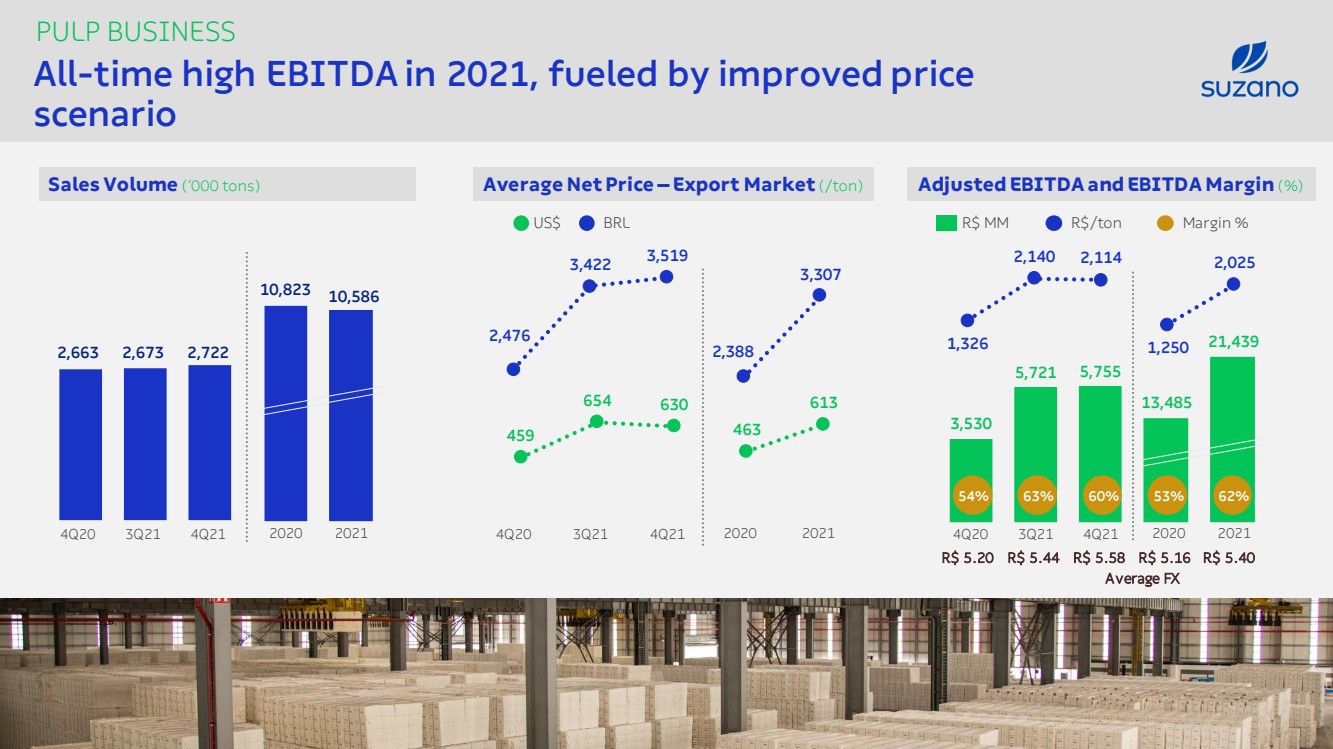
| PULP BUSINESS Sales Volume (‘000 tons) 4Q20 3Q21 4Q21 2020 2021 Average Net Price – Export Market (/ ton ) 4Q20 3Q21 4Q21 2020 2021 Adjusted EBITDA and EBITDA Margin (%) 13,485 21,439 10,823 10,586 2,722 2,673 2,663 US$ BRL 3,530 5,721 5,755 4Q20 3Q21 4Q21 2020 2021 Average FX R$ 5.20 R$ 5.44 R$ 5.58 R$ 5.40 R$ 5.16 All - time high EBITDA in 2021, fueled by improved price scenario 6 54% 60% 53% 62% 63% R$ MM R$/ ton Margin % 1,326 2,140 2,114 1,250 2,025 2,476 3,422 3,519 2,388 3,307 459 654 630 463 613 |
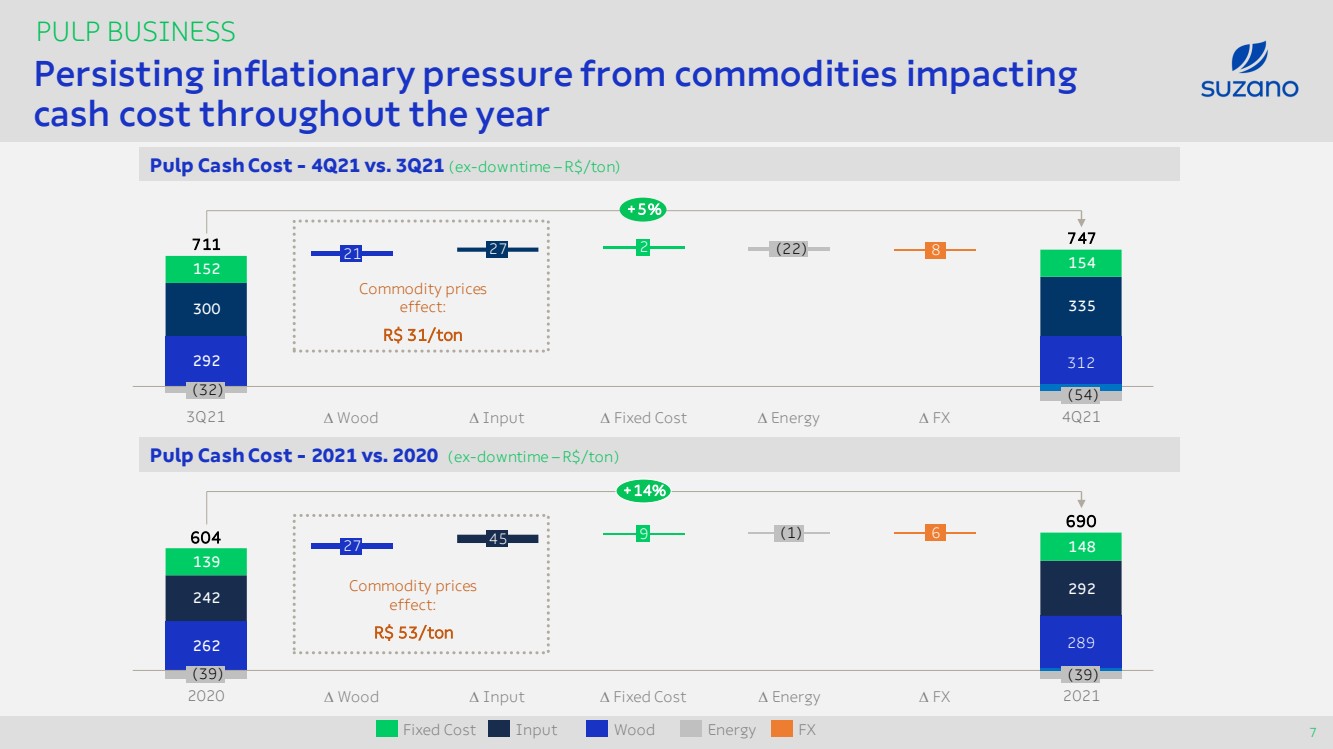
| 262 242 292 139 148 292 300 335 152 154 PULP BUSINESS Pulp Cash Cost - 4Q21 vs. 3Q21 ( ex - downtime – R$/ ton ) Pulp Cash Cost - 2021 vs. 2020 ( ex - downtime – R$/ ton ) Persisting inflationary pressure from commodities impacting cash cost throughout the year 7 4Q21 Input 27 747 312 (32) Wood 3Q21 21 2 Fixed Cost (22) Energy 8 FX (54) 711 +5% Commodity prices effect : R$ 31/ ton Commodity prices effect : R$ 53/ ton 45 (39) Wood 2020 9 27 Fixed Cost Input 2021 6 (1) Energy FX 604 289 (39) 690 +14% FX Fixed Cost Input Energy Wood |
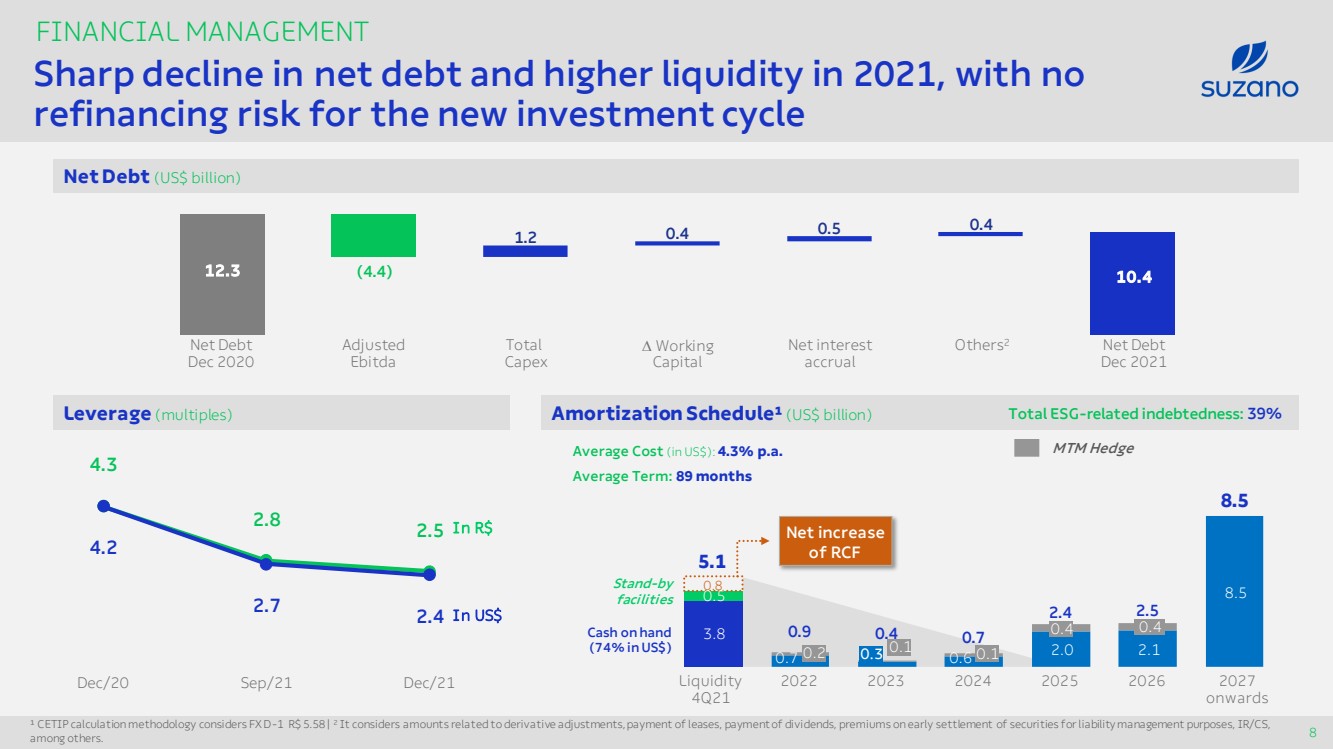
| FINANCIAL MANAGEMENT Net Debt (US$ billion ) Sharp decline in net debt and higher liquidity in 2021, with no refinancing risk for the new investment cycle 8 4.3 2.8 2.5 4.2 2.7 2.4 Sep /21 Dec /20 Dec /21 In R$ In US$ ¹ CETIP calculation methodology considers FX D - 1 R$ 5.58 | 2 It considers amounts related to derivative adjustments, payment of leases, payment of dividends, premiums on early settlement of securities for liability management purposes, IR/CS, among others. Amortization Schedule¹ (US$ billion ) Average Cost (in US$): 4.3% p.a .. Average Term : 89 months Cash on hand (74% in US$) Total ESG - related indebtedness : 39% 3.8 0.7 0.6 2.0 2.1 8.5 0.5 0.4 0.8 Liquidity 4Q21 2022 0.3 2023 2024 2.5 0.4 2025 2026 2027 on wards 5.1 0.9 0.4 2.4 0.7 8.5 0.2 0.1 0.1 MTM Hedge Net increase of RCF Stand - by facilities Leverage ( multiples ) 12.3 10.4 1.2 0.4 0.5 0.4 Total Capex Net Debt Dec 2021 Working Capital Net Debt Dec 2020 (4.4) Adjusted Ebitda Net interest accrual Others 2 |
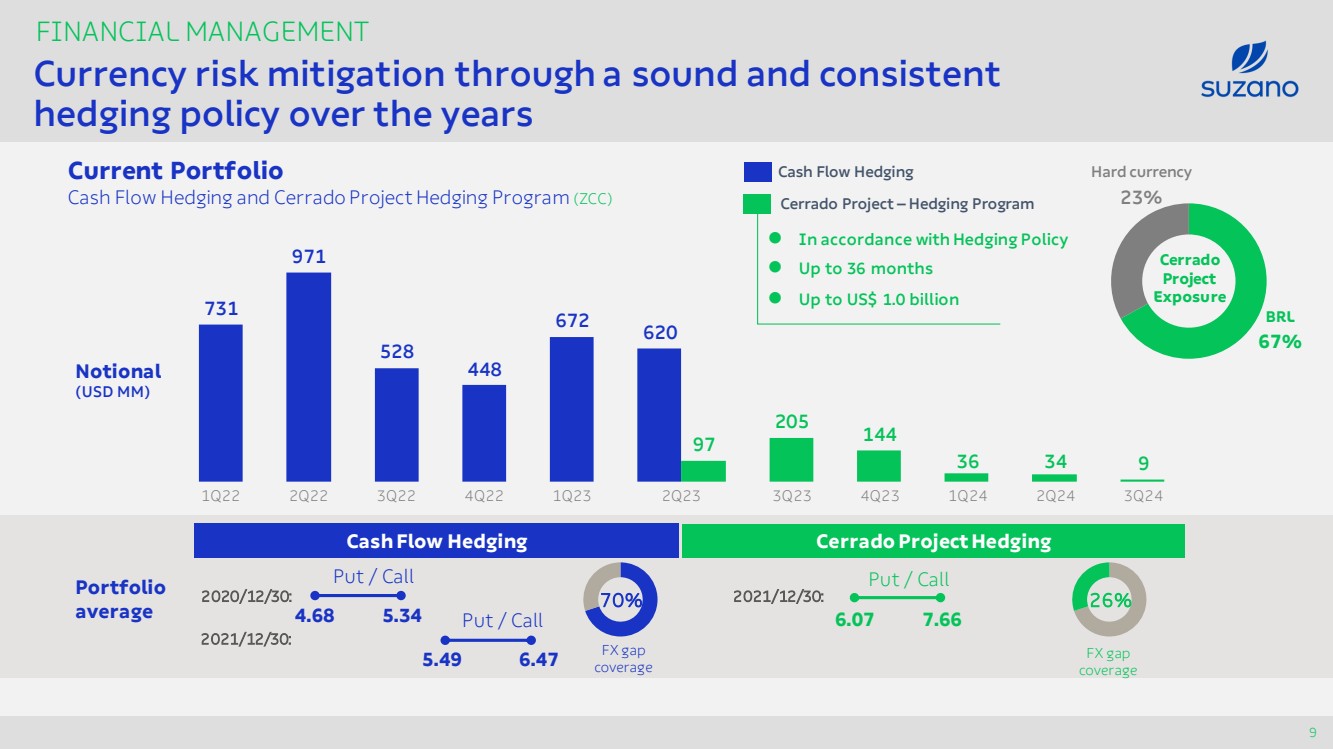
| 731 971 528 448 672 620 97 205 144 FINANCIAL MANAGEMENT Currency risk mitigation through a sound and consistent hedging policy over the years 9 Cash Flow Hedging Cerrado Project – Hedging Program Current Portfolio Cash Flow Hedging and Cerrado Project Hedging Program (ZCC) Notional (USD MM) 2Q22 1Q23 1Q22 3Q22 4Q22 2Q23 3Q23 4Q23 1Q24 2Q24 3Q24 34 9 36 Cerrado Project Exposure Cash Flow Hedging Cerrado Project Hedging 2020/12/30: 2021/12/30: 4.68 5.34 Put / Call Put / Call 5.49 6.47 2021/12/30: Put / Call 6. 07 7.66 Portfolio average BRL 67% ⚫ In accordance with Hedging Policy ⚫ Up to 36 months ⚫ Up to US$ 1.0 billion 70% FX gap coverage 26 % FX gap coverage Hard currency 23% |
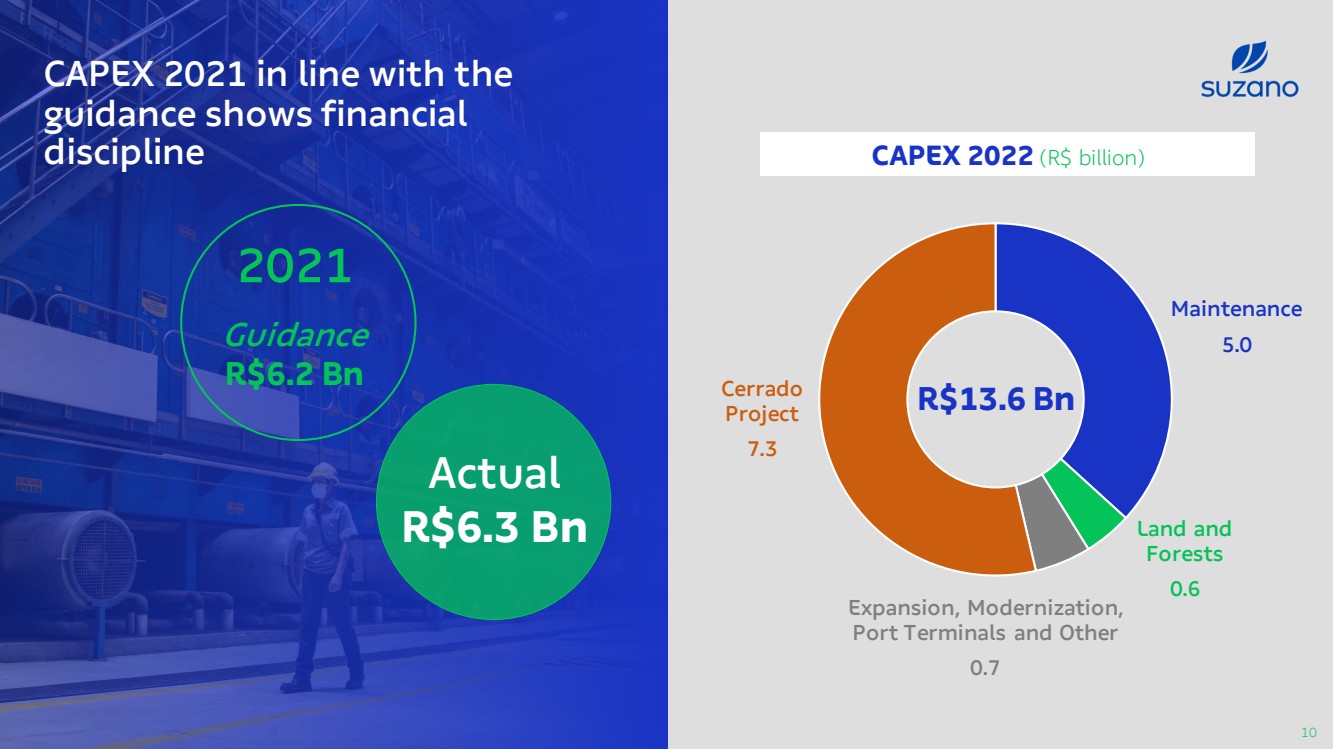
| 10 CAPEX 2021 Maintenance 5.0 Land and Forests 0.6 Expansion, Modernization, Port Terminals and Other 0.7 Cerrado Project 7.3 CAPEX 2022 (R$ billion ) R$13.6 Bn 2021 Guidance R$6.2 Bn CAPEX 2021 in line with the guidance shows financial discipline Actual R$6.3 Bn |
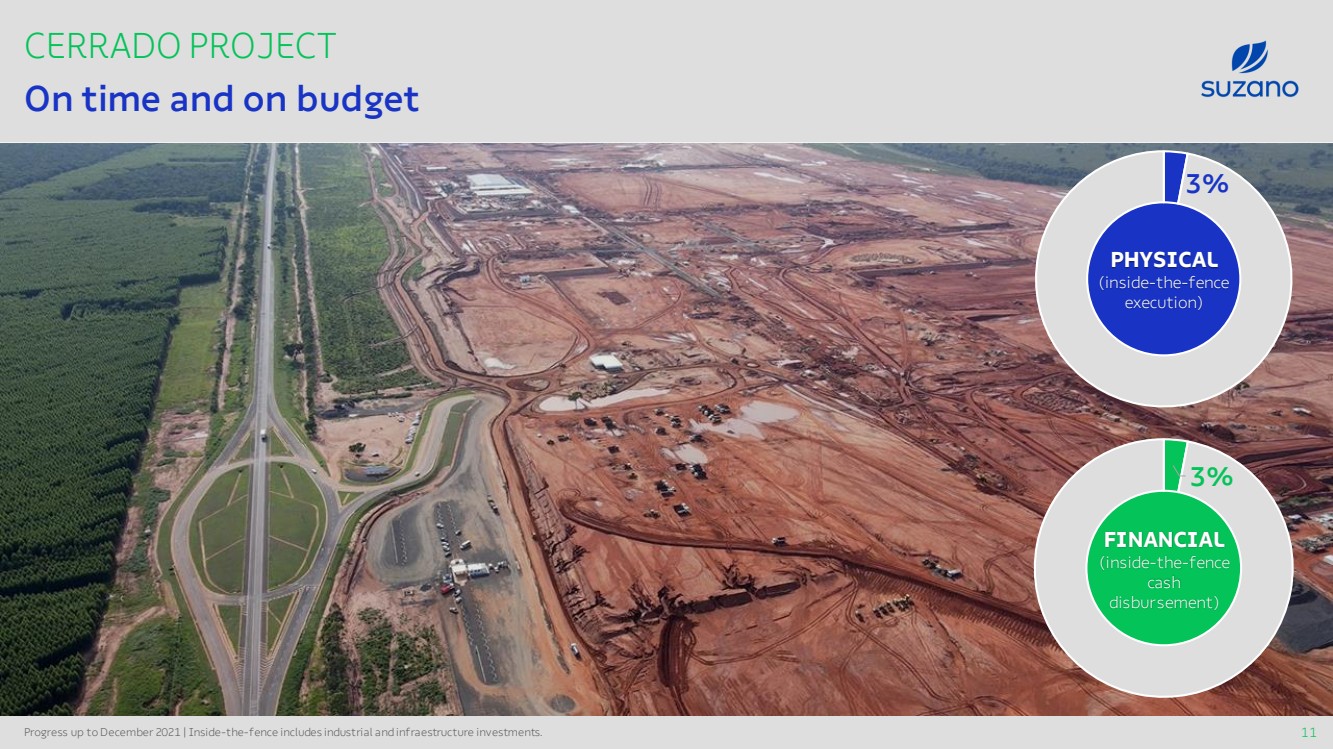
| CERRADO PROJECT On time and on budget 11 3% FINANCIAL ( inside - the - fence cash disbursement ) PHYSICAL ( inside - the - fence execution ) 3% Progress up to December 2021 | Inside - the - fence includes industrial and infraestructure investments .. |
| 2021 Takeaways 12 ⚫ Record operating results , despite persistent inflationary pressure and logistics restrictions ⚫ Strong balance sheet provides no refinancing risk for the new investment cycle ⚫ Significant advances in the ESG agenda , with new commitments and ambitions ⚫ Progress on strategic avenues, notably the Cerrado Project, which is on time and on budget Save the date Suzano Day 2022 March , 30 th , 2022 |
| Q&A 4Q 21 Investor Relations www.suzano.com.br/ri ri@suzano.com |