Exhibit 99.1
| SUZANO DAY 2022 |
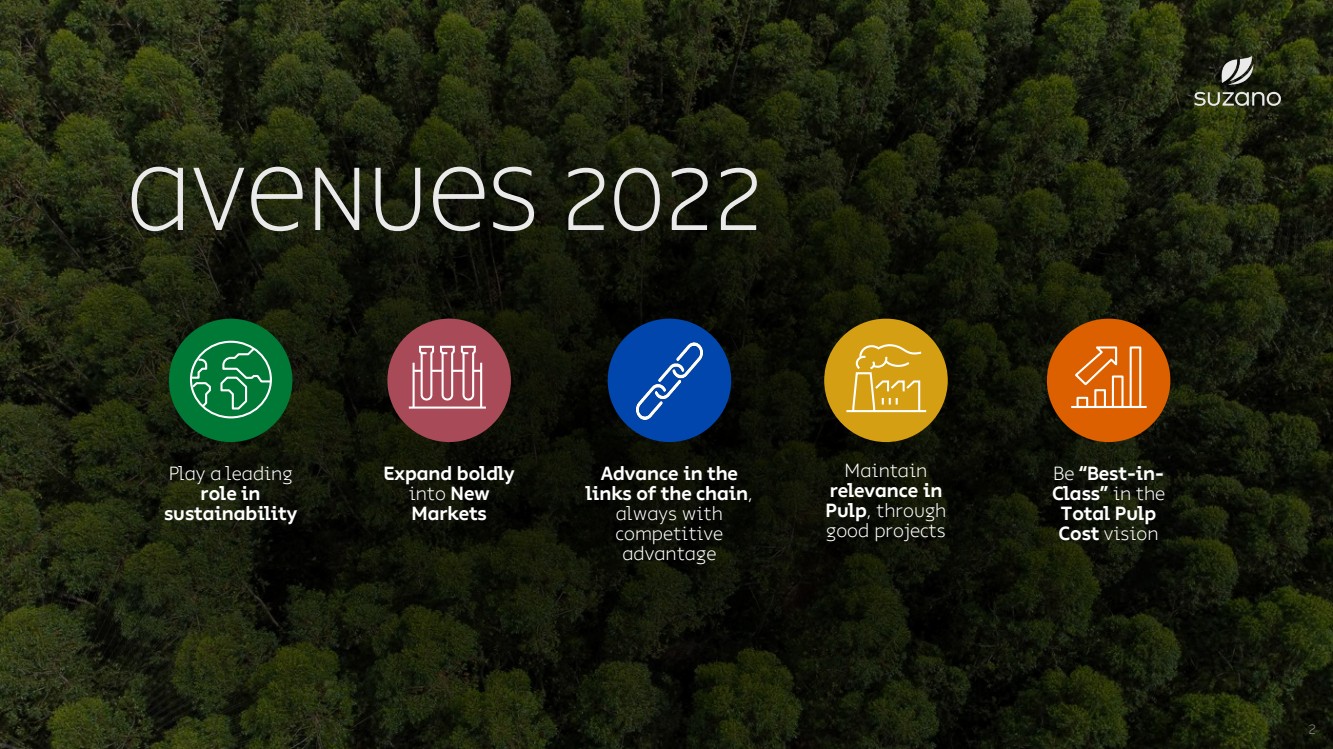
| 2 Play a leading role in sustainability Be“Best-in-Class”in the Total Pulp Cost vision Advance in the links of the chain, always with competitive advantage Maintain relevance in Pulp, through good projects Expand boldly intoNew Markets AVENUES 2022 |
| Play a leading role in sustainability 3 |
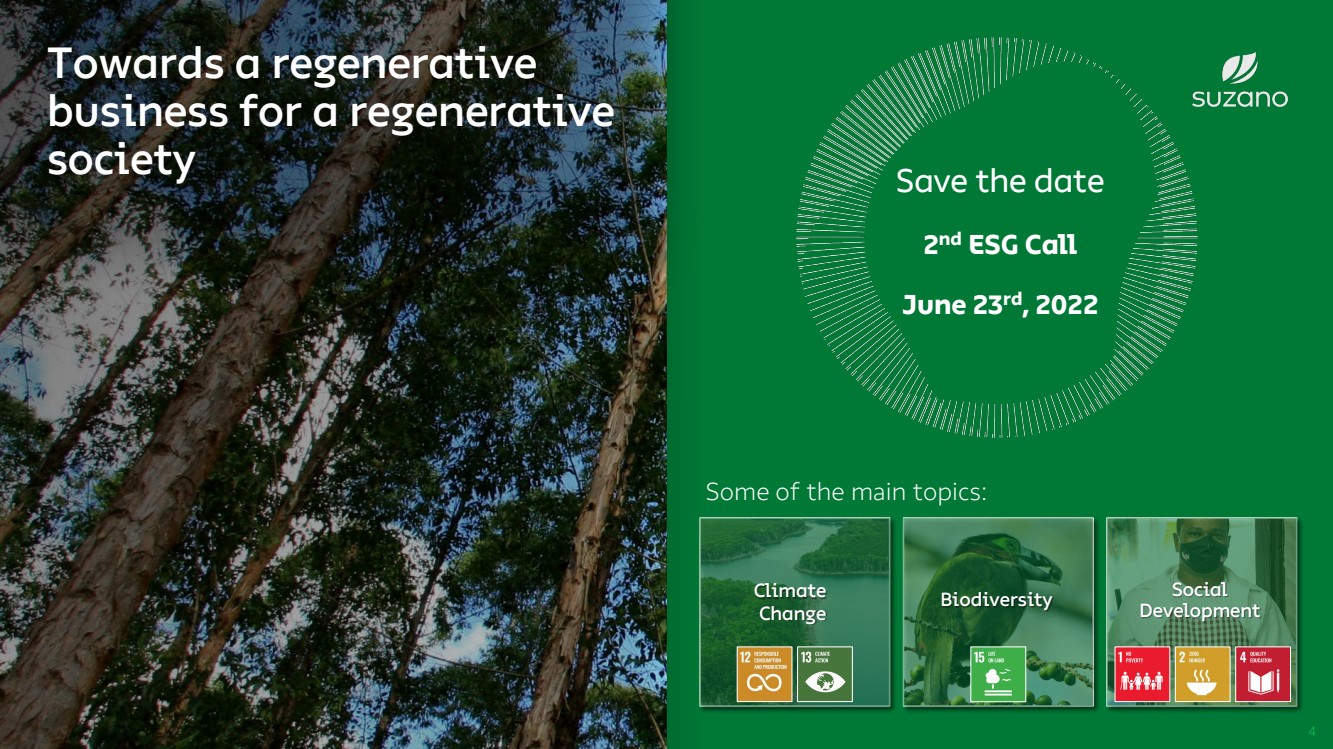
| Some of the main topics:Savethedate2ndESG CallJune23rd, 2022 Towards a regenerative business for a regenerative society Climate Change Biodiversity Social Development 4 |
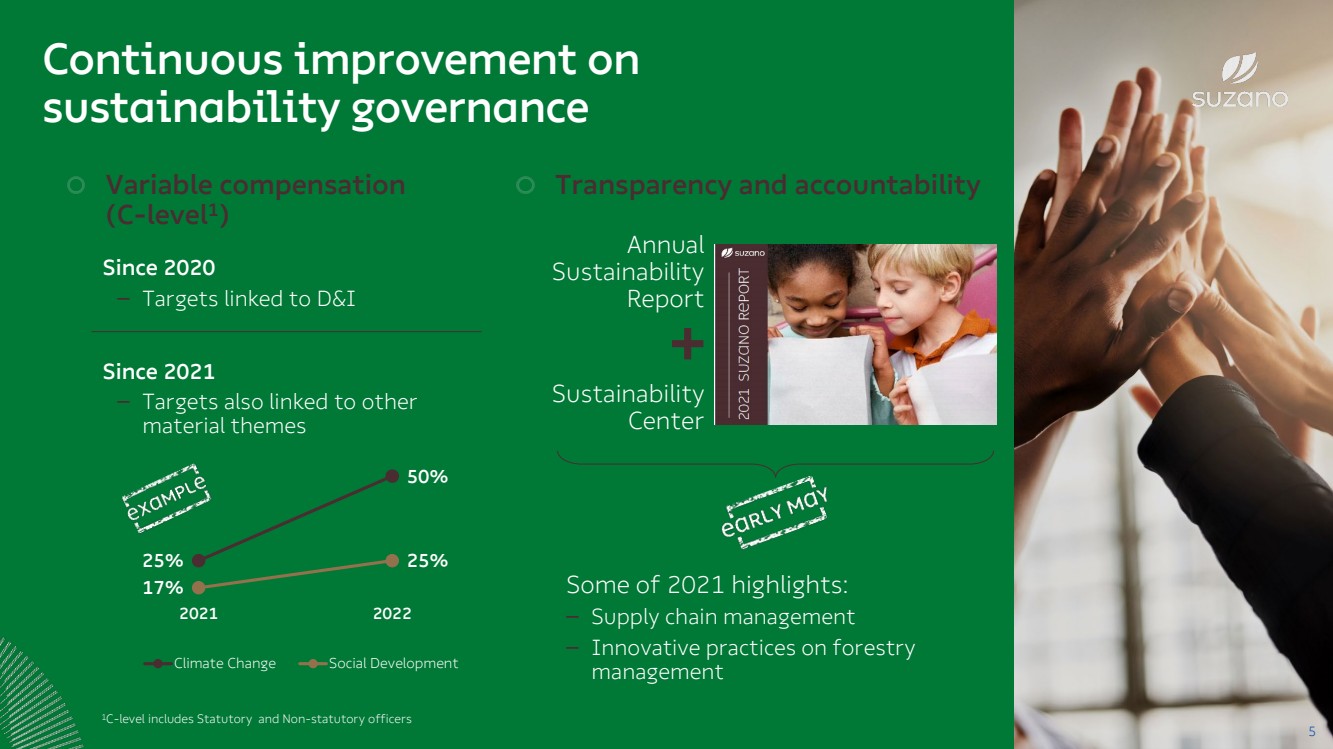
| Continuousimprovementonsustainabilitygovernance5 Variable compensation(C-level1) Since2020–Targets linked to D&ISince 2021 –Targets also linked to other material themes 25%50%17%25%20212022 Climate Change Social Development1C-level includes Statutory and Non-statutory officers Some of 2021 highlights:–Supply chain management–Innovative practices on forestry management Transparency and accountabilityAnnual SustainabilityReport Sustainability Center |
| Expand boldly into New Markets 6 |
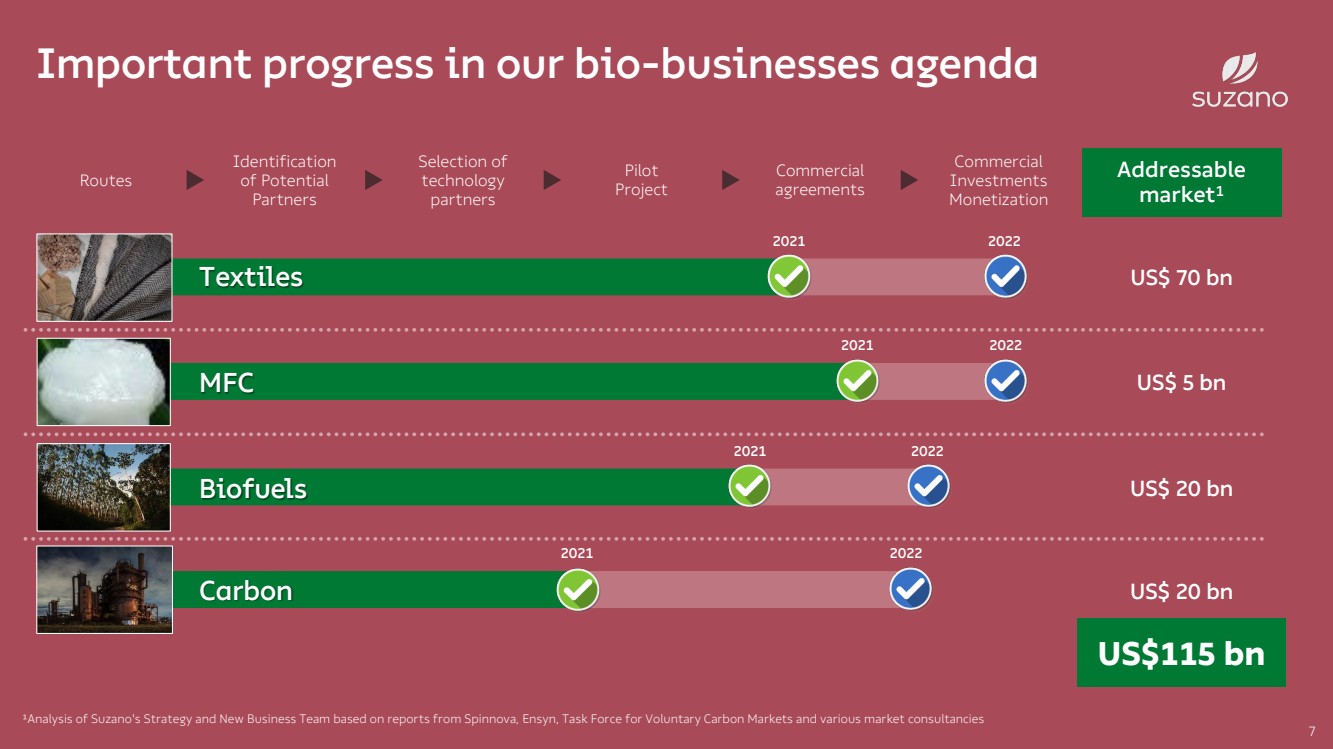
| 2022202220222022 Important progress in our bio-businesses agenda7IdentificationofPotentialPartnersSelection of technology partnersPilotProjectCommercialagreementsCommercialInvestmentsMonetizationRoutes 2021 ¹Analysis of Suzano'sStrategy and New Business Team based on reports from Spinnova, Ensyn, Task Force for Voluntary Carbon Markets and various market consultancies 202120212021 Textiles MFC Bio f uels Carbon US$115 bn Addressablemarket1US$ 70 bnUS$ 5 bnUS$ 20 bnUS$ 20 bn |
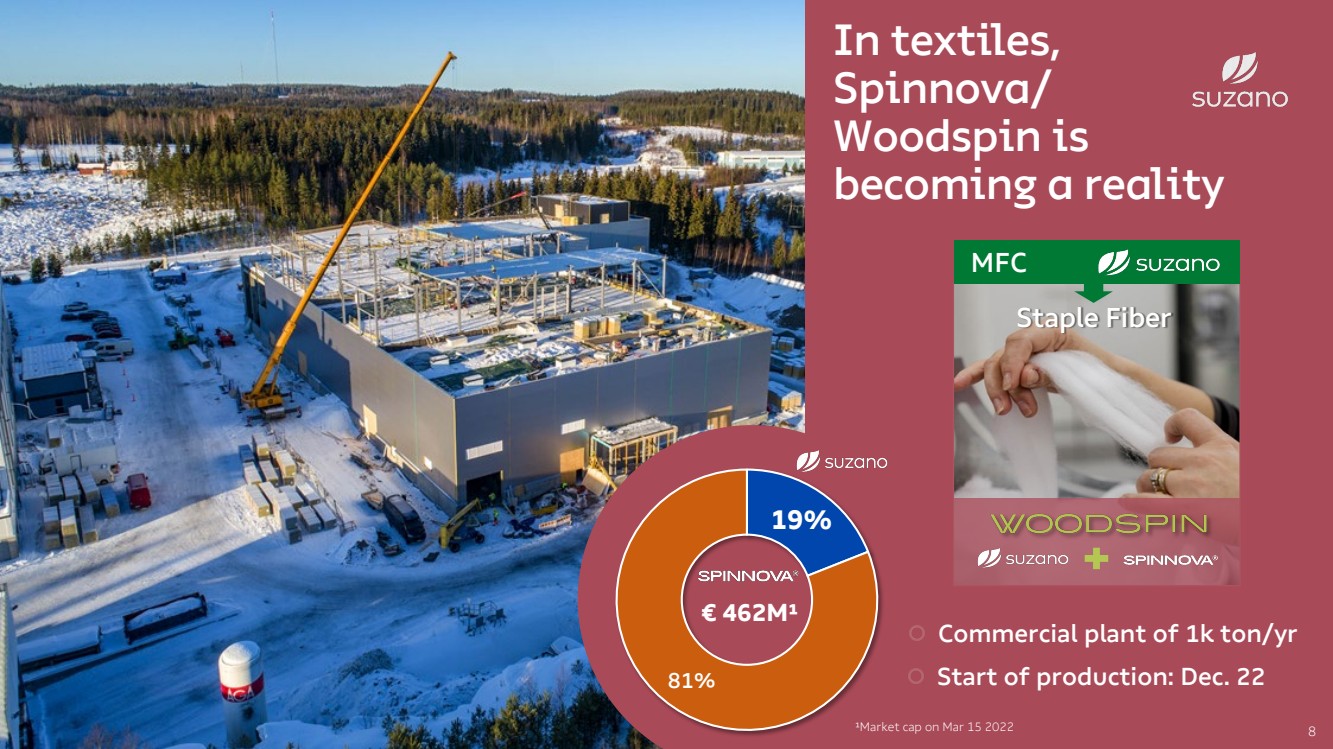
| In textiles, Spinnova/Woodspinis becoming a reality Commercial plant of 1k ton/yr8 19%81%€ 462M¹¹Market caponMar 15 2022 Staple Fiber MFC Start of production: Dec. 22 |
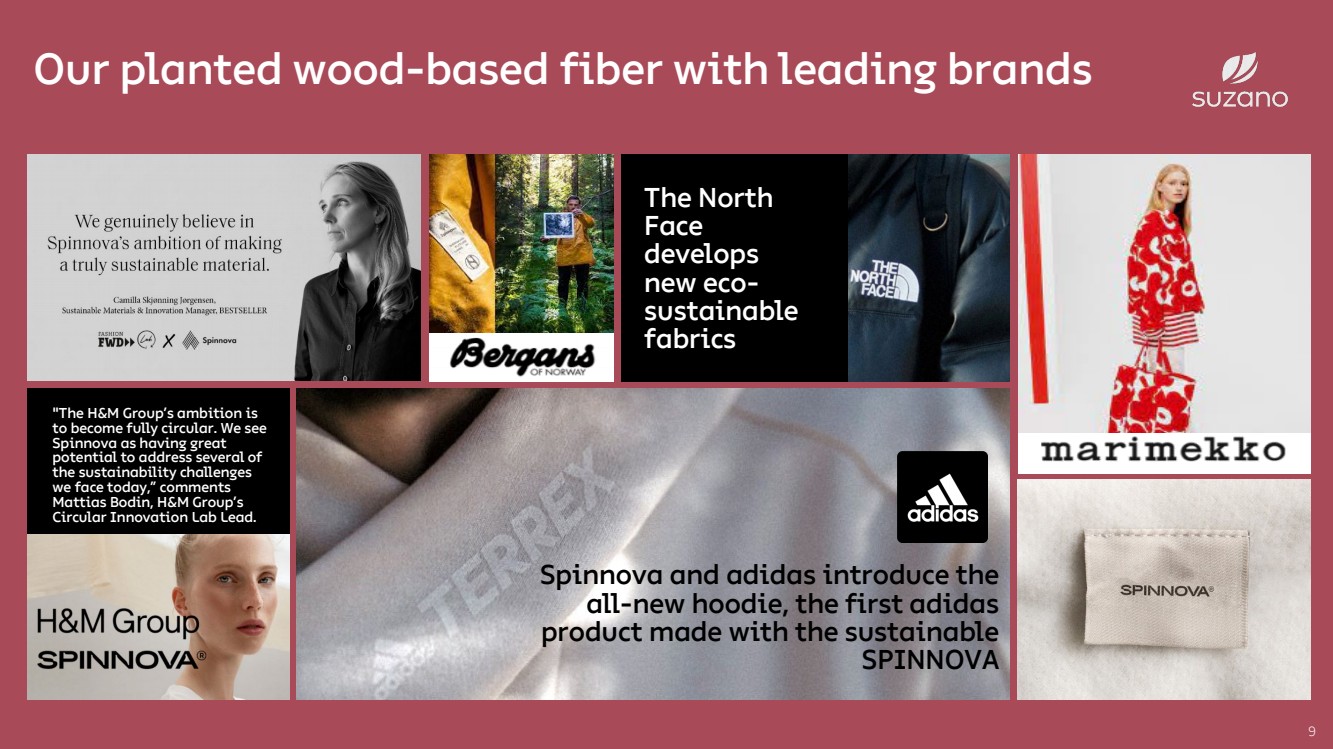
| The North Face develops new eco-sustainablefabricsOur planted wood-based fiber with leading brands9 Spinnovaand adidas introduce the all-new hoodie, the first adidas product made with the sustainable SPINNOVA "The H&M Group’s ambition is to become fully circular. We see Spinnovaas having great potential to address several of the sustainability challenges we face today,” comments Mattias Bodin, H&M Group’s Circular Innovation Lab Lead. |
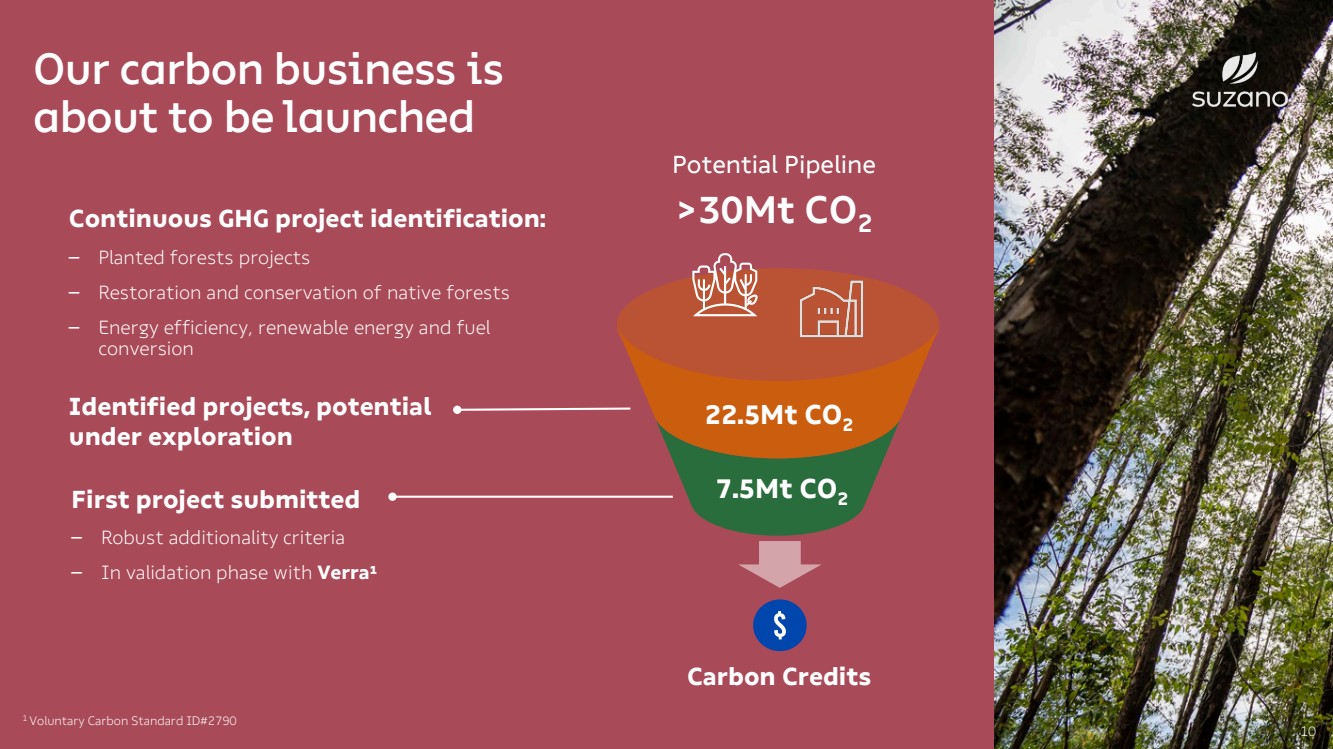
| Our carbon business is about to be launched10 Continuous GHG projectidentification:–Planted forests projects–Restoration and conservation of native forests–Energy efficiency, renewable energy and fuel conversionFirst project submitted –Robust additionality criteria–In validationphasewithVerra¹CarbonCredits1 Voluntary Carbon Standard ID#2790Identified projects, potential under exploration 22.5Mt CO27.5Mt CO2PotentialPipeline >30Mt CO2 |
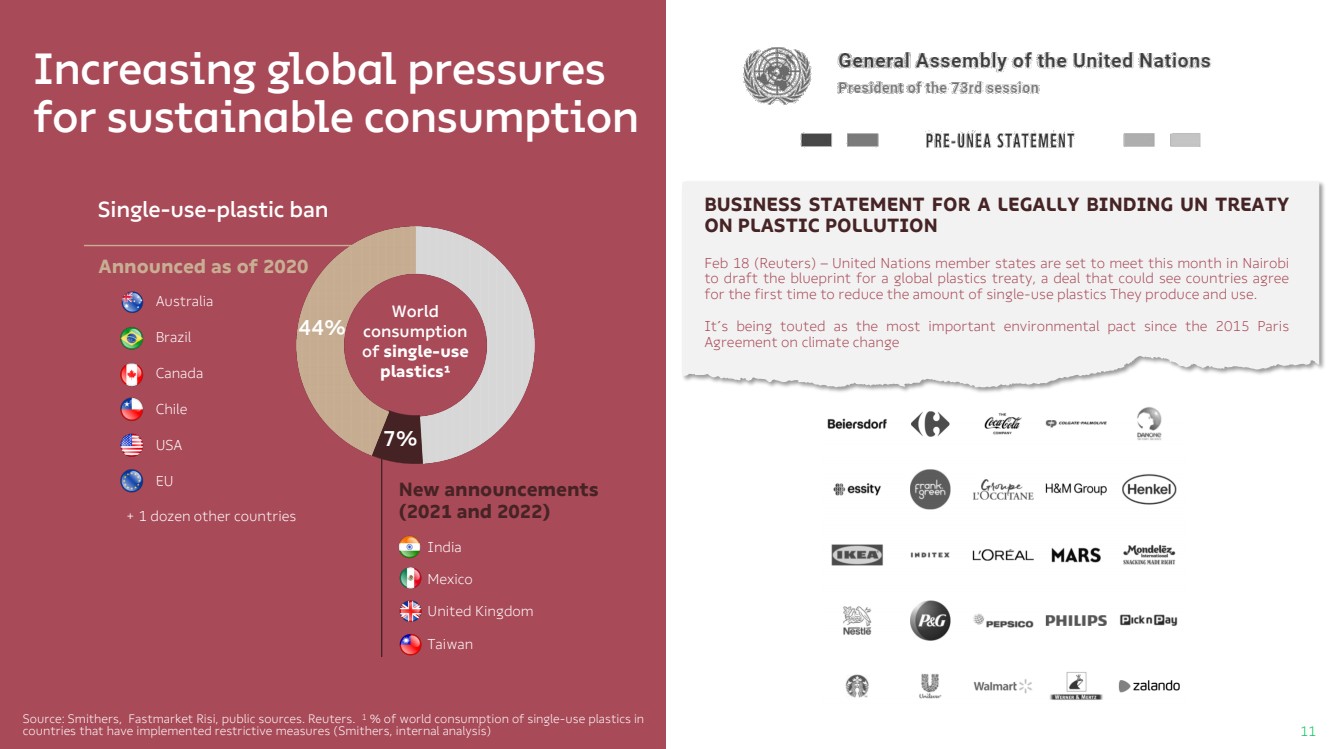
| Increasing global pressures for sustainable consumptionSingle-use-plasticban 7%44%Announcedas of2020New announcements (2021 and 2022)AustraliaBrazilCanadaChile USAEU+ 1dozenothercountriesWorld consumption of single-use plastics¹India MexicoUnited KingdomTaiwan Source: Smithers,FastmarketRisi, public sources. Reuters. 1% of world consumption of single-use plastics in countries that have implemented restrictive measures (Smithers, internal analysis) Feb18(Reuters)–UnitedNationsmemberstatesaresettomeetthismonthinNairobitodrafttheblueprintforaglobalplasticstreaty,adealthatcouldseecountriesagreeforthefirsttimetoreducetheamountofsingle-useplasticsTheyproduceanduse.It´sbeingtoutedasthemostimportantenvironmentalpactsincethe2015ParisAgreementonclimatechangeBUSINESSSTATEMENTFORALEGALLYBINDINGUNTREATYONPLASTICPOLLUTION11 |
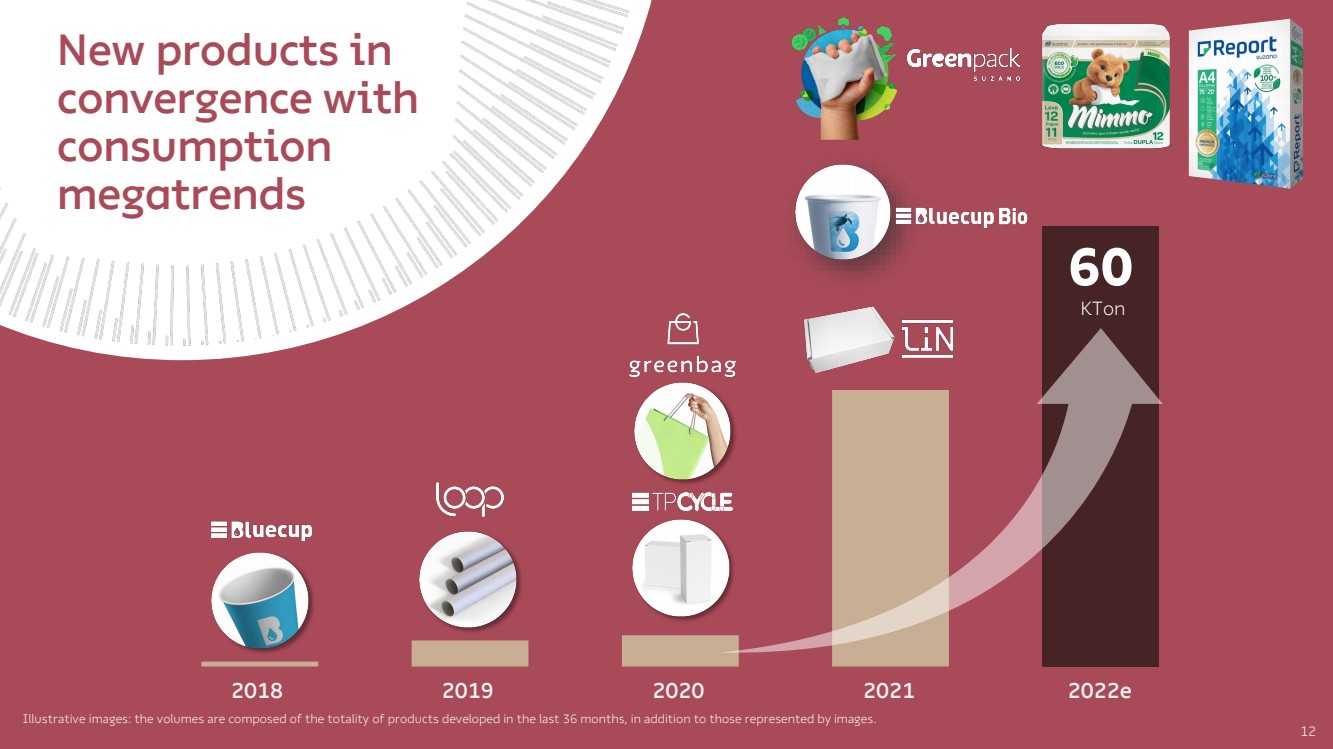
| 12 60 20182019202020212022eKTonNew products in convergence with consumption megatrends Illustrative images: the volumes are composed of the totality of products developed in the last 36 months, in addition to those represented by images. |
| Advance in the links of the chain, always with competitive advantage 13 |
| 14 Tissue Packaging Fluff Paper |

| 15 Tissue |

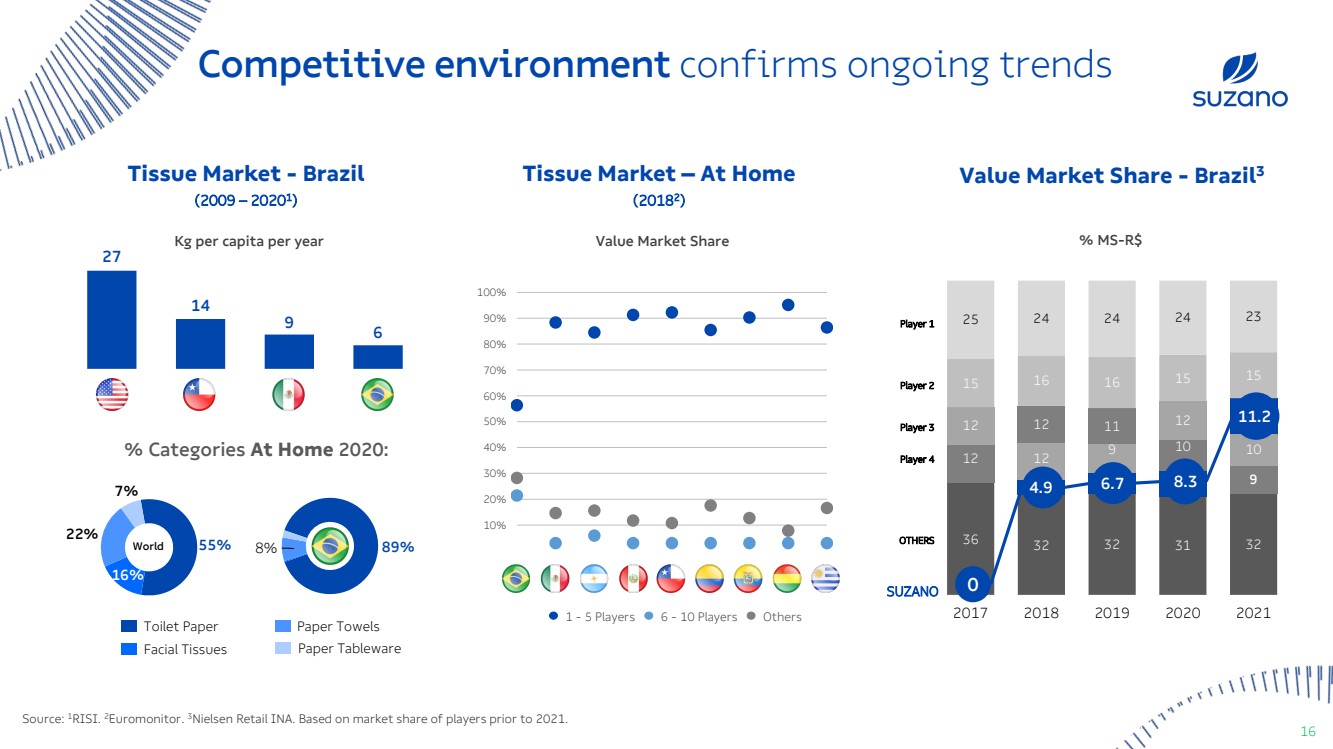
| Competitive environment confirms ongoing trendsTissueMarket -Brazil (2009 – 2020 1 ) 8%89%% CategoriesAt Home 2020:World 16%55%22%7%Source: 1RISI. 2Euromonitor. 3Nielsen Retail INA. Based on market share of players prior to 2021. PaperTowels ToiletPaper Facial Tissues PaperTablewareKg per capita per yearTissueMarket –At Home (2018 2 ) 10%20%30%50%40%60%70%80%90%100% 1 -5 Players6 -10 PlayersOthersValueMarket Share 271496 ValueMarket Share-Brazil3 SUZANO Player 2 Player 1 Player 3 Player 4 OTHERS % MS-R$ 363232313257912129101012121112111516161515252424242320172018201920202021 0 4.96.78.311.2 16 |
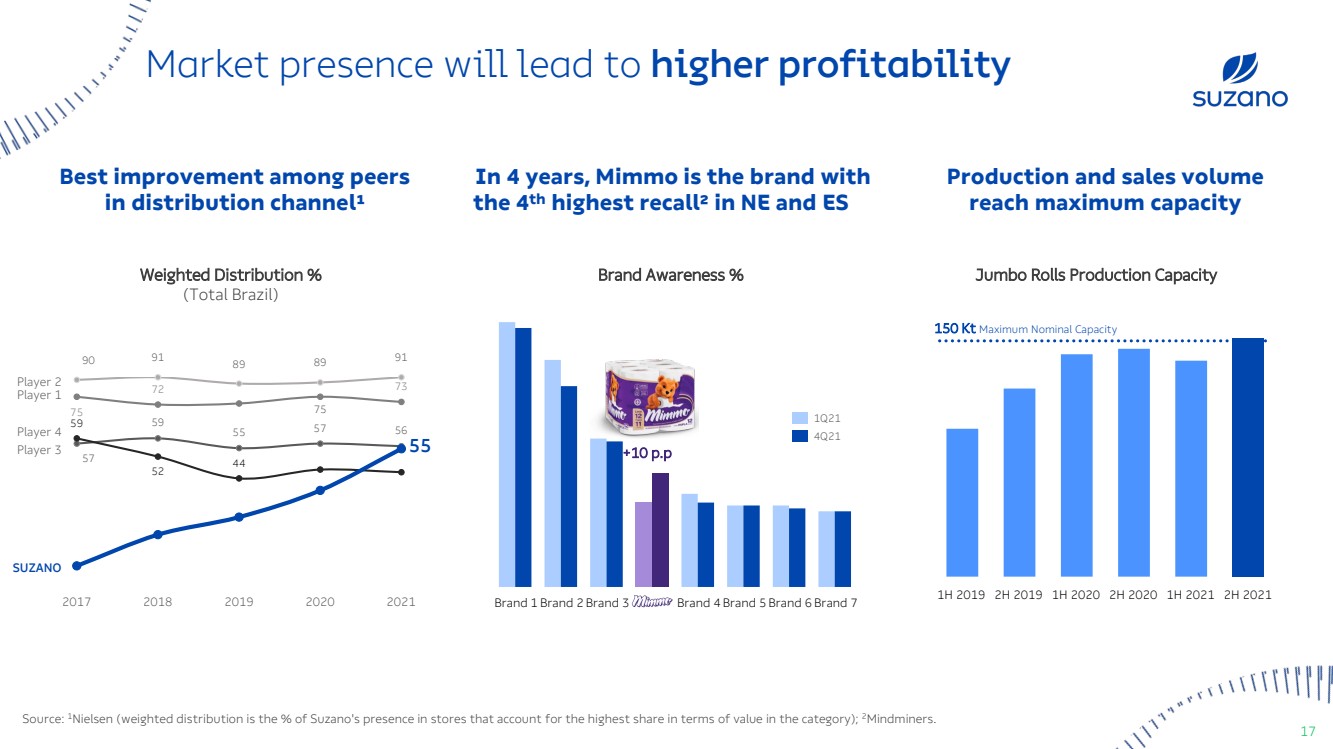
| Market presence will lead to higher profitability Weighted Distribution % (Total Brazil) Brand Awareness % Jumbo Rolls Production Capacity 150 Kt MaximumNominal Capacity 2H 20201H 20192H 20212H 20191H 20201H 2021 Brand 6Brand 2Brand 1Brand 3Brand 5Brand 4Brand 7 1Q214Q21 +10 p.p 5759555756757273595244 202189201890758991201720199155Player 2Player 1Player 3SUZANOPlayer 4 Best improvement among peers in distribution channel¹In 4 years, Mimmois the brand with the 4thhighest recall² in NE and ESProduction and sales volume reach maximum capacity2020 Source: 1Nielsen (weighted distribution is the % of Suzano'spresence in stores that account for the highest share in terms of value in the category); 2Mindminers. 17 |
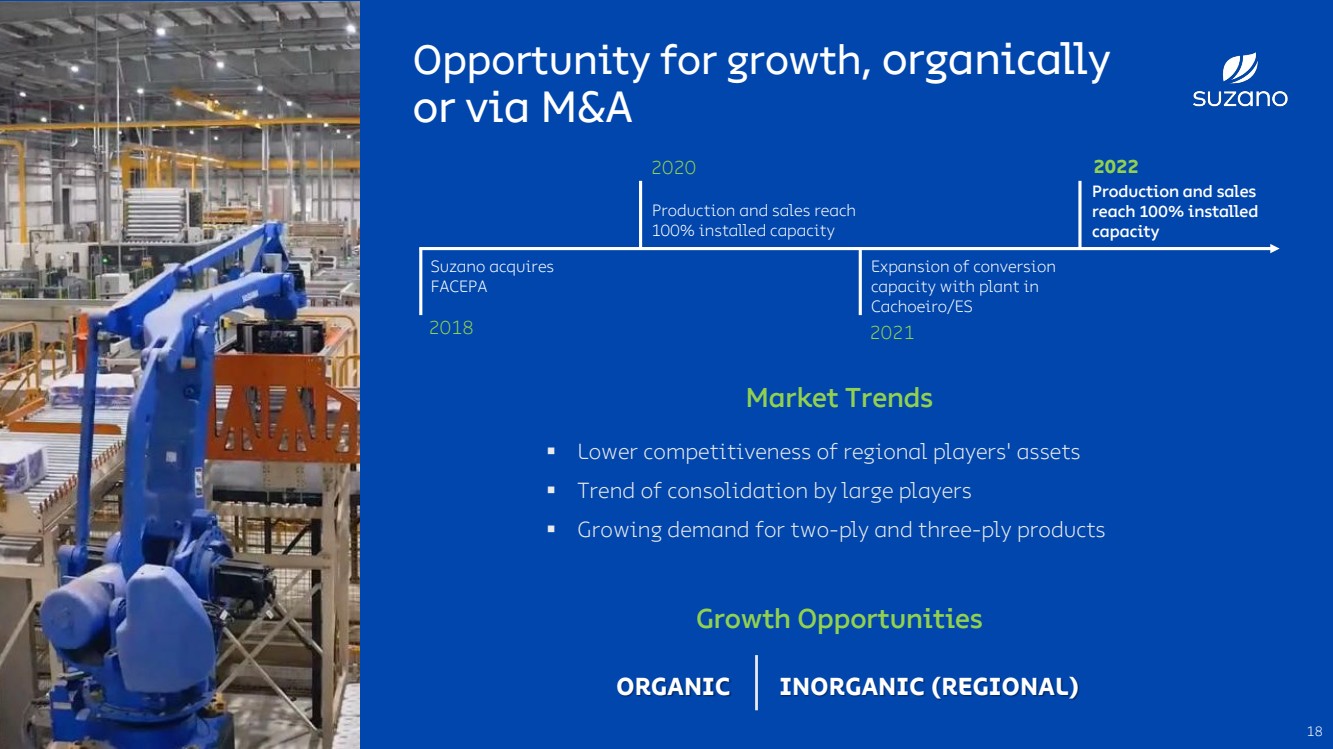
| 18Lower competitiveness of regional players' assetsTrend of consolidation by large players Growing demand for two-ply and three-ply productsMarket TrendsGrowthOpportunities INORGANIC (REGIONAL ) ORGANIC Opportunity for growth, organically or via M&A Production and sales reach 100% installed capacity Expansion of conversion capacity with plant in Cachoeiro/ES Production and sales reach 100% installed capacity Suzano acquiresFACEPA2018202020212022 |
| Maintain relevance in Pulp, through good projects 19 |
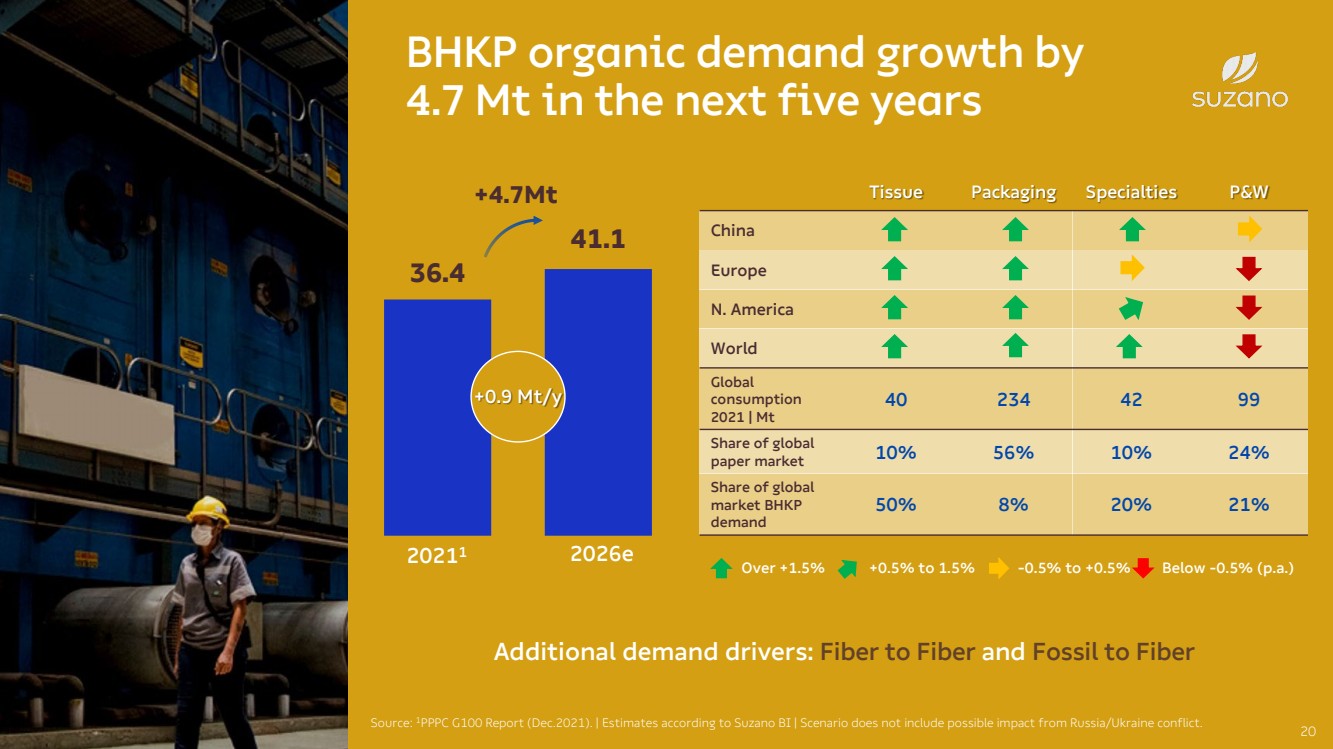
| BHKP organic demand growth by4.7 Mt in the next five years20 36.4 41.1 20211 + 0.9 Mt/y Source: 1PPPC G100 Report (Dec.2021). | Estimates according to Suzano BI | Scenario does not include possible impact from Russia/Ukraine conflict.Additional demand drivers: Fiber to Fiber and Fossil to FiberOver +1.5%+0.5% to 1.5%-0.5% to +0.5%Below -0.5% (p.a.) 2026e+4.7Mt Tissue Packaging Specialties P&W ChinaEuropeN. AmericaWorldGlobal consumption 2021 | Mt402344299Share of globalpaper market10%56%10%24%Shareofglobal marketBHKP demand50%8%20%21% |
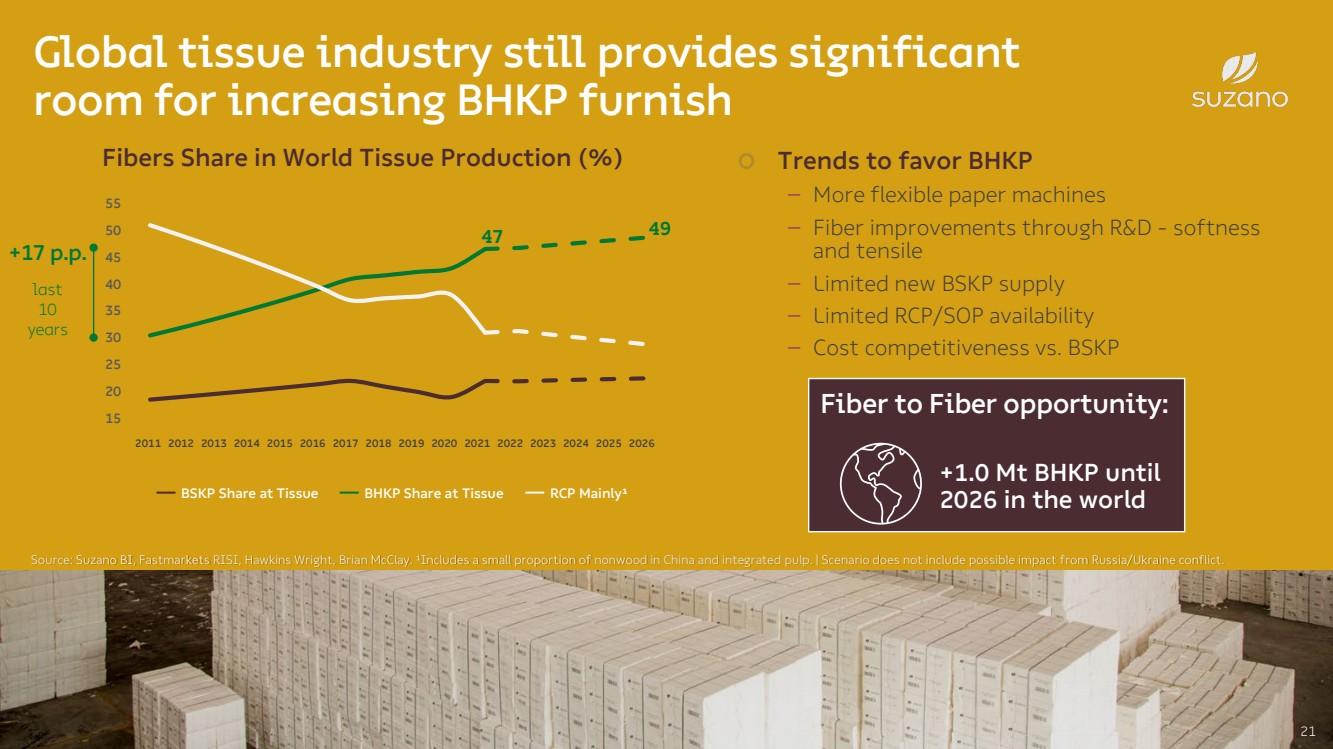
| 21 Source: Suzano BI, Fastmarkets RISI, Hawkins Wright, Brian McClay. ¹Includes a small proportion of nonwood in China and integrated pulp. | Scenario does not include possible impact from Russia/Ukraine conflict. Fibers Share in World Tissue Production (%) BSKP Share at TissueBHKP Share at TissueRCP Mainly¹Global tissue industry still provides significant room for increasing BHKP furnish2011201220132014201520162017201820192020202120222023202420252026+17 p.p.last10 years Trends to favor BHKP –More flexible paper machines–Fiber improvements through R&D -softness and tensile–Limited new BSKP supply–Limited RCP/SOP availability–Cost competitiveness vs. BSKP FibertoFiberopportunity: +1.0 MtBHKP until2026 in theworld 474915202530 35 40 45 50 55 |
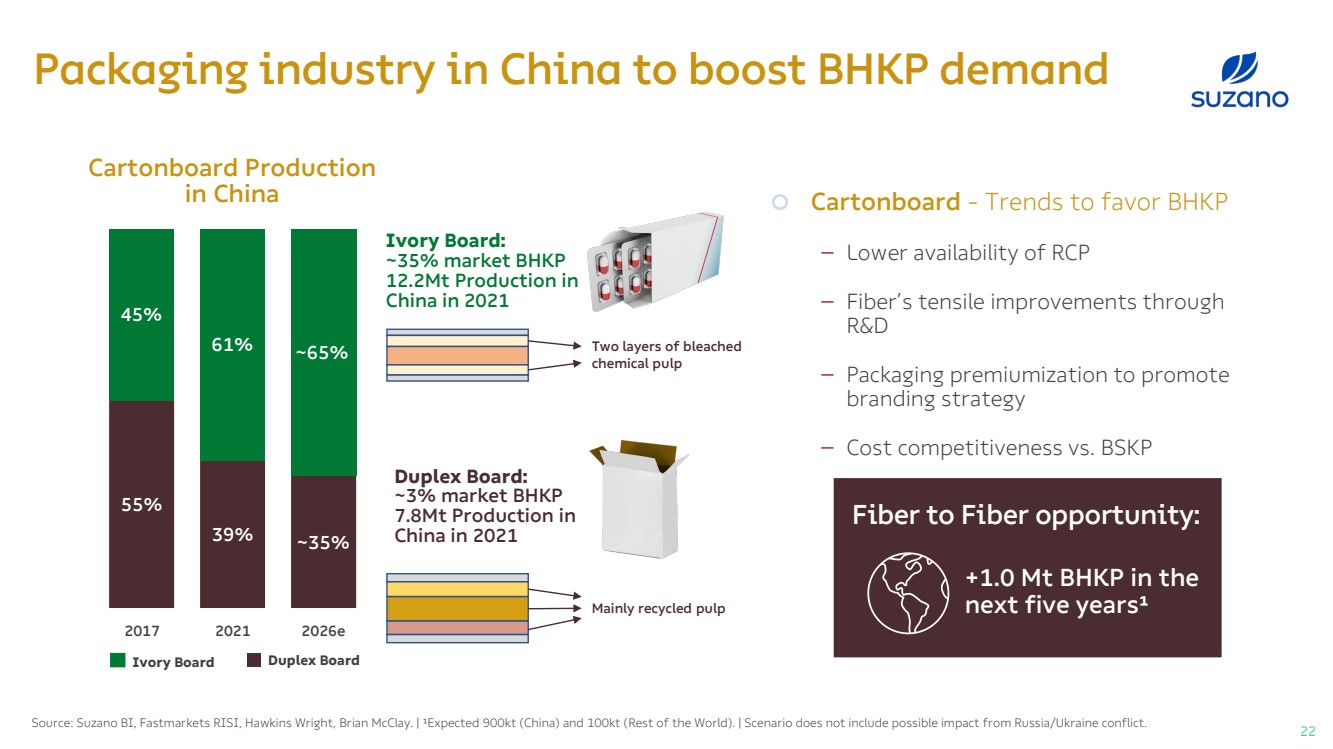
| Packaging industry in China to boost BHKP demandSource: Suzano BI, Fastmarkets RISI, Hawkins Wright, Brian McClay. | ¹Expected 900kt (China) and 100kt (Rest of the World). |Scenario does not include possible impact from Russia/Ukraine conflict.CartonboardProduction in China 55%39%~35%45%61%~65%Duplex Board 2026e20212017Ivory Board: ~35% market BHKP12.2Mt Production in China in 2021Duplex Board: ~3% market BHKP 7.8Mt Production in China in 2021Ivory Board Mainlyrecycledpulp Cartonboard-Trends to favor BHKP–Lower availability of RCP–Fiber’s tensile improvements through R&D –Packaging premiumization to promote branding strategy –Cost competitiveness vs. BSKP FibertoFiberopportunity: +1.0 Mt BHKP in the next five years¹ Twolayersofbleachedchemicalpulp 22 |
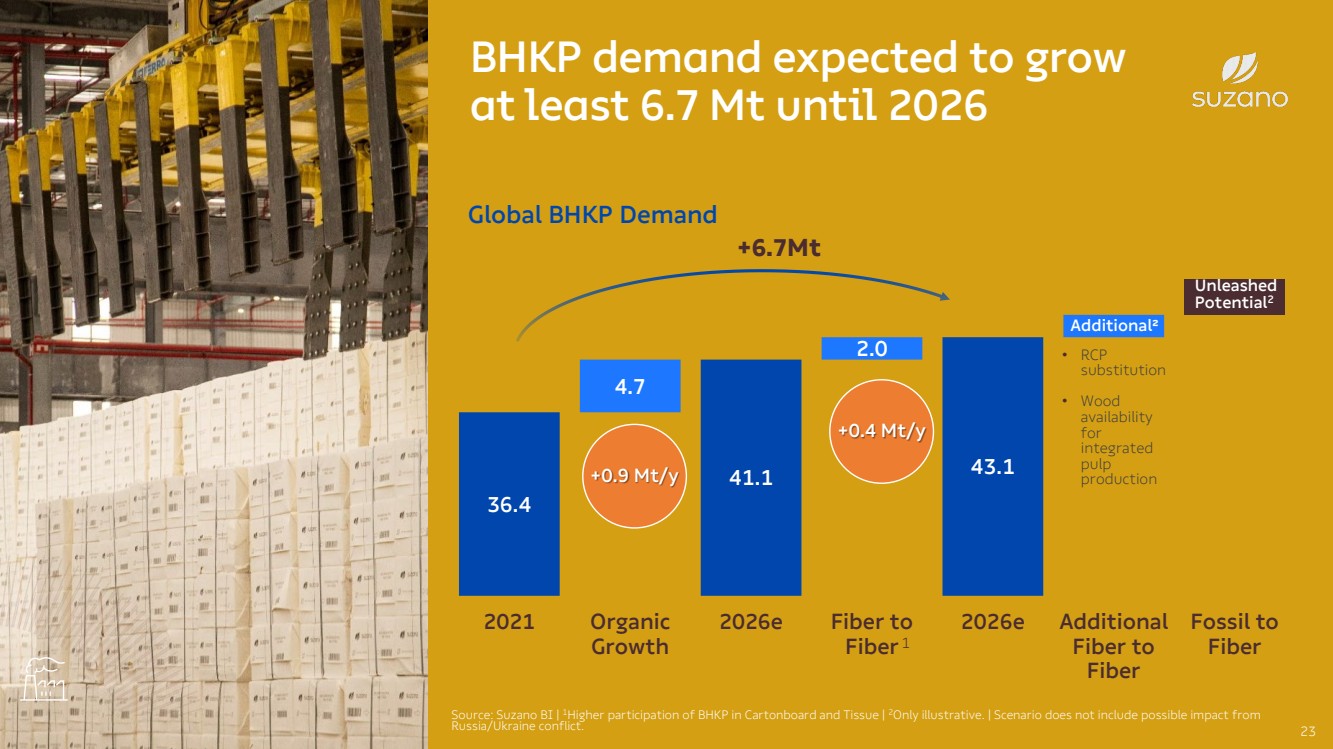
| 36.441.143.14.72.02021OrganicGrowth2026eFiber toFiber2026eAdditionalFiber toFiberFossil toFiberBHKP demand expected to grow at least 6.7 Mt until 202623Source: Suzano BI | 1Higher participation of BHKP in Cartonboardand Tissue| 2Only illustrative. | Scenario does not include possible impact from Russia/Ukraine conflict.Global BHKP Demand UnleashedPotential2Additional² + 0.9 Mt/y +0.4 Mt/y •RCP substitution•Wood availability for integratedpulpproduction +6.7Mt1 |
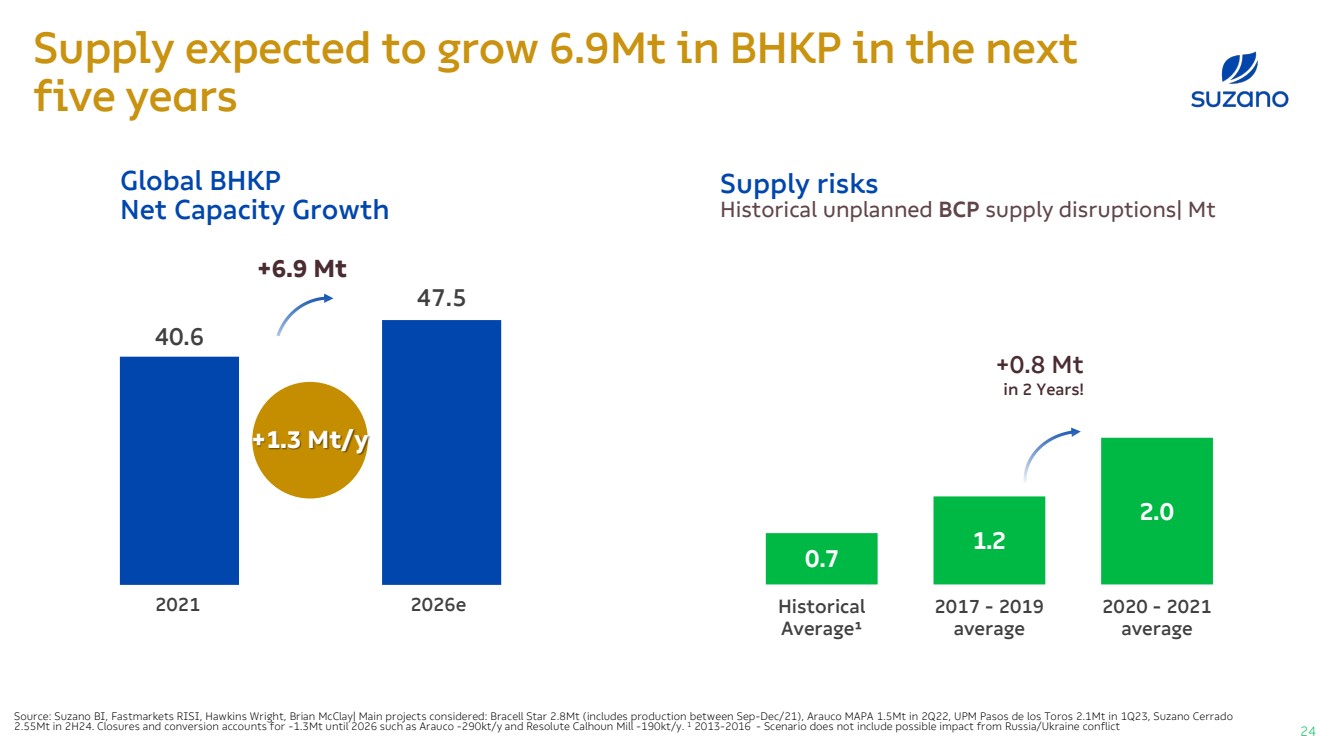
| Supply expected to grow 6.9Mt in BHKP in the next five yearsSource: Suzano BI | RISI. | ²Hawkins Wright | Scenario doesn’t include possible impact from Russia/Ukraine conflict. ¹ Historical Average: 2013-2016.Global BHKPNet Capacity Growth20212026e 40.647.5 +1.3 Mt/y Supply risksHistorical unplanned BCPsupply disruptions| Mt 0.71.22.0HistoricalAverage¹2017 - 2019average2020 - 2021average+0.8 Mtin 2 Years! +6.9 Mt Source:SuzanoBI,FastmarketsRISI,HawkinsWright,BrianMcClay|Mainprojectsconsidered:BracellStar2.8Mt(includesproductionbetweenSep-Dec/21),AraucoMAPA1.5Mtin2Q22,UPMPasosdelosToros2.1Mtin1Q23,SuzanoCerrado2.55Mtin2H24.Closuresandconversionaccountsfor-1.3Mtuntil2026suchasArauco-290kt/yandResoluteCalhounMill-190kt/y.12013-2016-ScenariodoesnotincludepossibleimpactfromRussia/Ukraineconflict24 |
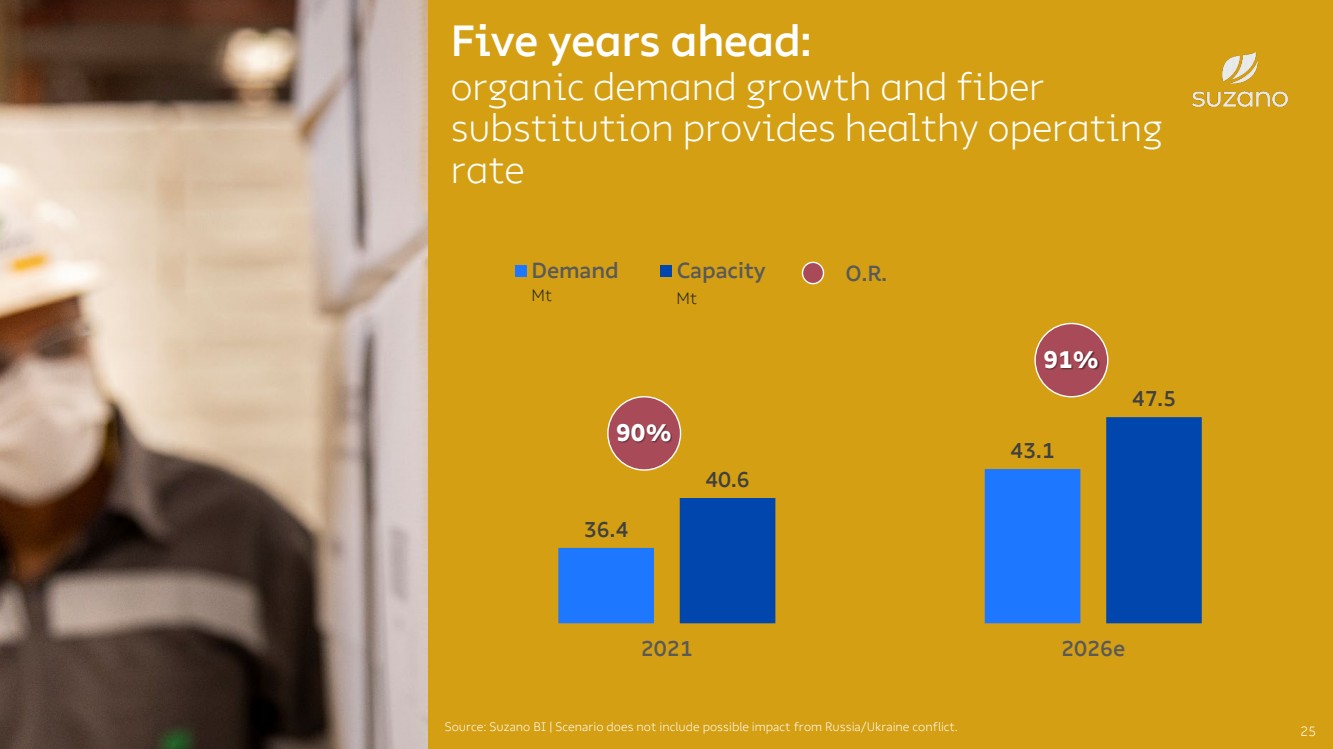
| Five years ahead:organic demand growth and fiber substitution provides healthy operating rate25Source: Suzano BI | Scenario does not include possible impact from Russia/Ukraine conflict. 36.443.140.647.520212026e Demand Capacity 90% O.R. 91% MtMt |
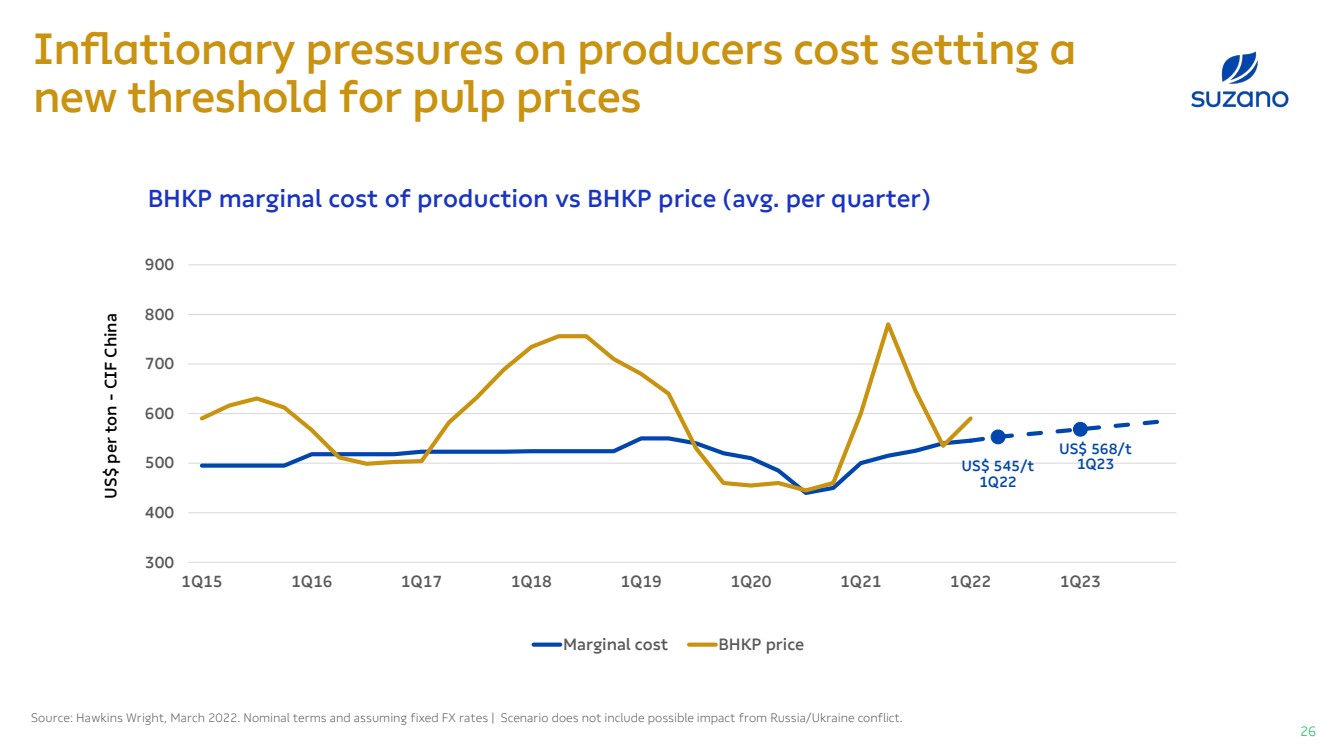
| Inflationary pressures on producers cost setting a new threshold for pulp prices 26Source: Hawkins Wright, March 2022. Nominal terms and assuming fixed FX rates | Scenario does not include possible impact from Russia/Ukraine conflict. BHKP marginal cost of production vs BHKP price (avg. per quarter) 300400 500 600 700 800 9001Q151Q161Q171Q181Q191Q201Q211Q221Q23 Marginal cost BHKP priceUS$ per ton-CIF ChinaUS$ 545/t1Q22 US$ 568/t1Q23 |
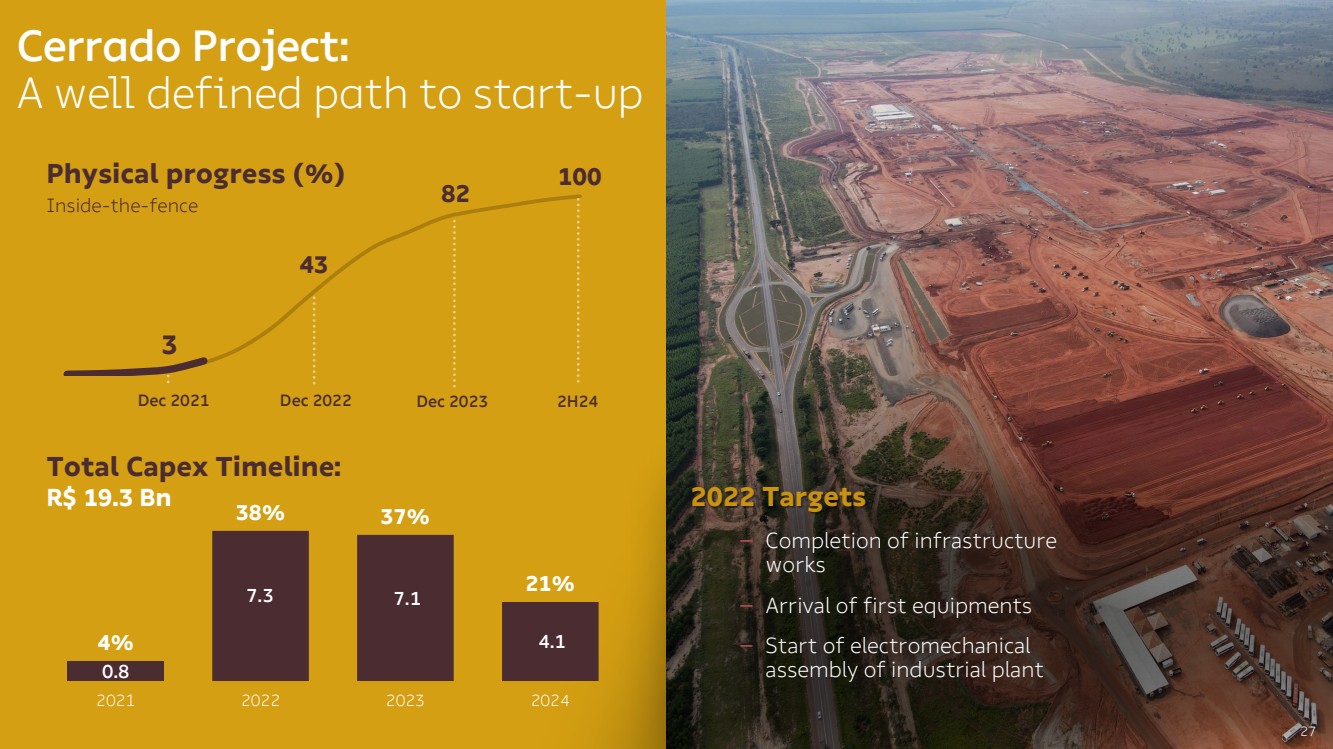
| Physicalprogress(%)Inside-the-fence 43 821003 Dec2021Dec2022Dec20232H24 CerradoProject:A well defined path to start-up 2022 Targets –Completion of infrastructure works–Arrival of first equipments–Start of electromechanical assembly of industrial plant27 4%38%37%21%2021202220232024Total CapexTimeline: R$ 19.3 Bn0.87.37.14.1 |
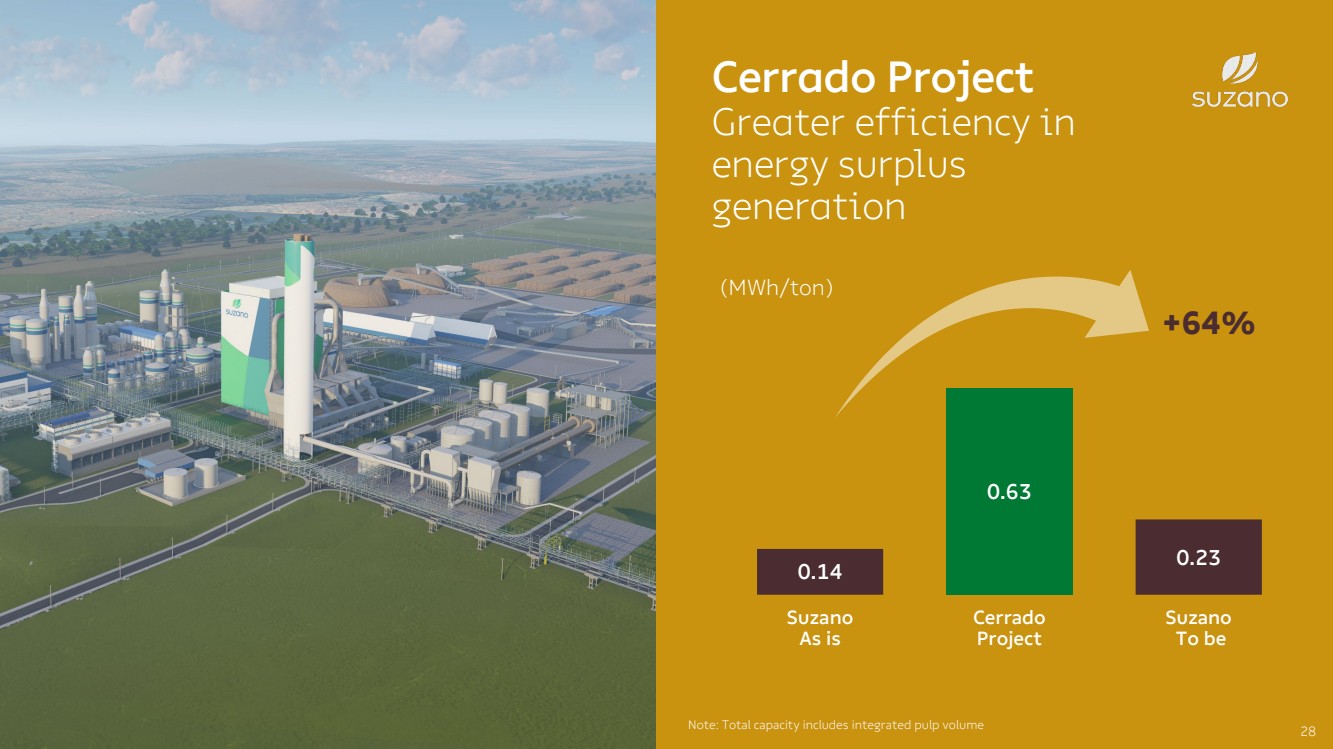
| Cerrado ProjectGreaterefficiencyin energysurplusgeneration(MWh/ton) 0.140.630.23SuzanoAs isCerradoProjectSuzano To beNote: Total capacityincludes integratedpulpvolume+64% 28 |
| Be “Best-in-Class”in the Total PulpCost vision 29 |
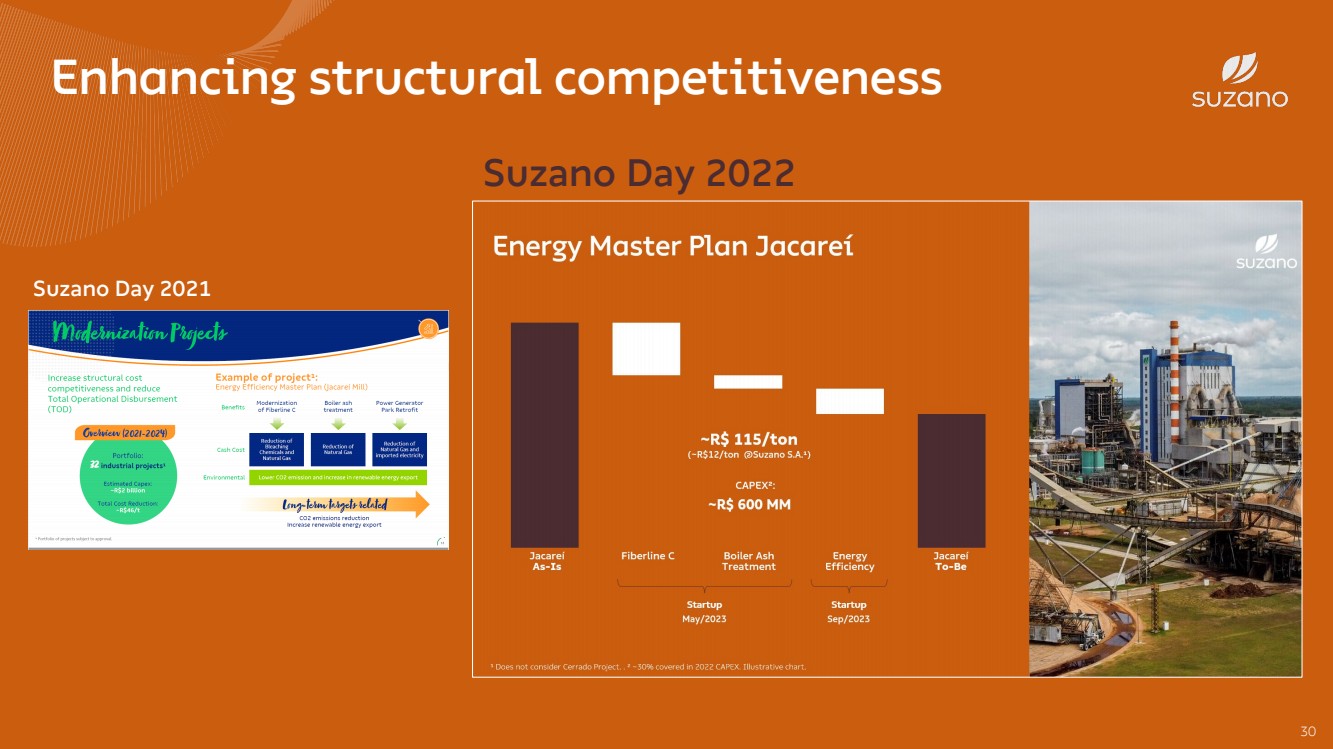
| Suzano Day 2022 Suzano Day 2021 Enhancing structural competitiveness 30 |
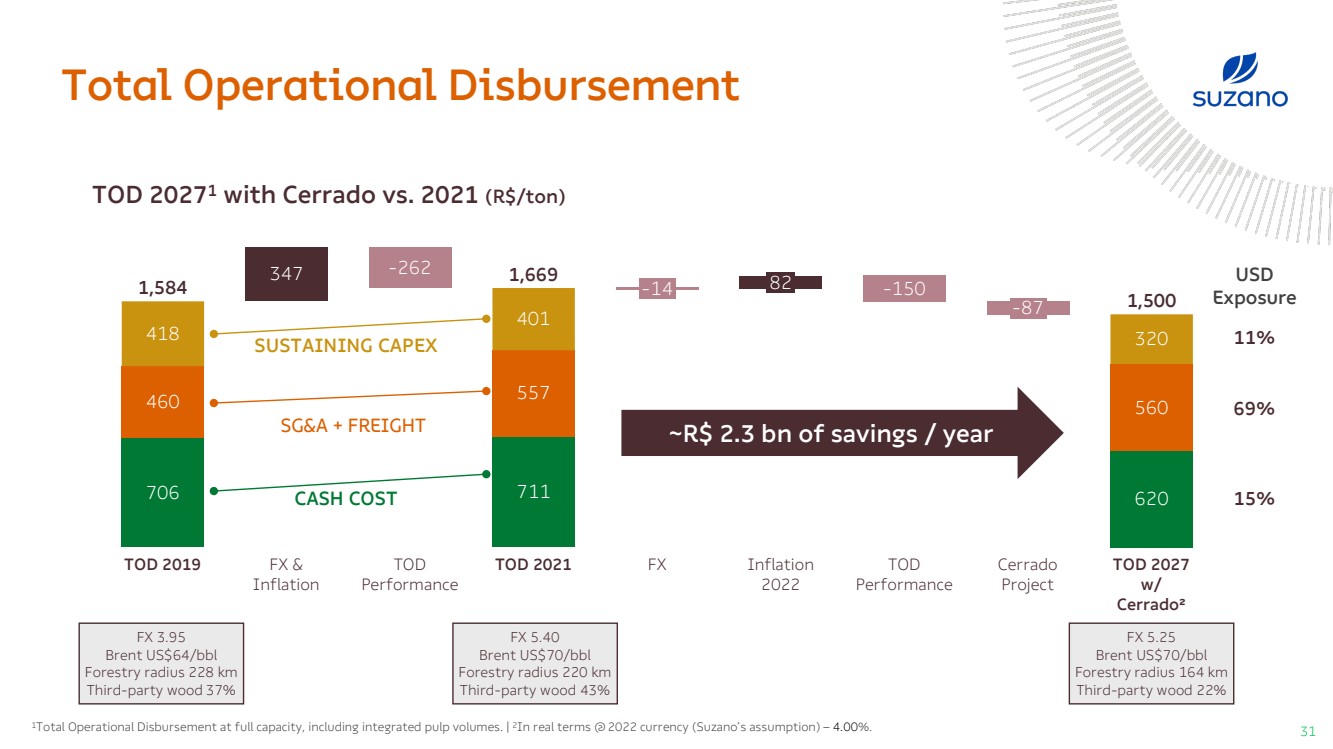
| Total Operational DisbursementTOD 20271withCerrado vs. 2021 (R$/ton) USDExposure11%69%15% 706711620460347557560418401320TOD 2019FX & InflationTODPerformance-262FX -14TOD 2021 82Inflation20221,669 -150TODPerformance -87CerradoProjectTOD 2027 w/ Cerrado²1,5001,584 FX 3.95Brent US$64/bblForestryradius228 kmThird-partywood37% FX 5.40Brent US$70/bblForestryradius220 kmThird-partywood43% FX 5.25Brent US$70/bblForestryradius164 kmThird-partywood22%SUSTAINING CAPEXCASH COST ~R$ 2.3 bnofsavings/ year SG&A + FREIGHT1Total Operational Disbursement at full capacity, including integrated pulp volumes. | 2In real terms @2022 currency (Suzano’sassumption) –4.00%.31 |
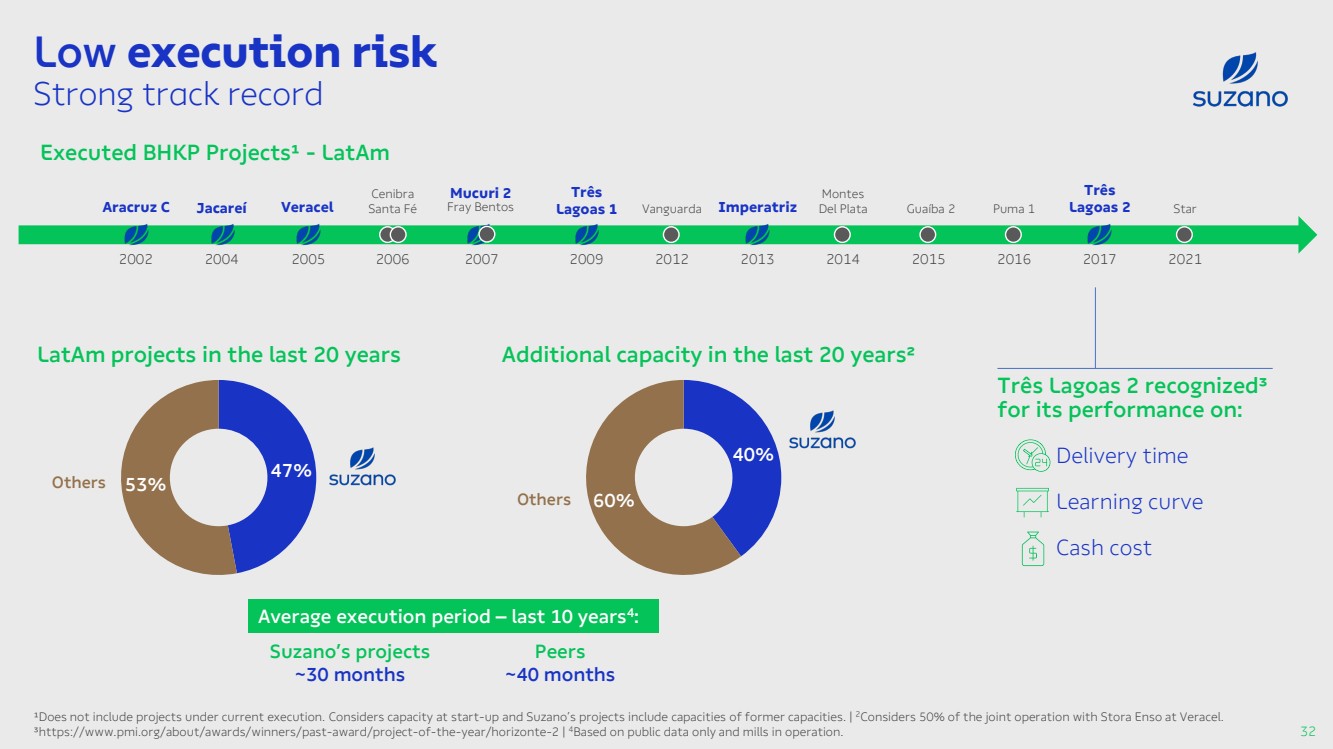
| Low execution riskStrong track record¹Does notinclude projectsundercurrentexecution. Considerscapacityatstart-upandSuzano’sprojectsinclude capacitiesofformercapacities. | 2Considers 50% ofthejoint operationwithStoraEnsoatVeracel.³https://www.pmi.org/about/awards/winners/past-award/project-of-the-year/horizonte-2 | 4Based onpublicdata onlyandmillsin operation.ExecutedBHKP Projects¹ -LatAm 200220042005 200620072009 20122013 2014 2015 20162017 2021Aracruz CVeracelMucuri 2TrêsLagoas 1ImperatrizGuaíba 2TrêsLagoas 2JacareíCenibraSanta FéVanguardaMontesDel PlataPuma 1Star FrayBentos TrêsLagoas2 recognized³ for its performance on:Delivery timeLearning curve Cash cost 47%53%LatAmprojects in the last 20 yearsAdditional capacity in the last 20 years² Others 40%60% Others Averageexecutionperiod–last10 years4:Suzano’sprojects~30 monthsPeers~40 months32 |
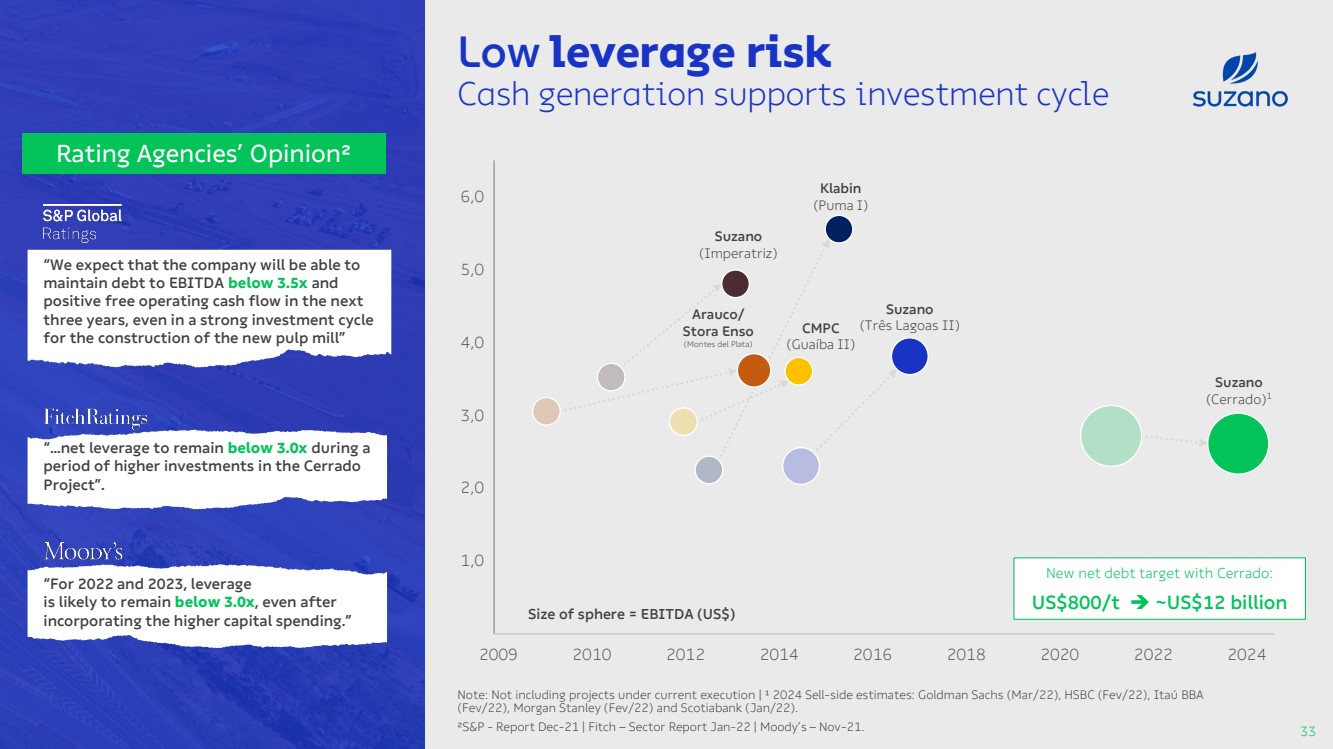
| Low leverage riskCash generation supports investment cycleNote: Notincludingprojectsundercurrentexecution| ¹ 2024 Sell-sideestimates: Goldman Sachs (Mar/22), HSBC (Fev/22), Itaú BBA (Fev/22), Morgan Stanley (Fev/22) andScotiabank(Jan/22). ²S&P -ReportDec-21 | Fitch –Sector ReportJan-22 | Moody’s –Nov-21.Sizeofsphere= EBITDA (US$) 1,02,03,0 4,05,06,0200920102012201420162018202020222024 Klabin(Puma I) Suzano (Três Lagoas II) Suzano (Cerrado)1 CMPC (Guaíba II) Arauco/ Stora Enso(Montes delPlata) Suzano (Imperatriz) New net debttarget withCerrado: US$800/t ~US$12 billion Rating Agencies’ Opinion² “We expect that the company will be able to maintain debt to EBITDA below 3.5x and positive free operating cash flow in the next three years, even in a strong investment cycle for the construction of the new pulp mill” “…net leverage to remain below 3.0x during a period of higher investments in the CerradoProject”. “For 2022 and 2023, leverageis likely to remain below 3.0x, even after incorporating the higher capital spending.” 33 |
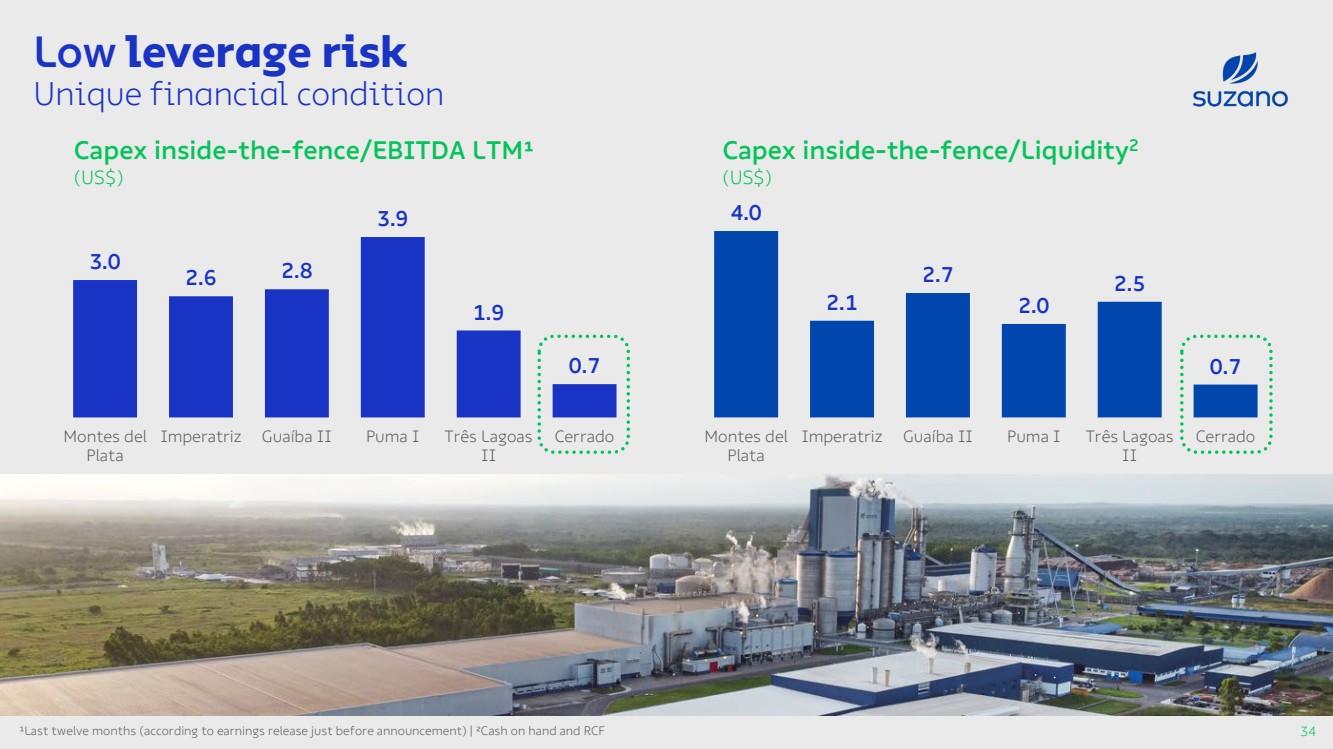
| Low leverage risk Unique financial condition34¹Last twelve months (according to earnings release just before announcement) | ²Cash on hand and RCFCapexinside-the-fence/EBITDA LTM¹(US$) 3.02.62.83.91.90.7Montes delPlataImperatrizGuaíba IIPuma ITrês LagoasIICerrado Capex inside-the-fence/Liquidity2(US$) 4.02.12.72.02.50.7Montes delPlataImperatrizGuaíba IIPuma ITrês LagoasIICerrado |
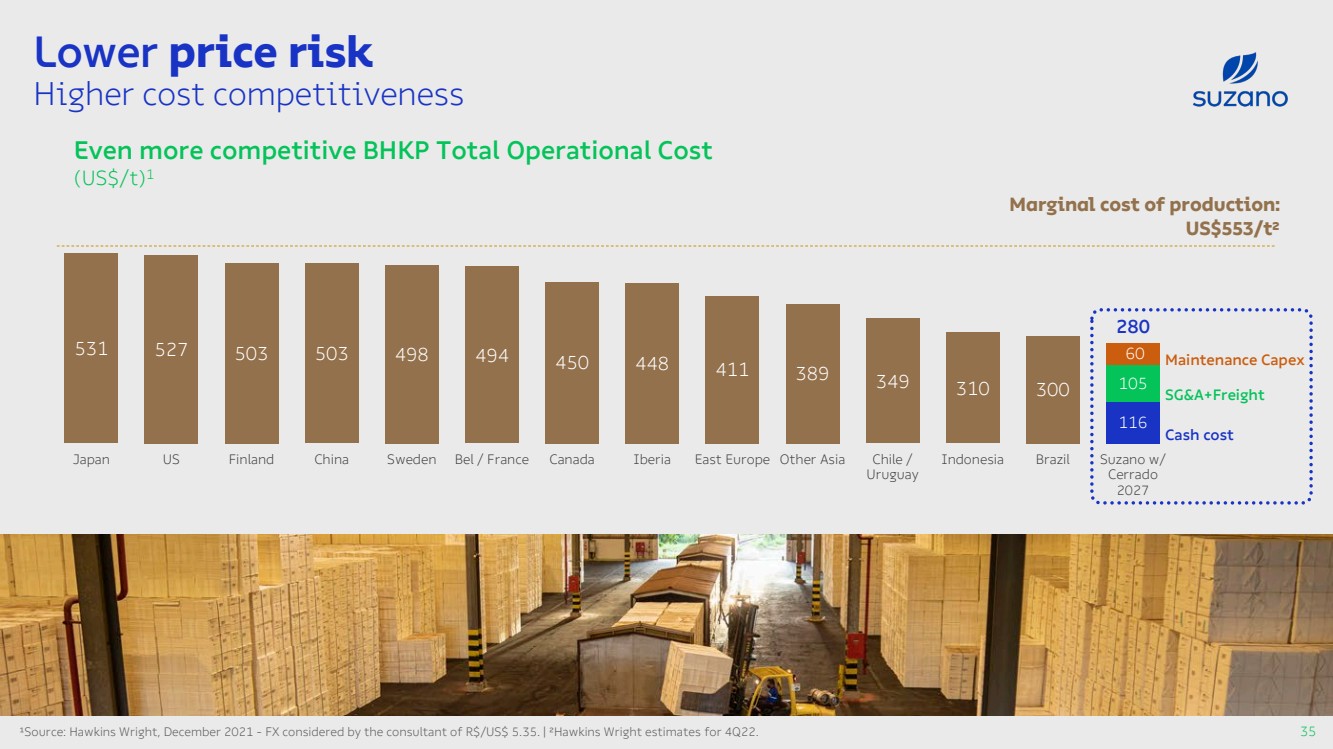
| Lower price risk Higher cost competitiveness35¹Source: Hawkins Wright, December 2021 -FX considered by the consultant of R$/US$ 5.35. | ²Hawkins Wright estimates for 4Q22.Even more competitive BHKP Total Operational Cost (US$/t)1 53152750350349849445044841138934931030011610560 280JapanUSFinlandChinaSwedenBel / FranceCanadaIberiaEast EuropeOther AsiaChile /UruguayIndonesiaBrazilSuzano w/Cerrado2027 Cash costSG&A+FreightMaintenanceCapex Marginal costofproduction: US$553/t² |
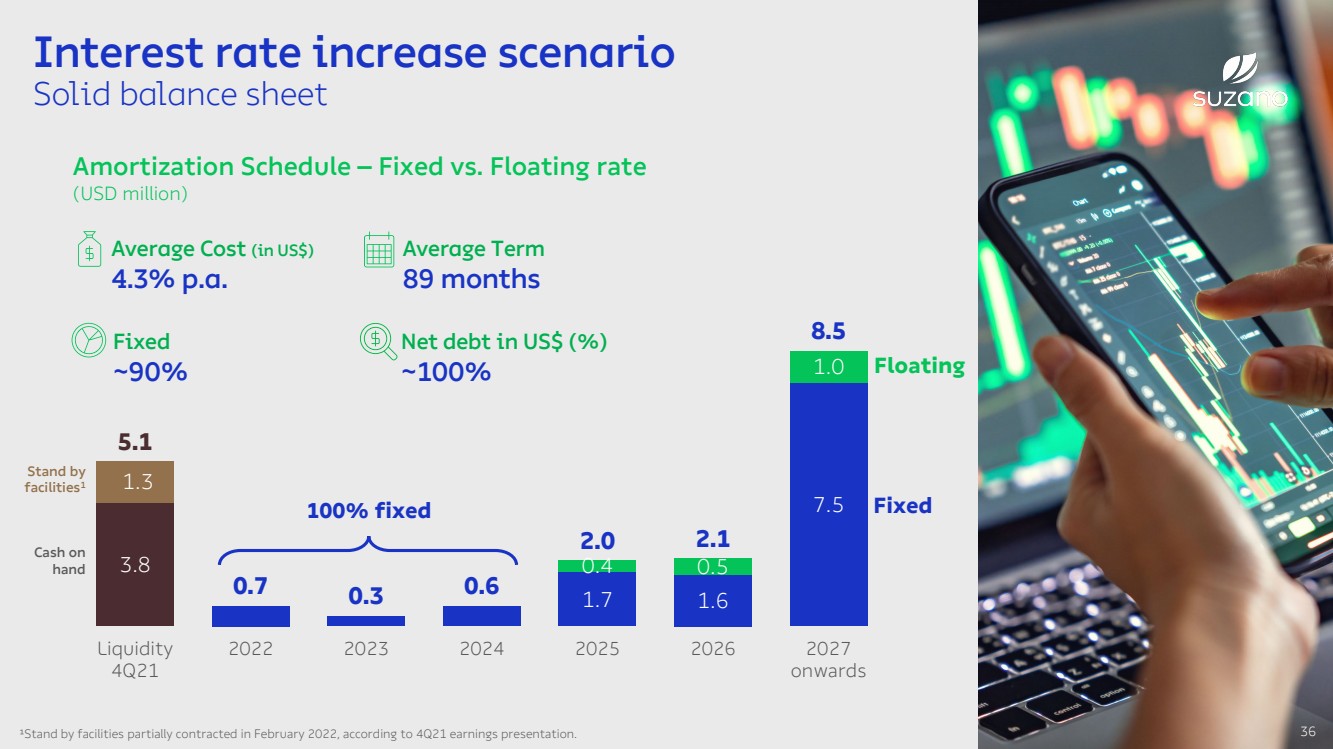
| 3.81.71.67.51.3 0.40.51.05.10.70.30.62.02.18.5Liquidity4Q21202220232024202520262027onwards1FloatingFixedInterest rate increase scenarioSolid balance sheetAmortization Schedule –Fixed vs. Floating rate(USD million)¹Stand by facilities partially contracted in February 2022, according to 4Q21 earnings presentation. Stand byfacilities1Cash onhand 36AverageTerm89 months AverageCost(in US$)4.3% p.a. Fixed~90% Net debt in US$ (%)~100% 100% fixed |
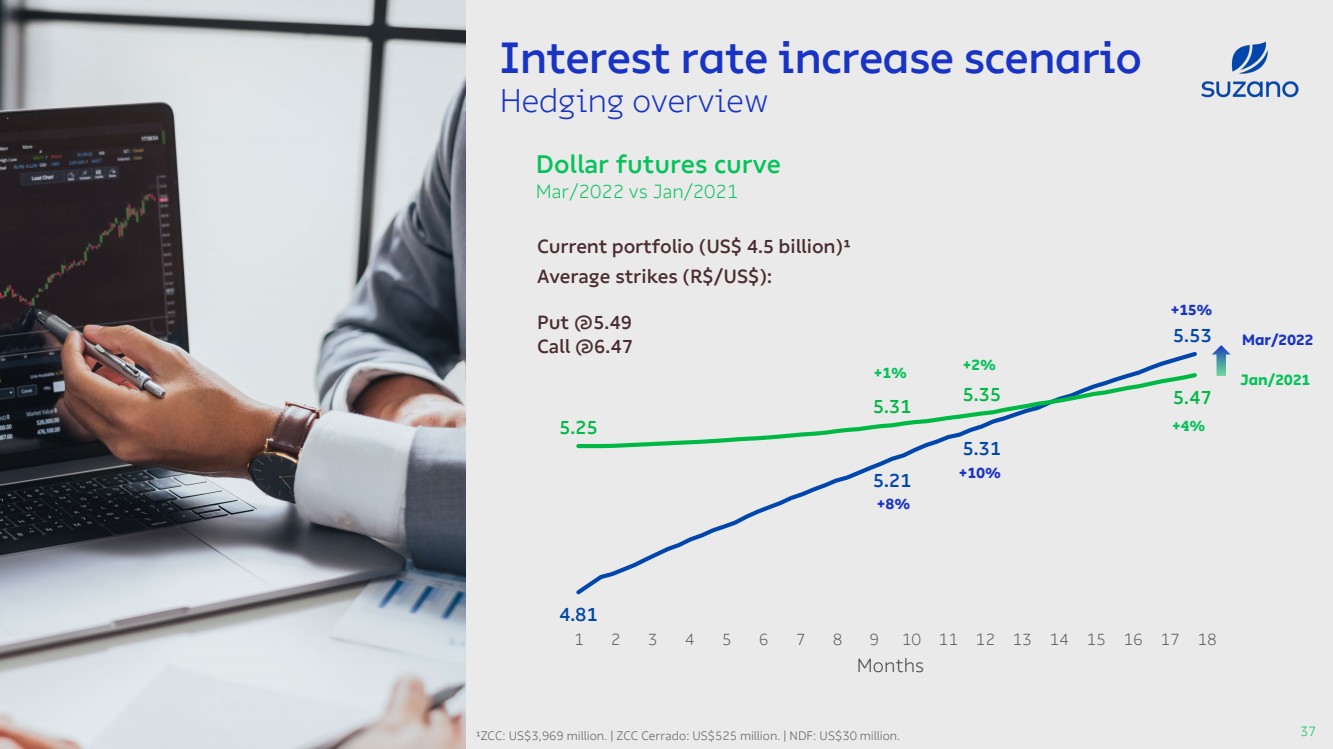
| Interest rate increase scenarioHedging overview37Dollar futures curveMar/2022 vs Jan/2021Mar/2022Jan/2021 Averagestrikes (R$/US$):Put@5.49Call@6.47Months Currentportfolio (US$ 4.5 billion)¹¹ZCC: US$3,969 million. | ZCC Cerrado: US$525 million. | NDF: US$30 million.1234567891011121314151618 4.815.215.315.53+8%+10%+15% 5.255.315.355.47+1%+2%+4%17 |
| OUTLOOK Ambidexterity between short and long term Addressable market expansion ESG Protagonism Solid track record on capital allocation 38 |
| Thank you! |