| Earnings Conference Call 2Q 22 |
| Disclaimer 2 This presentation contains what are considered “forward - looking statements,” as defined in Section 27 A of the 1933 Securities Act and Section 21 E of the 1934 Securities Exchange Act, as amended .. Some of these forward - looking statements are identified with words such as “believe,” “may,” “could,” “would,” “possible,” “will,” “should,” “expect,” “intend,” “plan,” “anticipate,” “estimate,” “potential,” “outlook” or “continue,” as well as the negative forms of these words, other terms of similar meaning or the use of future dates .. The forward - looking statements include, without limitation, statements related to the declaration or payment of dividends, implementation of the key operational and financial strategies and investment plans, guidance about future operations and factors or trends that influence the financial situation, liquidity or operational results .. Such statements reflect the current view of the management and are subject to diverse risks and uncertainties .. These are qualified in accordance with the inherent risks and uncertainties involving future expectations in general, and actual results could differ materially from those currently anticipated due to various risks and uncertainties .. There is no guarantee that the expected events, trends or results will actually occur .. The statements are based on diverse assumptions and factors, including general economic and market conditions, industry conditions and operating factors .. Any changes in such assumptions or factors could cause actual results to differ materially from current expectations .. Suzano does not undertake any obligation to update any such forward - looking statements as a result of new information, future events or otherwise, except as expressly required by law .. All forward - looking statements in this presentation are covered in their entirety by this disclaimer .. In addition, this presentation contains some financial indicators that are not recognized by the BR GAAP or IFRS .. These indicators do not have a standard meaning and may not be comparable to indicators with a similar description used by other companies .. We provide these indicators because we use them as measurements of Suzano's performance ; they should not be considered separately or as a replacement for other financial metrics that have been disclosed in accordance with BR GAAP or IFRS .. |

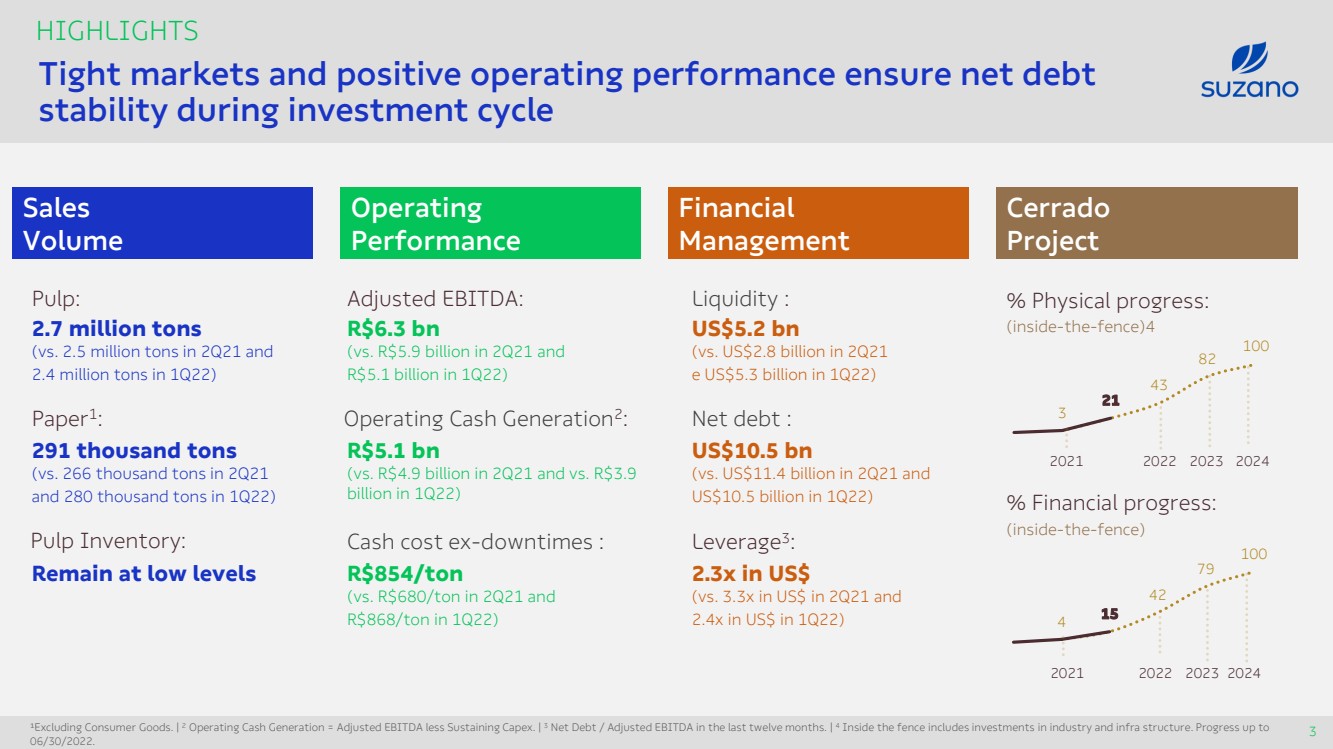
| Tight markets and positive operating performance ensure net debt stability during investment cycle 3 HIGHLIGHTS Adjusted EBITDA: Liquidity : ¹ Excluding Consumer Goods .. | 2 Operating Cash Generation = Adjusted EBITDA less Sustaining Capex .. | 3 Net Debt / Adjusted EBITDA in the last twelve months .. | 4 Inside the fence includes investments in industry and infra structure .. Progress up to 06/30/2022. Sales Volume Financial Management Operating Performance Cerrado Project 2.7 million tons (vs. 2.5 million tons in 2Q21 and 2.4 million tons in 1Q 22) Pulp: 291 thousand tons (vs. 266 t housand tons in 2Q21 and 280 thousand tons in 1Q22) Paper 1 : Remain at low levels Pulp Inventory : Operating Cash Generation 2 : Cash cost ex - downtimes : R$6.3 bn (vs. R$5.9 billion in 2Q21 and R$ 5.1 billion in 1Q22) R$ 5.1 bn (vs. R$4.9 billion in 2Q21 and vs. R$ 3.9 billion in 1Q22) R$854/ ton (vs. R$680/ ton in 2Q21 and R$ 868 / ton in 1Q22) US$10.5 bn (vs. US$11.4 billion in 2Q21 and US$10.5 billion in 1Q22) Leverage 3 : US$5.2 bn (vs. US$2.8 billion in 2Q21 e US$5.3 billion in 1Q22) Net debt : 2.3x in US$ (vs. 3.3x in US$ in 2Q 21 and 2.4x in US$ in 1Q22) % Physical progress : ( inside - the - fence )4 % Financial progress : ( inside - the - fence ) 3 21 43 82 100 2022 2023 2024 2021 4 15 42 79 100 2022 2023 2024 2021 |
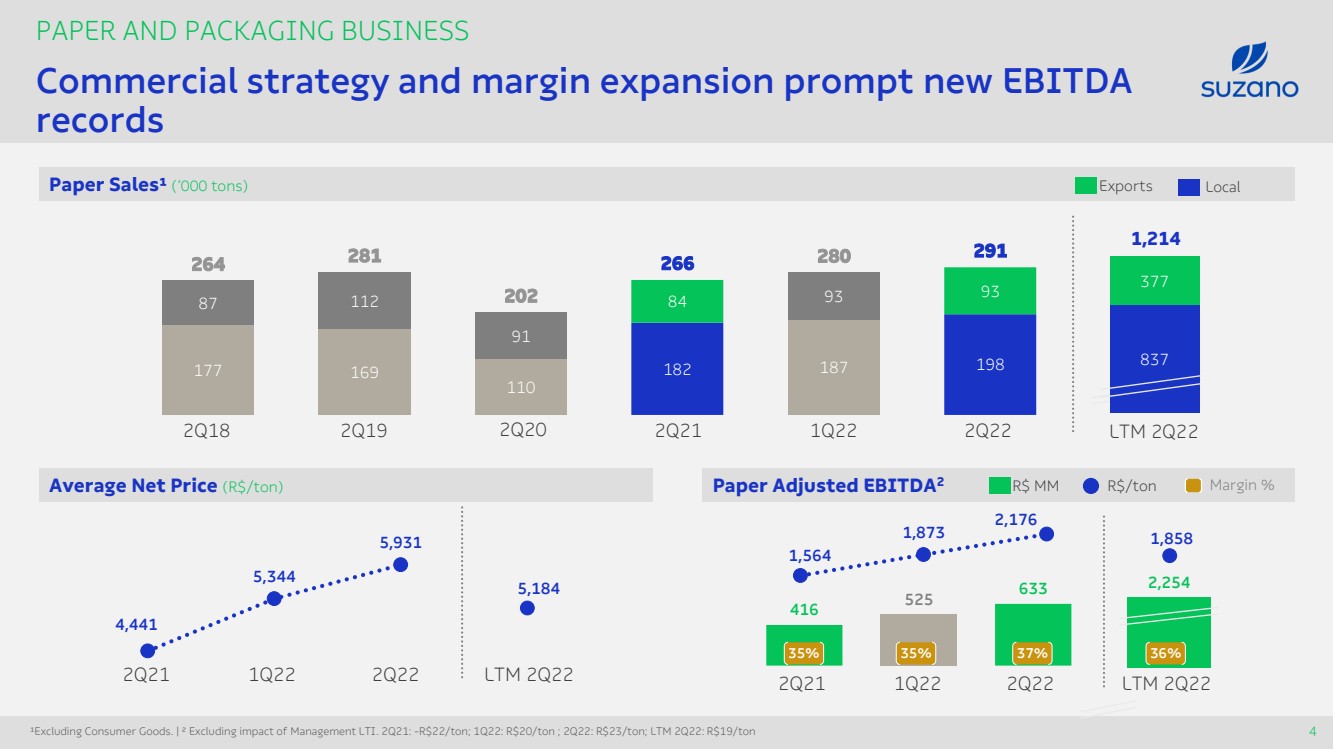
| 416 525 633 2,254 177 169 110 182 187 198 87 112 91 84 93 93 264 281 202 266 280 291 PAPER AND PACKAGING BUSINESS Paper Sales¹ ( ‘000 tons) 2Q21 1Q22 2Q22 Exports Local LT M 2Q22 Commercial strategy and margin expansion prompt new EBITDA records ¹ Excluding Consumer Goods .. | ² Excluding impact of Management LTI .. 2Q21: - R$22/ ton ; 1Q22: R$20/ ton ; 2Q22: R$23/ ton ; LT M 2Q22: R$19/ ton 2Q18 2Q19 2Q20 837 377 1,214 Average Net Price (R$/ ton ) 4,441 5,344 5,931 5,184 2Q21 1Q22 2Q22 LTM 2Q22 4 Paper Adjusted EBITDA 2 1,564 1,873 2,176 1,858 R$ MM R$/ ton 35% 37% 36% 35% Margin % 2Q21 1Q22 2Q22 LTM 2Q22 |
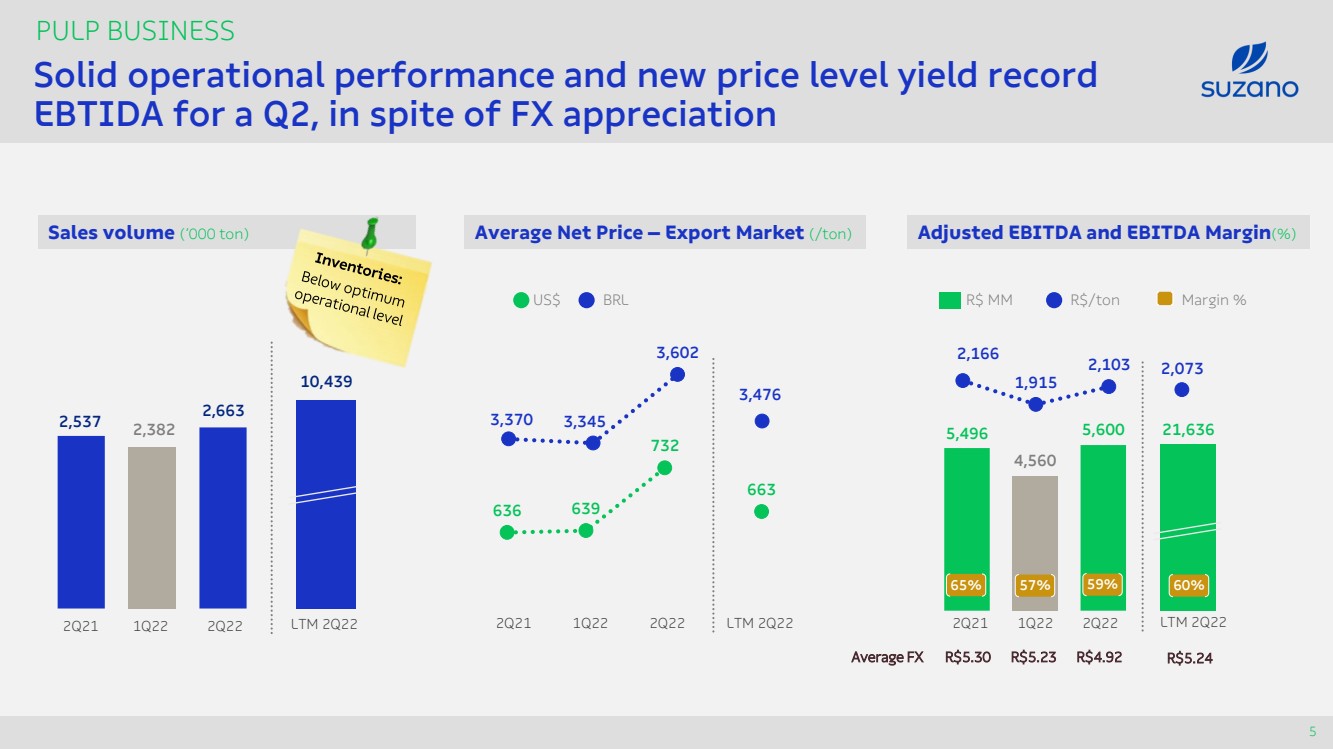
| 663 636 639 732 PULP BUSINESS Sales volume (‘000 ton ) 2Q 21 1Q 22 2Q 22 LTM 2Q22 Average Net Price – Export Market (/ ton ) Adjusted EBITDA and EBITDA Margin (%) 21,636 10,439 2,382 2,663 2,537 5,496 4,560 5,600 2Q 21 1Q 22 2Q 22 LT M 2Q22 Average FX R$5.30 R$5.23 R$ 4.92 R$5.24 Solid operational performance and new price level yield record EBTIDA for a Q2, in spite of FX appreciation 5 2,166 1,915 2,103 2,073 R$ MM R$/ ton Margin % 2Q21 1Q22 2Q22 LTM 2Q22 3,370 3,345 3,602 3,476 US$ BRL 6 5% 57% 59% 60 % |
| 148 282 132 401 282 332 (32) Fixed Cost 11 Wood Input 854 2Q21 50 (6) Energy (13) FX 158 (37) 2Q22 680 PULP BUSINESS Pulp Cash Cost – 2Q22 vs. 1Q22 ( ex - downtime – R$/ ton ) Pulp Cash Cost – 2Q 22 vs. 2Q21 ( ex - downtime – R$/ ton ) 6 407 401 312 332 FX 180 (31) 20 1Q22 (21) Wood 12 Input Fixed Cost (7) Energy (18) 158 (37) 2Q22 868 854 Wood Energy Input Fixed Cost FX Consistent performance mitigates commodities pressure Commodity price effect : R$44/ ton Commodity price effect : R$154/ ton Δ Δ Δ Δ Δ Δ Δ Δ |

| 3.9 0.5 0.4 0.7 2.1 2.1 8.6 1.3 FINANCIAL MANAGEMENT Net D ebt (US$ billion ) Strong operating cash lead to stable net debt even during investment cycle 7 3.1 2.1 2.3 3.3 2.4 2.3 Mar/22 Jun /21 Jun /22 In R$ In US$ 1 It considers amounts related to derivative adjustments,, payment of dividends, IR/CS, among others. | ² Considers the portion of debt with currency swaps for foreign currency. Amortization Schedule (US$ billion ) Cash on hand (75% in US$) Stand - by facilities Leverage ( multiples ) Average Cost (in US$): 4.5% p.a .. Average term : 84 months Liquidity 2Q22 6M22 2023 2024 2025 2027 onwards 2026 5.2 10.5 10.5 10.5 10.5 Net Debt Jun 2022 Total Capex Net debt Mar 2022 ( 1.3 ) Adjusted EBITDA 0.9 Working Capital 0.1 0.3 Dividends/ Share Buyback 0.2 Accrued Net Interest ( 0.1 ) Others¹ Δ % of debt in fixed rate (US $)² 97% 91% 96% 97% 97% 97% |

| FINANCIAL MANAGEMENT Effectiveness of hedging policy mitigates FX appreciation in EBITDA Q2 and provides greater protection in portfolio roll - over 8 Cash Flow Hedging Cerrado P roject Capex Heding Jun /2021: Jun /2022: 5.21 6.00 Put / Call Put / Call 5.53 6.55 Jun /2022: Put / Call 5.98 7.43 Portfolio Average 59 % FX gap coverage 30 % FX gap coverage MTM – Cash Flow (ZCC) 1Q 22 2Q22 +2.3 bn + 0.8 bn (1. 5) bn Cash effect +0.4 bn Result (1.1) bn FX @ 4.74 5. 24 (R$) Jul /2022 Jan/2021 +1% Dollar futures curve Jul /2022 vs Jan/2021 5.40 5.78 5.89 6.14 5.25 5.31 5.35 5.47 + 7 % +9% +2% +14% +4% 1 2 3 4 5 6 7 8 9 10 11 12 13 14 15 16 17 18 months |

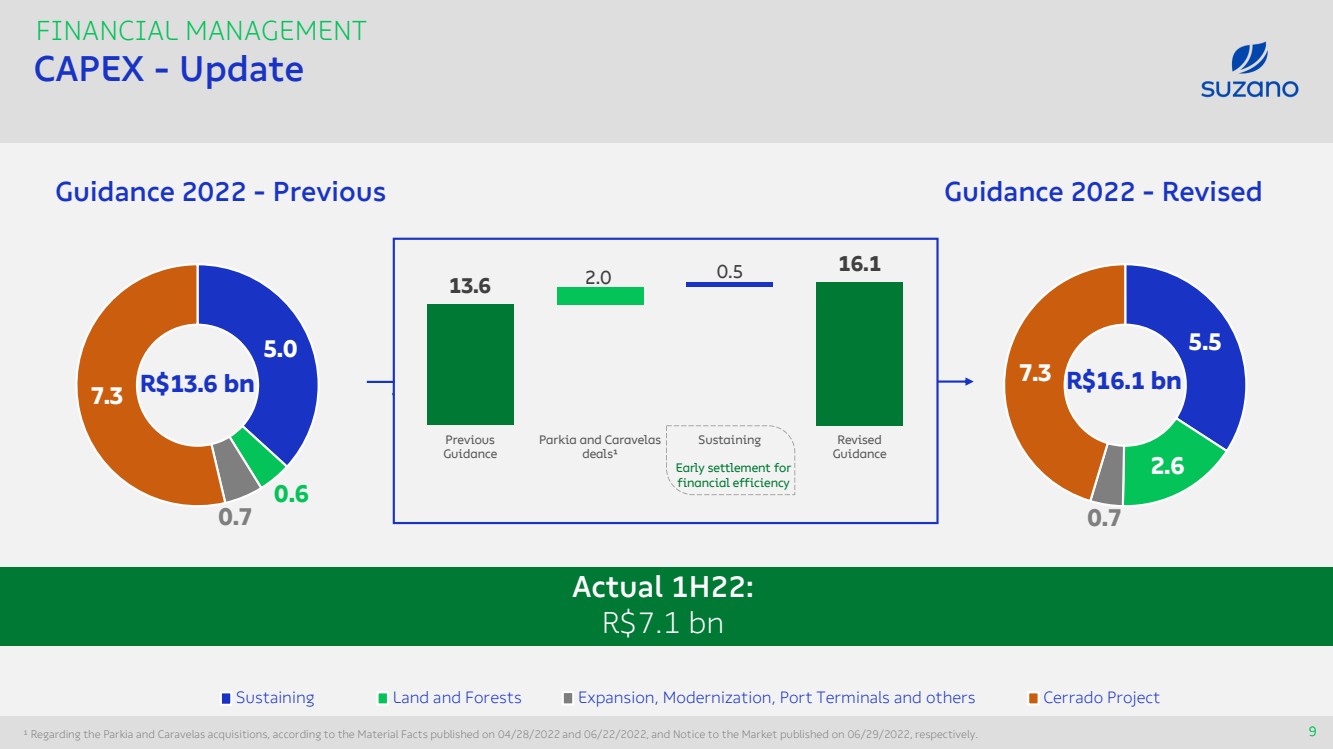
| 5.0 0.6 0.7 7.3 5.5 2.6 0.7 7.3 Sustaining Land and Forests Expansion , Modernization , Port Terminals and others Cerrado Project FINANCIAL MANAGEMENT CAPEX - Update 9 9 ¹ Regarding the Parkia and Caravelas acquisitions, according to the Material Facts published on 04/28/2022 and 06/22 /2022, and Notice to the Market published on 06/29/2022, respectively .. Guidance 2022 - Previous R$13.6 bn 2.0 0.5 13.6 16.1 Previous Guidance Parkia and Caravelas deals¹ Sustaining Revised Guidance R$16.1 bn Guidance 2022 - Revised Actual 1H22: R$7.1 bn Early settlement for f inancial efficiency |
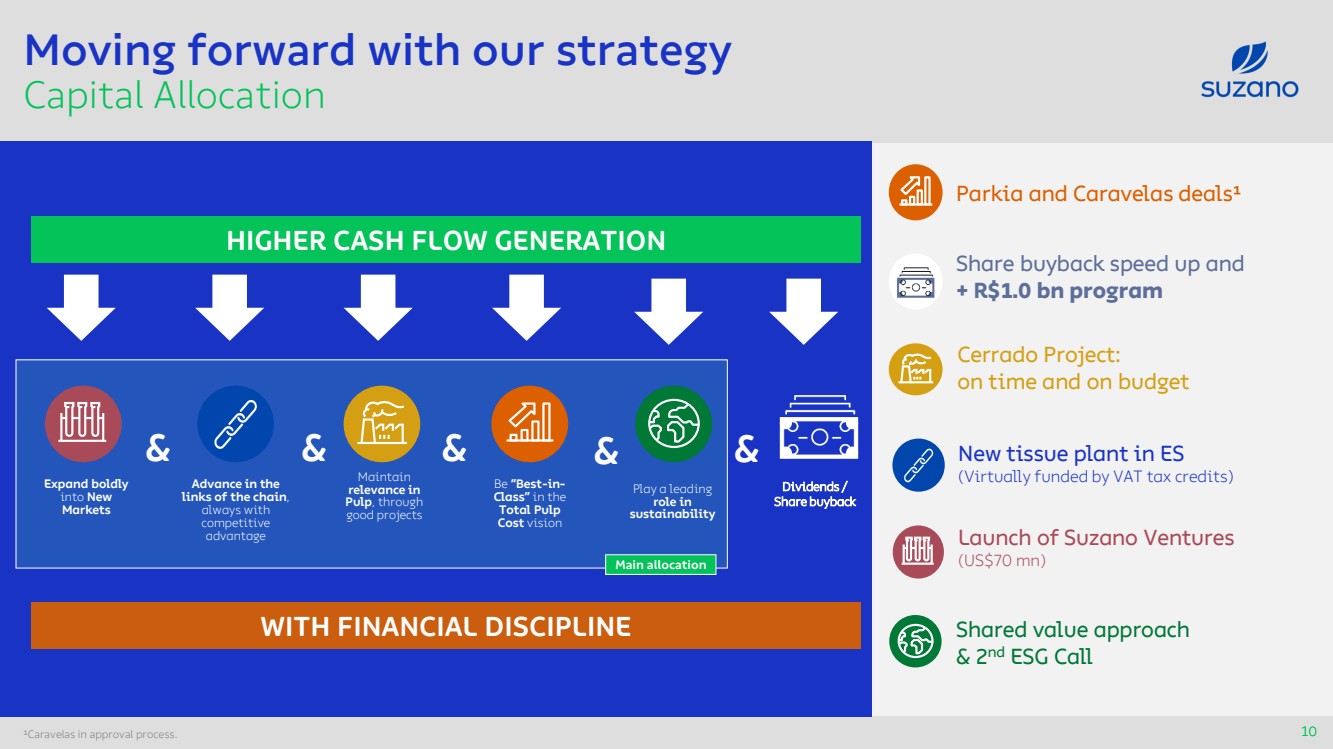
| 10 10 Moving forward with our strategy Capital Allocation Cerrado Project: on time and on budget Parkia and Caravelas deals¹ New tissue plant in ES (Virtually funded by VAT tax credits) Launch of Suzano Ventures (US$70 mn ) HIGHER CASH FLOW GENERATION & Dividends / Share buyback Main allocation & & & Advance in the links of the chain , always with competitive advantage Play a leading role in sustainability Be “Best - in - Class” in the Total Pulp Cost vision Maintain relevance in Pulp , through good projects Expand boldly into New Markets WITH FINANCIAL DISCIPLINE S hare buyback speed up and + R$1 ..0 bn program S hared value approach & 2 nd ESG Call & ¹ Caravelas in approval process .. |
| Pulp as a commodity One size does not fit all 11 Historical Volatility of Commodities (US$)¹ Crude Oil Soy Sugar LME Metais Cattle Copper BHKP ² Nickel Iron Ore 1 Source: Bloomberg, from Jan/2017 to Jun 30, 2022; 2 BHKP China 1. Structural demand growth 2. Tissue as main en d - use 3. Marginal cost producer even more pressured 4. Lower volatility when compared to other commodities 49% 42% 34% 28% 22% 21% 19% 17% 13% |

| Q&A 2Q 22 Investor Relations www.suzano.com.br/ri ri@suzano.com |