 | EXHIBIT 99.1 EARNINGS RELEASE 2Q24 | ||||||||||||||||
EBITDA reaches R$6.3 billion and leverage drops to 3.2x in USD
São Paulo, August 8th, 2024. Suzano S.A. (B3:SUZB5 | NYSE: SUZ), one of the world’s largest integrated pulp and paper producers, announces today its consolidated results for the second quarter of 2024 (2Q24).
HIGHLIGHTS
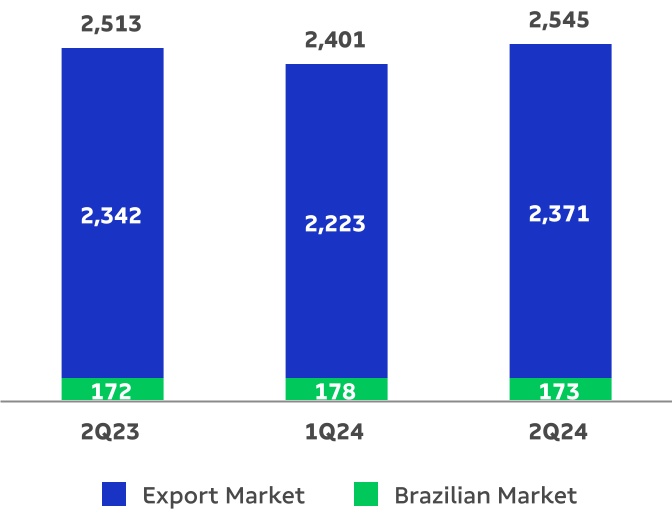
•Pulp sales of 2,545 thousand tons (1% vs. 2Q23).
•Paper sales1 of 333 thousand tons (13% vs. 2Q23).
•Adjusted EBITDA2 and Operating cash generation3: R$6.3 billion and R$4.5 billion, respectively.
•Adjusted EBITDA2/ton from pulp of R$2,176/ton (71% vs. 2Q23).
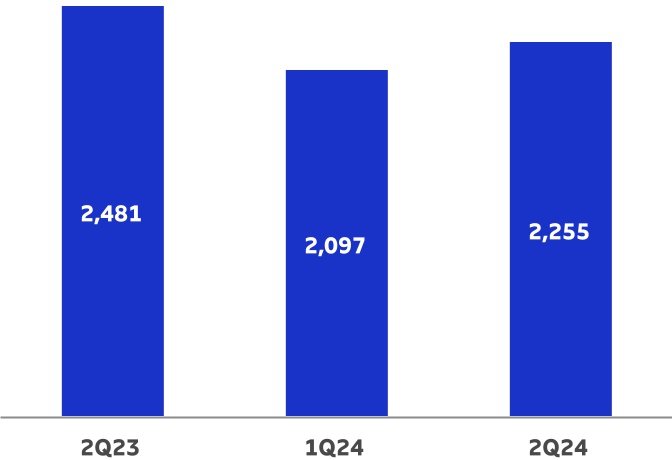
•Adjusted EBITDA2/ton from paper of R$2,255/ton (-9% vs. 2Q23).
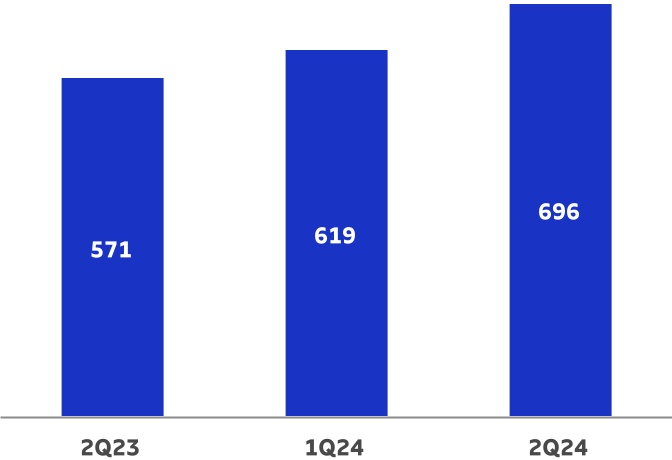
•Average net pulp price in export market: US$701/ton (25% vs. 2Q23).
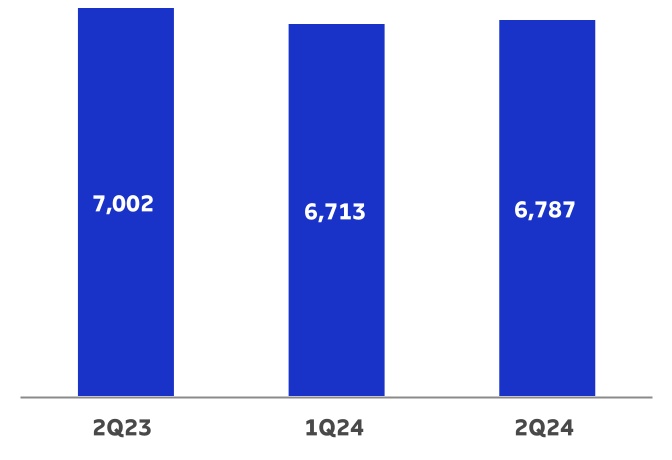
•Average net paper price1 of R$6,787/ton (-3% vs. 2Q23).
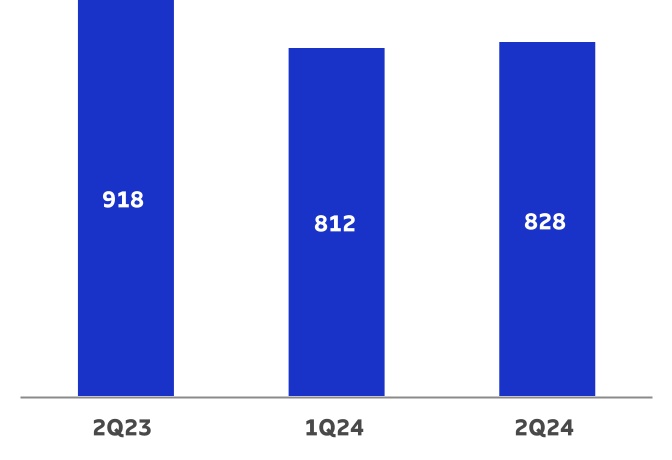
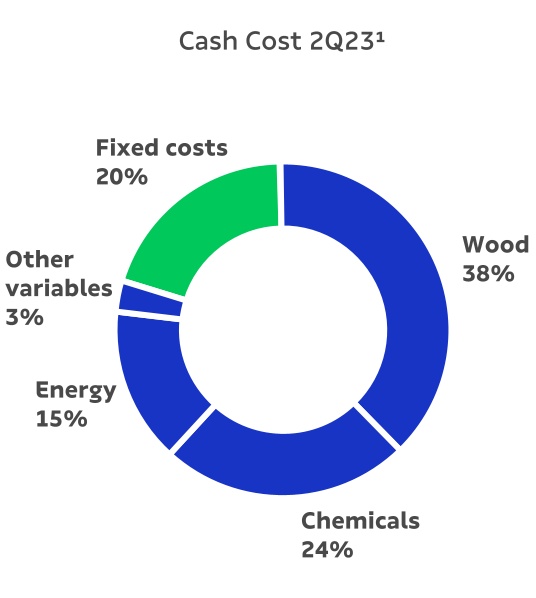
•Pulp cash cost ex-downtime of R$828/ton (-10% vs. 2Q23).
•Leverage of 3.2 times in USD and 3.5 times in BRL.
•Acquisition of a 15% stake in Lenzing for EUR230 million
| Financial Data (R$ million) | 2Q24 | 1Q24 | Δ Q-o-Q | 2Q23 | Δ Y-o-Y | LTM 2Q24 | ||||||||||||||
| Net Revenue | 11,494 | 9,459 | 22% | 9,160 | 25% | 40,272 | ||||||||||||||
Adjusted EBITDA2 | 6,288 | 4,558 | 38% | 3,919 | 60% | 19,045 | ||||||||||||||
Adjusted EBITDA Margin2 | 55% | 48% | 7 p.p. | 43% | 12 p.p. | 47% | ||||||||||||||
| Net Financial Result | (11,074) | (3,040) | — | 4,536 | — | (15,339) | ||||||||||||||
| Net Income | (3,766) | 220 | — | 5,078 | — | 240 | ||||||||||||||
Operating Cash Generation3 | 4,503 | 2,499 | 80% | 2,203 | 104% | 11,677 | ||||||||||||||
Net Debt/ Adjusted EBITDA2 (x) (R$) | 3.5 x | 3.6 x | -0.1 x | 2.0 x | 1.5 x | 3.5 x | ||||||||||||||
Net Debt/ Adjusted EBITDA2 (x) (US$) | 3.2 x | 3.5 x | -0.3 x | 2.2 x | 1.0 x | 3.2 x | ||||||||||||||
| Operational Data ('000 tons) | 2Q24 | 1Q24 | Δ Q-o-Q | 2Q23 | Δ Y-o-Y | LTM 2Q24 | ||||||||||||||
| Sales | 2,878 | 2,714 | 6% | 2,807 | 3% | 11,555 | ||||||||||||||
| Pulp | 2,545 | 2,401 | 6% | 2,513 | 1% | 10,192 | ||||||||||||||
Paper1 | 333 | 313 | 6% | 294 | 13% | 1,363 | ||||||||||||||
1Considers the results of the Consumer Goods Unit (tissue). | 2Excluding non-recurring items. | 3Considers Adjusted EBITDA less sustaining capex (cash basis).

The consolidated quarterly financial information was prepared in accordance with the standards set by the Securities and Exchange Commission of Brazil (CVM) and the Accounting Pronouncements Committee (CPC) and complies with the International Financial Reporting Standards (IFRS Accounting Standards) issued by the International Accounting Standards Board (IASB). The operating and financial information is presented on a consolidated basis and in Brazilian real (R$). Note that figures may present discrepancies due to rounding.
 | |||||||||||||||||
2Q24 EARNINGS RELEASE |  | ||||||||||||||||
CONTENTS
Page 2 of 42
2Q24 EARNINGS RELEASE | | ||||||||||||||||
EXECUTIVE SUMMARY
The pulp market registered another favorable performance during the second quarter of 2024, which reflected in another round of price increase implementations and in sales growth, despite a challenging scenario that emerged in China. The quarter was also marked by the appreciation of the average USD against the average BRL during the period, contributing to an increase in net revenue. Additionally, operational performance remained in line with the plan, with cash cost of production (excluding the effect of scheduled maintenance downtimes) marginally higher than in the previous quarter. This combination of factors resulted in a significant increase in adjusted EBITDA from pulp compared to both 1Q24 (+42%) and the same period of the previous year (+74%). At the paper business unit, sales volume increased chiefly due to seasonality, while prices remained practically stable (+1%). As such, consolidated adjusted EBITDA in the quarter totaled R$6.3 billion, while operating cash flow reached R$4.5 billion.
As for financial management, net debt in USD remained practically stable at US$12.0 billion, even though still due to high investments made by the Company aimed at generating significant and sustainable value in the long term. Leverage in USD, in turn, decreased to 3.2 times, remaining below the financial policy limit, due to the increase in Adjusted EBITDA in the last 12 months. The foreign exchange hedging policy continued to play its part, with the operational cash flow hedge showing a new positive cash inflow of R$0.3 billion, despite the depreciation of the BRL in the period.
In line with the "Being bold in expanding to new markets" and "Playing a leading role in sustainability" avenues, the Company announced to the market in June the acquisition of a non-controlling interest of 15% of the shares of Lenzing held by B&C (B&C Holding Österreich GmbH). The shareholders' agreement with B&C includes Suzano's right to hold two seats on Lenzing's Board of Directors and Suzano's right to change the control of Lenzing by acquiring an additional 15% ownership interest in Lenzing shares held by B&C, through a mandatory tender offer process established by the Austrian Takeover Act (which Suzano may exercise starting from the day after the first anniversary of the execution of the transaction until the end of 2028). The price for the acquisition of a non-controlling interest was EUR230 million to be fully paid on the closing date. Suzano's goal with the acquisition of Lenzing's non-controlling interest, as a partner of B&C, is to thoroughly understand, learn about, and monitor Lenzing's business before deciding to acquire control of the company.
Regarding the "Advancing in the links of the chain, always with a competitive advantage" avenue, the Company announced in June an agreement with Pactiv Evergreen Inc. for the acquisition of all the assets composing the integrated mills for the manufacture of coated and uncoated paperboard, used in the production of Liquid Packaging Board and Cupstock, located in the cities of Pine Bluff, Arkansas, and Waynesville, North Carolina, with a total integrated capacity of approximately 420 thousand tons of paperboard per year. The acquisition price was USD110 million, to be paid on the transaction date, subject to the usual price adjustments. The agreement includes a transition services agreement, in which Pactiv will provide services to Suzano in the acquired assets, and a long-term supply agreement, in which Suzano will supply Pactiv with the products currently produced in Pine Bluff and consumed by Pactiv, which will become a relevant client of this new Suzano asset. The transaction enables the Company to enter the North American paperboard market with competitiveness and scalability.
Continuing the advances in its strategy, in the context of the avenues “Maintain relevance in pulp” and “Be best in class in the total pulp cost vision”, the Company announced on July 21 the startup of the operation of the Ribas do Rio Pardo Unit (Cerrado Project) with annual production capacity of 2.55 million tons of bleached eucalyptus pulp. Estimates previously released regarding the production volume of the new mill remain valid, with approximately 900 thousand tons expected in 2024 and reaching 2.0 million tons at the end of 12 months of operation.
Page 3 of 42
2Q24 EARNINGS RELEASE | | ||||||||||||||||
PULP BUSINESS PERFORMANCE
PULP SALES VOLUME AND REVENUE
The second quarter of 2024 was marked by the increase in hardwood pulp prices, solid demand in Europe and North America, the normalization process of supply related to unscheduled downtimes, and a challenging scenario in China.
The paper production in China, according to SCI, increased by 1%, and the production of sanitary papers grew by 11%, while, according to UM Paper, exports of paperboard and sanitary papers segments increased 2% and 6%, respectively, when compared to 1Q24. On the same comparison base, exports of the Printing and Writing segment decreased 1%. However, the market scenario in the region has gradually become more complex during the second quarter compared to the prior quarter, due to additional pressure on the profitability margins of non-integrated paper producers in all segments, as well as the expectation of new capabilities entering the market.
The European and North American markets showed strong demand across all paper lines. In Europe, the ongoing reduction in the import of finished paper products, due to the Red Sea crisis, continues to favor the domestic market, mainly for sanitary paper products and printing and writing papers. In North America, the sanitary paper market continued to show solid demand.
Regarding pulp supply, the quarter began still affected by strikes in Finland and Chile, an earthquake in Taiwan, floods in southern Brazil, and accidents in Finnish and Indonesian facilities that led to an increase in unscheduled downtimes compared to the previous quarter. However, during the quarter, the normalization of this scenario was observed, with the resolution of strikes, reduction of rainfall in Rio Grande do Sul and the restoration of fiber production rate. Therefore, 3Q24 starts with a normalized and increasingly challenging global supply scenario in Asia.
Average PIX/FOEX prices of hardwood pulp in the quarter increased 10% in China and 21% in Europe compared to 1Q24. The difference between softwood and hardwood pulp prices in the quarter was US$83/t in China and US$151/t in Europe, in line with healthy levels.
Suzano’s pulp sales increased when compared to the previous quarter due to higher demand in China, mainly for the production of sanitary papers, totaling 2,545 thousand tons, up 6% from 1Q24 and 1% from 2Q23.
Pulp Sales Volume ('000 tons)
| +1% | +6% | ||||||||||||||||||||||||||||
| q | |||||||||||||||||||||||||||||
Page 4 of 42
2Q24 EARNINGS RELEASE | | ||||||||||||||||
Average net price in USD of pulp sold by Suzano was US$696/t, increasing 12% from 1Q24 and 22% from 2Q23. In the export market, average net price charged by the Company was US$701/t, up 12% from 1Q24 and 25% from 2Q23. Average net price in BRL was R$3,629/ton in 2Q24, 18% higher than in 1Q24, due to the continued price increase and the appreciation of average USD against average BRL (5%). Compared to 2Q23, the 28% increase was mainly due to the higher average net price in USD during the period and the 5% increase in average USD versus average BRL.
Average Net Price (USD/t)
| +22% | +12% | ||||||||||||||||||||||||||||
| q | |||||||||||||||||||||||||||||
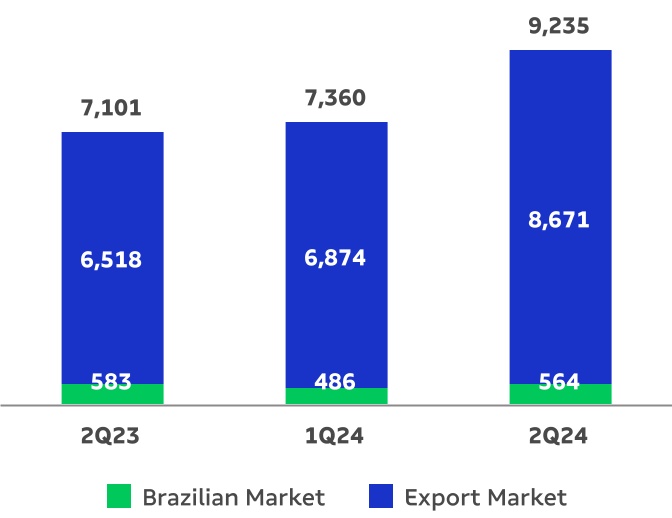
Net revenue from pulp increased 25% from 1Q24, due to the higher net average price in USD (+12%), the appreciation of the average USD against the average BRL (+5%), and higher sales volume (+6%). Compared to 2Q23, the 30% increase is explained mainly by the higher average net price in USD (+22%) and the appreciation of the average USD against the average BRL.
Pulp Net Revenue (R$ million)
| +30% | +25% | ||||||||||||||||||||||||||||
| q | |||||||||||||||||||||||||||||
Page 5 of 42
2Q24 EARNINGS RELEASE | | ||||||||||||||||
PULP CASH COST
In July 2022, Regulatory Standard 13 (Inspection of Boilers and Pressure Vessel) altered the maximum period for inspecting recovery boilers from 15 to 18 months. This change in the standard required a short intermediary interruption (40-60 hours) to wash the recovery boiler in order to maintain the operational stability of mills during the longest period between general downtimes. Note that this measure is necessary to reap the benefits of extending general downtimes, which result in better cost performance and increased production due to fewer scheduled downtimes in the long term (one less every four years).
Consolidated Pulp Cash Cost
ex-maintenance downtime (R$/ton)
ex-maintenance downtime (R$/ton)
| -10% | +2% | ||||||||||||||||||||||||||||
| q | |||||||||||||||||||||||||||||
Pulp Cash Cost
(R$/ton)
(R$/ton)
| -16% | +3% | |||||||||||||||||||||||||
| q | ||||||||||||||||||||||||||
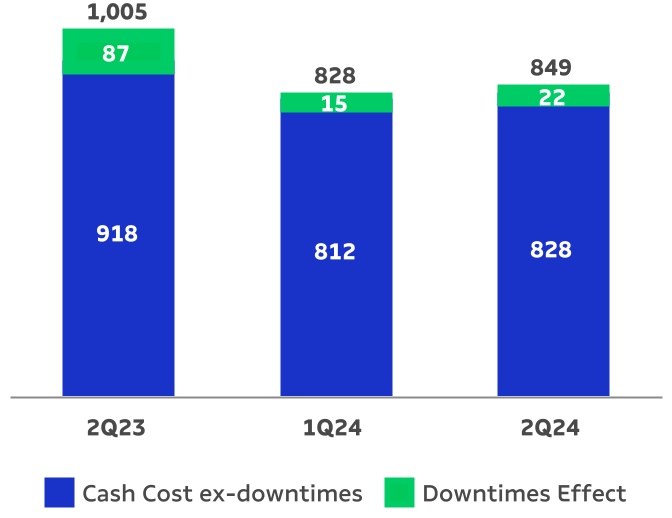
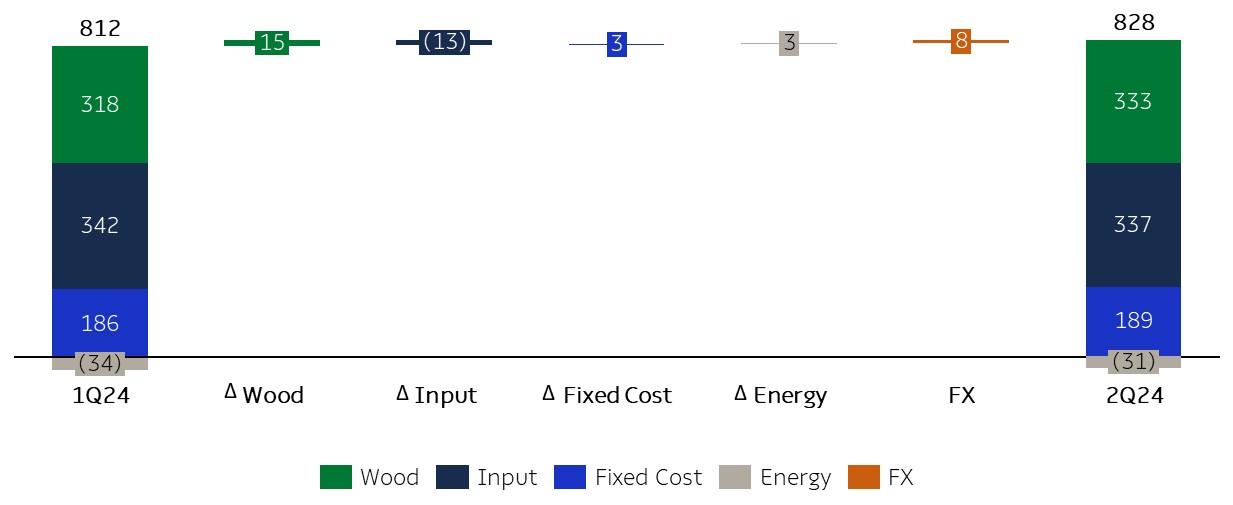
Cash cost excluding downtime in 2Q24 stood at R$828/t, an increase of +2% compared to 1Q24, due to: i) higher wood costs, mainly due to higher adjustments in logistics costs in Aracruz mill, increased average radius (supply mix) and higher consumption of third-party wood, partially offset by better operational performance in harvesting; ii) depreciation of the average USD against the average BRL; iii) lower revenue from energy sales; and iv) higher fixed cost (higher expenses on maintenance, materials, and labor). The negative factors of cash cost were partially offset by lower consumption of energy (especially fuel oil) and materials, as well as by lower prices, mainly for natural gas, caustic soda, and lime.
Page 6 of 42
2Q24 EARNINGS RELEASE | | ||||||||||||||||
Consolidated Pulp Cash Cost ex-maintenance (R$/ton)1
1Excludes the impact of maintenance and administrative downtimes.
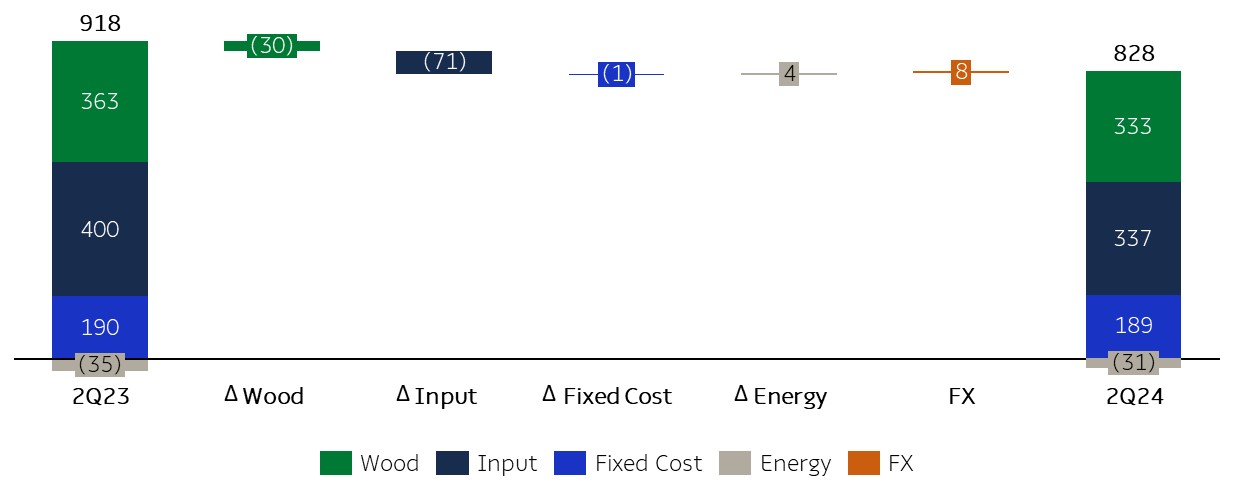
Cash cost excluding downtime in 2Q24 was 10% lower than in 2Q23, due to: i) lower prices of inputs, especially chemical (mainly caustic soda) and energy (lower natural gas prices due to the decline in Brent prices), and lower consumption of energy, especially natural gas and fuel oil, as a result of the benefits reaped from the higher energy efficiency project of the Jacareí mill and greater operational efficiency of mills; ii) lower wood costs, due to higher productivity in harvesting, lower specific consumption and lower share of third-party wood delivered to mill and lower diesel prices during the period. The positive effects on cash cost were partially offset by the exchange rate effect and lower revenue from energy sales (due to lower export volumes and lower prices).
Consolidated Pulp Cash Cost ex-maintenance (R$/ton)1
1Excludes the impact of maintenance and administrative downtimes.
Page 7 of 42
2Q24 EARNINGS RELEASE | | ||||||||||||||||
1Based on cash cost excluding downtimes. Excludes energy sales.
PULP SEGMENT EBITDA
| Pulp Segment | 2Q24 | 1Q24 | Δ Q-o-Q | 2Q23 | Δ Y-o-Y | LTM 2Q24 | ||||||||||||||
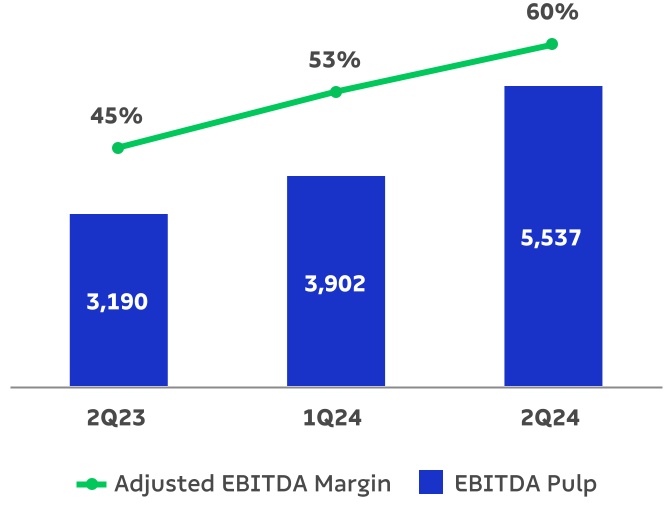
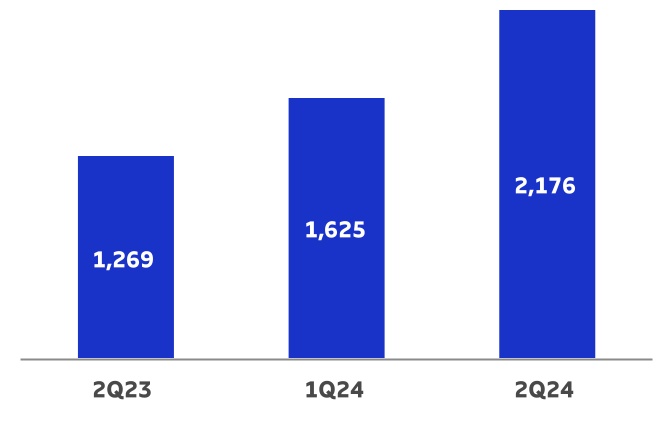
| Adjusted EBITDA (R$ million)¹ | 5,537 | 3,902 | 42% | 3,190 | 74% | 16,108 | ||||||||||||||
| Sales volume (k ton) | 2,545 | 2,401 | 6% | 2,513 | 1% | 10,192 | ||||||||||||||
| Pulp adjusted¹ EBITDA (R$/ton) | 2,176 | 1,625 | 34% | 1,269 | 71% | 1,580 | ||||||||||||||
1Excludes non-recurring items.
Adjusted EBITDA from pulp increased 42% from 1Q24 due to: i) the higher net average pulp price in USD (+12%); ii) the appreciation of the average USD against the average BRL (5%); and iii) higher sales volume in the period (+6%). These effects were marginally offset by the increase in SG&A expenses, which in turn was driven mainly due to higher personnel expenses and higher sales volumes. The 34% increase in adjusted EBITDA per ton is explained by the price and exchange rate effects, as mentioned previously.
Compared to 2Q23, the 74% increase in Adjusted EBITDA from pulp is due to: i) the increase in the average net price in USD (+22%); ii) the appreciation of the average USD against the average BRL (5%); iii) the lower cash COGS, which was benefited by the lower cash cost of production and lower impact of scheduled maintenance shutdowns; and iv) higher sales volume (+1%). These factors were partially offset by higher SG&A expenses (higher personnel expenses and the exchange rate impact on selling expenses). Adjusted EBITDA per ton increased 71% due to the same factors ex-volumes.
Page 8 of 42
2Q24 EARNINGS RELEASE | | ||||||||||||||||
Adjusted EBITDA1 (R$ million) and
Adjusted EBITDA Margin (%) of Pulp
1Excludes non-recurring items.
Pulp Adjusted EBITDA per Ton (R$/t)
| +71% | +34% | ||||||||||||||||||||||||||||
| q | |||||||||||||||||||||||||||||
OPERATING CASH FLOW FROM THE PULP SEGMENT
| Pulp Segment (R$ million) | 2Q24 | 1Q24 | Δ Q-o-Q | 2Q23 | Δ Y-o-Y | LTM 2Q24 | ||||||||||||||
Adjusted EBITDA1 | 5,537 | 3,902 | 42% | 3,190 | 74% | 16,108 | ||||||||||||||
Maintenance Capex2 | (1,652) | (1,894) | -13% | (1,547) | 7% | (6,688) | ||||||||||||||
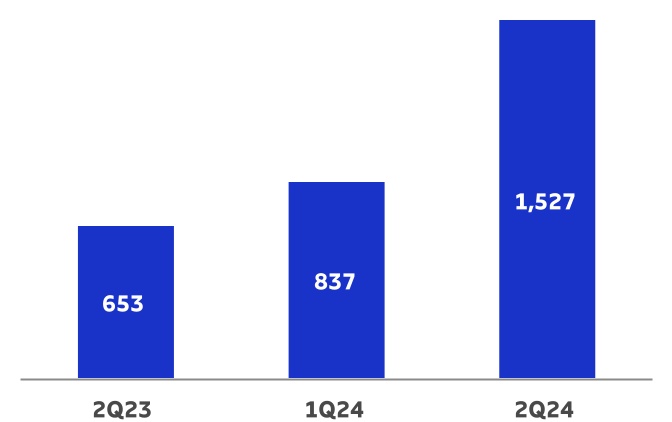
| Operating Cash Flow | 3,886 | 2,008 | 93% | 1,642 | 137% | 9,420 | ||||||||||||||
1Excludes non-recurring items.
2Cash basis.
Operating cash generation per ton in the pulp segment was 83% higher than in 1Q24 due to higher EBITDA per ton and lower sustaining capex per ton. Compared to 2Q23, the 134% is due to higher EBITDA per ton, partially offset by higher sustaining capex per ton.
Page 9 of 42
2Q24 EARNINGS RELEASE | | ||||||||||||||||
Operating Cash Flow of Pulp per ton (R$/t)
| +134% | +83% | ||||||||||||||||||||||||||||
| q | |||||||||||||||||||||||||||||
PAPER BUSINESS PERFORMANCE
The following data and analyses incorporate the joint results of the paper and consumer goods (tissue) businesses.
PAPER SALES VOLUME AND REVENUE
According to data published by Brazil's Forestry Industry Association (Ibá), demand for Printing & Writing in Brazil, including imports, increased 25% in the first two months of 2Q24 compared to the first two months of the previous quarter, and increased 12% compared to the same period last year.
The growth in the domestic market, compared to 1Q24, after a weak start to the year, results from the increase in sales in the coated paper lines, which was driven by the printing sector's preparation for the next electoral cycle and by positive seasonal effects. Such growth was also observed in the uncoated paper segment, driven by increased consumption following a first quarter that fell below expectations. Compared to the previous year, the better demand level in the uncoated paper lines was supported by a low comparison base, as the market was undergoing a destocking process, along with the effects of this year's election on the coated paper lines.
In international markets, demand showed signs of stabilization in Europe in 2Q24, after a strong performance in the previous quarter driven by inventory restocking following the destocking cycle of 2023. Compared to the same quarter last year, demand still registered growth, explained by a low comparison base in the same period of 2023. In Latin America and North America, the effects of this trend of inventory rebuilding were still observed in 2Q24, leading to higher demand compared to the previous quarter and to 2Q23.
Demand for paperboard in Brazil, Suzano’s flagship market for this product line, increased 4% in the first two months of 2Q24 compared to the previous quarter, due to improved consumption, especially in the food and pharmaceutical segments. Compared to the same period of the previous year, demand grew 14%, which, according to data from Ibá, reflects the normalization of inventories across the chain.
Consolidating the market segments mentioned above (paper market accessible to Suzano), domestic sales increased 7% in the first two months of 2Q24 compared to 2Q23, according to Ibá data. In the context of improvement in the domestic market compared to the previous quarter, the Company's performance was supported by the increase in sales volume in the domestic market and revenue management. Moreover, we continue to expand our unique go-to-market model, advancing on the strategy of winning new clients and expanding the regions served, as well as to invest in our portfolio of innovative products aimed at the packaging and single-use plastic replacement segments.
Page 10 of 42
2Q24 EARNINGS RELEASE | | ||||||||||||||||
With the acquisition of Kimberly Clark's tissue business in Brazil, the consumer goods segment has accounted for a bigger share of the paper business results since 3Q23.
Suzano’s paper sales (printing & writing, paperboard and tissue) in the domestic market totaled 239 thousand tons in 2Q24, up 14% from the previous quarter, driven by the recovery in Printing & Writing (uncoated and coated) paper sales and the continued growth in the tissue segment. Compared to 2Q23, the 14% growth was due to the increase in sales of Printing & Writing (coated), given the beginning of the preparation of the printing sector for the next electoral cycle and the increase in tissue volume, due to the incorporation of Kimberly Clark.
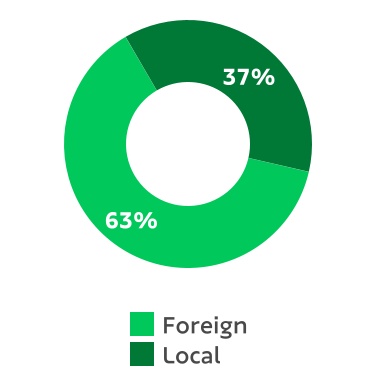
International paper sales totaled 94 thousand tons, down 9% from 1Q24, corresponding to 28% of total sales volume in 2Q24. The decrease in export sales volume was a result of the commercial allocation strategy between markets and segments, in addition to logistical challenges. Compared to 2Q23, the increase was 11%, still a reflection of the improvement in demand in the other regions, as previously mentioned, in addition to the commercial strategy of allocating volumes between markets (export and domestic) and segments.
Paper Sales Volume ('000 ton)1
| +13% | +6% | ||||||||||||||||||||||||||||
| q | |||||||||||||||||||||||||||||
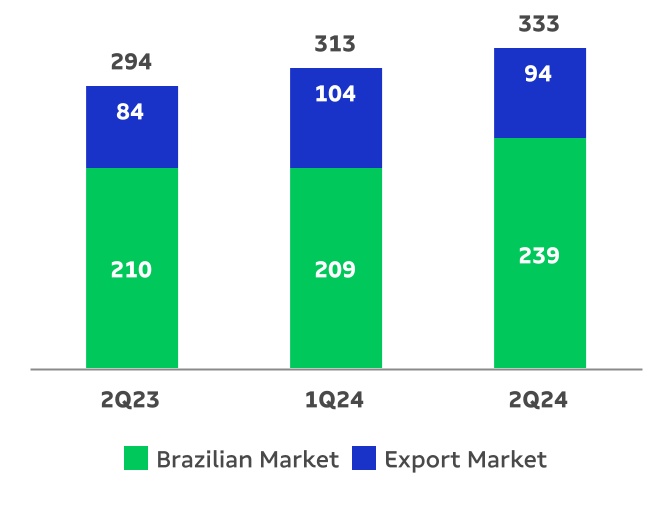
1Includes the Consumer Goods Unit.
Page 11 of 42
2Q24 EARNINGS RELEASE | | ||||||||||||||||
Average net price increased by 1% in relation to the previous quarter due to the appreciation of the average USD against the average BRL and the increase in the price of Printing & Writing paper in the external market, partially offset by the price decrease in the domestic market. Compared to 2Q23, the 3% decrease was mainly due to reductions across all segments in the international market, where prices, much above historical levels, still reflected the increase in costs and strong demand up to that point.
Average Net Paper Price (R$/t)1
| -3% | +1% | ||||||||||||||||||||||||||||
| q | |||||||||||||||||||||||||||||
Net revenue from paper sales amounted to R$2,259 million, up 8% from 1Q24, due to the higher sales volume (+6%) and effects of the appreciation of the average USD against the average BRL. Compared to 2Q23, the increase of 10% was due to the 13% increase in sales volume, partially offset by the 3% decrease in the average net price.
Paper Net Revenues (R$ million)1
| +10% | +8% | ||||||||||||||||||||||||||||
| q | |||||||||||||||||||||||||||||
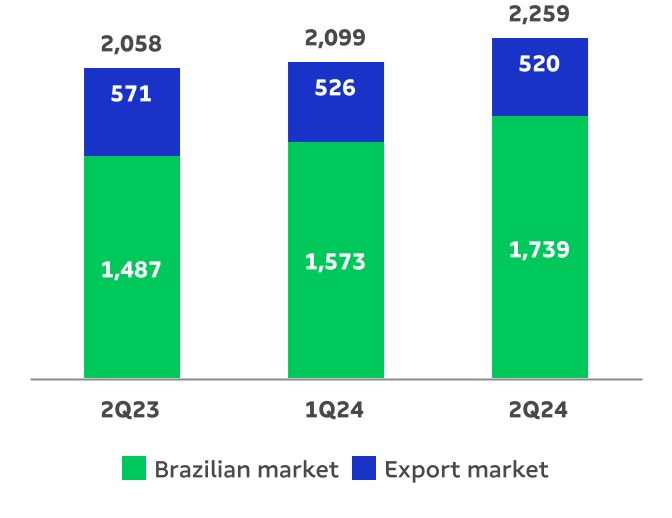
1Includes the Consumer Goods Unit.
Page 12 of 42
2Q24 EARNINGS RELEASE | | ||||||||||||||||
PAPER SEGMENT EBITDA
| Paper Segment | 2Q24 | 1Q24 | Δ Q-o-Q | 2Q23 | Δ Y-o-Y | LTM 2Q24 | ||||||||||||||
Adjusted EBITDA (R$ million)1 | 750 | 656 | 14% | 729 | 3% | 2,937 | ||||||||||||||
| Sales volume (k ton) | 333 | 313 | 6% | 294 | 13% | 1,363 | ||||||||||||||
Paper adjusted1 EBITDA (R$/ton) | 2,255 | 2,097 | 8% | 2,481 | -9% | 2,155 | ||||||||||||||
1Excludes non-recurring items.
Adjusted EBITDA from paper increased 14% from 1Q24, mainly due to higher sales volume (+6%), and lower cash COGS, partially offset by higher SG&A expenses (mainly related to the increase in third-party services and labor). Adjusted EBITDA per ton increased 8% mainly due to lower cash production cost per ton, partially offset by higher SG&A expenses, as mentioned before.
Compared to 2Q23, the 3% increase was mainly due to the 13% increase in sales volume and cash COGS reduction, partially offset by the decrease in the average price during the period. The -9% decrease in adjusted EBITDA per ton is explained by the increase in SG&A per ton — mainly related to the increase in freight costs in the domestic market — as well as by the decrease in the average price during the period.
Adjusted EBITDA (R$ million) and
Adjusted EBITDA Margin (%) of Paper

Page 13 of 42
2Q24 EARNINGS RELEASE | | ||||||||||||||||
Paper Adjusted EBITDA (R$/t)
| -9% | +8% | ||||||||||||||||||||||||||||
| q | |||||||||||||||||||||||||||||
OPERATING CASH FLOW FROM THE PAPER SEGMENT
| Paper Segment (R$ million) | 2Q24 | 1Q24 | Δ Q-o-Q | 2Q23 | Δ Y-o-Y | LTM 2Q24 | ||||||||||||||
Adjusted EBITDA1 | 750 | 656 | 14% | 729 | 3% | 2,937 | ||||||||||||||
Maintenance Capex2 | (134) | (164) | -19% | (169) | -21% | (680) | ||||||||||||||
| Operating Cash Flow | 617 | 491 | 26% | 560 | 10% | 2,257 | ||||||||||||||
1Excludes non-recurring items.
2Cash basis.
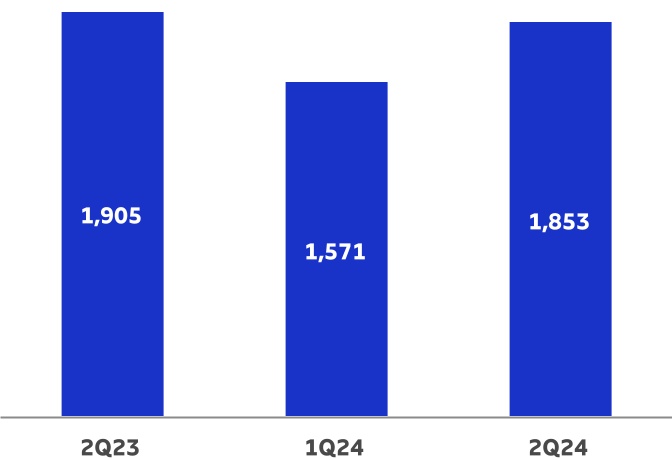
Operating cash generation per ton in the paper segment was R$1,853/t in 2Q24, increasing 18% from 1Q24, driven by higher EBITDA per ton and lower sustaining capex per ton. Compared to the same period last year, the decrease of 3% was due to lower EBITDA per ton, partially compensated by a lower sustaining capex per ton.
Paper Operating Cash Generation per Ton (R$/t)
| -3% | +18% | ||||||||||||||||||||||||||||
| q | |||||||||||||||||||||||||||||
Page 14 of 42
2Q24 EARNINGS RELEASE | | ||||||||||||||||
FINANCIAL PERFORMANCE
NET REVENUE
Suzano’s net revenue in 2Q24 was R$11,494 million, 80% of which came from exports (vs. 78% in 1Q24 and 77% in 2Q23). In relation to 1Q24, net revenue increased 22% due to the higher net average pulp price in USD (+12%), higher sales volume (6% increase in pulp and paper), and the appreciation of the average USD against the average BRL (+5%). The 25% increase in consolidated net revenue in relation to 2Q23 is mainly due to the higher net average pulp price in USD (+22%), the appreciation of average USD against average BRL (+5%), and the higher sales volume (increase of 1% and 13% in the pulp and paper segments, respectively).
Net Revenue1 (R$ million) | |||||||||||||||||||||||||||||
| +25% | +22% | ||||||||||||||||||||||||||||
| q | |||||||||||||||||||||||||||||
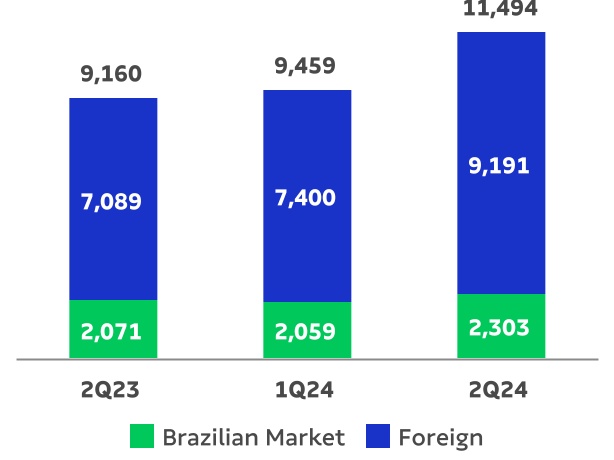
1Does not include Portocel service revenue.
CALENDAR OF SCHEDULED MAINTENANCE DOWNTIMES
| Mill – Pulp capacity | 2023 | 2024 | 2025 | |||||||||||||||||||||||||||||||||||||||||
| 1Q23 | 2Q23 | 3Q23 | 4Q23 | 1Q24 | 2Q24 | 3Q24 | 4Q24 | 1Q25 | 2Q25 | 3Q25 | 4Q25 | |||||||||||||||||||||||||||||||||
| Aracruz - Mill A (ES) – 590 kt | No downtime | |||||||||||||||||||||||||||||||||||||||||||
| Aracruz - Mill B (ES) – 830 kt | No downtime | |||||||||||||||||||||||||||||||||||||||||||
| Aracruz - Mill C (ES) – 920 kt | No downtime | No downtime | ||||||||||||||||||||||||||||||||||||||||||
| Imperatriz (MA)¹ – 1,650 kt | No downtime | |||||||||||||||||||||||||||||||||||||||||||
| Jacareí (SP) – 1,100 kt | No downtime | |||||||||||||||||||||||||||||||||||||||||||
| Limeira (SP)¹ – 690 kt | ||||||||||||||||||||||||||||||||||||||||||||
| Mucuri - Mill 1 (BA)¹ – 600 kt | No downtime | |||||||||||||||||||||||||||||||||||||||||||
| Mucuri - Mill 2 (BA) – 1,130 kt | No downtime | |||||||||||||||||||||||||||||||||||||||||||
| Ribas do Rio Pardo (MS) - 2,550 kt | N/A | No downtime | ||||||||||||||||||||||||||||||||||||||||||
| Suzano (SP)¹ – 620 kt | No downtime | |||||||||||||||||||||||||||||||||||||||||||
| Três Lagoas - Mill 1 (MS) – 1,300 kt | No downtime | |||||||||||||||||||||||||||||||||||||||||||
| Três Lagoas - Mill 2 (MS) – 1,950 kt | No downtime | |||||||||||||||||||||||||||||||||||||||||||
| Veracel (BA)² – 560 kt | ||||||||||||||||||||||||||||||||||||||||||||
1Includes integrated capacities and fluff.
2Veracel is a joint operation between Suzano (50%) and Stora Enso (50%) with total annual capacity of 1,120 thousand tons.
Page 15 of 42
2Q24 EARNINGS RELEASE | | ||||||||||||||||
COST OF GOODS SOLD (COGS)
| COGS (R$ million) | 2Q24 | 1Q24 | Δ Q-o-Q | 2Q23 | Δ Y-o-Y | LTM 2Q24 | ||||||||||||||
| COGS (Income statement) | 6,093 | 5,700 | 7% | 6,228 | -2% | 24,673 | ||||||||||||||
| (-) Depreciation, depletion and amortization | 1,852 | 1,706 | 9% | 1,624 | 14% | 7,133 | ||||||||||||||
| Cash COGS | 4,241 | 3,994 | 6% | 4,604 | -8% | 17,540 | ||||||||||||||
| Sales volume (000' ton) | 2,878 | 2,714 | 6% | 2,807 | 3% | 11,555 | ||||||||||||||
| Cash COGS/ton (R$/ton) | 1,474 | 1,471 | 0% | 1,640 | -10% | 1,518 | ||||||||||||||
Cash COGS in 2Q24 totaled R$4,241 million, or R$1,474/ton. Compared to 1Q24, cash COGS increased by 6%, chiefly due to the higher volume sold, the appreciation of the average USD against the average BRL (5%) and the greater impact of scheduled maintenance downtimes, partially offset by the lower logistics cost in USD/t, in turn due to greater optimization of the use of break bulk shipowner contracts in the pulp segment. On a per-ton basis, cash COGS remained stable.
Compared to 2Q23, cash COGS decreased 8%, chiefly due to lower production cost ex-downtimes (as discussed previously) and lower impact of scheduled maintenance downtimes, partially offset by higher sales volume (increase of 13% and 1% in the paper and pulp segments, respectively) and the appreciation of average USD against average BRL (5%). On a per-ton basis, cash COGS decreased 10% year on year due to the same factors ex-volumes.
SELLING EXPENSES
| Selling Expenses (R$ million) | 2Q24 | 1Q24 | Δ Q-o-Q | 2Q23 | Δ Y-o-Y | LTM 2Q24 | ||||||||||||||
| Selling expenses (Income Statement) | 700 | 653 | 7% | 627 | 12% | 2,719 | ||||||||||||||
| (-) Depreciation, depletion and amortization | 240 | 239 | 0% | 238 | 1% | 956 | ||||||||||||||
| Cash selling expenses | 460 | 414 | 11% | 389 | 18% | 1,763 | ||||||||||||||
| Sales volume (000' ton) | 2,878 | 2,714 | 6% | 2,807 | 3% | 11,555 | ||||||||||||||
| Cash selling expenses/ton (R$/ton) | 160 | 153 | 5% | 139 | 15% | 153 | ||||||||||||||
Cash selling expenses increased by 11% compared to 1Q24, mainly due to: i) the higher sales volume; ii) the appreciation of the average USD against the average BRL (5%); iii) higher labor costs (salaries and benefits); and iv) higher expenses with third-party services. Cash selling expenses per ton increased 5% due to the factors as mentioned, ex-volumes.
In relation to 2Q23, cash selling expenses increased 18% mainly due to: i) the higher sales volume, especially in the paper business unit; ii) higher expenses with labor and third-party services, as well as higher storage expenses, largely associated with the acquisition of Kimberly Clark's tissue assets in Brazil; and iii) appreciation of the average USD against the average BRL (5%). Cash selling expenses per ton increased 15%, due to the same factors mentioned above ex-volumes.
GENERAL AND ADMINISTRATIVE EXPENSES
| General and Administrative Expenses (R$ million) | 2Q24 | 1Q24 | Δ Q-o-Q | 2Q23 | Δ Y-o-Y | LTM 2Q24 | ||||||||||||||
| General and Administrative Expenses | 558 | 503 | 11% | 427 | 31% | 2,167 | ||||||||||||||
| (-) Depreciation, depletion and amortization | 35 | 34 | 2% | 28 | 23% | 133 | ||||||||||||||
| Cash general and administrative expenses | 523 | 469 | 12% | 399 | 31% | 2,034 | ||||||||||||||
| Sales volume (000' ton) | 2,878 | 2,714 | 6% | 2,807 | 3% | 11,555 | ||||||||||||||
| Cash general and administrative expenses/t (R$/ton) | 182 | 173 | 5% | 142 | 28% | 176 | ||||||||||||||
Page 16 of 42
2Q24 EARNINGS RELEASE | | ||||||||||||||||
Compared to 1Q24, the 12% increase in cash general and administrative expenses is mainly explained by higher personnel expenses (salaries and benefits) and third-party services (notably consulting and auditing). On a per-ton basis, these expenses increased 5% due to the same factors.
Compared to 2Q23, cash general and administrative expenses increased 31% mainly due to higher personnel expenses (variable compensation, salaries and benefits) and third-party services such as auditing and computing. Both factors are also partly associated with the inclusion of expenses resulting from the acquisition of Kimberly Clark's tissue business in Brazil. On a per-ton basis, the 28% increase is explained by the same factors.
Other operating income (expenses) was an income of R$464 million in 2Q24, compared to an expense of R$40 million in 1Q24 and an income of R$1,205 million in 2Q23. The variation in relation to 1Q24 and 2Q23 is mainly explained by the update of the fair value of the biological asset, given the absence of the effect in the previous quarter and lower impact when compared to 2Q23.
ADJUSTED EBITDA
| Consolidated | 2Q24 | 1Q24 | Δ Q-o-Q | 2Q23 | Δ Y-o-Y | LTM 2Q24 | ||||||||||||||
| Adjusted EBITDA (R$ million)¹ | 6,288 | 4,558 | 38% | 3,919 | 60% | 19,045 | ||||||||||||||
| Adjusted EBITDA Margin | 55% | 48% | 7 p.p | 43% | 12 p.p | 47% | ||||||||||||||
| Sales Volume (k ton) | 2,878 | 2,714 | 6% | 2,807 | 3% | 11,555 | ||||||||||||||
| Adjusted EBITDA¹/ton (R$/ton) | 2,185 | 1,679 | 30% | 1,396 | 57% | 1,648 | ||||||||||||||
1Excludes non-recurring items.
The 38% increase in Adjusted EBITDA in 2Q24 compared to 1Q24 is mainly due to: i) the higher net average pulp price in USD (+12%); ii) the appreciation of the average USD against the average BRL (5%); and iii) the higher sales volume of pulp and paper (+6%). These factors were partially offset by the increase in SG&A expenses, as explained earlier. Adjusted EBITDA per ton increased 30% due to the same factors, excluding sales volume.
In relation to 2Q23, the 60% increase Adjusted EBITDA was due to: i) the higher average net pulp price in USD (+22%); ii) the appreciation of the average USD against the average BRL (+5%); iii) the drop in cash COGS for pulp and paper, as a result of the lower production cost; and iv) higher sales volume, especially in the paper segment. These effects were partially offset by higher SG&A expenses, as explained earlier. Adjusted EBITDA per ton increased 57% due to the same factors, excluding sales volumes.
Page 17 of 42
2Q24 EARNINGS RELEASE | | ||||||||||||||||
FINANCIAL RESULT
| Financial Result (R$ million) | 2Q24 | 1Q24 | Δ Q-o-Q | 2Q23 | Δ Y-o-Y | LTM 2Q24 | ||||||||||||||
| Financial Expenses | (1,153) | (1,130) | 2% | (1,149) | 0% | (4,634) | ||||||||||||||
| Interest on loans and financing (local currency) | (355) | (346) | 3% | (359) | -1% | (1,447) | ||||||||||||||
| Interest on loans and financing (foreign currency) | (961) | (885) | 9% | (797) | 21% | (3,586) | ||||||||||||||
| Capitalized interest¹ | 425 | 378 | 12% | 278 | 53 | 1,451 | ||||||||||||||
| Other financial expenses | (263) | (277) | -5% | (270) | -3% | (1,052) | ||||||||||||||
| Financial Income | 457 | 424 | 8% | 404 | 13% | 1,917 | ||||||||||||||
| Interest on financial investments | 410 | 409 | 0% | 407 | 1% | 1,804 | ||||||||||||||
| Other financial income | 47 | 15 | - | (3) | - | 113 | ||||||||||||||
| Monetary and Exchange Variations | (6,487) | (1,699) | - | 2,377 | - | (8,724) | ||||||||||||||
| Foreign exchange variations (Debt) | (7,311) | (2,072) | - | 3,032 | - | (9,740) | ||||||||||||||
| Other foreign exchange variations | 824 | 373 | - | (656) | - | 1,017 | ||||||||||||||
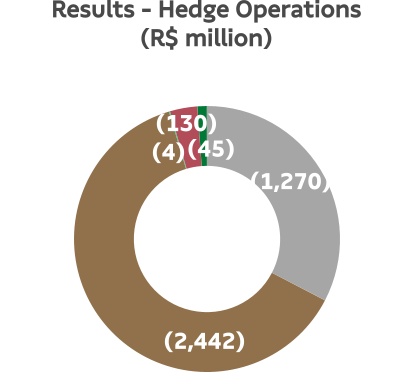
Derivative income (loss), net2 | (3,890) | (635) | - | 2,904 | - | (3,897) | ||||||||||||||
| Operating Cash flow hedge | (2,442) | (405) | - | 1,466 | - | (2,280) | ||||||||||||||
| Cash flow - Cerrado project hedge | (45) | (64) | - | 298 | - | (233) | ||||||||||||||
| Debt hedge | (1,270) | (258) | - | 974 | - | (1,453) | ||||||||||||||
| Others³ | (134) | 92 | - | 166 | - | 70 | ||||||||||||||
| Net Financial Result | (11,074) | (3,040) | - | 4,536 | - | (15,339) | ||||||||||||||
1Capitalized interest related to work in progress.
2Variation in mark-to-market adjustment (2Q24: -R$1,848 | 1Q24: R$916 million), plus adjustments paid and received (2Q24: -R$1,127 million).
3Includes commodity hedge and embedded derivatives.
Financial expenses increased 2% in relation to 1Q24, mainly due to higher interest expenses in foreign currency as a result of the 5% decline in average BRL against average USD. This impact was partially offset by the increase in capitalized interest arising from the capitalization of funds invested in the executed phases of the Cerrado Project. Compared to 2Q23, financial expenses remained stable, with the increase in interest expenses in foreign currency (affected by the increase in the SOFR interest rate and the devaluation of the BRL) mostly offset by the increase in capitalized interest.
Financial income increased 8% compared to 1Q24, mainly due to the increase in other financial income, as a result of the inflation adjustment of taxes and federal contributions to be refunded. Compared to 2Q23, financial income increased 13%, due to the increase in other financial income related to interest on tax credits (non-recurring credit related to the exclusion of ICMS from the PIS/COFINS base).
Inflation adjustment and exchange variation had a negative impact of R$6,487 million on the Company’s financial result due to the 11% drop in BRL against USD at the close of 1Q24, which affected foreign currency debt (US$12,935 million at the end of 2Q24). This effect was partially offset by the positive result of exchange variation on other balance sheet items in foreign currency.
Note that the accounting impact of exchange variation on foreign currency debt has a cash impact only on the respective maturities.
Page 18 of 42
2Q24 EARNINGS RELEASE | | ||||||||||||||||
Derivative operations resulted in a loss of R$3,890 million in 2Q24, mainly due to the negative impact of weaker BRL. The mark-to-market adjustment of derivative instruments on June 30th, 2024 was negative R$1,848 million, compared to a positive adjustment of R$916 million on March 31st, 2024, representing a negative variation of R$2,763 million. Note that the impact of BRL depreciation on the derivatives portfolio generates a cash impact only upon the respective maturities. The net effect on cash, which refers to the maturity of derivative operations in the second quarter, was a negative R$1,127 million (R$1,514 million loss on debt hedge, R$356 million gain on cash flow hedge and R$32 million gain from commodities). The negative cash adjustment of the cash flow hedge mainly refers to the early settlement of the swap for the 6th issuance debenture, resulting from the liability management carried out with the 11th issuance debenture, as per the Market Announcement of May 29th, 2024.
As a result of the above factors, net financial result in 2Q24, considering all financial expense and income lines, was an expense of R$11,074 million, compared to an expense of R$3,040 million in 1Q24 and an income of R$4,536 million in 2Q23.
DERIVATIVE OPERATIONS
Suzano carries out derivative operations exclusively for hedging purposes. The following table reflects the position of derivative hedging instruments on June 30th, 2024:
Hedge1 | Notional (US$ million) | Fair Value (R$ million) | ||||||||||||
| Jun/24 | Mar/24 | Jun/24 | Mar/24 | |||||||||||
| Debt | 4,022 | 4,191 | (590) | (835) | ||||||||||
| Cash Flow – Operating (ZCC + NDF) | 6,808 | 5,607 | (1,383) | 1,330 | ||||||||||
| Cash Flow – Cerrado² (ZCC + NDF) | 165 | 231 | (19) | 111 | ||||||||||
Others3 | 338 | 394 | 144 | 310 | ||||||||||
| Total | 11,333 | 10,423 | (1,848) | 916 | ||||||||||
1See note 4 of the 2Q24 Quarterly Financial Statements (ITR) for further details and the fair value sensitivity analysis.
2Hedge program related to capex in BRL (ZCC) and EUR (NDF) of the Cerrado Project.
3Includes commodity hedging and embedded derivatives.
The Company’s foreign exchange exposure policy seeks to minimize the volatility of its cash generation and ensure greater flexibility in cash flow management. Currently, the policy stipulates that surplus dollars may be partially hedged (at least 40% and up to 75% of exchange variation exposure over the next 24 months) using plain vanilla instruments such as Zero Cost Collars (ZCC) and Non-Deliverable Forwards (NDF). At the end of 2Q24, 75% of the exchange variation exposure was covered.
Considering the foreign exchange exposure related to Capex in the Cerrado Project, since approximately 67% of Capex is pegged to local currency, the Board of Directors approved on October 28, 2021 a program for contracting additional specific hedge operations to protect from it such exposure. The program approved (established in the Derivatives Management Policy available on the Investor Relations website) initially involved a maximum amount (notional) of up to US$1 billion and a term of operations of up to 36 months. On July 27th, 2022, the Board of Directors approved the expansion of the program, increasing the maximum amount (notional) to US$1.5 billion while maintaining the previously established term. To ensure transparency regarding the Cerrado Project's hedge program, since 4Q21 the Company has been prominently disclosing the operations contracted.
Since about 33% of the Capex of the Cerrado Project is denominated in EUR, in 3Q22, the Company contracted hedge operations through NDFs to protect the exposure in EUR of the Capex of the Cerrado Project, converting it into USD. This type of hedge is established in the Derivatives Management Policy available on the Investor Relations website.
Page 19 of 42
2Q24 EARNINGS RELEASE | | ||||||||||||||||
ZCC transactions establish minimum and maximum limits for the exchange rate that minimize adverse effects in the event of significant appreciation of the BRL. As such, if the exchange rate is within such limits, the Company neither pays nor receives any financial adjustments. This characteristic allows for capturing greater benefits from export revenue in a potential scenario of BRL appreciation versus USD within the range contracted. In cases of extreme BRL appreciation, the Company is protected by the minimum limits, which are considered appropriate for the operation. However, this protection instrument also limits, temporarily and partially, potential gains in scenarios of extreme BRL depreciation when exchange rates exceed the maximum limits contracted.
On June 30th, 2024, the outstanding notional value of operations involving forward USD sales through ZCCs related to Cash Flows (including those related to the Cerrado Project) was US$6,547 million, with an average forward rate ranging from R$5.25 to R$6.06 and maturities distributed between July 2024 and June 2026. On the same date, the outstanding notional value of operations involving forward USD sales through NDFs was US$358 million (including those related to the Cerrado Project), whose maturities are distributed between July 2024 and June 2026 and with an average rate of R$5.57. Regarding hedge for foreign exchange exposure in EUR, the outstanding notional value of forward EUR purchases at the end of 2Q24 was €66 million (USD69 million), with an average contracted rate of 1.04 EUR/USD and maturities through July 2024. In 2Q24, Cash Flow and Cerrado Project hedge operations resulted in a loss of R$2,487 million. The mark-to-market (“MtM” or “fair value”) value of these operations was negative of R$1,402 million, with R$1,383 million related to cash flow operating hedge and R$19 million related to operating hedge of the Cerrado Project.
The following table presents a sensitivity analysis of the cash impact that the Company could have on its cash flow hedge portfolios (ZCC and NDF) if the exchange rate remains the same as at the end of 2Q24 (BRL/USD = 5.56) in the coming quarters, as well as the projected cash impact for R$0.10 variations below / above the strike of put/call options, respectively, defined in each quarter. Note that the figures presented in the table are the Company’s projections based on the end-of-period curves and could vary depending on market conditions.
Page 20 of 42
2Q24 EARNINGS RELEASE | | ||||||||||||||||
| Cash Adjustment (R$ million) | |||||||||||||||||
| Maturity (up to) | Strike Range | Notional (US$ million) | Actual | Exchange Rate 2Q24 (R$ 5.56) | Sensitivity at R$ 0.10 / US$ variation (+/-) | ||||||||||||
| Zero Cost Collars | |||||||||||||||||
| 2Q24 | — | — | 252 | — | — | ||||||||||||
| 3Q24 | 5,72 - 6,59 | 235 | — | 39 | 24 | ||||||||||||
| 4Q24 | 5,71 - 6,63 | 505 | — | 77 | 51 | ||||||||||||
| 1Q25 | 5,50 - 6,37 | 280 | — | 9 | 28 | ||||||||||||
| 2Q25 | 5,23 - 6,03 | 881 | — | — | 88 | ||||||||||||
| 3Q25 | 5,13 - 5,94 | 1,036 | — | — | 104 | ||||||||||||
| 4Q25 | 5,07 - 5,83 | 1,309 | — | — | 131 | ||||||||||||
| 1Q26 | 5,11 - 5,89 | 1,077 | — | — | 108 | ||||||||||||
| 2Q26 | 5,35 - 6,16 | 1,215 | — | 24 | 122 | ||||||||||||
| Total | 5,25 - 6,06 | 6,538 | 252 | 149 | 654 | ||||||||||||
| NDF | |||||||||||||||||
| 2Q24 | — | — | 19 | — | — | ||||||||||||
| 3Q24 | 5.35 | 20 | — | (4) | 2 | ||||||||||||
| 4Q24 | 5.40 | 45 | – | (7) | 5 | ||||||||||||
| 2Q25 | 5.68 | 115 | – | 14 | 12 | ||||||||||||
| 1Q26 | 5.85 | 27 | — | 8 | 3 | ||||||||||||
| 2Q26 | 5.95 | 63 | — | 24 | 6 | ||||||||||||
| Total | 5.69 | 270 | 19 | 35 | 27 | ||||||||||||
| NDF Cerrado | |||||||||||||||||
| 2Q24 | — | — | 3 | — | — | ||||||||||||
| 3Q24 | 5.20 | 88 | — | (31) | (9) | ||||||||||||
| Total | 5.20 | 88 | 3 | (31) | (9) | ||||||||||||
| Zero Cost Collars – Cerrado Project | |||||||||||||||||
| 2Q24 | — | — | 57 | — | — | ||||||||||||
| 3Q24 | 6.35 - 8.34 | 9 | — | 7 | 1 | ||||||||||||
| Total | 6,35 - 8,34 | 9 | 57 | 7 | 1 | ||||||||||||
| Cash Adjustment (R$ million) | |||||||||||||||||
| Maturity (up to) | Strike Range | Notional (US$ million)¹ | Actual | Exchange Rate 2Q24 (€ 1.07) | Sensitivity at € 0.10 / US$ variation (+/-) | ||||||||||||
| NDF – Projeto Cerrado (EUR/USD) | |||||||||||||||||
| 2Q24 | — | — | 25 | — | — | ||||||||||||
| 3Q24 | 1.04 | 69 | — | 12 | 37 | ||||||||||||
| Total | 1.04 | 69 | 25 | 12 | 37 | ||||||||||||
1Translated at the average contracted rate of 1.04 Euro/USD.
To mitigate the effects of exchange and interest rate variations on its debt and its cash flows, the Company also uses currency and interest rate swaps. Swap contracts are entered into considering different interest rates and inflation indices in order to mitigate the mismatch between financial assets and liabilities.
Page 21 of 42
2Q24 EARNINGS RELEASE | | ||||||||||||||||
On June 30th, 2024, the Company had an outstanding amount (notional value) of US$4,022 million in swap contracts as shown in the table below. In 2Q24, the result of debt hedge transactions was an expense of R$1,270 million, mainly due to weaker BRL. The mark-to-market adjustment (fair value) of these operations was a loss of R$590 million.
| Notional (US$ million) | Fair Value (R$ million) | |||||||||||||||||||
| Debt Hedge | Maturity (up to) | Currency | Jun/24 | Mar/24 | Jun/24 | Mar/24 | ||||||||||||||
| Swap (CDI x USD) | 2036 | USD | 910 | 1,249 | (318) | (1,149) | ||||||||||||||
| Swap (SOFR x USD) | 2030 | USD | 1,438 | 1,598 | 392 | 453 | ||||||||||||||
| Swap (CDI x SOFR) | 2034 | USD | 610 | 350 | (277) | 16 | ||||||||||||||
| Swap SOFR | 2029 | USD | 151 | 151 | (22) | (16) | ||||||||||||||
| Swap (IPCA x CDI) | 2038 | BRL | 914¹ | 843¹ | (364) | (138) | ||||||||||||||
| Total | 4,022 | 4,191 | (590) | (835) | ||||||||||||||||
1Translated at the closing exchange rate (R$5.56).
The following table presents a sensitivity analysis1 of the cash impact that the Company could have on its debt hedge portfolio (swaps) if the exchange rate remains the same as at the end of 2Q24 (BRL/USD = 5.56) in the coming quarters, as well as the projected variation in cash impact for each R$0.10 variation on the same reference exchange rate (2Q24). Note that the figures presented in the table are the Company’s projections based on the end-of-period curves and could vary depending on market conditions.
| Cash Adjustment (R$ million) | ||||||||||||||
| Maturity (up to) | Notional (US$ million) | Actual | R$ / US$ = 5.56 (2Q24) | Sensitivity at R$ 0.10 / US$ variation (+/-)1 | ||||||||||
| 2Q24 | — | (1,514) | — | — | ||||||||||
| 3Q24 | 231 | — | 114 | — | ||||||||||
| 4Q24 | 225 | — | 129 | 1 | ||||||||||
| 2025 | 777 | — | 440 | 7 | ||||||||||
| 2026 | 393 | — | 395 | 8 | ||||||||||
| 2027 | 111 | — | 398 | 9 | ||||||||||
| 2028 | 43 | — | 361 | 23 | ||||||||||
| >=2029 | 2,242 | — | 907 | 181 | ||||||||||
| Total | 4,022 | (1,514) | 2,744 | 216 | ||||||||||
1Sensitivity analysis considers variation only in the exchange rate (R$/US$), while other variables are presumed constant.
Other transactions involving the Company’s derivatives are related to the embedded derivative resulting from forestry partnerships and commodity hedges, as shown in the table.
| Notional (US$ million) | Fair Value (R$ million) | Cash Adjustment (R$ million) | ||||||||||||||||||||||||
| Other hedges | Maturity (up to) | Index | Jun/24 | Mar/24 | Jun/24 | Mar/24 | Jun/24 | Mar/24 | ||||||||||||||||||
| Embedded derivative | 2039 | Fixed USD | USD US-CPI | 139 | 131 | 67 | 197 | — | — | ||||||||||||||||||
| Commodities | 2025 | Brent/VLSFO/Others | 199 | 263 | 77 | 112 | 32 | 32 | ||||||||||||||||||
| Total | 338 | 394 | 144 | 310 | 32 | 32 | ||||||||||||||||||||
Page 22 of 42
2Q24 EARNINGS RELEASE | | ||||||||||||||||
A portion of the forestry partnership agreements and standing timber supply agreements is denominated in USD per cubic meter of standing timber, adjusted by U.S. inflation measured by the Consumer Price Index (CPI), which is not related to inflation in the economic environment where the forests are located and, hence, constitutes an embedded derivative. This instrument, presented in the table above, consists of a sale swap contract of the variations in the US-CPI during the period of the contracts. See note 4 of the 2Q24 Financial Statements for more details and for a sensitivity analysis of the fair value in case of a sharp rise in the US-CPI and USD. On June 30th, 2022, the outstanding notional value of the operation was US$139 million. The result of this swap in 2Q24 was a loss of R$130 million. The mark-to-market (fair value) adjustment of these operations generated a gain of R$67 million at the end of the quarter.
The Company is also exposed to the price of some commodities and, therefore, constantly assesses the contracting of derivative financial instruments to mitigate such risks. On June 30th, 2021, the outstanding notional value of these operations was US$199 million. The result of these hedges in 2Q24 was a loss of R$4 million. The mark-to-market (fair value) adjustment of these operations generated a gain of R$77 million at the end of the quarter.
 Total (3,891)
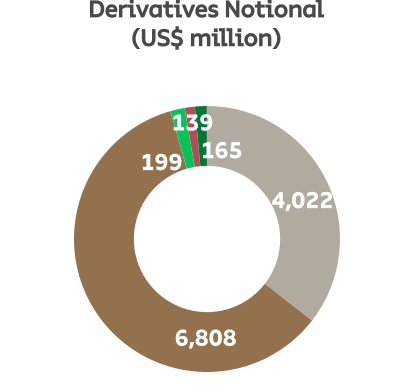 Total 11,333
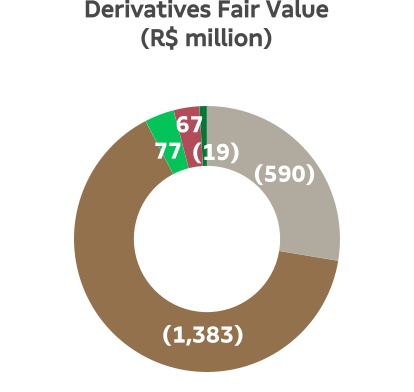 Total (1,848)
| Debt Hedge | Cash flow Hedge | Commodity Hedge | Embedded Derivatives | Cerrado Hedge | ||||||||||||||||||||||||||||||||||||||||||||||||||||
NET INCOME (LOSS)
In 2Q24, the Company posted a net loss of R$3,766 million, compared to net income of R$220 million in 1Q24 and R$5,078 million in 2Q23. The negative variation in relation to 1Q24 was mainly due to the negative financial result, which was explained by the impact of weaker BRL on debt and derivative operations (compared to the lower negative result registered in the previous quarter). These effects were partially offset by the better operating result (with the increase in net revenue and the result of the revaluation of biological assets), despite the increases in COGS and SG&A expenses, and by the increase in the deferred IR/CSLL credit (IR/CSLL levied mainly on losses from exchange variation on debt and mark-to-market adjustments of derivatives).
The variation in relation to 2Q23 is also explained by the financial loss (caused by weaker BRL on debt and derivative operations vs. stronger BRL in 2Q23), the decrease in the fair value adjustment of biological assets, and the increase in SG&A expenses. These factors were partially offset by the positive amount of deferred IR/CSLL (as opposed to the negative value of 2Q23, due to the high positive result of exchange variation on debt and fair-value of derivatives), the increase in net revenue and lower COGS.
Page 23 of 42
2Q24 EARNINGS RELEASE | | ||||||||||||||||
DEBT
| Debt (R$ million) | 2Q24 | 1Q24 | Δ Q-o-Q | 2Q23 | Δ Y-o-Y | ||||||||||||
| Local Currency | 16,723 | 15,381 | 9% | 14,367 | 16% | ||||||||||||
| Short Term | 710 | 649 | 9% | 2,920 | -76% | ||||||||||||
| Long Term | 16,012 | 14,733 | 9% | 11,446 | 40% | ||||||||||||
| Foreign Currency | 71,902 | 63,568 | 13% | 60,166 | 20% | ||||||||||||
| Short Term | 6,540 | 4,395 | 49% | 2,612 | — | ||||||||||||
| Long Term | 65,362 | 59,173 | 10% | 57,554 | 14% | ||||||||||||
| Gross Debt | 88,624 | 78,950 | 12% | 74,532 | 19% | ||||||||||||
| (-) Cash | 22,062 | 19,323 | 14% | 20,215 | 9% | ||||||||||||
| Net debt | 66,563 | 59,626 | 12% | 54,317 | 23% | ||||||||||||
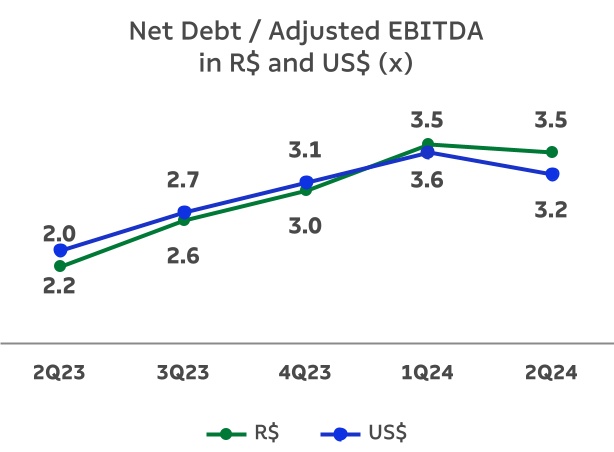
| Net debt/Adjusted EBITDA¹ (x) - R$ | 3.5x | 3.6x | -0.1x | 2.0x | 1.5x | ||||||||||||
| Net debt/Adjusted EBITDA¹ (x) – US$ | 3.2x | 3.5x | -0.3x | 2.2x | 1.0x | ||||||||||||
1Excluding non-recurring items.
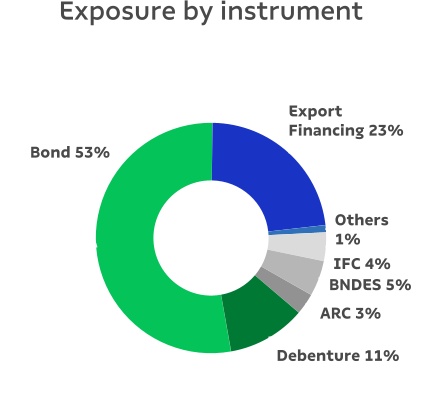
On June 30th, 2024, gross debt totaled R$88.6 billion and was composed of 92% long-term maturities and 8% short-term maturities. Foreign currency debt corresponded to 81% of the Company's total debt at the end of the quarter. The percentage of gross debt in foreign currency, considering the effect of debt hedge, was 90%. Compared to 1Q24, gross debt increased 12%, mainly due to the effect of exchange variation of R$7,311 million and net funding operations carried out during the period. Suzano ended 2Q24 with 44% of total debt linked to ESG instruments.
Suzano contracts debt in foreign currency as a natural hedge, since net operating cash generation is mostly denominated in foreign currency (USD) due to its predominant status as an exporter. This structural exposure allows the Company to match loans and financing payments in USD with receivable flows from sales.
Gross Debt Evolution (R$ million)
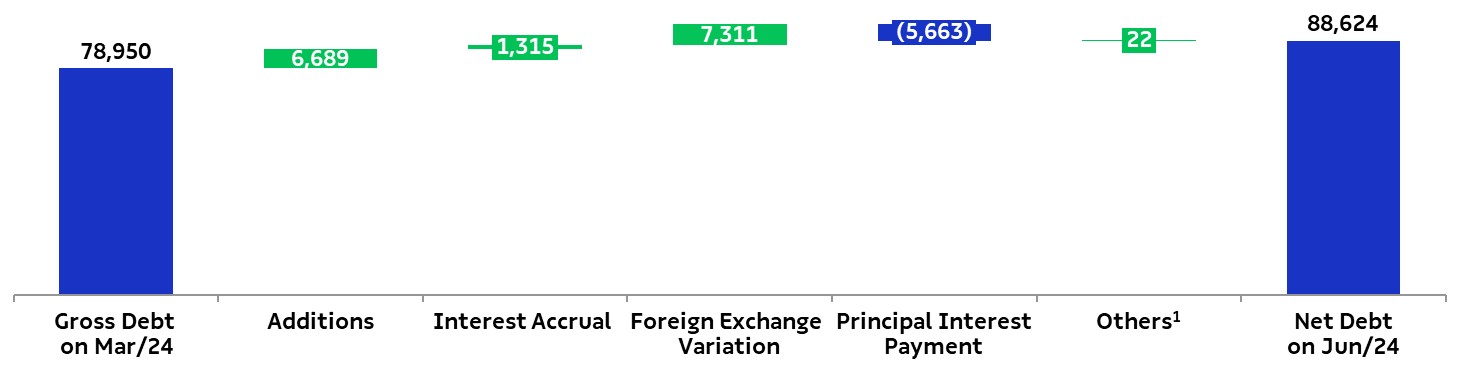
1Corresponding mainly to transaction costs (issue, funding, goodwill, discount and loss on business combinations, etc.).
On June 30th, 2024, the total average cost of debt in USD was 5.1% p.a. (considering the debt in BRL adjusted by the market swap curve), compared to 5.0% p.a. on March 31st, 2024. The average term of consolidated debt at the end of the quarter was 78 months, compared to 74 months at the end of 1Q24.
Page 24 of 42
2Q24 EARNINGS RELEASE | | ||||||||||||||||
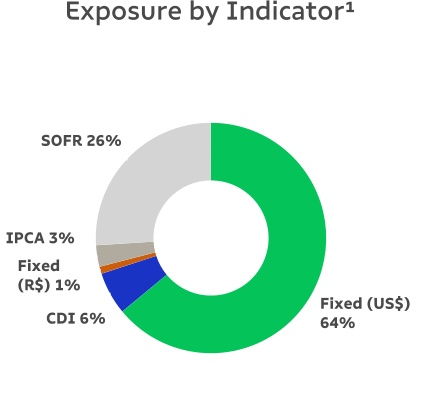

1Considers the portion of debt with swap for fixed rate in foreign currency. The exposure of the original debt was: Fixed (US$) – 54%, Libor/SOFR– 27%, CDI – 11%, Other (Fixed R$, IPCA, TJLP, others) – 8%.
2Considers the portion of debt with currency swaps. The original debt was 81% denominated in USD and 19% in BRL.
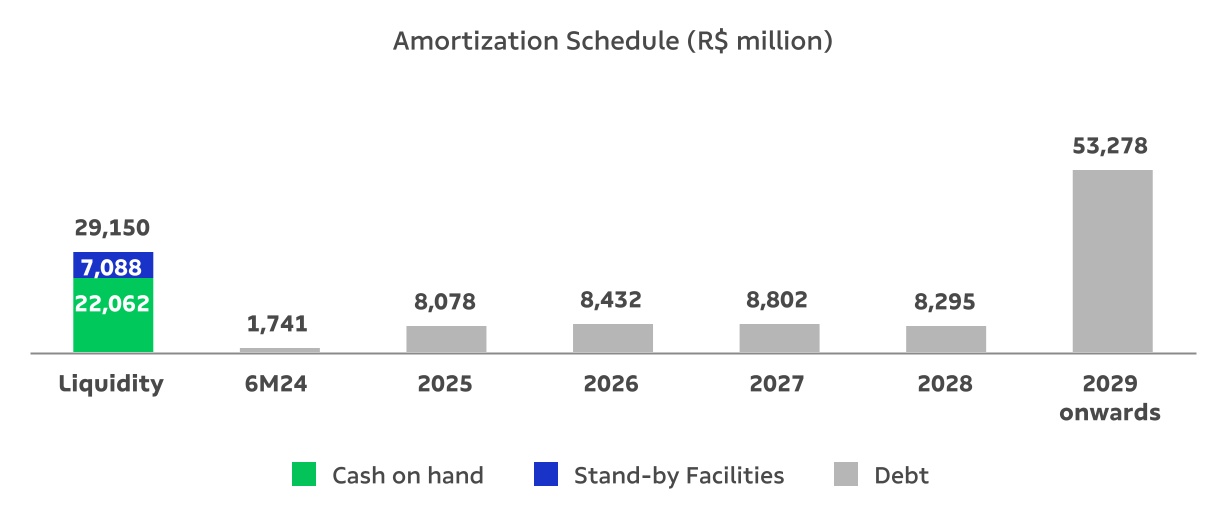
Cash and cash equivalents and financial investments on June 30th, 2024 amounted to R$22.1 billion, 36% of which were in foreign currency, allocated to remunerated account or in short-term fixed-income investments abroad. The remaining 64% was invested in local currency fixed-income bonds (mainly CDBs, but also in government bonds and others), remunerated at the CDI rate.
On June 30th, 2024, the company also had a stand-by credit facility totaling R$7.2 billion (US$1.3 billion) available through February 2027. This facility strengthens the company's liquidity position and can be withdrawn during times of uncertainty. As a result, the cash and equivalents of R$22.1 billion plus the stand-by credit facilities amounted to a readily available cash position of R$29.1 billion on June 30th, 2024. Moreover, the Company has a financing agreement with Finnvera (US$800 million) related to the Cerrado Project, as per the Notice to the Market of November 1, 2022, which has not yet been withdrawn, further strengthening its liquidity position.
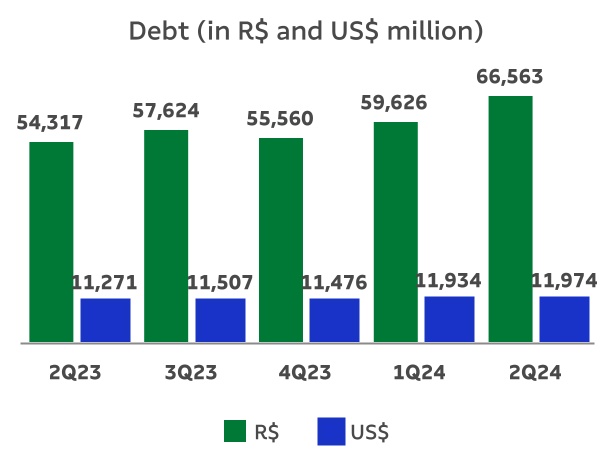
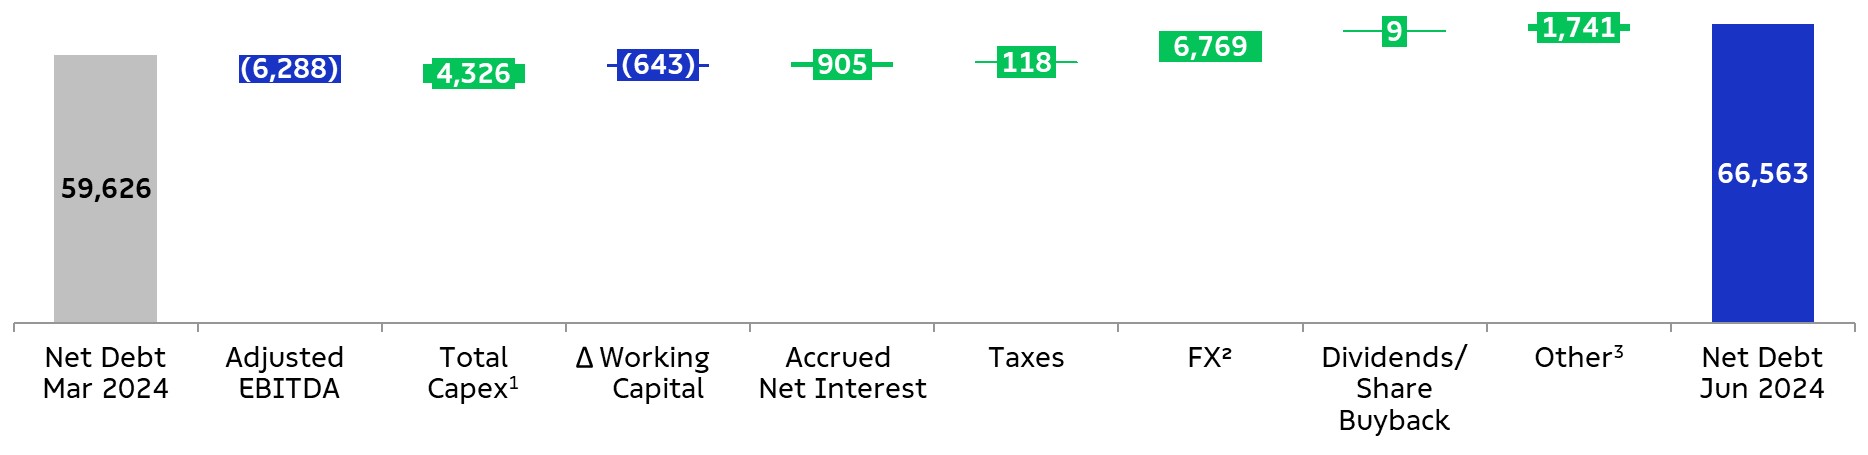
On June 30th, 2024, net debt stood at R$66.6 billion (US$12.0 billion), compared to R$59.6 billion (US$11.9 billion) on March 31st, 2024. The increase is explained by higher gross debt (due to the exchange rate variation during the period).
Financial leverage, measured as the ratio of net debt to Adjusted EBITDA in BRL, stood at 3.5 times on June 30th, 2024 (3.6 times in 03/31/2024). The same ratio in USD (the measure established in Suzano’s financial policy), fell to 3.2 times on June 30th, 2024 (3.5 times in 03/31/2024).
Page 25 of 42
2Q24 EARNINGS RELEASE | | ||||||||||||||||
The breakdown of total gross debt between trade and non-trade finance on June 30th, 2024 is shown below:
| 6M24 | 2025 | 2026 | 2027 | 2028 | 2029 onwards | Total | |||||||||||||||||
| Trade Finance¹ | 26% | 68% | 59% | 50% | 42% | 3% | 23% | ||||||||||||||||
| Non-Trade Finance² | 74% | 32% | 41% | 50% | 58% | 97% | 77% | ||||||||||||||||
1EEC, ECN, EPP
2Bonds, BNDES, CRA, Debentures, among others.
CAPEX
In 2Q24, capital expenditure (cash basis) totaled R$3,955 million. The 5% decrease in relation to 1Q24 was due to lower expenses on forest maintenance, largely related to the decrease in acquisitions of standing wood from third parties. This factor was partially offset by higher investments in the Cerrado Project, in line with its disbursement curve.
Compared to 2Q23, the 37% decrease is mainly due to i) the reduction in investments in Land and Forests given the high investment in the previous year, when the second installment of the deal related to Parkia was disbursed; ii) lower expenses with the Cerrado Project; and iii) drop in the Expansion and Modernization item due to the conclusion of the energy efficiency project at the Jacareí mill. These factors were partially offset by a 4% increase in maintenance, explained by the start of the Cerrado Project's forestry operation, as well as higher expenses with the projects announced in Espírito Santo (new tissue mill in Aracruz and new biomass boiler - item “Others”).
| Investments¹ (R$ million) | 2Q24 | 1Q24 | Δ Q-o-Q | 2Q23 | Δ Y-o-Y | LTM 2Q24 | Guidance 2024 | ||||||||||||||||
| Maintenance | 1,785 | 2,058 | -13% | 1,716 | 4% | 7,369 | 7,677 | ||||||||||||||||
| Industrial maintenance | 204 | 290 | -30% | 286 | -29% | 1,327 | 1,263 | ||||||||||||||||
| Forestry maintenance | 1,565 | 1,753 | -11% | 1,403 | 12% | 5,878 | 6,177 | ||||||||||||||||
| Others | 16 | 15 | 3% | 27 | -42% | 163 | 238 | ||||||||||||||||
| Expansion and modernization | 41 | 39 | 3% | 231 | -82% | 415 | 331 | ||||||||||||||||
| Land and forestry | 462 | 470 | -2% | 1,828 | -75% | 1,337 | 3,296 | ||||||||||||||||
| Others² | 60 | 114 | -48% | 8 | — | 206 | 544 | ||||||||||||||||
| Cerrado Project | 1,607 | 1,469 | 9% | 2,446 | -34% | 7,407 | 4,605 | ||||||||||||||||
| Total | 3,955 | 4,152 | -5% | 6,228 | -37% | 16,734 | 16,453 | ||||||||||||||||
1Does not include the acquisition of Kimberly Clark’s tissue business in Brazil, in the amount of R$1,073 million, as explained in Note 15 of the 2Q23 financial statements.
Page 26 of 42
2Q24 EARNINGS RELEASE | | ||||||||||||||||
2Correspond to investments in the state of Espírito Santo, according to the Material Fact of 10/26/2023, as well as investments in Port Terminals. It is worth noting that the values shown in the table above do not include the monetization effect of ICMS credits in the state of Espírito Santo.
CERRADO PROJECT
The financial progress “inside the fence” execution (which corresponds to industrial and infrastructure investments) at the end of June reached R$14.1 billion (90%), while capex disbursement was R$19.8 billion, which corresponds to 89% of total capex (R$22.2 billion).
According to Material Fact notice disclosed on July 21st, 2024, the Company started operating the new pulp production mill in Ribas do Rio Pardo, located in the state of Mato Grosso do Sul, with an annual production capacity of 2.55 million tons of bleached eucalyptus pulp.
Suzano, its suppliers and other partners of the Cerrado Project will work together in the ramp-up phase that has begun, aiming to execute it properly and as planned. The previously disclosed estimates on the production volume of the new mill remain valid, with approximately 900 thousand tons expected in 2024, reaching 2.0 million tons by the end of 12 months of operations as from the present date. The Company estimates a period of approximately nine months for completion of the learning curve.
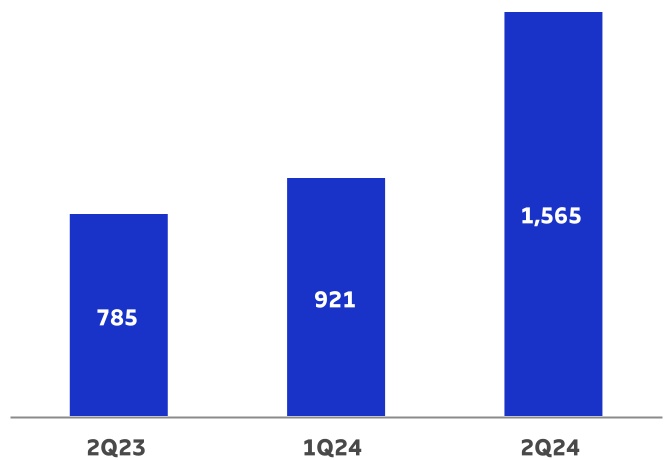
OPERATING CASH GENERATION
| Operating Cash Flow (R$ million) | 2Q24 | 1Q24 | Δ Q-o-Q | 2Q23 | Δ Y-o-Y | LTM 2Q24 | ||||||||||||||
Adjusted EBITDA1 | 6,288 | 4,558 | 38% | 3,919 | 60% | 19,045 | ||||||||||||||
Maintenance Capex2 | (1,785) | (2,058) | -13% | (1,716) | 4% | (7,369) | ||||||||||||||
| Operating Cash Flow | 4,503 | 2,499 | 80% | 2,203 | 104% | 11,677 | ||||||||||||||
| Operating Cash Flow (R$/ton) | 1,565 | 921 | 70% | 785 | 99% | 1,011 | ||||||||||||||
1Excludes non-recurring items.
2Cash basis.
Operating cash generation, measured by adjusted EBITDA less sustaining capex (cash basis), amounted to R$4,503 million in 2Q24. The 70% increase in operating cash generation per ton in relation to 1Q24 is mainly due to higher adjusted EBITDA per ton in the period, as well as a reduction in sustaining capex per ton. Compared to 2Q23, operating cash flow per ton increased 99%, due to higher Adjusted EBITDA per ton, which was partially offset by higher sustaining capex per ton.
Operating Cash Flow per ton (R$/ton)
| +99% | +70% | ||||||||||||||||||||||||||||
| q | |||||||||||||||||||||||||||||
Page 27 of 42
2Q24 EARNINGS RELEASE | | ||||||||||||||||
FREE CASH FLOW
| Free Cash Flow (R$ million) | 2Q24 | 1Q24 | Δ Q-o-Q | 2Q23 | Δ Y-o-Y | LTM 2Q24 | ||||||||||||||
| Adjusted EBITDA | 6,288 | 4,558 | 38% | 3,919 | 60% | 19,045 | ||||||||||||||
| (-) Total Capex¹ | (4,326) | (4,243) | 2% | (7,503) | -42% | (17,455) | ||||||||||||||
| (-) Leases contracts – IFRS 16 | (313) | (321) | -2% | (284) | 10% | (1,274) | ||||||||||||||
(+/-) △ Working capital2 | 643 | 146 | — | 2,789 | — | 1,939 | ||||||||||||||
(-) Net interest3 | (438) | (1,521) | — | (532) | -18% | (4,046) | ||||||||||||||
| (-) Income taxes | (118) | (56) | — | (47) | — | (392) | ||||||||||||||
| (-) Dividend and interest on own capital payment/Share Buyback Program | (9) | (1,619) | — | (636) | — | (1,978) | ||||||||||||||
| (+/-) Derivative cash adjustment | (1,127) | 444 | — | 1,299 | — | 1,212 | ||||||||||||||
| Free cash flow | 601 | (2,612) | — | (996) | — | (2,950) | ||||||||||||||
| (+) Capex ex-maintenance | 1,313 | 2,782 | -53% | 5,642 | -77% | 9,696 | ||||||||||||||
| (+) Dividend and interest on own capital payment/Share Buyback Program | 9 | 1,619 | — | 636 | — | 1,978 | ||||||||||||||
Free cash flow – Adjusted4 | 1,922 | 1,789 | 7% | 5,283 | -64% | 8,724 | ||||||||||||||
1Accrual basis, except for the Parkia deal (payment of R$1.6 billion in 2Q23) and the investment related to the Cerrado Project in 2Q23 and 3Q23, as per note 15 (Property, Plant and Equipment) to the Financial Statements. Also considering the acquisition of Kimberly Clark Brazil's tissue business in 2Q23 in the amount of R$1,073 million (operation is a business combination and not acquisition of assets).
2Considers costs of capitalized loans paid (2Q24: R$425 million | 1Q24: R$378 million | 2Q23: R$512 million).
3Considers interest paid on debt and interest received on financial investments.
4Free cash flow prior to dividend and interest on own capital payments, share buyback program and capex ex-maintenance (accrual basis).
Adjusted Free Cash Flow in 2Q24 was R$1,922 million, compared to R$1,789 million in 1Q24 and R$5,283 million in 2Q23. Compared to the previous period, the indicator increased by 7% mainly due to: i) higher adjusted EBITDA; ii) lower concentration of interest payments in the period; and iii) greater release of working capital, in turn mainly explained by the positive variation in suppliers and salaries payable (versus negative effects in 1Q24). These effects were partially offset by the negative cash adjustment of derivatives (notably driven by the early full payment of the swap of the 6th issue debenture, as explained earlier), higher sustaining capex and higher income tax payment.
Compared to 2Q23, Adjusted Free Cash Flow decreased 64%, due to i) the negative cash adjustment of derivatives (versus positive adjustment in the same period of the previous year); ii) lower release of working capital (as opposed to the large positive effect on accounts receivable in 2Q23, when a sharp drop in pulp prices was observed); and iii) higher sustaining capex. These factors were partially offset mainly by the higher adjusted EBITDA.
EVOLUTION OF NET DEBT
Following were the changes in net debt in 2Q24:
1Accrual basis, except for the capex related to Cerrado Project (cash basis), as per the Cash Flow Statement.
2Net of exchange variations on cash and financial investments.
3Considers cash amounts related to derivative adjustments, lease agreements and other items.
Page 28 of 42
2Q24 EARNINGS RELEASE | | ||||||||||||||||
TOTAL OPERATIONAL EXPENDITURE - PULP
As disclosed in the Material Fact notice of February 28th, 2023, total operational expenditure forecast for 2027 is approximately R$1,750 per ton and the indicator has been evolving according to plan, considering the exchange rate and monetary premises used. Said estimate refers to the currency in real terms of 2024.
EVENTS SUBSEQUENT TO THE REPORTING PERIOD
On December 23rd, 2023, the Company entered into purchase agreements for the acquisition of 100% of the capital stock of the companies Timber VII SPE S.A. and Timber XX SPE S.A., owned by BTG Pactual Timberland Investment Group, LLC. In consideration of the shares of the acquired companies and considering adjustments provided for in the agreements, the transaction was settled on July 31st, 2024, at R$2.1 billion, which is subject to non-material post-closing adjustments to reflect the position of the acquired companies as of the closing date, with respect to the typical economic and operational aspects in this type of transaction.
On July 12th, 2024, the Company signed an agreement with Pactiv Evergreen Inc. for the acquisition of the assets composing the integrated mills producing coated and uncoated paperboard, used in the production of Liquid Packaging Board and Cupstock, located in the cities of Pine Bluff, Arkansas, and Waynesville, North Carolina (USA), with a total integrated production capacity of approximately 420 thousand tons. The acquisition price was R$1,450 million. The agreement includes a transition services agreement, in which Pactiv will provide services to Suzano in the acquired assets, and a long-term supply agreement, in which Suzano will supply Pactiv with the products currently produced in Pine Bluff and consumed by Pactiv, which will become a relevant client of this new Suzano asset. The transaction enables the Company to enter the North American paperboard market with competitiveness and scalability.
Page 29 of 42
2Q24 EARNINGS RELEASE | | ||||||||||||||||
CAPITAL MARKETS
On June 30th, 2024, Suzano’s stock was quoted at R$57.01/share (SUZB3) and US$10.27/share (SUZ). The Company’s stock is listed on the Novo Mercado, the listing segment of the São Paulo Stock Exchange (B3 – Brasil, Bolsa e Balcão) with the highest corporate governance standards, and on the New York Stock Exchange (NYSE) - Level II.
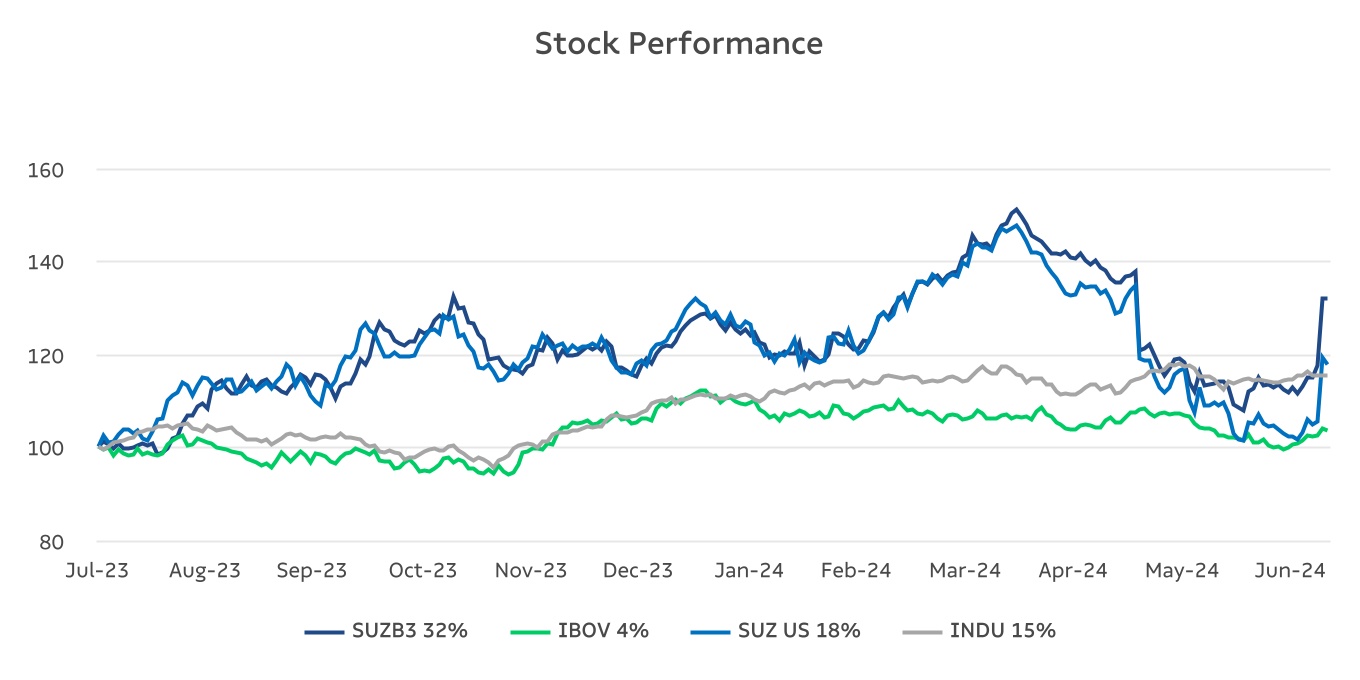
Source: Bloomberg.
Liquidity - SUZB3
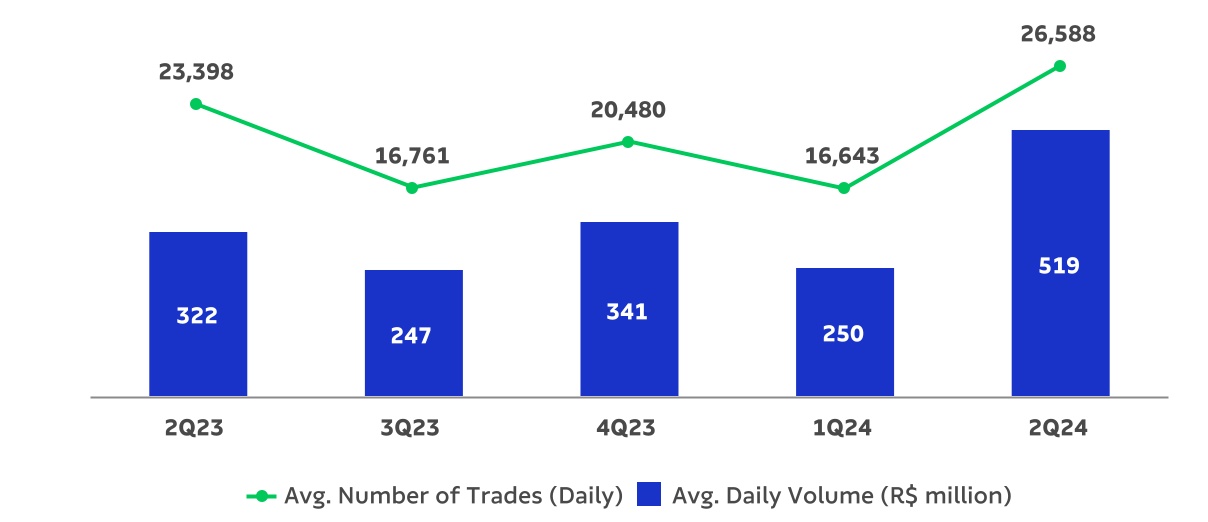
Source: Bloomberg.
Page 30 of 42
2Q24 EARNINGS RELEASE | | ||||||||||||||||
As part of the latest share buyback program announced (the “January/2024 Program”), until the end of June 2024, the Company has acquired 12,434,500 shares at an average cost of R$54.64, corresponding to market capitalization of R$679 million, in accordance with the monthly reports released by the Company in the context of Intr. CVM nº 44.
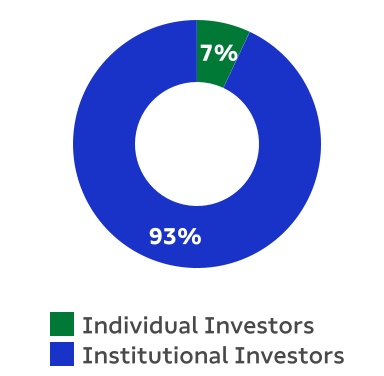
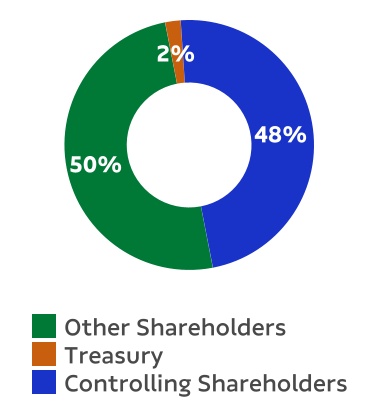
On June 30th, 2024, the Company's capital stock was represented by 1,304,117,615 common shares, of which 27,085,856 were held in Treasury. Suzano’s market capitalization on the same date (ex-treasury shares) stood at R$72.8 billion. Free float in 2Q24 corresponded to 50% of the total capital.
| Free Float distribution 06/30/2024 (B3+NYSE) | Ownership Structure (06/30/2024) | |||||||
FIXED INCOME
| Unit | Jun/24 | Mar/24 | Jun/23 | Δ Q-o-Q | Δ Y-o-Y | |||||||||||||||
| Fibria 2025 – Price | USD/k | 98.90 | 98.70 | 97.08 | 0% | 2% | ||||||||||||||
| Fibria 2025 – Yield | % | 5.90 | 5.74 | 6.03 | 3% | -2% | ||||||||||||||
| Suzano 2026 – Price | USD/k | 100.00 | 100.20 | 100.12 | 0% | 0% | ||||||||||||||
| Suzano 2026 – Yield | % | 5.75 | 5.66 | 5.71 | 2% | 1% | ||||||||||||||
| Fibria 2027 – Price | USD/k | 99.39 | 99.70 | 100.20 | 0% | -1% | ||||||||||||||
| Fibria 2027 – Yield | % | 5.76 | 5.62 | 5.44 | 2% | 6% | ||||||||||||||
| Suzano 2028 – Price | USD/k | 87.89 | 88.20 | 85.19 | 0% | 3% | ||||||||||||||
| Suzano 2028 – Yield | % | 5.79 | 5.52 | 5.85 | 5% | -1% | ||||||||||||||
| Suzano 2029 – Price | USD/k | 99.92 | 100.60 | 99.22 | -1% | 1% | ||||||||||||||
| Suzano 2029 – Yield | % | 6.02 | 5.86 | 6.17 | 3% | -2% | ||||||||||||||
| Suzano 2030 – Price | USD/k | 94.90 | 96.10 | 93.35 | -1% | 2% | ||||||||||||||
| Suzano 2030 – Yield | % | 6.10 | 5.80 | 6.26 | 5% | -3% | ||||||||||||||
| Suzano 2031 – Price | USD/k | 87.03 | 88.40 | 85.16 | -2% | 2% | ||||||||||||||
| Suzano 2031 – Yield | % | 6.19 | 5.85 | 6.25 | 6% | -1% | ||||||||||||||
| Suzano 2032 – Price | USD/k | 81.77 | 83.10 | 79.98 | -2% | 2% | ||||||||||||||
| Suzano 2032 – Yield | % | 6.19 | 5.85 | 6.18 | 6% | 0% | ||||||||||||||
| Suzano 2047 – Price | USD/k | 102.38 | 105.00 | 101.04 | -2% | 1% | ||||||||||||||
| Suzano 2047 – Yield | % | 6.79 | 6.58 | 6.91 | 3% | -2% | ||||||||||||||
| Treasury 10 years | % | 4.40 | 4.20 | 3.84 | 5% | 15% | ||||||||||||||
Note: Senior Notes issued with face value of 100 USD/k.
Page 31 of 42
2Q24 EARNINGS RELEASE | | ||||||||||||||||
RATINGS
| Agency | National Scale | Global Scale | Outlook | ||||||||
| Fitch Ratings | AAA | BBB- | Stable | ||||||||
| Standard & Poor’s | br.AAA | BBB- | Stable | ||||||||
| Moody’s | Aaa.br | Baa3 | Positive | ||||||||
Page 32 of 42
2Q24 EARNINGS RELEASE | | ||||||||||||||||
UPCOMING EVENTS
Earnings Conference Call (2Q24)
Date: August 9th, 2024 (Friday)
| Portuguese (simultaneous translation) | English | ||||
| 10:00 a.m. (Brasília) | 10:00 a.m. (Brasília) | ||||
| 9 a.m. (New York) | 9:00 a.m. (New York) | ||||
| 2:00 p.m. (London) | 2:00 p.m. (London) | ||||
The conference call will be held in English and feature a presentation, with simultaneous webcast. The access links will be available on the Company’s Investor Relations website (www.suzano.com.br/ri).
If you are unable to participate, the webcast link will be available for future consultation on the Investor Relations website of Suzano.
IR CONTACTS
Marcelo Bacci
Camila Nogueira
Roberto Costa
Mariana Spinola
Luísa Puccini
Arthur Trovo
Tel.: +55 (11) 3503-9330
ri@suzano.com.br
www.suzano.com.br/ri
Page 33 of 42
2Q24 EARNINGS RELEASE | | ||||||||||||||||
APPENDICES
APPENDIX 1 – Operating Data
| Revenue Breakdown (R$ '000) | 2Q24 | 1Q24 | Δ Q-o-Q | 2Q23 | Δ Y-o-Y | 6M24 | 6M23 | Δ Y-o-Y | ||||||||||||||||||
| Exports | 9,190,876 | 7,399,944 | 24% | 7,089,050 | 30% | 16,590,820 | 16,214,614 | 2% | ||||||||||||||||||
| Pulp | 8,671,229 | 6,873,678 | 26% | 6,518,076 | 33% | 15,544,907 | 15,052,854 | 3% | ||||||||||||||||||
| Paper | 519,647 | 526,266 | -1% | 570,974 | -9% | 1,045,913 | 1,161,760 | -10% | ||||||||||||||||||
| Domestic Market | 2,303,260 | 2,058,658 | 12% | 2,070,584 | 11% | 4,361,918 | 4,221,403 | 3% | ||||||||||||||||||
| Pulp | 563,780 | 486,168 | 16% | 583,192 | -3% | 1,049,948 | 1,249,493 | -16% | ||||||||||||||||||
| Paper | 1,739,480 | 1,572,490 | 11% | 1,487,392 | 17% | 3,311,970 | 2,971,910 | 11% | ||||||||||||||||||
| Total Net Revenue | 11,494,136 | 9,458,602 | 22% | 9,159,634 | 25% | 20,952,738 | 20,436,017 | 3% | ||||||||||||||||||
| Pulp | 9,235,009 | 7,359,846 | 25% | 7,101,268 | 30% | 16,594,855 | 16,302,347 | 2% | ||||||||||||||||||
| Paper | 2,259,127 | 2,098,756 | 8% | 2,058,366 | 10% | 4,357,883 | 4,133,670 | 5% | ||||||||||||||||||
| Sales volume (‘000) | 2Q24 | 1Q24 | Δ Q-o-Q | 2Q23 | Δ Y-o-Y | 6M24 | 6M23 | Δ Y-o-Y | ||||||||||||||||||
| Exports | 2,465,381 | 2,326,582 | 6% | 2,426,241 | 2% | 4,791,962 | 4,779,863 | 0% | ||||||||||||||||||
| Pulp | 2,371,442 | 2,223,108 | 7% | 2,341,852 | 1% | 4,594,550 | 4,625,584 | -1% | ||||||||||||||||||
| Paper | 93,939 | 103,473 | -9% | 84,389 | 11% | 197,412 | 154,279 | 28% | ||||||||||||||||||
| Paperboard | 9,349 | 7,829 | 19% | 5,185 | 80% | 17,178 | 10,430 | 65% | ||||||||||||||||||
| Printing & Writing | 83,189 | 95,450 | -13% | 79,178 | 5% | 178,638 | 143,778 | 24% | ||||||||||||||||||
| Other paper¹ | 1,401 | 195 | — | 26 | — | 1,596 | 71 | — | ||||||||||||||||||
| Domestic Market | 412,256 | 386,758 | 7% | 381,118 | 8% | 799,015 | 762,672 | 5% | ||||||||||||||||||
| Pulp | 173,317 | 177,594 | -2% | 171,538 | 1% | 350,911 | 342,834 | 2% | ||||||||||||||||||
| Paper | 238,939 | 209,164 | 14% | 209,580 | 14% | 448,104 | 419,838 | 7% | ||||||||||||||||||
| Paperboard | 33,995 | 34,314 | -1% | 33,006 | 3% | 68,310 | 70,675 | -3% | ||||||||||||||||||
| Printing & Writing | 142,491 | 115,657 | 23% | 143,193 | — | 258,148 | 282,693 | -9% | ||||||||||||||||||
| Other paper¹ | 62,453 | 59,193 | 6% | 33,381 | 87% | 121,646 | 66,470 | 83% | ||||||||||||||||||
| Total Sales Volume | 2,877,637 | 2,713,340 | 6% | 2,807,359 | 3% | 5,590,977 | 5,542,535 | 1% | ||||||||||||||||||
| Pulp | 2,544,759 | 2,400,702 | 6% | 2,513,390 | 1% | 4,945,461 | 4,968,418 | 0% | ||||||||||||||||||
| Paper | 332,878 | 312,638 | 6% | 293,969 | 13 | 645,516 | 574,117 | 12% | ||||||||||||||||||
| Paperboard | 43,344 | 42,143 | 3% | 38,191 | 13% | 85,488 | 81,105 | 5% | ||||||||||||||||||
| Printing & Writing | 225,680 | 211,107 | 7% | 222,371 | 1% | 436,786 | 426,471 | 2% | ||||||||||||||||||
| Other paper¹ | 63,854 | 59,388 | 8% | 33,407 | 91% | 123,242 | 66,541 | 85% | ||||||||||||||||||
1Paper of other manufacturers sold by Suzano and tissue paper.
Page 34 of 42
2Q24 EARNINGS RELEASE | | ||||||||||||||||
| Average net price (R$/ton) | 2Q24 | 1Q24 | Δ Q-o-Q | 2Q23 | Δ Y-o-Y | 6M24 | 6M23 | Δ Y-o-Y | ||||||||||||||||||
| Exports | 3,728 | 3,181 | 17% | 2,922 | 28% | 3,462 | 3,392 | 2% | ||||||||||||||||||
| Pulp | 3,657 | 3,092 | 18% | 2,783 | 31% | 3,383 | 3,254 | 4% | ||||||||||||||||||
| Paper | 5,532 | 5,086 | 9% | 6,766 | -18% | 5,298 | 7,530 | -30% | ||||||||||||||||||
| Domestic Market | 5,587 | 5,323 | 5% | 5,433 | 3% | 5,459 | 5,535 | -1% | ||||||||||||||||||
| Pulp | 3,253 | 2,738 | 19% | 3,400 | -4% | 2,992 | 3,645 | -18% | ||||||||||||||||||
| Paper | 7,280 | 7,518 | -3% | 7,097 | 3% | 7,391 | 7,079 | 4% | ||||||||||||||||||
| Total | 3,994 | 3,486 | 15% | 3,263 | 22% | 3,748 | 3,687 | 2% | ||||||||||||||||||
| Pulp | 3,629 | 3,066 | 18% | 2,825 | 28% | 3,356 | 3,281 | 2% | ||||||||||||||||||
| Paper | 6,787 | 6,713 | 1% | 7,002 | -3% | 6,751 | 7,200 | -6% | ||||||||||||||||||
| Average net price (US$/ton) | 2Q24 | 1Q24 | Δ Q-o-Q | 2Q23 | Δ Y-o-Y | 6M24 | 6M23 | Δ Y-o-Y | ||||||||||||||||||
| Exports | 715 | 642 | 11% | 590 | 21% | 681 | 668 | 2% | ||||||||||||||||||
| Pulp | 701 | 624 | 12% | 562 | 25% | 665 | 641 | 4% | ||||||||||||||||||
| Paper | 1,061 | 1,027 | 3% | 1,367 | -22% | 1,042 | 1,484 | -30% | ||||||||||||||||||
| Domestic Market | 1,072 | 1,075 | 0% | 1,098 | -2% | 1,074 | 1,091 | -2% | ||||||||||||||||||
| Pulp | 624 | 553 | 13% | 687 | -9% | 588 | 718 | -18% | ||||||||||||||||||
| Paper | 1,397 | 1,518 | -8% | 1,434 | -3% | 1,454 | 1,395 | 4% | ||||||||||||||||||
| Total | 766 | 704 | 9% | 659 | 16% | 737 | 727 | 1% | ||||||||||||||||||
| Pulp | 696 | 619 | 12% | 571 | 22% | 660 | 647 | 2% | ||||||||||||||||||
| Paper | 1,302 | 1,356 | -4% | 1,415 | -8% | 1,328 | 1,419 | -6% | ||||||||||||||||||
| FX Rate R$/US$ | 2Q24 | 1Q24 | Δ Q-o-Q | 2Q23 | Δ Y-o-Y | 6M24 | 6M23 | Δ Y-o-Y | ||||||||||||||||||
| Closing | 5.56 | 5.00 | 11% | 4.82 | 15% | 5.56 | 4.82 | 15% | ||||||||||||||||||
| Average | 5.21 | 4.95 | 5% | 4.95 | 5% | 5.08 | 5.07 | 0% | ||||||||||||||||||
Page 35 of 42
2Q24 EARNINGS RELEASE | | ||||||||||||||||
APPENDIX 2 – Consolidated Statement of Income and Goodwill Amortization
| Income Statement (R$ ‘000) | 2Q24 | 1Q24 | Δ Q-o-Q | 2Q23 | Δ Y-o-Y | 6M24 | 6M23 | Δ Y-o-Y | ||||||||||||||||||
| Net Revenue | 11,494,136 | 9,458,602 | 22% | 9,159,634 | 25% | 20,952,738 | 20,436,017 | 3% | ||||||||||||||||||
| Cost of Goods Sold | (6,093,238) | (5,699,870) | 7% | (6,228,181) | -2% | (11,793,109) | (12,196,855) | -3% | ||||||||||||||||||
| Gross Debt | 5,400,898 | 3,758,732 | 44% | 2,931,453 | 84% | 9,159,629 | 8,239,162 | 11% | ||||||||||||||||||
| Gross Margin | 47% | 40% | 7 p.p. | 32% | 15 p.p. | 44% | 40% | 3 p.p. | ||||||||||||||||||
| Operating Expense/Income | (787,252) | (1,206,506) | — | 137,224 | -674% | (1,993,757) | (864,197) | 131% | ||||||||||||||||||
| Selling Expenses | (700,054) | (653,415) | 7% | (626,809) | 12% | (1,353,468) | (1,231,162) | 10% | ||||||||||||||||||
| General and Administrative Expenses | (557,771) | (502,975) | 11% | (427,208) | 31% | (1,060,746) | (817,443) | 30% | ||||||||||||||||||
| Other Operating Income (Expenses) | 464,180 | (40,209) | — | 1,205,293 | -61% | 423,971 | 1,183,989 | -64 | ||||||||||||||||||
| Equity Equivalence | 6,393 | (9,907) | -165% | (14,052) | — | (3,514) | 419 | —% | ||||||||||||||||||
| EBIT | 4,613,646 | 2,552,226 | 81% | 3,068,677 | 50% | 7,165,872 | 7,374,965 | -3% | ||||||||||||||||||
| Depreciation, Amortization & Depletion | 2,128,756 | 1,982,024 | 7% | 1,845,804 | 15% | 4,110,780 | 3,593,516 | 14% | ||||||||||||||||||
| EBITDA | 6,742,402 | 4,534,250 | 49% | 4,914,481 | 37% | 11,276,652 | 10,968,481 | 3% | ||||||||||||||||||
| EBITDA Margin | 59% | 48% | 11 p.p. | 54% | 5 p.p. | 54% | 54% | — | ||||||||||||||||||
| Adjusted EBITDA¹ | 6,287,867 | 4,557,906 | 38% | 3,918,981 | 60% | 10,845,773 | 10,073,494 | 8% | ||||||||||||||||||
| Adjusted EBITDA Margin¹ | 55% | 48% | 7 p.p. | 43% | 12 p.p. | 52% | 49% | 2 p.p. | ||||||||||||||||||
| Net Financial Result | (11,073,675) | (3,040,048) | — | 4,535,679 | — | (14,113,723) | 7,005,786 | — | ||||||||||||||||||
| Financial Expenses | 456,888 | 424,217 | 8% | 404,137 | 13% | 881,105 | 789,898 | 12% | ||||||||||||||||||
| Financial Revenues | (1,152,893) | (1,130,400) | 2% | (1,149,041) | —% | (2,283,293) | (2,308,066) | -1% | ||||||||||||||||||
| Exchange Rate Variation | (3,890,341) | (634,537) | — | 2,903,766 | — | (4,524,878) | 4,899,019 | — | ||||||||||||||||||
| Net Proceeds Generated by Derivatives | (6,487,329) | (1,699,328) | — | 2,376,817 | — | (8,186,657) | 3,624,935 | — | ||||||||||||||||||
| Earnings Before Taxes | (6,460,029) | (487,822) | — | 7,604,356 | — | (6,947,851) | 14,380,751 | — | ||||||||||||||||||
| Income and Social Contribution Taxes | 2,694,512 | 707,854 | — | (2,526,733) | — | 3,402,366 | (4,060,335) | — | ||||||||||||||||||
| Net Income (Loss) | (3,765,517) | 220,032 | — | 5,077,623 | -174% | (3,545,485) | 10,320,416 | -134% | ||||||||||||||||||
| Net Margin | -33% | 2% | -35 p.p. | 55% | -88 p.p. | -17% | 51% | -67 p.p. | ||||||||||||||||||
1Excluding non-recurring items and PPA effects.
| Goodwill amortization - PPA (R$ ‘000) | 2Q24 | 1Q24 | Δ Q-o-Q | 2Q23 | Δ Y-o-Y | ||||||||||||
| COGS | (115,398) | (115,740) | 0% | (138,235) | -17% | ||||||||||||
| Selling Expenses | (207,475) | (207,475) | 0% | (207,626) | 0% | ||||||||||||
| General and administrative expenses | (7,962) | (7,967) | 0% | (2,457) | 224% | ||||||||||||
| Other operational revenues (expenses) | 4,142 | 3,473 | 19% | 34,235 | -88% | ||||||||||||
Page 36 of 42
2Q24 EARNINGS RELEASE | | ||||||||||||||||
APPENDIX 3 – Consolidated Balance Sheet
| Assets (R$ ’000) | 06/30/2024 | 03/31/2024 | 06/30/2023 | ||||||||
| Current Assets | |||||||||||
| Cash and cash equivalents | 7,246,498 | 4,203,126 | 11,860,415 | ||||||||
| Financial investments | 14,360,936 | 14,671,943 | 7,913,730 | ||||||||
| Trade accounts receivable | 7,224,926 | 6,634,735 | 6,488,192 | ||||||||
| Inventories | 7,126,680 | 6,521,769 | 6,422,496 | ||||||||
| Recoverable taxes | 986,254 | 886,659 | 747,847 | ||||||||
| Derivative financial instruments | 1,161,258 | 1,961,643 | 3,747,881 | ||||||||
| Advance to suppliers | 127,180 | 119,962 | 103,181 | ||||||||
| Dividend’s receivable | — | — | — | ||||||||
| Other assets | 889,421 | 871,969 | 778,557 | ||||||||
| Total Current Assets | 39,123,153 | 35,871,806 | 38,062,299 | ||||||||
| Non-Current Assets | |||||||||||
| Financial investments | 454,077 | 448,077 | 441,140 | ||||||||
| Recoverable taxes | 1,398,048 | 1,401,124 | 1,357,354 | ||||||||
| Deferred taxes | 4,418,401 | 1,368,618 | 147,638 | ||||||||
| Derivative financial instruments | 2,723,363 | 1,544,010 | 1,731,906 | ||||||||
| Advance to suppliers | 2,412,921 | 2,472,894 | 1,981,199 | ||||||||
| Judicial deposits | 420,103 | 401,758 | 342,017 | ||||||||
| Other assets | 172,666 | 207,984 | 289,433 | ||||||||
| Biological assets | 19,801,748 | 18,721,063 | 16,914,120 | ||||||||
| Investments | 656,738 | 620,259 | 640,269 | ||||||||
| Property, plant and equipment | 62,025,794 | 60,640,882 | 56,028,308 | ||||||||
| Right of use on lease agreements | 5,153,462 | 5,146,347 | 5,230,789 | ||||||||
| Intangible | 14,333,837 | 14,554,669 | 15,112,147 | ||||||||
| Total Non-Current Assets | 113,971,158 | 107,527,685 | 100,216,320 | ||||||||
| Total Assets | 153,094,311 | 143,399,491 | 138,278,619 | ||||||||
| Liabilities and Equity (R$ ’000) | 06/30/2024 | 03/31/2024 | 06/30/2023 | ||||||||
| Current Liabilities | |||||||||||
| Trade accounts payable | 5,058,959 | 4,942,766 | 6,347,954 | ||||||||
| Loans, financing and debentures | 7,250,222 | 5,043,997 | 5,532,543 | ||||||||
| Accounts payable for lease operations | 797,863 | 759,368 | 710,906 | ||||||||
| Derivative financial instruments | 469,544 | 82,556 | 483,512 | ||||||||
| Taxes payable | 495,137 | 480,149 | 425,156 | ||||||||
| Payroll and charges | 710,758 | 534,263 | 629,911 | ||||||||
| Liabilities for assets acquisitions and subsidiaries | 103,488 | 94,770 | 101,207 | ||||||||
| Dividends and interest on own capital payable | 3,010 | 7,078 | 2,678 | ||||||||
| Advance from customers | 152,378 | 154,588 | 74,538 | ||||||||
| Other liabilities | 712,716 | 314,662 | 541,190 | ||||||||
| Total Current Liabilities | 15,754,075 | 12,414,197 | 14,849,595 | ||||||||
| Non-Current Liabilities | |||||||||||
| Loans, financing and debentures | 81,374,152 | 73,905,644 | 68,999,788 | ||||||||
| Accounts payable for lease operations | 5,806,489 | 5,534,430 | 5,485,078 | ||||||||
| Derivative financial instruments | 5,262,785 | 2,507,363 | 1,735,204 | ||||||||
| Liabilities for assets acquisitions and subsidiaries | 107,738 | 99,159 | 179,657 | ||||||||
| Provision for judicial liabilities | 2,862,828 | 2,876,590 | 3,175,080 | ||||||||
| Actuarial liabilities | 845,262 | 839,185 | 701,933 | ||||||||
| Deferred taxes | 12,596 | 12,596 | 11,377 | ||||||||
| Share-based compensation plans | 291,166 | 320,806 | 183,589 | ||||||||
| Provision for loss on investments in subsidiaries | — | 938 | — | ||||||||
| Advance from customers | 74,715 | 74,715 | 136,161 | ||||||||
| Other liabilities | 88,310 | 89,269 | 121,144 | ||||||||
| Total Non-Current Liabilities | 96,726,041 | 86,260,695 | 80,729,011 | ||||||||
| Total Liabilities | 112,480,116 | 98,674,892 | 95,578,606 | ||||||||
| Shareholders’ Equity | |||||||||||
| Share capital | 19,235,546 | 9,235,546 | 9,235,546 | ||||||||
| Capital reserves | 34,244 | 25,321 | 22,584 | ||||||||
| Treasury shares | (1,304,843) | (935,473) | (1,381,600) | ||||||||
| Retained earnings reserves | 24,522,473 | 34,522,473 | 22,690,645 | ||||||||
| Other reserves | 1,526,009 | 1,522,641 | 1,650,150 | ||||||||
| Retained earnings | (3,518,499) | 233,267 | 10,370,124 | ||||||||
| Controlling shareholders’ | 40,494,930 | 44,603,775 | 42,587,449 | ||||||||
| Non-controlling interest | 119,265 | 120,824 | 112,564 | ||||||||
| Total Equity | 40,614,195 | 44,724,599 | 42,700,013 | ||||||||
| Total Liabilities and Equity | 153,094,311 | 143,399,491 | 138,278,619 | ||||||||
Page 37 of 42
2Q24 EARNINGS RELEASE | | ||||||||||||||||
APPENDIX 4 – Consolidated Statement of Cash Flow
| Cash Flow (R$ ’000) | 2Q24 | 2Q23 | 6M24 | 6M23 | ||||||||||
| OPERATING ACTIVITIES | ||||||||||||||
| Net income (loss) for the period | (3,765,517) | 5,077,623 | (3,545,485) | 10,320,416 | ||||||||||
| Depreciation, depletion and amortization | 2,043,891 | 1,770,680 | 3,943,188 | 3,451,862 | ||||||||||
| Depreciation of right of use | 84,865 | 75,122 | 167,592 | 141,654 | ||||||||||
| Interest expense on lease liabilities | 112,379 | 111,271 | 222,185 | 223,237 | ||||||||||
| Result from sale and disposal of property, plant and equipment and biological assets, net | 76,870 | 68,447 | 124,424 | 111,195 | ||||||||||
| Income (expense) from associates and joint ventures | (6,393) | 14,052 | 3,514 | (419) | ||||||||||
| Exchange rate and monetary variations, net | 6,487,329 | (2,376,817) | 8,186,657 | (3,624,935) | ||||||||||
| Interest expenses on financing, loans and debentures | 1,315,083 | 1,156,847 | 2,545,932 | 2,309,587 | ||||||||||
| Capitalized loan costs | (424,955) | (278,232) | (802,515) | (511,650) | ||||||||||
| Accrual of interest on marketable securities | (333,020) | (333,874) | (645,445) | (529,887) | ||||||||||
| Amortization of transaction costs | 22,308 | 16,215 | 39,616 | 32,421 | ||||||||||
| Derivative gains, net | 3,890,341 | (2,903,766) | 4,524,878 | (4,899,019) | ||||||||||
| Fair value adjustment of biological assets | (539,003) | (1,256,315) | (539,003) | (1,256,315) | ||||||||||
| Deferred income tax and social contribution | (3,050,362) | 2,429,507 | (3,872,570) | 3,849,332 | ||||||||||
| Interest on actuarial liabilities | 18,963 | 17,308 | 37,926 | 34,615 | ||||||||||
| Provision for judicial liabilities, net | 24,665 | 28,426 | 53,680 | 62,154 | ||||||||||
| Tax litigation reduction program | — | — | — | 14,031 | ||||||||||
| Provision for doubtful accounts, net | 1,314 | 7,397 | (3) | 10,287 | ||||||||||
| Provision for inventory losses, net | 6,684 | 8,287 | 14,714 | (854) | ||||||||||
| Provision for loss of ICMS credits, net | 2,316 | 125,287 | (21,447) | 202,961 | ||||||||||
| Tax credits | — | — | — | — | ||||||||||
| Other | 13,439 | 3,186 | 28,560 | 10,494 | ||||||||||
| Decrease (increase) in assets | (420,766) | 2,124,958 | (352,995) | 2,100,990 | ||||||||||
| Trade accounts receivable | 49,329 | 2,498,817 | 422,445 | 2,573,633 | ||||||||||
| Inventories | (369,452) | (557) | (667,502) | (372,295) | ||||||||||
| Recoverable taxes | (82,565) | (266,000) | (74,202) | (335,807) | ||||||||||
| Other assets | (18,078) | (107,302) | (33,736) | 235,459 | ||||||||||
| Increase (decrease) in liabilities | 638,762 | 152,516 | 339,200 | (245,397) | ||||||||||
| Trade accounts payable | 399,573 | 39,075 | 257,598 | (105,036) | ||||||||||
| Taxes payable | 133,197 | (6,084) | 224,019 | 82,064 | ||||||||||
| Payroll and charges | 176,494 | 162,877 | (56,148) | (63,898) | ||||||||||
| Other liabilities | (70,502) | (43,352) | (86,269) | (158,527) | ||||||||||
| Cash generated from operations | 6,199,193 | 6,038,125 | 10,452,603 | 11,806,760 | ||||||||||
| Payment of interest on financing, loans and debentures | (780,474) | (754,950) | (2,529,991) | (2,352,484) | ||||||||||
| Capitalized loan costs paid | 424,955 | 511,650 | 802,515 | 511,650 | ||||||||||
| Interest received on marketable securities | 342,580 | 222,839 | 570,829 | 391,601 | ||||||||||
| Payment of income taxes | (117,713) | (46,829) | (173,287) | (89,482) | ||||||||||
| Cash provided by operating activities | 6,068,541 | 5,970,835 | 9,122,669 | 10,268,045 | ||||||||||
| INVESTING ACTIVITIES | ||||||||||||||
| Additions to property, plant and equipment | (2,469,002) | (3,309,695) | (5,025,174) | (5,759,447) | ||||||||||
| Additions to intangible | (29,456) | (180) | (84,566) | (197) | ||||||||||
| Additions to biological assets | (1,827,707) | (1,505,741) | (3,459,209) | (2,899,032) | ||||||||||
| Proceeds from sales of property, plant and equipment and biological assets | 61,460 | 72,471 | 88,179 | 97,412 | ||||||||||
| Capital increase in affiliates | (8,411) | (14,812) | (27,319) | (35,075) | ||||||||||
| Marketable securities, net | 671,293 | 4,050,793 | (894,973) | (683,505) | ||||||||||
| Advances for acquisition (receipt) of wood from operations with development and partnerships | 51,780 | (149,006) | (183,995) | (410,024) | ||||||||||
| Dividends received | — | 4,869 | — | 4,869 | ||||||||||
| Asset acquisition | — | (1,615,140) | — | (1,615,140) | ||||||||||
| Acquisition of subsidiaries | — | (1,072,657) | — | (1,072,657) | ||||||||||
| Net cash from acquisition of subsidiaries | — | 5,002 | — | 5,002 | ||||||||||
| Cash used in investing activities | (3,550,043) | (3,534,096) | (9,587,057) | (12,367,794) | ||||||||||
| FINANCING ACTIVITIES | ||||||||||||||
| Proceeds from loans, financing and debentures | 6,689,406 | 5,226,125 | 10,934,280 | 5,276,816 | ||||||||||
| Proceeds of derivative transactions | (1,126,899) | 1,299,176 | (682,787) | 1,664,900 | ||||||||||
| Payment of loans, financing and debentures | (4,882,782) | (706,480) | (8,921,182) | (765,533) | ||||||||||
| Payment of leases | (312,568) | (284,450) | (633,211) | (577,132) | ||||||||||
| Payment of interest on own capital | (8,968) | (2,420) | (1,318,418) | (2,415) | ||||||||||
| Liabilities for assets acquisitions and subsidiaries | — | — | — | (16,929) | ||||||||||
| Shares repurchased | — | (633,809) | (309,952) | (721,052) | ||||||||||
| Cash provided (used) by financing activities | 358,189 | 4,898,142 | (931,270) | 4,858,655 | ||||||||||
| EXCHANGE VARIATION ON CASH AND CASH EQUIVALENTS | 166,685 | (235,730) | 296,285 | (404,442) | ||||||||||
| Increase (decrease) in cash and cash equivalents, net | 3,043,372 | 7,099,151 | (1,099,373) | 2,354,464 | ||||||||||
| At the beginning of the period | 4,203,126 | 4,761,264 | 8,345,871 | 9,505,951 | ||||||||||
| At the end of the period | 7,246,498 | 11,860,415 | 7,246,498 | 11,860,415 | ||||||||||
| Increase (decrease) in cash and cash equivalents, net | 3,043,372 | 7,099,151 | (1,099,373) | 2,354,464 | ||||||||||
Page 38 of 42
2Q24 EARNINGS RELEASE | | ||||||||||||||||
APPENDIX 5 – EBITDA
| (R$ '000, except where otherwise indicated) | 2Q24 | 2Q23 | 6M24 | 6M23 | ||||||||||
| Net income | (3,765,517) | 5,077,623 | (3,545,485) | 10,320,416 | ||||||||||
| Net Financial Result | 11,073,675 | (4,535,679) | 14,113,723 | (7,005,786) | ||||||||||
| Income and Social Contribution Taxes | (2,694,512) | 2,526,733 | (3,402,366) | 4,060,335 | ||||||||||
| EBIT | 4,613,646 | 3,068,677 | 7,165,872 | 7,374,965 | ||||||||||
| Depreciation, Amortization and Depletion | 2,128,756 | 1,845,804 | 4,110,780 | 3,593,516 | ||||||||||
| EBITDA¹ | 6,742,402 | 4,914,481 | 11,276,652 | 10,968,481 | ||||||||||
| EBITDA Margin | 59% | 54% | 54% | 54% | ||||||||||
| Fair Value Update - Biological Asset | (539,003) | (1,256,315) | (539,003) | (1,256,315) | ||||||||||
| Donations for catastrophes and pandemics | 216 | — | 216 | — | ||||||||||
| Equity method | (6,393) | 14,052 | 3,514 | (419) | ||||||||||
| Extinction of packaging business line | 23 | — | 1,213 | — | ||||||||||
| Penalties for termination with contracts | — | 60,851 | — | 60,851 | ||||||||||
| Tissue Operation Kimberly Clark Brazil | — | 5,752 | — | 12,105 | ||||||||||
| Effective loss of the development contract advance program | 725 | — | 735 | — | ||||||||||
| Accruals for losses on ICMS credits | 2,315 | 125,287 | (21,448) | 202,960 | ||||||||||
| Income from disposal and write-off of property, plant and equipment and biological assets | 87,583 | 54,873 | 123,895 | 85,831 | ||||||||||
| Adjusted EBITDA | 6,287,868 | 3,918,981 | 10,845,774 | 10,073,494 | ||||||||||
| Adjusted EBITDA Margin | 55% | 43% | 52% | 49% | ||||||||||
1The Company's EBITDA is calculated in accordance with CVM Instruction 527 of October 4, 2012.
Page 39 of 42
2Q24 EARNINGS RELEASE | | ||||||||||||||||
APPENDIX 6 – Segmented Income Statement
| Segmented Financial Statement (R$ '000) | 2Q24 | 2Q23 | ||||||||||||||||||||||||
| Pulp | Paper | Non Segmented | Total Consolidated | Pulp | Paper | Non Segmented | Total Consolidated | |||||||||||||||||||
| Net Revenue | 9,235,009 | 2,259,127 | — | 11,494,136 | 7,101,268 | 2,058,366 | — | 9,159,634 | ||||||||||||||||||
| Cost of Goods Sold | (4,725,847) | (1,367,391) | — | (6,093,238) | (5,018,348) | (1,209,833) | — | (6,228,181) | ||||||||||||||||||
| Gross Profit | 4,509,162 | 891,736 | — | 5,400,898 | 2,082,920 | 848,533 | — | 2,931,453 | ||||||||||||||||||
| Gross Margin | 49% | 39% | — | 47% | 29% | 41% | — | 32% | ||||||||||||||||||
| Operating Expense/Income | (503,356) | (283,896) | — | (787,252) | 167,482 | (30,258) | — | 137,224 | ||||||||||||||||||
| Selling Expenses | (464,234) | (235,820) | — | (700,054) | (468,703) | (158,106) | — | (626,809) | ||||||||||||||||||
| General and Administrative Expenses | (401,546) | (156,225) | — | (557,771) | (302,173) | (125,035) | — | (427,208) | ||||||||||||||||||
| Other Operating Income (Expenses) | 367,610 | 96,570 | — | 464,180 | 944,417 | 260,876 | — | 1,205,293 | ||||||||||||||||||
| Equity Equivalence | (5,186) | 11,579 | — | 6,393 | (6,059) | (7,993) | — | (14,052) | ||||||||||||||||||
| EBIT | 4,005,806 | 607,840 | — | 4,613,646 | 2,250,402 | 818,275 | — | 3,068,677 | ||||||||||||||||||
| Depreciation, Amortization & Depletion | 1,873,091 | 255,665 | — | 2,128,756 | 1,687,374 | 158,430 | — | 1,845,804 | ||||||||||||||||||
| EBITDA | 5,878,897 | 863,505 | — | 6,742,402 | 3,937,776 | 976,705 | — | 4,914,481 | ||||||||||||||||||
| EBITDA Margin | 64% | 38% | — | 59% | 55% | 47% | — | 54% | ||||||||||||||||||
| Adjusted EBITDA¹ | 5,537,372 | 750,495 | — | 6,287,867 | 3,189,780 | 729,201 | — | 3,918,981 | ||||||||||||||||||
| Adjusted EBITDA Margin¹ | 60% | 33% | — | 55% | 45% | 35% | — | 43% | ||||||||||||||||||
| Net Financial Result | — | — | (11,073,675) | (11,073,675) | — | — | 4,535,679 | 4,535,679 | ||||||||||||||||||
| Earnings Before Taxes | 4,005,806 | 607,840 | (11,073,675) | (6,460,029) | 2,250,402 | 818,275 | 4,535,679 | 7,604,356 | ||||||||||||||||||
| Income and Social Contribution Taxes | — | — | 2,694,512 | 2,694,512 | — | — | (2,526,733) | (2,526,733) | ||||||||||||||||||
| Net Income (Loss) | 4,005,806 | 607,840 | (8,379,163) | (3,765,517) | 2,250,402 | 818,275 | 2,008,946 | 5,077,623 | ||||||||||||||||||
| Net Margin | 43% | 27% | — | -33% | 32% | 40% | — | 55% | ||||||||||||||||||
1Excluding non-recurring items and PPA effects.
Page 40 of 42
2Q24 EARNINGS RELEASE | | ||||||||||||||||
| Segmented Financial Statement (R$ '000) | 6M24 | 6M23 | ||||||||||||||||||||||||
| Pulp | Paper | Non Segmented | Total Consolidated | Pulp | Paper | Non Segmented | Total Consolidated | |||||||||||||||||||
| Net Revenue | 16,594,855 | 4,357,883 | — | 20,952,738 | 16,302,347 | 4,133,670 | — | 20,436,017 | ||||||||||||||||||
| Cost of Goods Sold | (9,100,750) | (2,692,359) | — | (11,793,109) | (9,826,400) | (2,370,455) | — | (12,196,855) | ||||||||||||||||||
| Gross Profit | 7,494,105 | 1,665,524 | — | 9,159,629 | 6,475,947 | 1,763,215 | — | 8,239,162 | ||||||||||||||||||
| Gross Margin | 45% | 38% | — | 44% | 40% | 43% | — | 40% | ||||||||||||||||||
| Operating Expense/Income | (1,375,950) | (617,807) | — | (1,993,757) | (599,497) | (264,700) | — | (864,197) | ||||||||||||||||||
| Selling Expenses | (910,643) | (442,825) | — | (1,353,468) | (937,510) | (293,652) | — | (1,231,162) | ||||||||||||||||||
| General and Administrative Expenses | (764,519) | (296,227) | — | (1,060,746) | (577,828) | (239,615) | — | (817,443) | ||||||||||||||||||
| Other Operating Income (Expenses) | 321,766 | 102,205 | — | 423,971 | 926,708 | 257,281 | — | 1,183,989 | ||||||||||||||||||
| Equity Equivalence | (22,554) | 19,040 | — | (3,514) | (10,867) | 11,286 | — | 419 | ||||||||||||||||||
| EBIT | 6,118,155 | 1,047,717 | — | 7,165,872 | 5,876,450 | 1,498,515 | — | 7,374,965 | ||||||||||||||||||
| Depreciation, Amortization & Depletion | 3,624,781 | 485,999 | — | 4,110,780 | 3,279,247 | 314,269 | — | 3,593,516 | ||||||||||||||||||
| EBITDA | 9,742,936 | 1,533,716 | — | 11,276,652 | 9,155,697 | 1,812,784 | — | 10,968,481 | ||||||||||||||||||
| EBITDA Margin | 59% | 35% | — | 54% | 56% | 44% | — | 54% | ||||||||||||||||||
| Adjusted EBITDA¹ | 9,439,622 | 1,406,151 | — | 10,845,773 | 8,525,980 | 1,547,514 | — | 10,073,494 | ||||||||||||||||||
| Adjusted EBITDA Margin¹ | 57% | 32% | — | 52% | 52% | 37% | — | 49% | ||||||||||||||||||
| Net Financial Result | — | — | (14,113,723) | (14,113,723) | — | — | 7,005,786 | 7,005,786 | ||||||||||||||||||
| Earnings Before Taxes | 6,118,155 | 1,047,717 | (14,113,723) | (6,947,851) | 5,876,450 | 1,498,515 | 7,005,786 | 14,380,751 | ||||||||||||||||||
| Income and Social Contribution Taxes | — | — | 3,402,366 | 3,402,366 | — | — | (4,060,335) | (4,060,335) | ||||||||||||||||||
| Net Income (Loss) | 6,118,155 | 1,047,717 | (10,711,357) | (3,545,485) | 5,876,450 | 1,498,515 | 2,945,451 | 10,320,416 | ||||||||||||||||||
| Net Margin | 37% | 24% | — | -17% | 36% | 36% | — | 51% | ||||||||||||||||||
Page 41 of 42
2Q24 EARNINGS RELEASE | | ||||||||||||||||
Forward-Looking Statements
This release may contain forward-looking statements. Such statements are subject to known and unknown risks and uncertainties due to which such expectations may not happen at all or may substantially differ from what was expected. These risks include, among others, changes in future demand for the Company’s products, changes in factors affecting domestic and international product prices, changes in the cost structure, changes in the seasonal patterns of markets, changes in prices charged by competitors, foreign exchange variations, changes in the political or economic situation of Brazil, as well as emerging and international markets. The forward-looking statements were not reviewed by our independent auditors.
Page 42 of 42