 | EARNINGS RELEASE 4Q24 | ||||||||||||||||
Ribas performance drives record sales,
greater competitiveness and deleveraging
São Paulo, February 12th, 2025. Suzano S.A. (B3: SUZB3 | NYSE: SUZ), one of the world’s largest integrated pulp and paper producers, announces today its consolidated results for the fourth quarter of 2024 (4Q24).
HIGHLIGHTS
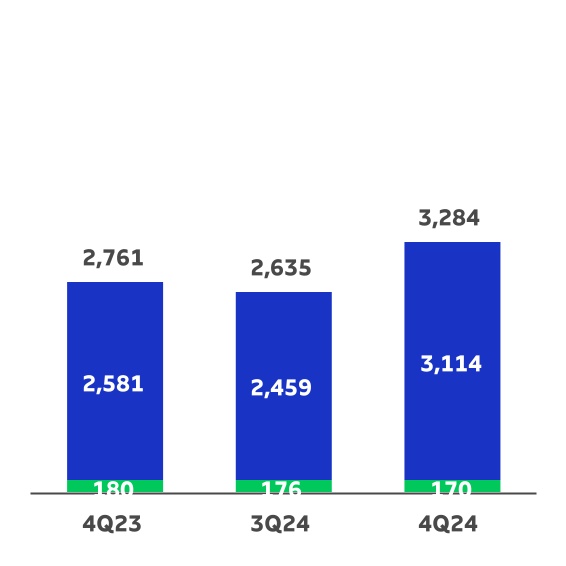
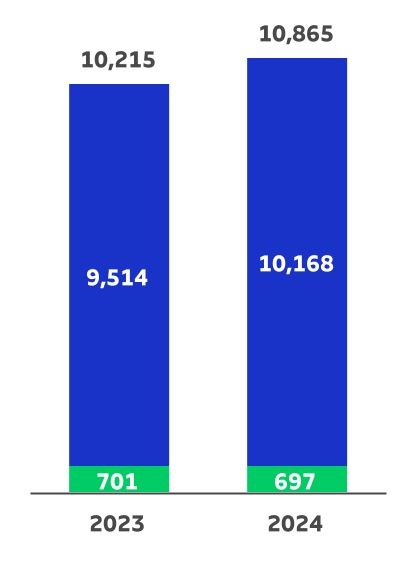
•Pulp sales of 3,284 thousand tons (19% vs. 4Q23).
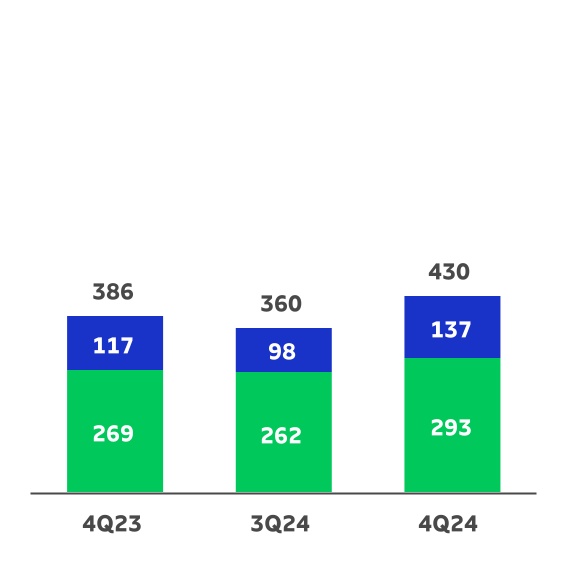
•Paper sales1 of 430 thousand tons (11% vs. 4Q23).
•Adjusted EBITDA2 and Operating cash generation3: R$6.5 billion and R$4.8 billion, respectively.
•Adjusted EBITDA2/ton from pulp of R$1,745/ton (28% vs. 4Q23).
•Adjusted EBITDA2/ton from paper of R$1,746/ton (-10% vs. 4Q23).
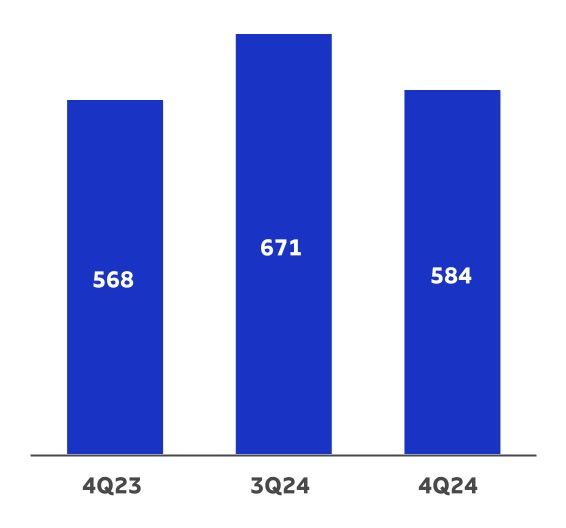
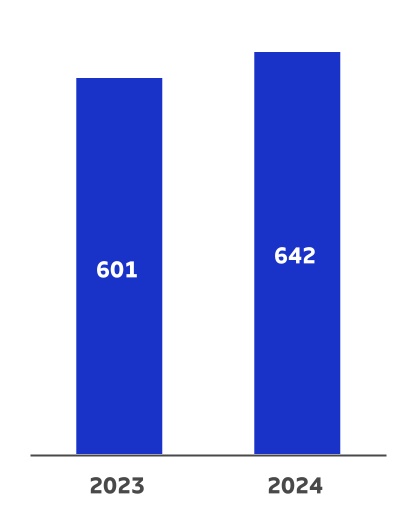
•Average net pulp price in export market: US$583/ton (2% vs. 4Q23).
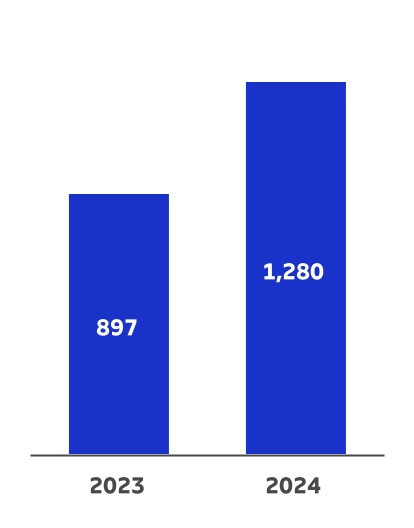
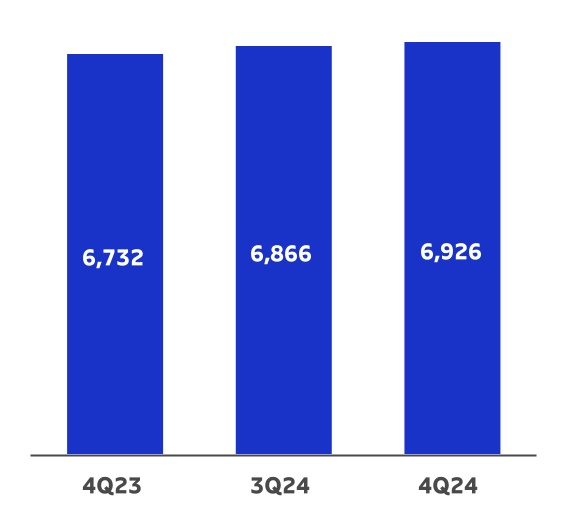
•Average net paper price1 of R$6,926/ton (3% vs. 4Q23).
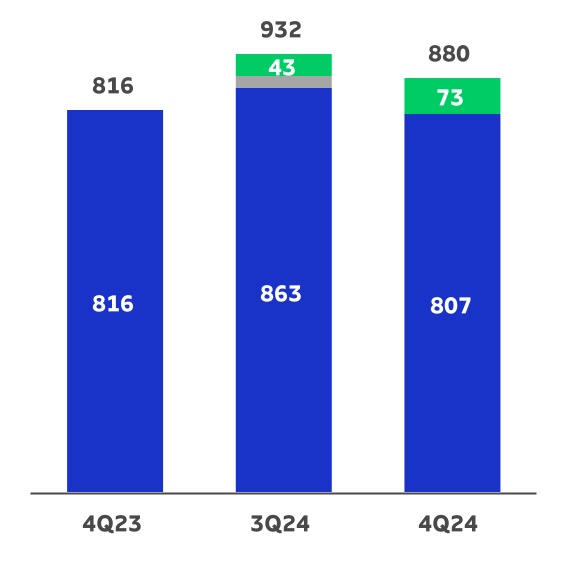
•Pulp cash cost ex-downtime of R$807/ton (-1% vs. 4Q23).
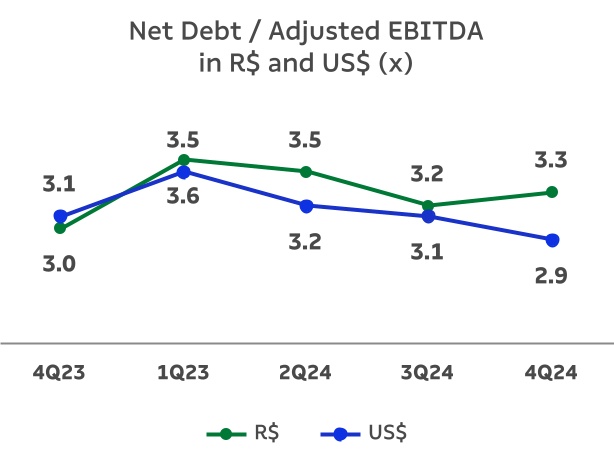
•Leverage of 2.9 times in USD and 3.3 times in BRL.
•Completion of the learning curve of the Ribas do Rio Pardo unit.
| Financial Data (R$ million) | 4Q24 | 3Q24 | Δ Q-o-Q | 4Q23 | Δ Y-o-Y | 2024 | 2023 | Δ Y-o-Y | ||||||||||||||||||
| Net Revenue | 14,177 | 12,274 | 16% | 10,372 | 37% | 47,403 | 39,756 | 19% | ||||||||||||||||||
Adjusted EBITDA2 | 6,481 | 6,523 | -1% | 4,505 | 44% | 23,849 | 18,273 | 31% | ||||||||||||||||||
Adjusted EBITDA Margin2 | 46% | 53% | -7 p.p. | 43% | 2 p.p. | 50% | 46% | 4 p.p. | ||||||||||||||||||
| Net Financial Result | (15,556) | 868 | — | 2,269 | — | (28,802) | 5,781 | — | ||||||||||||||||||
| Net Income | (6,737) | 3,237 | — | 4,515 | — | (7,045) | 14,106 | — | ||||||||||||||||||
Operating Cash Generation3 | 4,843 | 4,394 | 10% | 2,779 | 74% | 16,239 | 11,566 | 40% | ||||||||||||||||||
Net Debt/ Adjusted EBITDA2 (x) (R$) | 3.3 x | 3.2 x | 0.1 x | 3.0 x | 0.3 x | 3.3 x | 3.0 x | 0.3 x | ||||||||||||||||||
Net Debt/ Adjusted EBITDA2 (x) (US$) | 2.9 x | 3.1 x | -0.2 x | 3.1 x | -0.2 x | 2.9 x | 3.1 x | -0.2 x | ||||||||||||||||||
| Operational Data ('000 t) | 4Q24 | 3Q24 | Δ Q-o-Q | 4Q23 | Δ Y-o-Y | 2024 | 2023 | Δ Y-o-Y | ||||||||||||||||||
| Sales | 3,714 | 2,995 | 24% | 3,148 | 18% | 12,300 | 11,507 | 7% | ||||||||||||||||||
| Pulp | 3,284 | 2,635 | 25% | 2,761 | 19% | 10,865 | 10,215 | 6% | ||||||||||||||||||
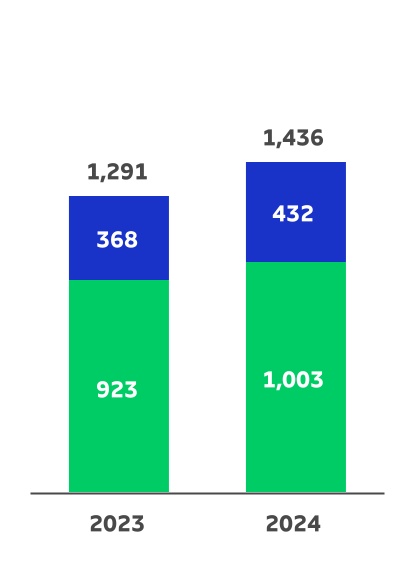
Paper1 | 430 | 360 | 20% | 386 | 11% | 1,436 | 1,291 | 11% | ||||||||||||||||||
1Considers the results of the Consumer Goods Unit (tissue) and the results of the months of Oct/24 and Nov/24 of the operation of the Suzano Packaging US Unit (Pine Bluff and Waynesville). | 2Excluding non-recurring items. | 3Considers Adjusted EBITDA less sustaining capex (cash basis).

The consolidated quarterly financial information was prepared in accordance with the standards set by the Securities and Exchange Commission of Brazil (CVM) and the Accounting Pronouncements Committee (CPC) and complies with the International Financial Reporting Standards (IFRS Accounting Standards) issued by the International Accounting Standards Board (IASB). The operating and financial information is presented on a consolidated basis and in Brazilian real (R$). Note that figures may present discrepancies due to rounding.
 | |||||||||||||||||
4Q24 EARNINGS RELEASE |  | ||||||||||||||||
CONTENTS
Page 2 of 45
4Q24 EARNINGS RELEASE | | ||||||||||||||||
EXECUTIVE SUMMARY
The year 2024 was marked by significant advancements in the Company's strategy, including the acquisition of new businesses and the start-up of the new mill in Ribas do Rio Pardo and the conclusion of its learning curve as early as December, anticipating the initial nine-month forecast.
Regarding the performance of the pulp business unit in the last quarter of the year, base prices in China fell by 15% until the end of November (vs. the 3Q24 average), but it has been stable after this period. The quarter was also marked once again by the significant appreciation of the average USD against the average BRL and the increase in sales volume, both factors offsetting the decline in the average net pulp price. The cash production cost (excluding the effect of scheduled maintenance downtime) was 7% lower than in 3Q24, also benefited from the gradual stabilization of production at the Ribas do Rio Pardo unit. Therefore, adjusted EBITDA from pulp remained stable compared to 3Q24 but increased 53% compared to 4Q23. In the paper business unit, adjusted EBITDA declined in 4Q24 vs. 3Q24 (-9%), but remained stable in relation to 4Q23, in which the Company concluded the acquisitions of the Pine Bluff and Waynesville units (Suzano Packaging US - as previously disclosed to the market). Finally, consolidated adjusted EBITDA totaled R$6.5 billion in 4Q24, ending the year at R$23.8 billion, representing an increase of 31% when compared to 2023. Operating cash flow reached R$4.8 billion in the quarter and R$16.2 billion in the year (+40% vs. 2023).
As for financial management, net debt in USD was US$12.8 billion, stable in relation to the previous quarter. On the other hand, leverage in USD experienced another decline, to 2.9 times, mainly explained by the increase in Adjusted EBITDA in the last 12 months, remaining fully within the limit of the Company's financial debt policy.
Regarding the financial execution of the project, the Company has completed about 96% of the total capex disbursement, with R$0.9 billion remaining to be paid in 2025.
Page 3 of 45
4Q24 EARNINGS RELEASE | | ||||||||||||||||
PULP BUSINESS PERFORMANCE
PULP SALES VOLUME AND REVENUE
The fourth quarter of 2024 was marked by a slowdown in price decline for hardwood pulp and a greater availability of pulp in the market.
In China, the paperboard and printing and writing segments experienced a large variation throughout the fourth quarter. Starting with a drop in paper prices, they rose again due to the temporary exit of an important integrated producer, reaching growth rates of 2% and 3%, respectively, in the comparison between December and November. This scenario impacted the total production volume of these types of paper, with a variation of -9% and -7% compared to 3Q24. Furthermore, the tissue segment proved to be healthy, with an increase in production of 2% accompanied by destocking of final product of 3%, compared to the previous quarter.
In the European market, according to Utipulp, hardwood pulp consumption increased 4% from the previous quarter, while softwood pulp consumption grew by only 1% compared to 3Q24, also encouraged by a fiber replacement movement, which gained more traction with the widening spread between softwood pulp and hardwood pulp prices. In North America, the sanitary paper market remained healthy regarding pulp demand, especially after an improvement in consumption and economic projections in the region.
As to the hardwood pulp supply, the production ramp-up at Ribas do Rio Pardo in Brazil and Liansheng in China continued, with reduction of the total volume affected by unplanned downtime in relation to the previous quarter, leading to greater availability of pulp in the market. Regarding softwood pulp, in Finland, three large mills experienced unplanned downtime due to availability of affordable wood and operational factors, which, combined with the spread between hardwood pulp and softwood pulp, strengthened the aforementioned fiber substitution movement.
The average PIX/FOEX indices for hardwood pulp in China fell by 14% compared to 3Q24, although the rate of decline has slowed. In Europe, the decrease was 20% compared to 3Q24. The difference between softwood pulp and hardwood pulp prices in the quarter was USD216/t in China and USD425/t in Europe, driving the shift from softwood pulp to hardwood pulp.
Suzano's pulp sales increased by 25% and 19% in 4Q24 vs. 3Q24 and 4Q23, respectively, due to the rise of volumes to Asia and North America, totaling 3,284 thousand tons.
Page 4 of 45
4Q24 EARNINGS RELEASE | | ||||||||||||||||
Pulp Sales Volume ('000 tons)
| +19% | +25% | |||||||||||||||||||||||||||||||
| q | ||||||||||||||||||||||||||||||||
| +6% | ||||||||||||||||||||||||||
| q | ||||||||||||||||||||||||||
| Export Market | Brazilian Market | |||||||||||||
Average net price in USD of pulp sold by Suzano was US$584/t, decreasing 13% from 3Q24 and increasing 3% from 4Q23. In the export market, average net price charged by the Company was also US$583/t, down 13% from 3Q24 and up 2% from 4Q23. Average net price in BRL was R$3,409/ton in 4Q24, 8% lower from 3Q24, due to the lower average net price in USD (-13%). Compared to 4Q23, the 21% increase was mainly due to the higher average net price in USD (+3%) and the stronger average USD against the average BRL (+18%).
Average Net Price (USD/t)
| +3% | -13% | |||||||||||||||||||||||||||||||
| q | ||||||||||||||||||||||||||||||||
| +7% | ||||||||||||||||||||||||||
| q | ||||||||||||||||||||||||||
Page 5 of 45
4Q24 EARNINGS RELEASE | | ||||||||||||||||
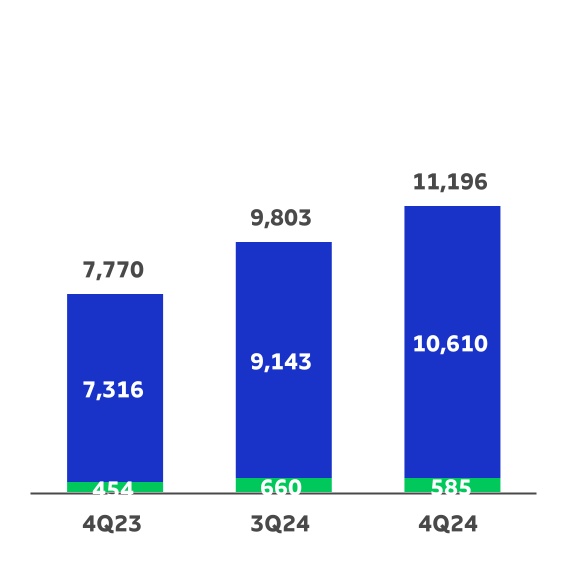
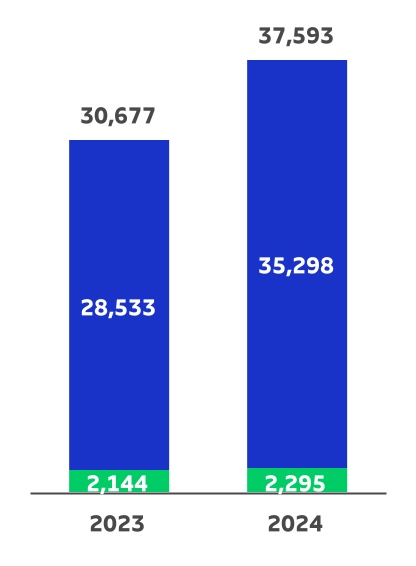
Net revenue from pulp increased 14% from 3Q24, explained mainly by the higher sales volume (+25%) and the +5% appreciation in the average USD against the BRL, with these factors partially offset by the lower average net price in USD (-13%). Compared to 4Q23, net revenue increased 44% mainly due to the appreciation of average USD against average BRL (+18%) and higher sales volume (+19%).
Pulp Net Revenue (R$ million)
| +44% | +14% | |||||||||||||||||||||||||||||||
| q | ||||||||||||||||||||||||||||||||
| +23% | ||||||||||||||||||||||||||
| q | ||||||||||||||||||||||||||
| Export Market | Brazilian Market | |||||||||||||
Page 6 of 45
4Q24 EARNINGS RELEASE | | ||||||||||||||||
PULP CASH COST
As disclosed in a Material Fact notice on July 21st, 2024, the Company began operations of the new pulp production mill in Ribas do Rio Pardo on that date. The non-recurring effect of the costs related to the start-up of the mill (occurred in 3Q24) is broken down in the chart below.
Consolidated Pulp Cash Cost
ex-maintenance downtime (R$/t)
ex-maintenance downtime (R$/t)
| -1% | -7% | |||||||||||||||||||||||||||||||
| q | ||||||||||||||||||||||||||||||||
| -6% | ||||||||||||||||||||||||||
| q | ||||||||||||||||||||||||||
Pulp Cash Cost
(R$/t)
(R$/t)
| +8% | -6% | |||||||||||||||||||||||||||||||
| q | ||||||||||||||||||||||||||||||||
| -6% | ||||||||||||||||||||||||||
| q | ||||||||||||||||||||||||||
| Cash Cost ex-downtimes | Start-up Ribas | Downtimes Effect | |||||||||||||||||||||
Page 7 of 45
4Q24 EARNINGS RELEASE | | ||||||||||||||||
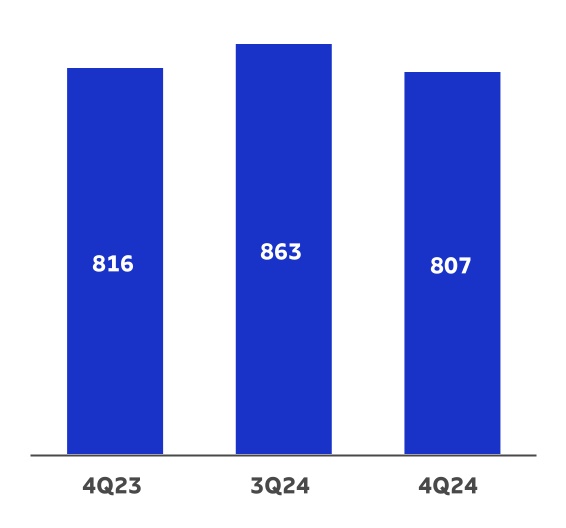
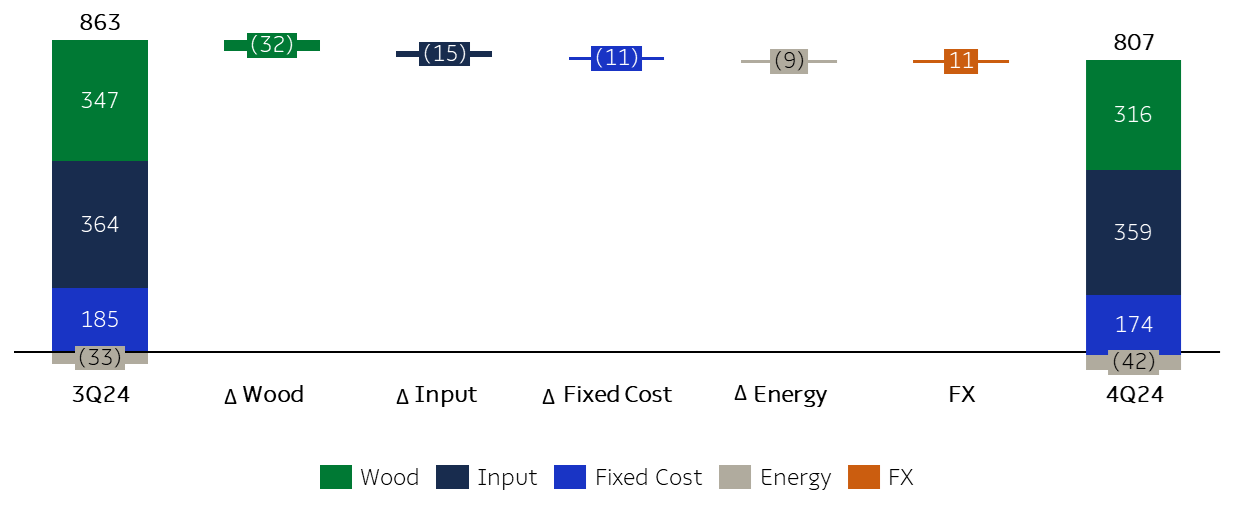
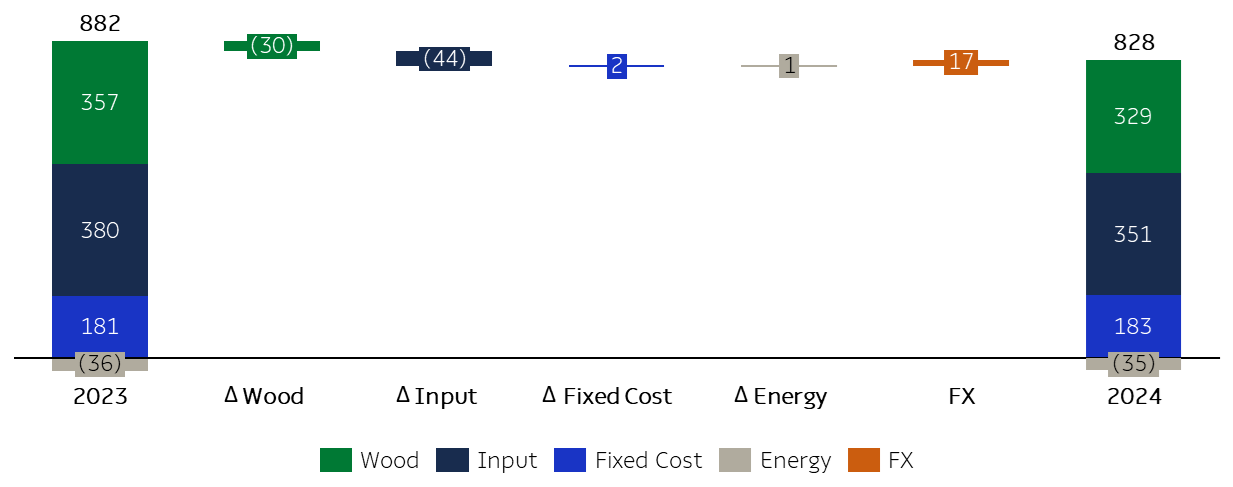
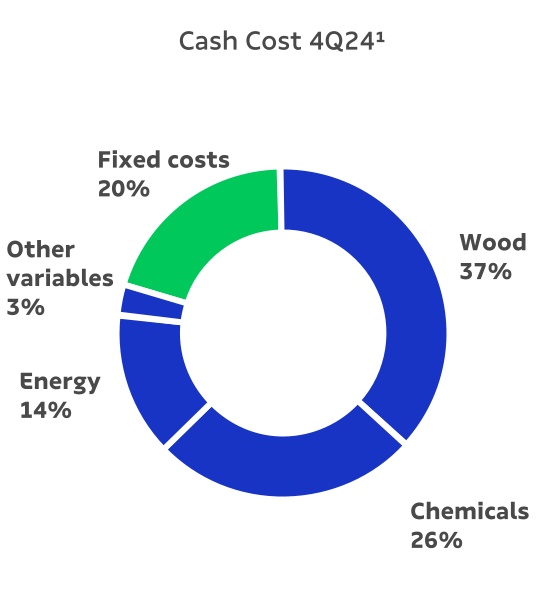
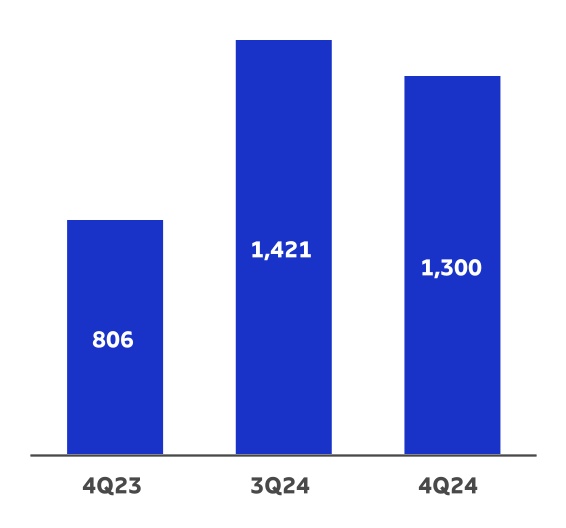
Cash cost excluding downtime in 4Q24 was R$807/t, showing a decrease of -7% compared to 3Q24, due to: i) lower wood cost, driven by the reduction in the average radius; ii) lower consumption of inputs, especially energy (notably natural gas and fuel oil), associated with greater operational stability in some mills, as well as the lower price (excluding exchange rate effect) of energy products, which offset the price increases observed in some chemicals (mainly caustic soda); iii) greater dilution of fixed costs due to the higher pulp production volume driven by Ribas do Rio Pardo unit; and iv) higher utilities revenue, also driven by the Ribas do Rio Pardo unit with the highest energy generation for export. The positive cash cost factors were partially offset by the 5% appreciation of the average USD against the average BRL.
Consolidated Pulp Cash Cost ex-maintenance (R$/t)1
1Excludes the impact of maintenance and administrative downtimes.
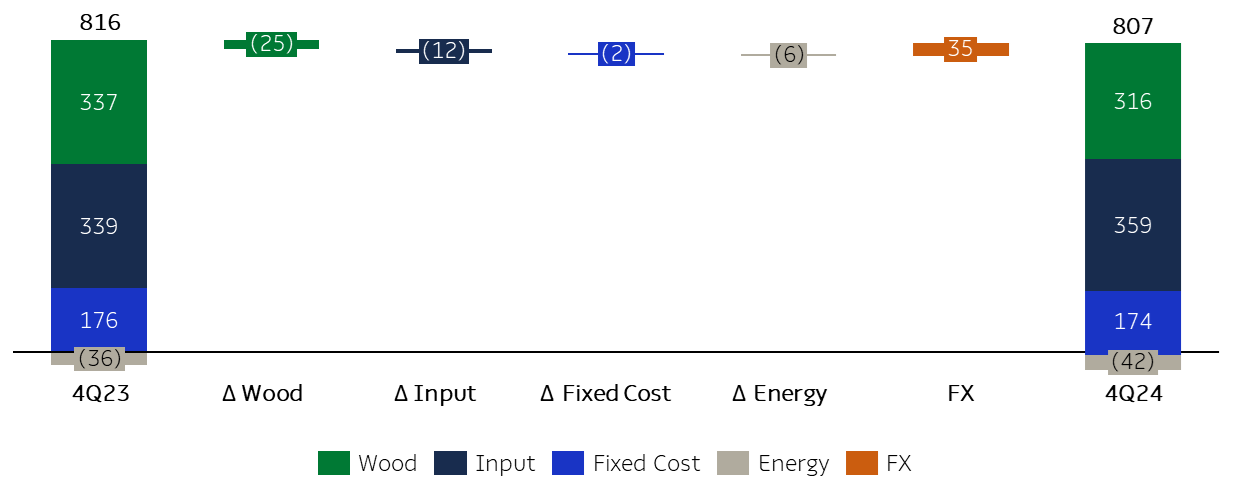
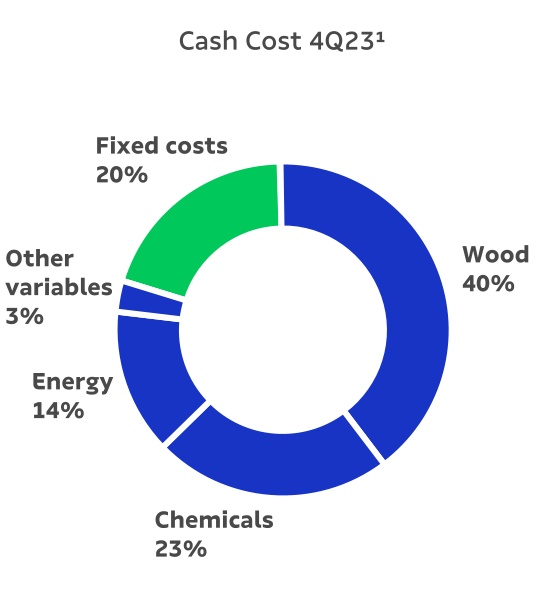
Cash cost excluding downtime in 4Q24 showed a 1% decrease compared to 4Q23, due to: i) the lower wood cost, which is mainly explained by the reduction in average radius, higher harvesting productivity and lower share of wood delivered at the mill, partially offset by higher costs with logistics services; ii) the lower consumption and price (excluding exchange rate effects) of energy, notably natural gas, due to the higher energy efficiency of the Jacareí mill; and iii) higher utilities revenue due to the increased export volume, provided by the new Ribas unit. The positive effects on cash cost were offset by the +18% appreciation of the average USD against the average BRL.
Page 8 of 45
4Q24 EARNINGS RELEASE | | ||||||||||||||||
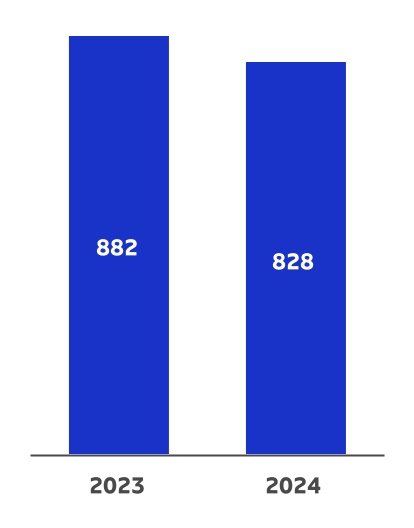
Consolidated Pulp Cash Cost ex-maintenance (R$/t)1
1Excludes the impact of maintenance and administrative downtimes.
Consolidated Pulp Cash Cost ex-maintenance (R$/t)1
1Excludes the impact of maintenance and administrative downtimes.
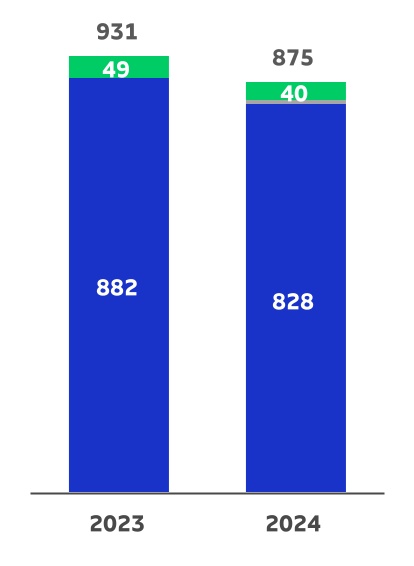
Cash cost ex-downtime in 2024 decreased 6% compared to 2023, due to the lower cost of inputs (especially natural gas and caustic soda) and the lower wood cost, mainly due to the lower average radius during the period and lower specific wood consumption. These effects were offset by the appreciation of the average USD against the BRL (+8%).
Page 9 of 45
4Q24 EARNINGS RELEASE | | ||||||||||||||||
1Based on cash cost excluding downtimes. Excludes energy sales.
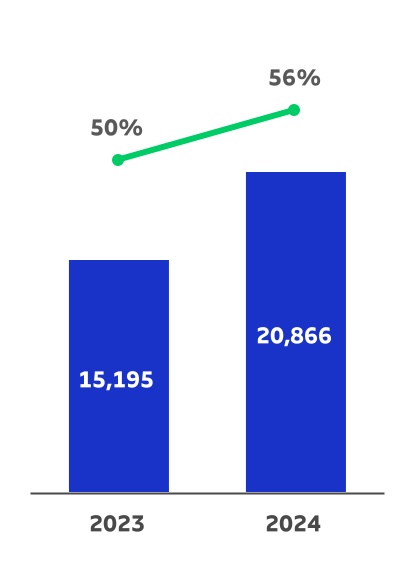
PULP SEGMENT EBITDA
| Pulp Segment | 4Q24 | 3Q24 | Δ Q-o-Q | 4Q23 | Δ Y-o-Y | 2024 | 2023 | Δ Y-o-Y | ||||||||||||||||||
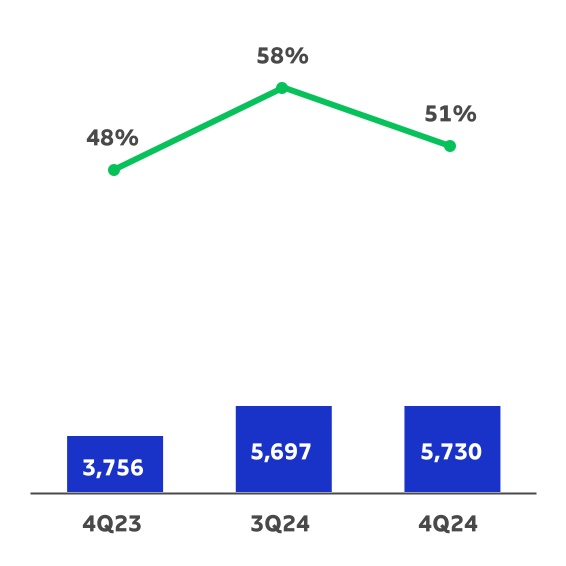
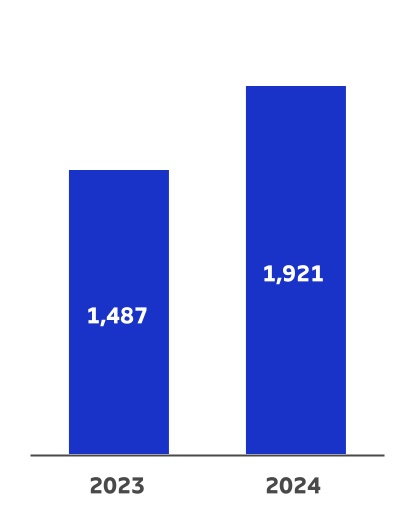
| Adjusted EBITDA (R$ million)¹ | 5,730 | 5,697 | 1% | 3,756 | 53% | 20,866 | 15,195 | 37% | ||||||||||||||||||
| Sales volume (k t) | 3,284 | 2,635 | 25% | 2,761 | 19% | 10,865 | 10,215 | 6% | ||||||||||||||||||
| Pulp adjusted¹ EBITDA (R$/t) | 1,745 | 2,162 | -19% | 1,360 | 28% | 1,921 | 1,487 | 29% | ||||||||||||||||||
1Excludes non-recurring items.
Adjusted EBITDA from pulp was 1% higher compared to 3Q24 due to: i) higher sales volume (+25%), driven by the start-up of Ribas do Rio Pardo; and ii) the appreciation of the average USD against the average BRL (+5%). These effects were offset by: i) the lower average net pulp price in USD (-13%); ii) higher SG&A expenses, mainly explained by the higher expenses with labor, mainly due to the increase in variable compensation and increase in staff as a result of new operations; and iii) higher COGS (greater impact of scheduled maintenance downtime and higher logistical expenses). The 19% decline in adjusted EBITDA per tonne is explained by the price drop and higher SG&A.
When compared to 4Q23, the 53% increase in Adjusted EBITDA from pulp reflects: i) the appreciation of the average USD against the average BRL (+18%); ii) the higher sales volume (+19%); and iii) the increase in the average net price in USD (+3%). Such factors were partially offset by i) the higher COGS per ton, mainly explained by the greater impact of scheduled maintenance downtime and logistical services expenses, ii) higher SG&A expenses, driven by increased personnel expenses, which reflect higher provision for variable compensation and an increase in staff due to new operations (Ribas and Suzano Packaging US). The 28% increase in adjusted EBITDA per tonne was driven by the appreciation of the average USD against the average BRL.
Page 10 of 45
4Q24 EARNINGS RELEASE | | ||||||||||||||||
Adjusted EBITDA1 (R$ million) and
Adjusted EBITDA Margin (%) of Pulp
| Adjusted EBITDA Margin | EBITDA Pulp | |||||||||||||
1Excludes non-recurring items.
Pulp Adjusted EBITDA per ton (R$/t)
| +28% | -19% | |||||||||||||||||||||||||||||||
| q | ||||||||||||||||||||||||||||||||
| +29% | ||||||||||||||||||||||||||
| q | ||||||||||||||||||||||||||
Page 11 of 45
4Q24 EARNINGS RELEASE | | ||||||||||||||||
OPERATING CASH FLOW FROM THE PULP SEGMENT
| Pulp Segment (R$ million) | 4Q24 | 3Q24 | Δ Q-o-Q | 4Q23 | Δ Y-o-Y | 2024 | 2023 | Δ Y-o-Y | ||||||||||||||||||
Adjusted EBITDA1 | 5,730 | 5,697 | 1% | 3,756 | 53% | 20,866 | 15,195 | 37% | ||||||||||||||||||
Maintenance Capex2 | (1,462) | (1,953) | -25% | (1,531) | -5% | (6,960) | (6,028) | 15% | ||||||||||||||||||
| Operating Cash Flow | 4,268 | 3,744 | 14% | 2,225 | 92% | 13,906 | 9,167 | 52% | ||||||||||||||||||
1Excludes non-recurring items.
2Cash basis.
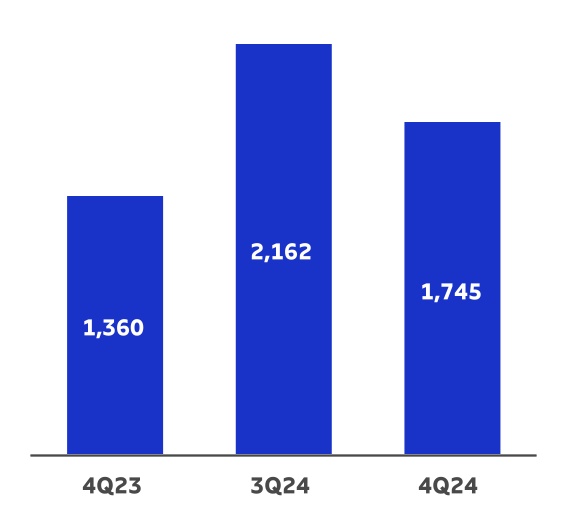
Operating cash generation per ton in the pulp segment was 9% lower than in 4Q24 vs. 3Q24, reflecting the lower EBITDA per ton, partially offset by the lower sustaining capex per ton. Compared to 4Q23, the 61% increase is due to higher EBITDA per ton and lower sustaining capex per ton.
Operating Cash Flow of Pulp per ton (R$/t)
| +61% | -9% | |||||||||||||||||||||||||||||||
| q | ||||||||||||||||||||||||||||||||
| +43% | ||||||||||||||||||||||||||
| q | ||||||||||||||||||||||||||
PAPER BUSINESS PERFORMANCE
The following data and analyses incorporate the joint results of the paper and consumer goods (tissue) businesses.
PAPER SALES VOLUME AND REVENUE
According to data published by Brazil’s Forestry Industry Association (Ibá), demand for Printing & Writing paper in Brazil, including imports, increased 7% in the first two months of 4Q24 compared to the first two months of 3Q24 and increased 12% compared to the same period last year.
Demand in the markets served by the company remained solid in the quarter. Compared to the same period last year, there was growth in all lines, driven by improved economic activity and a higher concentration of paper purchases for the federal government's textbook program during the period. Compared to the two months of the previous quarter, we had an expected reduction in demand for coated papers, with the end of the electoral cycle, offset by the growth in demand for uncoated paper lines.
Page 12 of 45
4Q24 EARNINGS RELEASE | | ||||||||||||||||
Regarding the international markets served by the company, the year was marked by healthy demand, especially in North America and Latin America, where local effects such as elections and the low comparison base with the previous year ended up offsetting the structural trend of declining demand in the P&W paper lines. However, in the last quarter, there were indications of demand closer to the structural downward trend, especially in Europe.
Regarding paperboard demand in Brazil, there was a 4% reduction in demand in the first two months of 4Q24 compared to the first two months of the previous quarter, while compared to the same period in 2023, there was a growth of 9.5%, according to Ibá. This growth vs. 2023 was the result of the positive performance of household consumption and the Brazilian economy, while the reduction vs. the previous quarter reflected a slowdown in economic activity in the last quarter of 2024, in specific sectors such as pharmaceuticals.
Consolidating the market segments mentioned above (paper market accessible to Suzano's Brazilian operations), demand grew by 11% in the first two months of 4Q24 compared to 4Q23, according to Ibá data. In the accumulated 11 months of 2024, demand grew by 5% compared to the same period in 2023.
The quarter was also marked by the completion of the acquisition of Pactiv Evergreen's assets in the US, and the beginning of the company's management of these operations. The integration of new employees, industrial assets, customers, and suppliers is proceeding according to the plan designed before the acquisition. During the quarter, all commercial contracts were renegotiated, with more favorable commercial conditions for Suzano, as well as the negotiations for input and logistics services were concluded aiming at capturing synergies. The industrial turnaround in the pursuit of better operational performance and higher production volume is proceeding as planned.
Suzano’s paper sales (printing & writing, paperboard and tissue) in the domestic market totaled 293 thousand tons in 4Q24, up 12% from 3Q24, driven by the growth in uncoated paper sales. Compared to 4Q23, the growth of 9% was due to the increase in sales of printing & writing paper (mainly uncoated paper) and paperboard.
Paper sales in the international markets amounted to 137 thousand tons, representing 32% of total sales volume in 4Q24. The increase of 41% compared to 3Q24 and of 17% compared to 4Q23 was due to the addition of Suzano Packaging US new volumes as from October 2024.
Page 13 of 45
4Q24 EARNINGS RELEASE | | ||||||||||||||||
Paper Sales Volume ('000 ton)1
| +11% | +20% | |||||||||||||||||||||||||||||||
| q | ||||||||||||||||||||||||||||||||
| +11% | ||||||||||||||||||||||||||
| q | ||||||||||||||||||||||||||
| Export Market | Brazilian Market | |||||||||||||
1Includes the Consumer Goods Unit and volumes of October and November/24 operations of Suzano Packaging US.
Average net price increased 1% compared to 3Q24, due to the addition of Suzano Packaging US, as well as the appreciation of the average USD against the average BRL. Compared to 4Q23, the +3% increase reflected the same factors mentioned previously.
Average Net Paper Price (R$/t)1
| +3% | +1% | |||||||||||||||||||||||||||||||
| q | ||||||||||||||||||||||||||||||||
| -3% | ||||||||||||||||||||||||||
| q | ||||||||||||||||||||||||||
1Includes the Consumer Goods Unit and volumes of October and November/24 operations of Suzano Packaging US.
Page 14 of 45
4Q24 EARNINGS RELEASE | | ||||||||||||||||
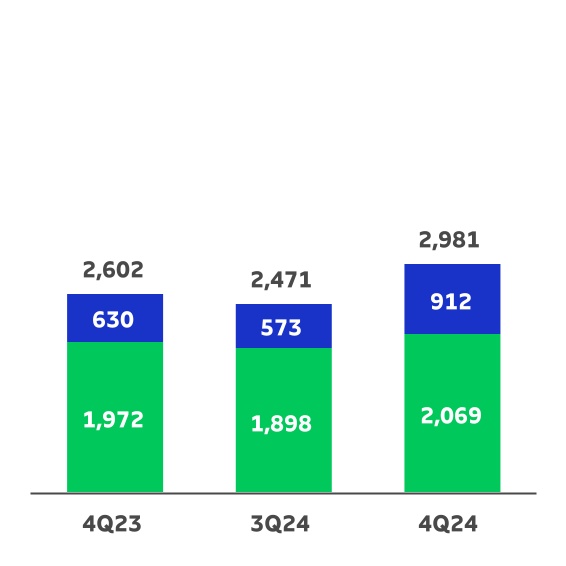
Net paper revenue came to R$2,981 million in 4Q24, an increase of 21% vs. 3Q24 mainly due to higher sales volume (+20%), impacted by the volumes of Suzano Packaging US and 15% vs. 4Q23, due to the appreciation of the average dollar against the real (+18%) and higher sales volume (+11%), also impacted by Suzano Packaging US volumes.
Paper Net Revenues (R$ million)1
| +15% | +21% | |||||||||||||||||||||||||||||||
| q | ||||||||||||||||||||||||||||||||
| +8% | ||||||||||||||||||||||||||
| q | ||||||||||||||||||||||||||
| Export Market | Brazilian Market | |||||||||||||
1Includes the Consumer Goods Unit and volumes of October and November/24 operations of Suzano Packaging US.
PAPER SEGMENT EBITDA
| Paper Segment | 4Q24 | 3Q24 | Δ Q-o-Q | 4Q23 | Δ Y-o-Y | 2024 | 2023 | Δ Y-o-Y | ||||||||||||||||||
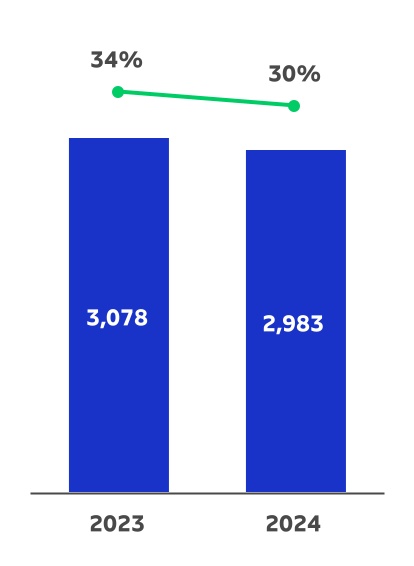
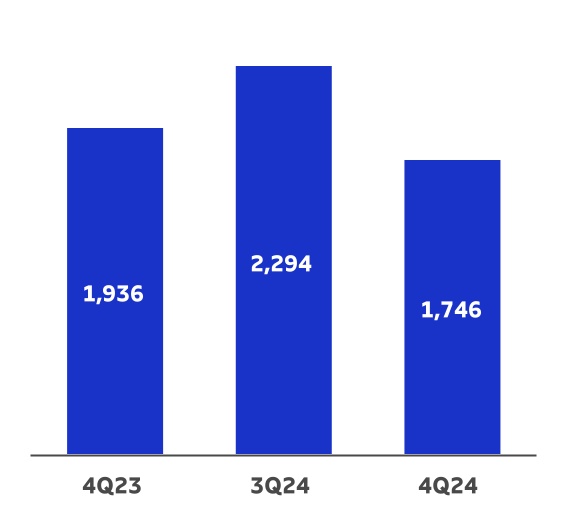
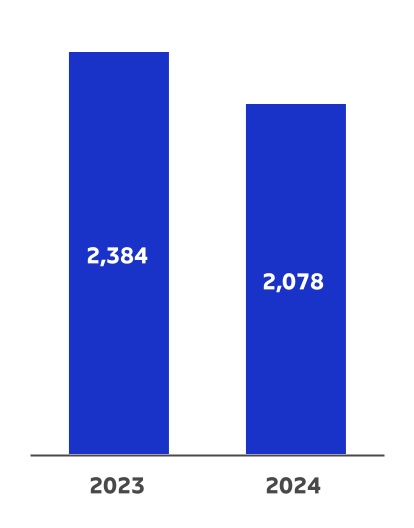
Adjusted EBITDA (R$ million)1 | 751 | 825 | -9% | 748 | 0% | 2,983 | 3,078 | -3% | ||||||||||||||||||
| Sales volume (k t) | 430 | 360 | 20% | 386 | 11% | 1,436 | 1,291 | 11% | ||||||||||||||||||
Paper adjusted1 EBITDA (R$/t) | 1,746 | 2,294 | -24% | 1,936 | -10% | 2,078 | 2,384 | -13% | ||||||||||||||||||
1Excludes non-recurring items.
Adjusted EBITDA from paper had a 9% decrease compared to 3Q24, as a result of: (i) the increase in COGS on a cash basis, an additional impact from the new Suzano Packaging US operation; and (ii) higher SG&A expenses, in turn due to the increase in personnel expenses (related to the adjustment of the variable remuneration provision) and the new Suzano Packaging US operation. These effects were partially offset by the reduction in the cost of inputs (price and consumption effect) and lower cost of wood in the other operations, in addition to the higher volume sold. The 24% decrease in adjusted EBITDA per ton is explained by the same factors.
Compared to 4Q23, the indicator was stable, with the positive factors being the increase in net revenue (higher volume and price) and the appreciation of the average USD against the average BRL (+18%). These were offset by: i) higher cash-based COGS, impacted by the new Suzano Packaging US operation (despite the reduction in the cost of inputs and wood in the other operations); and ii) the higher SG&A, impacted by the increase in personnel expenses (related to the adjustment of the variable remuneration provision) and the new operation of Suzano Packaging US. The -10% decrease in adjusted EBITDA per ton is explained by the same factors.
Page 15 of 45
4Q24 EARNINGS RELEASE | | ||||||||||||||||
Adjusted EBITDA (R$ million) and
Adjusted EBITDA Margin (%) of Paper
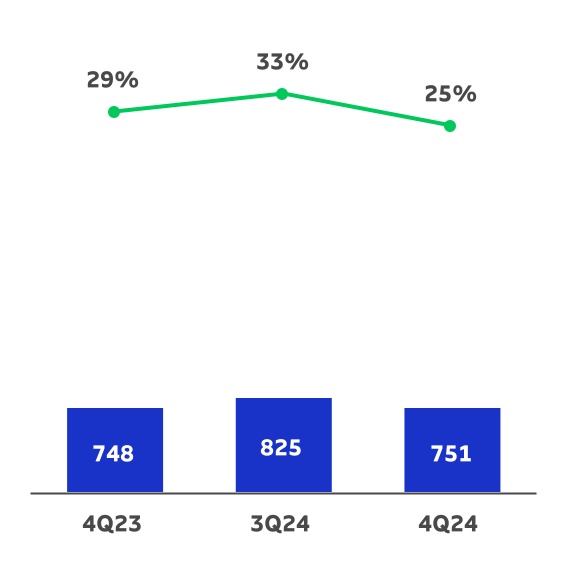
| Adjusted EBITDA Margin | EBITDA Paper | |||||||||||||
Paper Adjusted EBITDA (R$/t)
| -10% | -24% | ||||||||||||||||||||||||||||
| q | |||||||||||||||||||||||||||||
| -13% | ||||||||||||||||||||||||||
| q | ||||||||||||||||||||||||||
OPERATING CASH FLOW FROM THE PAPER SEGMENT
| Paper Segment (R$ million) | 4Q24 | 3Q24 | Δ Q-o-Q | 4Q23 | Δ Y-o-Y | 2024 | 2023 | Δ Y-o-Y | ||||||||||||||||||
Adjusted EBITDA1 | 751 | 825 | -9% | 748 | 0% | 2,983 | 3,078 | -3% | ||||||||||||||||||
Maintenance Capex2 | (176) | (175) | 1% | (195) | -10% | (650) | (679) | -4% | ||||||||||||||||||
| Operating Cash Flow | 575 | 650 | -12% | 553 | 4% | 2,334 | 2,400 | -3% | ||||||||||||||||||
1Excludes non-recurring items.
2Cash basis.
Page 16 of 45
4Q24 EARNINGS RELEASE | | ||||||||||||||||
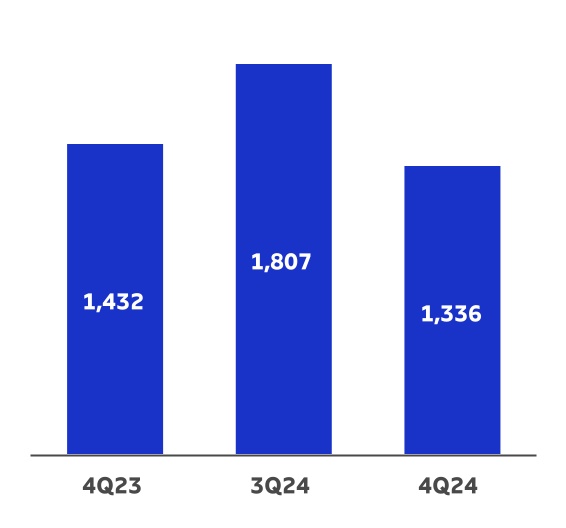
Operating cash generation per ton in the paper segment was R$1,336/t in 4Q24, down 26% from 3Q24 e -7% compared to 4Q23, driven by lower EBITDA per ton and partially offset by lower sustaining capex per ton.
Paper Operating Cash Generation per ton (R$/t)
| -7% | -26% | |||||||||||||||||||||||||||||||
| q | ||||||||||||||||||||||||||||||||
| -13% | ||||||||||||||||||||||||||
| q | ||||||||||||||||||||||||||
Page 17 of 45
4Q24 EARNINGS RELEASE | | ||||||||||||||||
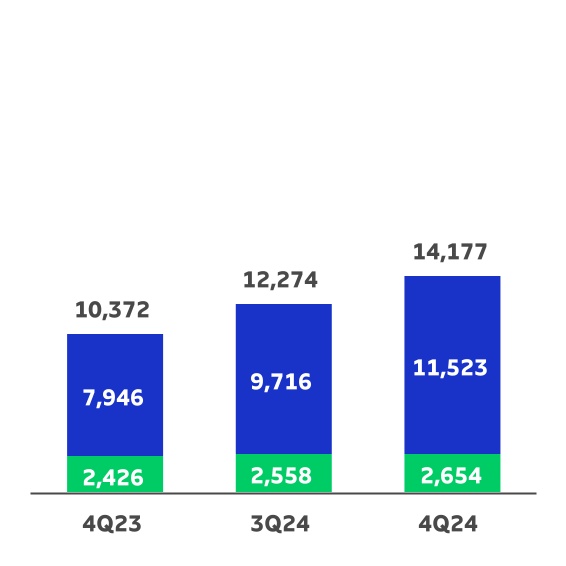
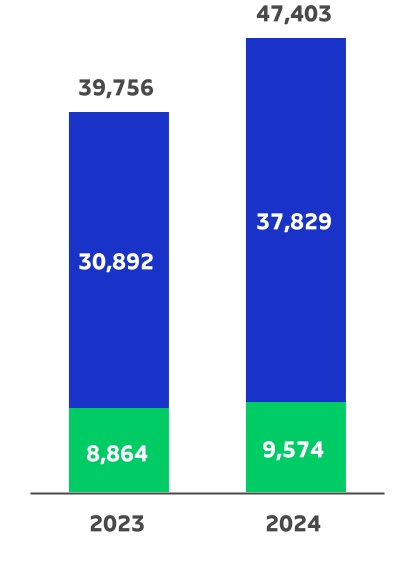
FINANCIAL PERFORMANCE
NET REVENUE
Suzano’s net revenue in 4Q24 was R$14,177 million, 81% of which came from exports (vs. 79% in 3Q24 and 77% in 4Q23). In relation to 3Q24, net revenue increased 16% due to the higher sales volume (+25%) and the appreciation of the average USD against the average BRL (+5%), partially offset by the lower net average pulp price in USD (-13%). The 37% increase in consolidated net revenue in 4Q24 vs. 4Q23 was driven by the appreciation of average USD against average BRL (+18%) and the higher pulp sales (+19%).
Net Revenue1 (R$ million)
| +37% | +16% | |||||||||||||||||||||||||||||||
| q | ||||||||||||||||||||||||||||||||
| +19% | ||||||||||||||||||||||||||
| q | ||||||||||||||||||||||||||
| Export Market | Brazilian Market | |||||||||||||
1Does not include Portocel service revenue.
Page 18 of 45
4Q24 EARNINGS RELEASE | | ||||||||||||||||
CALENDAR OF SCHEDULED MAINTENANCE DOWNTIMES
| Mill – Pulp capacity | 2023 | 2024 | 2025 | |||||||||||||||||||||||||||||||||||||||||
| 1Q23 | 2Q23 | 3Q23 | 4Q23 | 1Q24 | 2Q24 | 3Q24 | 4Q24 | 1Q25 | 2Q25 | 3Q25 | 4Q25 | |||||||||||||||||||||||||||||||||
| Aracruz - Mill A (ES) – 590 kt | No downtime | |||||||||||||||||||||||||||||||||||||||||||
| Aracruz - Mill B (ES) – 830 kt | No downtime | |||||||||||||||||||||||||||||||||||||||||||
| Aracruz - Mill C (ES) – 920 kt | No downtime | No downtime | ||||||||||||||||||||||||||||||||||||||||||
| Imperatriz (MA)¹ – 1,650 kt | No downtime | |||||||||||||||||||||||||||||||||||||||||||
| Jacareí (SP) – 1,100 kt | No downtime | |||||||||||||||||||||||||||||||||||||||||||
| Limeira (SP)¹ – 690 kt | ||||||||||||||||||||||||||||||||||||||||||||
| Mucuri - Mill 1 (BA)¹ – 600 kt | No downtime | |||||||||||||||||||||||||||||||||||||||||||
| Mucuri - Mill 2 (BA) – 1,130 kt | No downtime | |||||||||||||||||||||||||||||||||||||||||||
| Ribas do Rio Pardo (MS) - 2,550 kt | N/A | No downtime | ||||||||||||||||||||||||||||||||||||||||||
| Suzano (SP)¹ – 620 kt | ||||||||||||||||||||||||||||||||||||||||||||
| Três Lagoas - Mill 1 (MS) – 1,300 kt | No downtime | |||||||||||||||||||||||||||||||||||||||||||
| Três Lagoas - Mill 2 (MS) – 1,950 kt | No downtime | |||||||||||||||||||||||||||||||||||||||||||
| Veracel (BA)² – 560 kt | No downtime | |||||||||||||||||||||||||||||||||||||||||||
1Includes integrated capacities and fluff.
2Veracel is a joint operation between Suzano (50%) and Stora Enso (50%) with total annual capacity of 1,120 thousand tons.
COST OF GOODS SOLD (COGS)
| COGS (R$ million) | 4Q24 | 3Q24 | Δ Q-o-Q | 4Q23 | Δ Y-o-Y | 2024 | 2023 | Δ Y-o-Y | ||||||||||||||||||
| COGS (Income statement) | 8,761 | 6,848 | 28% | 6,776 | 29% | 27,402 | 25,077 | 9% | ||||||||||||||||||
| (-) Depreciation, depletion and amortization | (2,542) | (2,034) | 25% | (1,904) | 34% | (8,135) | (6,718) | 21% | ||||||||||||||||||
| Cash COGS | 6,218 | 4,814 | 29% | 4,872 | 28% | 19,267 | 18,358 | 5% | ||||||||||||||||||
| Sales volume (000' t) | 3,714 | 2,995 | 24% | 3,148 | 18% | 12,300 | 11,507 | 7% | ||||||||||||||||||
| Cash COGS/ton (R$/t) | 1,674 | 1,607 | 4% | 1,548 | 8% | 1,566 | 1,595 | -2% | ||||||||||||||||||
Cash COGS in 4Q24 totaled R$6,218 million, or R$1,674/ton. Compared to 3Q24, cash COGS increased 29%, mainly due to: i) the higher pulp sales, primarily provided by the new mill of Ribas; ii) additional cost impact due to the new operation of Suzano Packaging US; iii) a 5% appreciation of the average USD against the average BRL on items more exposed to the foreign currency (i.e., some chemicals, energy and maritime freight); iv) greater impact of scheduled maintenance downtime; and v) higher logistical costs (mainly due to the mill mix effect). These factors were partially offset by the positive impact of the acceleration of the Ribas learning curve and lower pulp production cash cost. On a per-tonne basis, cash COGS increased 4% due to the same factors ex-sales volumes.
In comparison to 4Q23, cash COGS increased 28%, driven by: i) the higher pulp sales; ii) additional impact on the cost with new operation of Suzano Packaging US; iii) greater impact of scheduled maintenance downtime; iv) 18% appreciation of the average USD against the average BRL on items more exposed to the foreign currency as previously mentioned; and v) higher logistical costs. On a per-ton basis, cash COGS increased 8% year on year, due to the same factors ex-sales volumes.
Page 19 of 45
4Q24 EARNINGS RELEASE | | ||||||||||||||||
SELLING EXPENSES
| Selling Expenses (R$ million) | 4Q24 | 3Q24 | Δ Q-o-Q | 4Q23 | Δ Y-o-Y | 2024 | 2023 | Δ Y-o-Y | ||||||||||||||||||
| Selling expenses (Income Statement) | 857 | 728 | 18% | 712 | 20% | 2,939 | 2,596 | 13% | ||||||||||||||||||
| (-) Depreciation, depletion and amortization | (237) | (239) | -1% | (239) | -1% | (955) | (952) | 0% | ||||||||||||||||||
| Cash selling expenses | 619 | 489 | 27% | 473 | 31% | 1,983 | 1,644 | 21% | ||||||||||||||||||
| Sales volume (000' t) | 3,714 | 2,995 | 24% | 3,148 | 18% | 12,300 | 11,507 | 7% | ||||||||||||||||||
| Cash selling expenses/ton (R$/t) | 167 | 163 | 2% | 150 | 11% | 161 | 143 | 13% | ||||||||||||||||||
Cash selling expenses grew 27% compared to 3Q24, mainly due to: i) higher volume sold; ii) higher labor expenses (increased staff associated with new operations of Ribas and Suzano Packaging US); and iii) the appreciation of the average USD against the average BRL (+5%) on international logistical expenses. On a per-ton basis, cash selling expenses increased 2% due to the same factors ex-sales volumes.
In relation to 4Q23, cash selling expenses increased 31% mainly due to: i) appreciation of the average USD against the average BRL (+18%), primarily affecting international logistical expenses; ii) higher sales volume; iii) higher labor expenses, largely associated with new operations (Ribas and Suzano Packaging US). Cash selling expenses per ton increased 11%, due to the same factors mentioned above ex-sales volumes.
GENERAL AND ADMINISTRATIVE EXPENSES
| General and Administrative Expenses (R$ million) | 4Q24 | 3Q24 | Δ Q-o-Q | 4Q23 | Δ Y-o-Y | 2024 | 2023 | Δ Y-o-Y | ||||||||||||||||||
| General and Administrative Expenses | 990 | 569 | 74% | 615 | 61% | 2,620 | 1,923 | 36% | ||||||||||||||||||
| (-) Depreciation, depletion and amortization | (38) | (36) | 6% | (33) | 15% | (144) | (119) | 21% | ||||||||||||||||||
| Cash general and administrative expenses | 952 | 533 | 79% | 582 | 64% | 2,476 | 1,804 | 37% | ||||||||||||||||||
| Sales volume (000' t) | 3,714 | 2,995 | 24% | 3,148 | 18% | 12,300 | 11,507 | 7% | ||||||||||||||||||
| Cash general and administrative expenses/t (R$/t) | 256 | 178 | 44% | 185 | 39% | 201 | 157 | 28% | ||||||||||||||||||
Compared to 3Q24, the 79% increase in cash general and administrative expenses is mainly explained by: i) higher personnel expenses (primarily related to the adjustment of the variable compensation provision); and ii) higher expenses with third-party services. On a per-tone basis, these expenses increased 44% due to the same factors.
Compared to 4Q23, cash general and administrative expenses were 64% higher, driven by: i) increased personnel expenses, reflecting the higher provision for variable compensation and increased staff due to new operations; and ii) higher expenses with third-party services (mainly IT, auditing and consultancy). On a per-tonne basis, the 39% increase is explained by the same factors.
Other operating income (expenses) resulted in an income of R$846 million, as against expense of R$8 million in 3Q24 and an income of R$902 million in 4Q23. The variation in relation to 3Q24 is mainly explained by the update of the fair value of biological assets (which happens in the second and fourth quarters of each year). Compared to 4Q23, the variation was due to various events of low materiality.
Page 20 of 45
4Q24 EARNINGS RELEASE | | ||||||||||||||||
ADJUSTED EBITDA
| Consolidated | 4Q24 | 3Q24 | Δ Q-o-Q | 4Q23 | Δ Y-o-Y | 2024 | 2023 | Δ Y-o-Y | ||||||||||||||||||
| Adjusted EBITDA (R$ million)¹ | 6,481 | 6,523 | -1% | 4,505 | 44% | 23,849 | 18,273 | 31% | ||||||||||||||||||
| Adjusted EBITDA Margin | 46% | 53% | -7 p.p | 43% | 2 p.p | 50% | 46% | 4 p.p | ||||||||||||||||||
| Sales Volume (k t) | 3,714 | 2,995 | 24% | 3,148 | 18% | 12,300 | 11,507 | 7% | ||||||||||||||||||
| Adjusted EBITDA¹/ton (R$/t) | 1,745 | 2,178 | -20% | 1,431 | 22% | 1,939 | 1,588 | 22% | ||||||||||||||||||
1Excludes non-recurring items.
The -1% reduction in Adjusted EBITDA in 4Q24 vs. 3Q24 is mainly explained by: i) the lower average net price of pulp in USD (-13%); and ii) the higher SG&A expenses due to higher personnel costs, which increased mainly due to a higher provision for variable compensation. These factors were mainly offset by the higher pulp sales (+24%), as well as the appreciation of the average USD against the average BRL (+5%). The -20% reduction in adjusted EBITDA per ton is explained by the price drop of pulp in USD and higher SG&A.
Compared to 4Q23, the 44% increase in Adjusted EBITDA was mainly due to: i) the appreciation of the average USD against the average BRL (+18%); and ii) the higher pulp and paper sales (+19% and +11%, respectively), these effects were partially offset by i) higher cash-based COGS, related to the new operation of Suzano Packaging US, and the greater impact of scheduled maintenance downtime and higher logistical costs, and ii) higher SG&A (as detailed previously).
Adjusted EBITDA per ton increased 22% due to the same factors, excluding sales volumes.
Page 21 of 45
4Q24 EARNINGS RELEASE | | ||||||||||||||||
FINANCIAL RESULT
| Financial Result (R$ million) | 4Q24 | 3Q24 | Δ Q-o-Q | 4Q23 | Δ Y-o-Y | 2024 | 2023 | Δ Y-o-Y | ||||||||||||||||||
| Financial Expenses | (1,692) | (1,567) | 8% | (1,175) | 44% | (5,542) | (4,659) | 19% | ||||||||||||||||||
| Interest on loans and financing (local currency) | (393) | (376) | 5% | (376) | 5% | (1,470) | (1,465) | 0% | ||||||||||||||||||
| Interest on loans and financing (foreign currency) | (1,077) | (1,021) | 5% | (884) | 22% | (3,944) | (3,332) | 18% | ||||||||||||||||||
| Capitalized interest¹ | 77 | 81 | -5% | 344 | -78% | 960 | 1,160 | -17% | ||||||||||||||||||
| Other financial expenses | (298) | (251) | 19% | (259) | 15% | (1,088) | (1,022) | 6% | ||||||||||||||||||
| Financial Income | 435 | 421 | 3% | 610 | -29% | 1,737 | 1,826 | -5% | ||||||||||||||||||
| Interest on financial investments | 386 | 393 | -2% | 565 | -32% | 1,598 | 1,668 | -4% | ||||||||||||||||||
| Other financial income | 50 | 28 | 79 | 45 | 11% | 139 | 157 | -11% | ||||||||||||||||||
| Monetary and Exchange Variations | (8,930) | 1,231 | - | 1,343 | - | (15,885) | 3,088 | - | ||||||||||||||||||
| Foreign exchange variations (Debt) | (9,699) | 1,370 | - | 2,024 | - | (17,713) | 4,186 | - | ||||||||||||||||||
| Other foreign exchange variations | 770 | (139) | - | (681) | - | 1,827 | (1,098) | - | ||||||||||||||||||
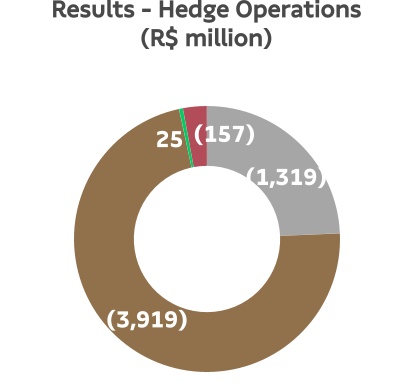
Derivative income (loss), net2 | (5,370) | 782 | - | 1,492 | - | (9,113) | 5,527 | - | ||||||||||||||||||
| Operating Cash flow hedge | (3,920) | 621 | - | 1,006 | - | (6,146) | 3,258 | - | ||||||||||||||||||
| Cash flow - Cerrado project hedge | — | 13 | - | 125 | - | (96) | 447 | - | ||||||||||||||||||
| Debt hedge | (1,319) | 199 | - | 299 | - | (2,647) | 1,532 | - | ||||||||||||||||||
| Others³ | (132) | (50) | - | 62 | - | (224) | 290 | - | ||||||||||||||||||
| Net Financial Result | (15,556) | 867 | - | 2,269 | - | (28,803) | 5,781 | - | ||||||||||||||||||
1Capitalized interest related to work in progress.
2Variation in mark-to-market adjustment (4Q24: -R$6,568 million | 3Q24: -R$1,396 million), plus adjustments paid and received (4Q24 = -R$198 million).
3Includes commodity hedge and embedded derivatives.
Financial expenses were 8% higher in 4Q24 vs. 3Q24, reflecting the increase in interest expenses in foreign currency, as a result of the appreciation of the USD against the BRL in the period, and the increase in the 'other financial expenses' due to the update of the provision for legal proceedings. Compared to 4Q23, financial expenses increased 44%, due to lower capitalized interest from funds invested in the execution of the Cerrado Project, as well as higher interest expenses in foreign currency, explained by the appreciation of the USD against the BRL.
Financial income increased 3% from 3Q24, driven by the increase in the 'other financial revenues', reflecting the inflation adjustment of federal taxes and contributions to be refunded. Compared to 4Q23, there was a 29% reduction in financial revenues, mainly explained by a 32% decrease in interest on financial investments, due to the lower financial income from subsidiary as well as a reduced average level of offshore cash.
Inflation adjustment and exchange variation had a negative impact of R$8,930 million on the Company’s financial result due to the 14% appreciation of USD against BRL in 3Q24, which affected foreign currency debt (US$13,405 million at the end of 4Q24). This effect was partially offset by the positive result of exchange variation on other balance sheet items in foreign currency.
Note that the accounting impact of exchange variation on foreign currency debt has a cash impact only on the respective maturities.
Page 22 of 45
4Q24 EARNINGS RELEASE | | ||||||||||||||||
Derivative operations resulted in a loss of R$5,370 million in 4Q24, driven by the negative impact of a weaker BRL. The mark-to-market adjustment of derivative instruments on December 31st, 2024 was an expense of R$6,568 million, compared to an expense of R$1,396 million on September 30th, 2024, representing a negative variation of R$5,172 million. Note that the impact of BRL depreciation on the derivatives portfolio generates a cash impact only upon the respective maturities. The net effect on cash, which refers to the maturity of derivative operations in the fourth quarter, was a negative R$198 million (R$82 million loss on debt hedge, R$126 million loss on cash flow hedge and R$10 million gain from commodities).
As a result of the above factors, net financial result in 4Q24, considering all financial expense and income lines, was an expense of R$15,556 million, compared to an income of R$867 million in 3Q24 and an income of R$2,269 million in 4Q23.
DERIVATIVE OPERATIONS
Suzano carries out derivative operations exclusively for hedging purposes. The following table reflects the position of derivative hedging instruments on December 31st, 2024:
Hedge1 | Notional (US$ million) | Fair Value (R$ million) | ||||||||||||
| Dec/24 | Sep/24 | Dec/24 | Sep/24 | |||||||||||
| Debt | 5,123 | 4,713 | (1,843) | (607) | ||||||||||
| Cash Flow – Operating (ZCC + NDF) | 7,433 | 7,623 | (4,661) | (867) | ||||||||||
Others2 | 342 | 361 | (64) | 78 | ||||||||||
| Total | 12,898 | 12,697 | (6,568) | (1,396) | ||||||||||
1See note 4 of the 4Q24 Quarterly Financial Statements (ITR) for further details and the fair value sensitivity analysis.
2Includes commodity hedging and embedded derivatives.
The Company’s foreign exchange exposure policy seeks to minimize the volatility of its cash generation and ensure greater flexibility in cash flow management. Currently, the policy stipulates that surplus dollars may be partially hedged (at least 40% and up to 75% of exchange variation exposure over the next 24 months) using plain vanilla instruments such as Zero Cost Collars (ZCC) and Non-Deliverable Forwards (NDF). Supported by the policy forecast, in November 2024, seeking to increase currency protection in a scenario of a depreciated Real and high interest rates, the Board of Directors approved an extraordinary cash flow hedge program totaling US$600 million for a period of 25-30 months. This extraordinary program was fully executed in the fourth quarter of 2024. At the end of 4Q24, 73% of the exchange variation exposure from the cash flow hedge portfolio was covered.
ZCC transactions establish minimum and maximum limits for the exchange rate that minimize adverse effects in the event of significant appreciation of the BRL. As such, if the exchange rate is within such limits, the Company neither pays nor receives any financial adjustments. This characteristic allows for capturing greater benefits from export revenue in a potential scenario of BRL appreciation versus USD within the range contracted. In cases of extreme BRL appreciation, the Company is protected by the minimum limits, which are considered appropriate for the operation. However, this protection instrument also limits, temporarily and partially, potential gains in scenarios of extreme BRL depreciation when exchange rates exceed the maximum limits contracted.
On December 31st, 2024, the outstanding notional value of operations involving forward USD sales through ZCCs related to Cash Flows was US$6,852 million, with an average forward rate ranging from R$5.36 to R$6.16 with maturities between January 2024 and May 2027. On the same date, the outstanding notional value of operations involving forward USD sales through NDFs was US$581 million, whose maturities are distributed between January 2025 and June 2026 and with an average rate of R$5.78. Cash flow hedge operations in 4Q24 resulted in a loss of R$3,920 million, mainly due to the currency depreciation that occurred during the period (-28%). The mark-to-market adjustment (“MtM” or “fair value”) of these operations was a loss of R$4,661 million.
Page 23 of 45
4Q24 EARNINGS RELEASE | | ||||||||||||||||
The following table presents a sensitivity analysis of the cash impact the Company could have on its cash flow hedge portfolios (ZCC and NDF) if the exchange rate remains the same as at the end of 4Q24 (BRL/USD = 6.19) in the coming quarters, as well as the projected cash impact for R$0.10 variations below / above the strike of put/call options, respectively, defined in each quarter. Note that the figures presented in the table are the Company’s projections based on the end-of-period curves and could vary depending on market conditions.
| Cash Adjustment (R$ million) | |||||||||||||||||
| Maturity (up to) | Strike Range | Notional (US$ million) | Actual | Exchange Rate 4Q24 (R$ 6.19) | Sensitivity at R$ 0.10 / US$ variation (+/-) | ||||||||||||
| Zero Cost Collars | |||||||||||||||||
| 4Q24 | — | — | 10 | — | — | ||||||||||||
| 1Q25 | 5.51 - 6.36 | 95 | — | (7) | 10 | ||||||||||||
| 2Q25 | 5.28 - 6.07 | 989 | — | (135) | 99 | ||||||||||||
| 3Q25 | 5.16 - 5.96 | 1,138 | — | (267) | 114 | ||||||||||||
| 4Q25 | 5.09 - 5.85 | 1,376 | — | (475) | 138 | ||||||||||||
| 1Q26 | 5.14 - 5.91 | 1,127 | — | (330) | 113 | ||||||||||||
| 2Q26 | 5.36 - 6.17 | 1,257 | — | (108) | 126 | ||||||||||||
| 3Q26 | 6.18 - 7.08 | 45 | — | — | 5 | ||||||||||||
| 4Q26 | 6.42 - 7.30 | 245 | — | 61 | 25 | ||||||||||||
| 1Q27 | 6.35 - 7.29 | 150 | — | 23 | 15 | ||||||||||||
| 2Q27 | 6.42 - 7.34 | 430 | — | 100 | 43 | ||||||||||||
| Total | 5.36 - 6.16 | 6,852 | 10 | (1,137) | 688 | ||||||||||||
| NDF | |||||||||||||||||
| 4Q24 | — | — | (135) | — | — | ||||||||||||
| 1Q25 | 5.75 | 270 | – | (120) | 27 | ||||||||||||
| 2Q25 | 5.75 | 221 | – | (97) | 22 | ||||||||||||
| 1Q26 | 5.85 | 27 | — | (9) | 3 | ||||||||||||
| 2Q26 | 5.95 | 63 | — | (15) | 6 | ||||||||||||
| Total | 5.78 | 581 | (135) | (242) | 58 | ||||||||||||
To mitigate the effects of exchange and interest rate variations on its debt and its cash flows, the Company also uses currency and interest rate swaps. Swap contracts are entered into considering different interest rates and inflation indices in order to mitigate the mismatch between financial assets and liabilities.
On December 31st, 2024, the Company had an outstanding notional amount of US$5,123 million in swap contracts as shown in the table below. In 4Q24, the result of debt hedge transactions was an expense of R$1,319 million, mainly due to BRL depreciation occurred during the period (-28%). The mark-to-market adjustment (fair value) of these operations was a loss of R$1,843 million.
Page 24 of 45
4Q24 EARNINGS RELEASE | | ||||||||||||||||
| Notional (US$ million) | Fair Value (R$ million) | |||||||||||||||||||
| Debt Hedge | Maturity (up to) | Currency | Dec/24 | Sep/24 | Dec/24 | Sep/24 | ||||||||||||||
| Swap (CDI x USD) | 2036 | USD | 910 | 910 | (776) | (361) | ||||||||||||||
| Swap (CNH x USD) | 2027 | USD | 166 | – | (6) | – | ||||||||||||||
| Swap (Sofr x USD) | 2030 | USD | 1,974 | 2,068 | 394 | 301 | ||||||||||||||
| Swap (CDI x Sofr) | 2034 | USD | 610 | 610 | (591) | (153) | ||||||||||||||
| Swap Sofr | 2029 | USD | 151 | 151 | (38) | (25) | ||||||||||||||
| Swap (IPCA x CDI) | 2044 | BRL | 1313¹ | 974¹ | (826) | (369) | ||||||||||||||
| Total | 5,123 | 4,713 | (1,843) | (607) | ||||||||||||||||
1Translated at the closing exchange rate (R$6.19).
The following table presents a sensitivity an alysis¹ of the cash impact that the Company could have on its debt hedge portfolio (swaps) if the exchange rate remains the same as at the end of 4Q24 (BRL/USD = 6.19) in the coming quarters, as well as the projected variation in cash impact for each R$0.10 variation on the same reference exchange rate (4Q24). Note that the figures presented in the table are the Company’s projections based on the end-of-period curves and could vary depending on market conditions.
| Cash Adjustment (R$ million) | ||||||||||||||
| Maturity (up to) | Notional (US$ million) | Actual | R$ / US$ = 6.19 (4Q24) | Sensitivity at R$ 0.10 / US$ variation (+/-)1 | ||||||||||
| 4Q24 | — | (82) | — | — | ||||||||||
| 2025 | 782 | — | 454 | 7 | ||||||||||
| 2026 | 448 | — | 368 | 8 | ||||||||||
| 2027 | 519 | — | 344 | 8 | ||||||||||
| 2028 | 230 | — | 209 | 23 | ||||||||||
| >=2029 | 3,144 | — | 1,647 | 186 | ||||||||||
| Total | 5,123 | (82) | 3,022 | 232 | ||||||||||
1Sensitivity analysis considers variation only in the exchange rate (R$/US$), while other variables are presumed constant.
Other transactions involving the Company’s derivatives are related to the embedded derivative resulting from forestry partnerships and commodity hedges, as shown in the table.
| Notional (US$ million) | Fair Value (R$ million) | Cash Adjustment (R$ million) | ||||||||||||||||||||||||
| Other hedges | Maturity (up to) | Index | Dec/24 | Sep/24 | Dec/24 | Sep/24 | Dec/24 | Sep/24 | ||||||||||||||||||
| Embedded derivative | 2039 | Fixed USD | USD US-CPI | 138 | 140 | (81) | 76 | — | — | ||||||||||||||||||
| Commodities | 2025 | Brent/VLSFO/Others | 204 | 221 | 17 | 2 | 10 | 16 | ||||||||||||||||||
| Total | 342 | 361 | (64) | 78 | 10 | 16 | ||||||||||||||||||||
Page 25 of 45
4Q24 EARNINGS RELEASE | | ||||||||||||||||
A portion of the forestry partnership agreements and standing timber supply agreements is denominated in USD per cubic meter of standing timber, adjusted by U.S. inflation measured by the Consumer Price Index (CPI), which is not related to inflation in the economic environment where the forests are located and, hence, constitutes an embedded derivative. This instrument, presented in the table above, consists of a sale swap contract of the variations in the US-CPI during the period of the contracts. See note 4 of the 4Q24 Financial Statements for more details and for a sensitivity analysis of the fair value in case of a sharp rise in the US-CPI and USD. On December 31st, 2024, the outstanding notional value of the operation was US$138 million. The result from this swap in 4Q24 was a loss of R$157 million. The mark-to-market (fair value) of such operations was negative R$81 million at the end of the quarter.
The Company is also exposed to the price of some commodities and, therefore, constantly assesses the contracting of derivative financial instruments to mitigate such risks. On December 31st, 2024, the outstanding notional value of these operations was US$204 million. The result of these hedges in 4Q24 was a gain of R$25 million. The mark-to-market adjustment (fair value) of these operations generated a gain of R$17 million at the end of the quarter.
 Total (5,370)
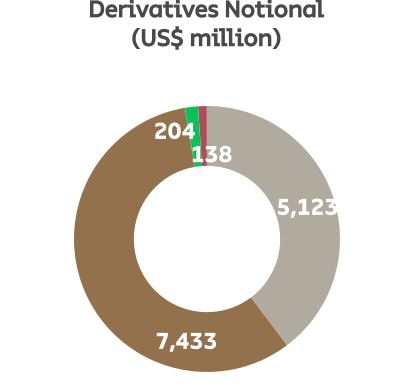 Total 12,898
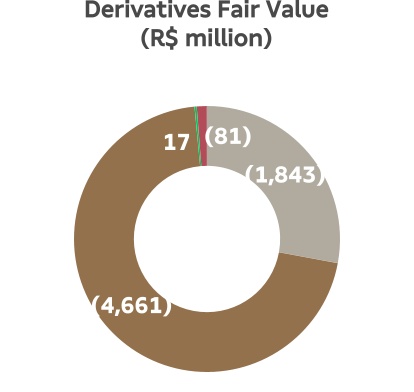 Total (6,568)
| Debt Hedge | Cash flow Hedge | Commodity Hedge | Embedded Derivatives | |||||||||||||||||||||||||||||||||||||||||
NET INCOME (LOSS)
In 4Q24, the Company posted net loss of R$6,737 million, compared to net income of R$3,237 million in 3Q24 and of R$4,515 million in 4Q23. The negative variation observed in relation to 3Q24 was due to the negative financial result, explained by the adverse impact of a stronger BRL on debt and derivative operations (as against the positive result registered in the previous quarter), in addition to the increase in COGS and SG&A, as previously explained. These effects were partially offset by the deferred IR/CSLL income (primarily impacting the negative results of exchange rate variation on debt and mark-to-market adjustments of derivatives), by the increase in net revenue and by the positive variation in other operating income/expenses, which was due to the revaluation of the biological assets.
The variation in relation to 4Q23 is also explained by the negative variation in financial result (caused by a weaker BRL on debt and derivative operations vs. a stronger BRL in 4Q23) and the increase in COGS and SG&A expenses. The aforementioned factors were partially offset by the positive amount of deferred IR/CSLL (compared to the negative amount in 4Q23, due to the positive result of exchange rate variation on debt and mark-to-market of derivatives) and by the increase in net revenue.
Page 26 of 45
4Q24 EARNINGS RELEASE | | ||||||||||||||||
DEBT
| Debt (R$ million) | 4Q24 | 3Q24 | Δ Q-o-Q | 4Q23 | Δ Y-o-Y | ||||||||||||
| Local Currency | 18,431 | 17,983 | 2% | 15,868 | 16% | ||||||||||||
| Short Term | 894 | 858 | 4% | 1,155 | -23% | ||||||||||||
| Long Term | 17,537 | 17,126 | 2% | 14,713 | 19% | ||||||||||||
| Foreign Currency | 83,005 | 69,787 | 19% | 61,305 | 35% | ||||||||||||
| Short Term | 9,607 | 6,864 | 40% | 3,603 | 167 | ||||||||||||
| Long Term | 73,397 | 62,923 | 17% | 57,702 | 27% | ||||||||||||
| Gross Debt | 101,436 | 87,770 | 16% | 77,173 | 31% | ||||||||||||
| (-) Cash | 22,382 | 17,596 | 27% | 21,613 | 4% | ||||||||||||
| Net debt | 79,053 | 70,175 | 13% | 55,560 | 42% | ||||||||||||
| Net debt/Adjusted EBITDA¹ (x) - R$ | 3.3x | 3.2x | -0,3x | 3,0x | 0,6x | ||||||||||||
| Net debt/Adjusted EBITDA¹ (x) – US$ | 2.9x | 3.1x | -0,1x | 3,1x | 0,4x | ||||||||||||
1Excluding non-recurring items.
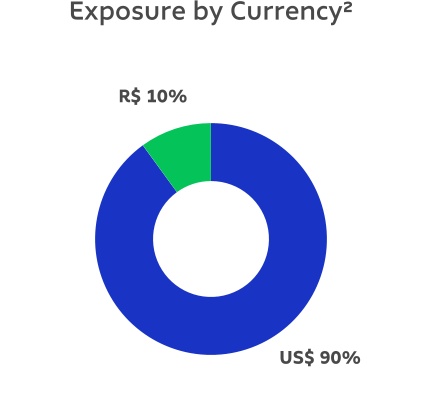
On December 31st, 2024, gross debt totaled R$101.4 billion and was composed of 90% long-term maturities and 10% short-term maturities. Foreign currency debt corresponded to 82% of the Company's total debt at the end of the quarter. The percentage of gross debt in foreign currency, considering the effect of debt hedge, was 90%. Compared to 3Q24, gross debt increased 16%, mainly due to the appreciation of the closing USD against the BRL, in addition to the funding operations carried out in the period. Suzano ended 4Q24 with 46% of its total debt linked to ESG instruments.
Suzano contracts debt in foreign currency as a natural hedge, since net operating cash generation is mostly denominated in foreign currency (USD) due to its predominant status as an exporter. This structural exposure allows the Company to match loans and financing payments in USD with receivable flows from sales.
Gross Debt Evolution (R$ million)
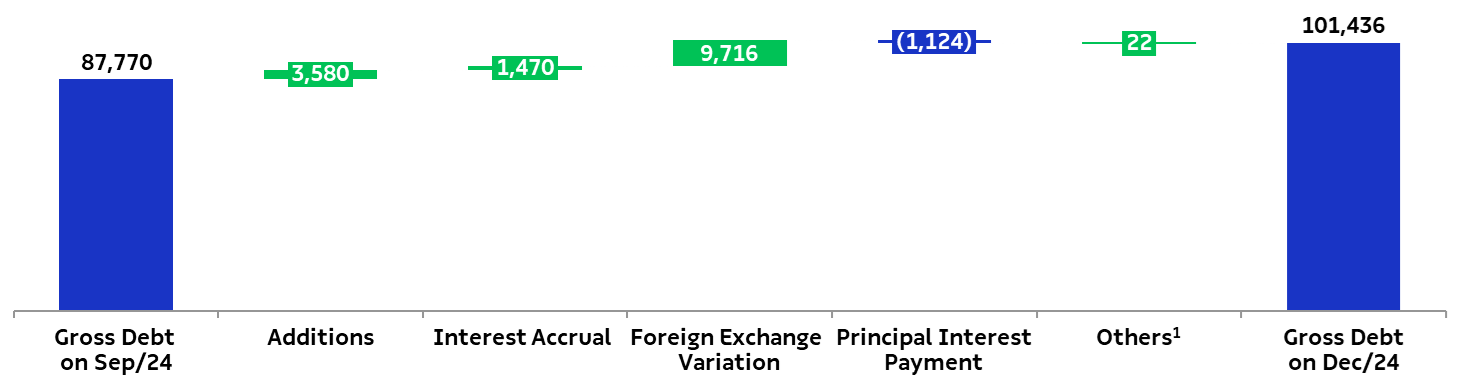
1Corresponding mainly to transaction costs (issue, funding, goodwill, discount and loss on business combinations, etc.).
On December 31st, 2024, the total average cost of debt in USD was 5.0% p.a. (considering the debt in BRL adjusted by the market swap curve), compared to 4.9% p.a. on September 30th, 2024. The average term of consolidated debt at the end of the quarter was 73 months, compared to 77 months at the end of 3Q24.
Page 27 of 45
4Q24 EARNINGS RELEASE | | ||||||||||||||||
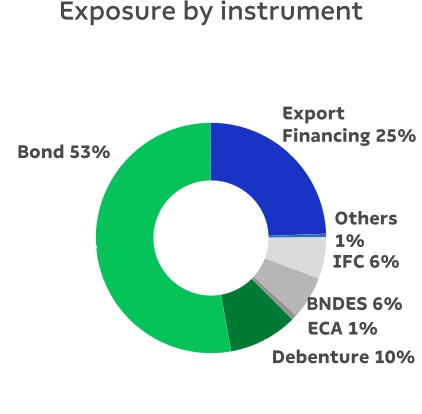
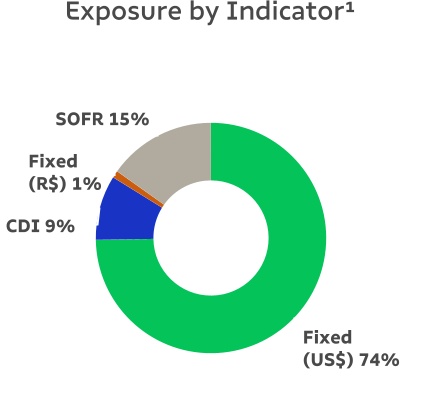
1Considers the portion of debt with swap for fixed rate in foreign currency. The exposure of the original debt was: Fixed (US$) – 53%, Libor/SOFR– 27%, CDI – 11%, Other (Fixed R$, IPCA, TJLP, others) – 9%.
2Considers the portion of debt with currency swaps. The original debt was 82% denominated in USD and 18% in BRL.
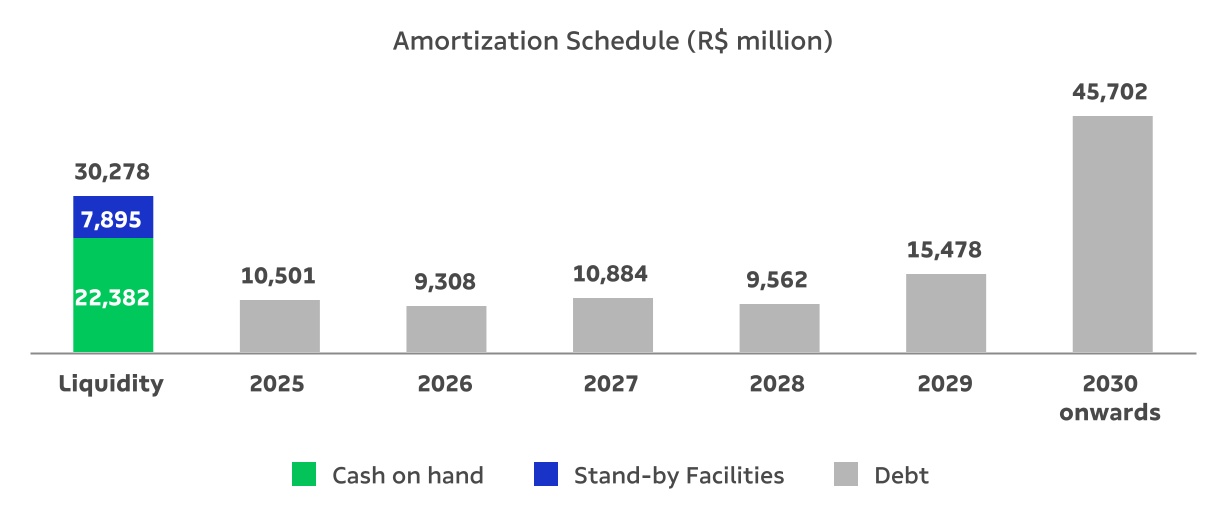
Cash and cash equivalents and financial investments on December 31st, 2024 amounted to R$22.4 billion, 29% of which were in foreign currency, allocated to remunerated account or in short-term fixed-income investments abroad. The remaining 71% was invested in local currency fixed-income bonds (mainly CDBs, but also in government bonds and others), remunerated at the CDI rate.
On December 31st, 2024, the Company also had a stand-by credit facility totaling R$7.9 billion (US$1.3 billion) available through February 2027. This facility strengthens the company's liquidity position and can be withdrawn during times of uncertainty. As a result, the cash and equivalents of R$22.4 billion plus the stand-by credit facilities amounted to a readily available cash position of R$30.3 billion on December 31st, 2024. Moreover, the Company has a financing agreement with Finnvera (US$800 million) related to the Cerrado Project, as per the Notice to the Market of November 1st, which has not yet been withdrawn, further strengthening Suzano's liquidity position.
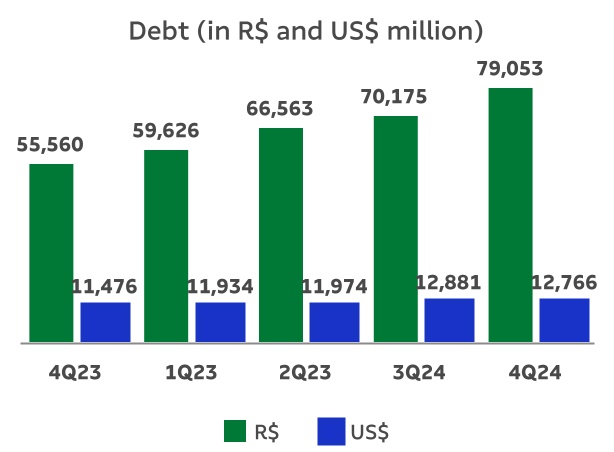
On December 31st, 2024, net debt stood at R$79.1 billion (US$12.8 billion), compared to R$70.2 billion (US$12.9 billion) on September 30th, 2024. The increase on net debt in local currency came from the exchange variation during the period.
Financial leverage, measured as the ratio of net debt to Adjusted EBITDA in BRL, stood at 3.3 times on December 31st, 2024 (3.2 times on September 30th, 2024). The same ratio in USD (the measure established in Suzano’s financial policy) fell to 2.9 times on December 31st, 2024 (3.1 times on September 30th, 2024).
Page 28 of 45
4Q24 EARNINGS RELEASE | | ||||||||||||||||
The breakdown of total gross debt between trade and non-trade finance on December 31st, 2024 is shown below:
| 2025 | 2026 | 2027 | 2028 | 2029 | 2030 onwards | Total | |||||||||||||||||
| Trade Finance¹ | 59% | 61% | 45% | 40% | 12% | 0% | 22% | ||||||||||||||||
| Non-Trade Finance² | 41% | 39% | 55% | 60% | 88% | 100% | 78% | ||||||||||||||||
1EEC, ECN, EPP
2Bonds, BNDES, CRA, Debentures, among others.
CAPEX
In 4Q24, capital expenditure (cash basis) totaled R$3,281 million. The 43% increase compared to 3Q24 was driven by: i) lower disbursement for acquisition of land and forests (completion in 3Q24 of the acquisition of 70,000 hectares, managed by BTG Pactual Timberland Investment Group); ii) reduced spending on forest maintenance, largely related to the lower purchases of standing timber from third parties and less spending on silviculture activities; and iii) lower investments in the Cerrado Project, due to the payment flow. These factors were partially offset by higher investments in ‘expansion and modernization’, especially in the new tissue mill and new biomass boiler in Aracruz (projects announced on October 26, 2023).
Compared to 4Q23, the 22% decrease is mainly due to lower spending on the Cerrado Project. This factor was partially offset by higher spending on land and forests and increased investments in expansion and modernization of the Aracruz and Limeira units.
The total capital expenditure in 2024 was executed in line with the revised guidance disclosed by the Company. For more details, read the Material Fact notice disclosed to the market on December 10th, 2024 and available on the Suzano Investor Relations website (ri.suzano.com.br).
For 2025, the Management approved a capital budget of R$12.4 billion, with R$7.8 billion allocated to industrial and forestry maintenance, among other investments presented in the table below.
Page 29 of 45
4Q24 EARNINGS RELEASE | | ||||||||||||||||
| Investments (R$ million)¹ | 4Q24 | 3Q24 | Δ Q-o-Q | 4Q23 | Δ Y-o-Y | 2024 | 2023 | Δ Y-o-Y | Guidance 2025 | ||||||||||||||||||||
| Maintenance | 1,638 | 2,128 | -23% | 1,726 | -5% | 7,610 | 6,707 | 13% | 7,813 | ||||||||||||||||||||
| Industrial maintenance | 460 | 331 | 39% | 432 | 6% | 1,285 | 1,329 | -3% | 5,790 | ||||||||||||||||||||
| Forestry maintenance | 1,107 | 1,743 | -36% | 1,221 | -9% | 6,168 | 5,199 | 19% | 1,737 | ||||||||||||||||||||
| Others | 71 | 54 | — | 72 | -2% | 156 | 179 | -12% | 286 | ||||||||||||||||||||
| Expansion and modernization | 482 | 114 | 322% | 145 | 233% | 972 | 694 | 40% | 1,572 | ||||||||||||||||||||
| Land and forestry | 637 | 2,473 | — | 152 | — | 4,043 | 2,610 | 55% | 2,140 | ||||||||||||||||||||
| Others² | 0 | 123 | -100% | 11 | — | 2 | 55 | -96% | 6 | ||||||||||||||||||||
| Cerrado Project | 523 | 893 | -41% | 2,190 | -76% | 4,493 | 8,511 | -47% | 850 | ||||||||||||||||||||
| Total | 3,281 | 5,733 | -43% | 4,224 | -22% | 17,120 | 18,578 | -8% | 12,381 | ||||||||||||||||||||
1The amounts in the table above do not include the effect of monetization of ICMS credits in the state of Espírito Santo. They do not consider the acquisition of minority stake in Lenzing and the investments for the acquisition of Pactiv's assets in Pine Bluff and Waynesville (Suzano Packaging US)
2The decrease in this category is due to the reclassification of investments in the state of Espírito Santo (biomass boiler and new Tissue machine) to the Expansion and Modernization line.
OPERATING CASH FLOW
| Operating Cash Flow (R$ million) | 4Q24 | 3Q24 | Δ Q-o-Q | 4Q23 | Δ Y-o-Y | 2024 | 2023 | Δ Y-o-Y | ||||||||||||||||||
Adjusted EBITDA1 | 6,481 | 6,523 | -1% | 4,505 | 44% | 23,849 | 18,273 | 31% | ||||||||||||||||||
Maintenance Capex2 | (1,638) | (2,128) | -23% | (1,726) | -5% | (7,610) | (6,707) | 13% | ||||||||||||||||||
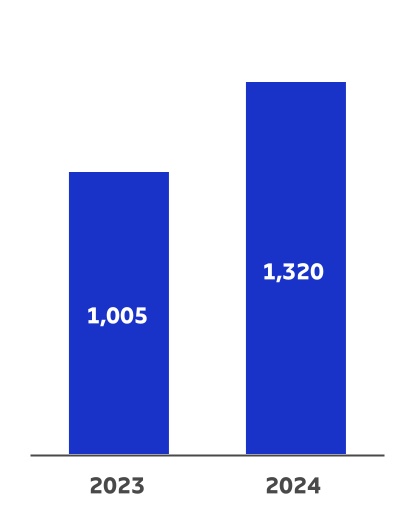
| Operating Cash Flow | 4,843 | 4,394 | 10% | 2,779 | 74% | 16,239 | 11,567 | 40% | ||||||||||||||||||
| Operating Cash Flow (R$/t) | 1,304 | 1,467 | -11% | 883 | 48% | 1,320 | 1,005 | 31% | ||||||||||||||||||
1Excludes non-recurring items.
2Cash basis.
Operating cash flow, measured by adjusted EBITDA less sustaining capex (cash basis), amounted to R$4,843 million in 4Q24. The 11% reduction in operating cash flow per ton in 4Q24 vs. 3Q24 was mainly due to a decrease in EBITDA per ton, partially offset by lower sustaining capex per ton. Compared to 4Q23, the 48% increase in operating cash generation per tonne is due to higher Adjusted EBITDA per ton and lower sustaining capex per ton.
Page 30 of 45
4Q24 EARNINGS RELEASE | | ||||||||||||||||
Operating Cash Flow
per ton (R$/t)
| +48% | -11% | |||||||||||||||||||||||||||||||
| q | ||||||||||||||||||||||||||||||||
| +31% | ||||||||||||||||||||||||||
| q | ||||||||||||||||||||||||||

FREE CASH FLOW
| Free Cash Flow (R$ million) | 4Q24 | 3Q24 | Δ Q-o-Q | 4Q23 | Δ Y-o-Y | 2024 | 2023 | Δ Y-o-Y | ||||||||||||||||||
| Adjusted EBITDA | 6,481 | 6,523 | -1% | 4,505 | 44% | 23,849 | 18,273 | 31% | ||||||||||||||||||
| (-) Total Capex¹ | (4,309) | (7,692) | -44% | (4,395) | -2% | (22,713) | (20,233) | 12% | ||||||||||||||||||
| (-) Leases contracts – IFRS 16 | (379) | (313) | 21% | (348) | 9% | (1,326) | (1,218) | 9% | ||||||||||||||||||
(+/-) △ Working capital2 | 639 | 568 | 13% | 810 | -21% | 1,996 | 3,517 | -43% | ||||||||||||||||||
(-) Net interest3 | (612) | (1,170) | -48% | (627) | -2% | (3,741) | (4,048) | -8% | ||||||||||||||||||
| (-) Income taxes | (102) | (91) | 12% | (53) | 92% | (366) | (308) | 19% | ||||||||||||||||||
| (-) Dividend and interest on own capital payment/Share Buyback Program | (306) | (2,497) | -88% | (190) | 61% | (4,431) | (1,073) | 0% | ||||||||||||||||||
| (+/-) Derivative cash adjustment | (198) | 331 | —% | 1,174 | —% | (550) | 3,559 | —% | ||||||||||||||||||
| Free cash flow | 1,214 | (4,341) | — | 876 | — | (7,283) | (1,531) | — | ||||||||||||||||||
| (+) Capex ex-maintenance | 2,382 | 5,677 | -58% | 2,763 | -14% | 12,154 | 13,818 | -12% | ||||||||||||||||||
| (+) Dividend and interest on own capital payment/Share Buyback Program | 306 | 2,497 | -88% | 190 | 61% | 4,431 | 1,073 | —% | ||||||||||||||||||
Free cash flow – Adjusted4 | 3,902 | 3,833 | 2% | 3,829 | 2% | 11,446 | 13,360 | -14% | ||||||||||||||||||
1Accrual basis, except for the investment related to the Cerrado Project in 2Q23 and onwards, as per note 15 (Property, Plant and Equipment) to the Financial Statements. Also considering the acquisition of land and forestry assets, minority stake acquisition on Lenzing and the acquisition of Pactiv Evergreen's assets.
2Considers costs of capitalized loans paid (4Q24: R$77 million | 3Q24: R$81 million | 4Q23: R$344 million), with no impact on free cash flow, which is included in the Total Capex item with the opposite sign.
3Considers interest paid on debt and interest received on financial investments.
4Free cash flow prior to dividend and interest on own capital payments, share buyback program and capex ex-maintenance (accrual basis).
Page 31 of 45
4Q24 EARNINGS RELEASE | | ||||||||||||||||
Adjusted Free Cash Flow in 4Q24 was R$3,902 million, compared to R$3,833 million in 3Q24 and R$3,829 million in 4Q23. The 2% increase in relation to 3Q24 was driven by the lower concentration of interest payments in the period, largely offset by the negative cash adjustment of derivatives (as opposed to the positive adjustment observed in the previous quarter).
Compared to 4Q23, the 2% increase reflects the higher adjusted EBITDA, partially offset by the negative cash adjustment of derivatives (vs. high positive adjustment in 4Q23), higher sustaining capex on accrual basis and lower release of working capital (mainly an increase in the accounts receivable category due to the higher volume of pulp and paper sales).
EVOLUTION OF NET DEBT
Following were the changes in net debt in 4Q24:
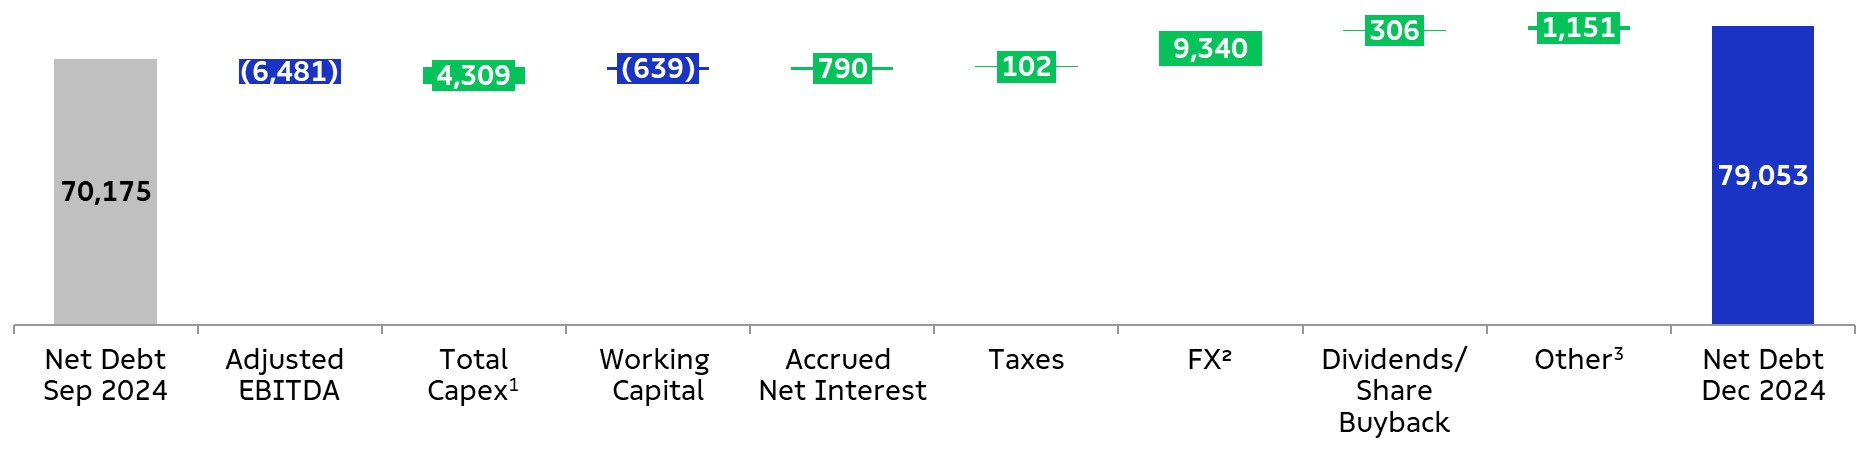
1Accrual basis, except for the capex related to Cerrado Project (cash basis), as per the Cash Flow Statement.
2Net of exchange variations on cash and financial investments.
3Considers cash amounts related to derivative adjustments, lease agreements and other items.
ESG
In the social sphere, Suzano launched an initiative in collaboration with its value chain to hire professionals facing social vulnerability. The initiative involves more than 100 suppliers of the Company and is aligned with its sustainability strategy, contributing to the goal of lifting people out of poverty.
Earlier this quarter, Suzano signed partnerships with the Rain Forest Alliance (RFA) and The Nature Conservancy (TNC) on biodiversity and water resource conservation, respectively. In addition to the institutions, these partnerships bring together other Suzano stakeholders, such as the public and private sectors and civil society. The partnership with RFA will contribute to the implementation of projects in the Amazon basin and to the fulfillment of Suzano's long-term commitment to biodiversity. Meanwhile, the partnership with TNC will focus on creating mechanisms for land restoration and conservation and the adoption of improved land management practices, which is a strategically important issue for Suzano.
In November, Suzano issued the first Green Panda Bond (approximately US$ 165 million) in the Americas, considering non-governmental or financial companies in the region. The funds raised will be allocated to the planting of sustainable eucalyptus forests, certified by FSC and/or PEFC, reaffirming the Company's commitment to environmentally responsible practices.
TOTAL OPERATIONAL EXPENDITURE - PULP
As disclosed in the Material Fact notice of December 12th, 2024, the total operational expenditure forecast for 2027 is approximately R$1,900 per ton. The indicator has been evolving according to plan, considering the exchange rate and monetary assumptions used. Said estimate refers to the currency in real terms of 2025. The Company also reports that the DTO for 2024 was R$ 2,172/t, consisting of a cash production cost (including downtimes) of R$ 875/t, maintenance capex of R$ 607/t, and Freight plus SG&A of R$ 690/t.
Page 32 of 45
4Q24 EARNINGS RELEASE | | ||||||||||||||||
CAPITAL MARKETS
On December 31st, 2024, Suzano’s stock was quoted at R$61.78/share (SUZB3) and US$10.12/share (SUZ). The Company’s stock is listed on the Novo Mercado, the listing segment of the São Paulo Stock Exchange (B3 – Brasil, Bolsa e Balcão) with the highest corporate governance standards, and on the New York Stock Exchange (NYSE) - Level II. The stock’s performance as of December 17th, 2024 considers the adjustment due to the payment of dividends (“ex” date for earnings paid on January 10, 2025).
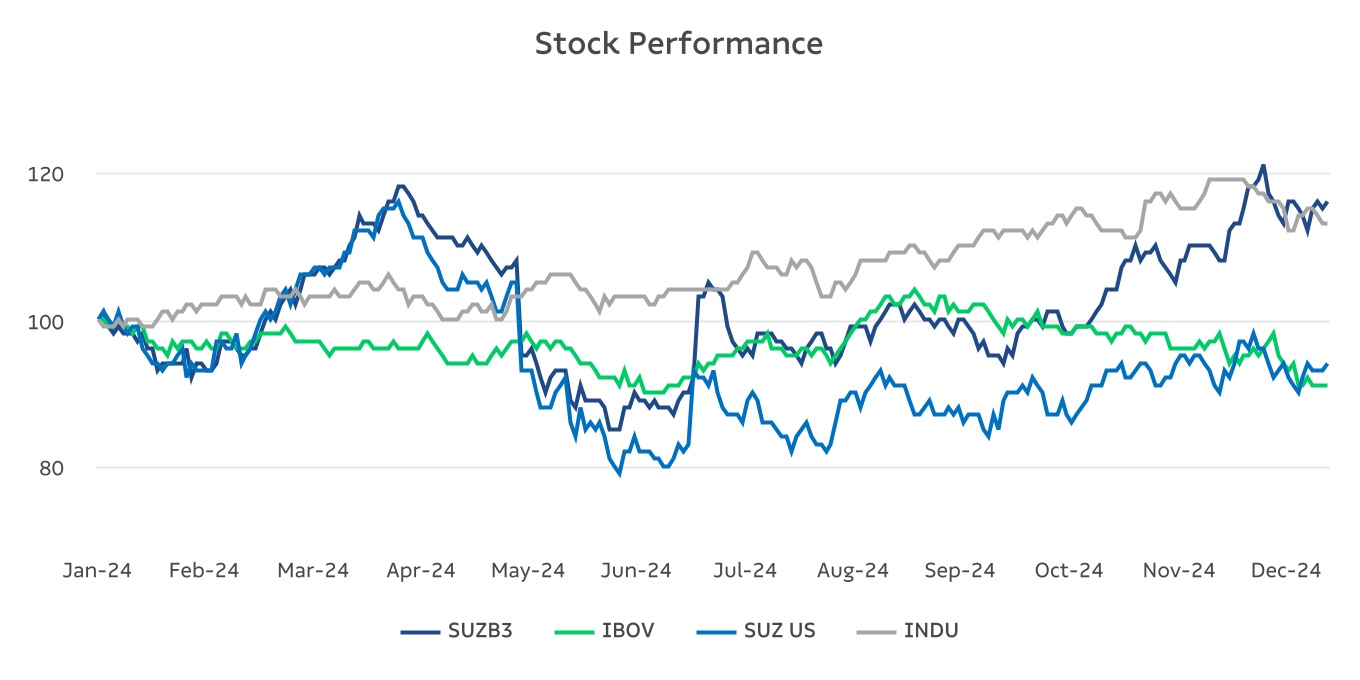
Source: Bloomberg.
Liquidity - SUZB3
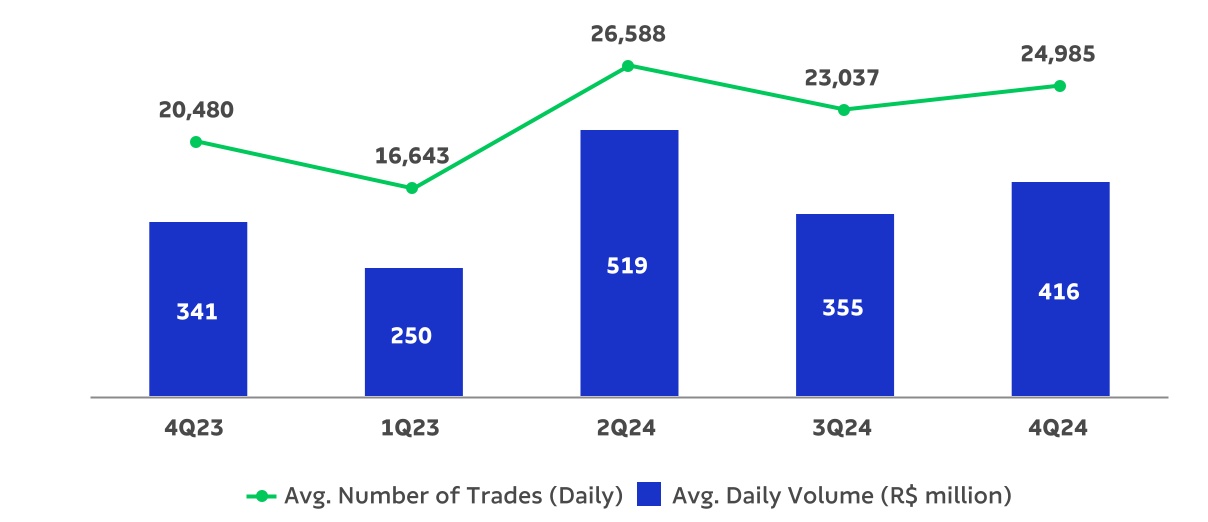
Source: Bloomberg.
As part of the 5° share buyback program announced and currently open (“August/2024 Program”), until the end of December 2024, the Company had traded 11,115,300 shares at an average cost of acquisition of R$55.18 each, representing R$613 million in market value, according to the monthly reports released by the Company under CVM Instruction 44.
Page 33 of 45
4Q24 EARNINGS RELEASE | | ||||||||||||||||
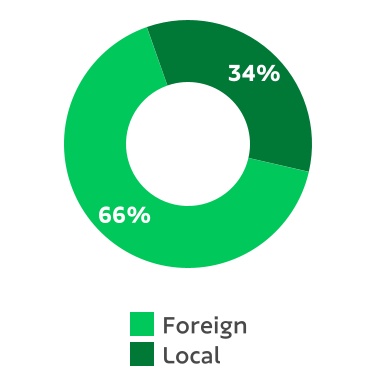
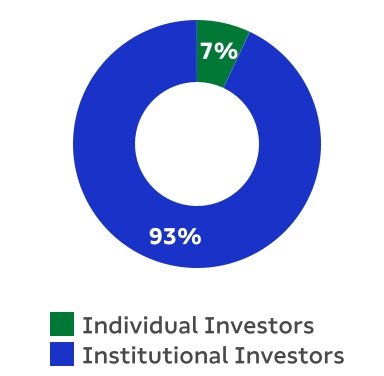
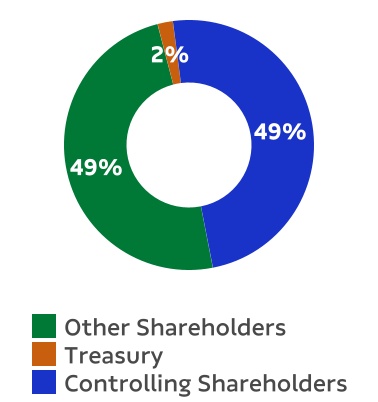
On December 31st, 2024, the Company's capital stock consisted of 1,264,117,615 common shares, of which 24,875,787 common shares were held in treasury. Suzano’s market capitalization on the same date (ex-treasury shares) stood at R$76.6 billion. Free float in 4Q24 corresponded to 49% of the total capital.
| Free Float distribution 12/31/2024 (B3+NYSE) | Ownership Structure (12/31/2024) | |||||||
FIXED INCOME
| Unit | Dec/24 | Sep/24 | Dec/23 | Δ Q-o-Q | Δ Y-o-Y | |||||||||||||||
| Suzano 2026 – Price | USD/k | 100.56 | 101.68 | 101.30 | -1% | -1% | ||||||||||||||
| Suzano 2026 – Yield | % | 5.36 | 4.76 | 5.20 | 13% | 3% | ||||||||||||||
| Fibria 2027 – Price | USD/k | 100.20 | 101.84 | 101.20 | -2% | -1% | ||||||||||||||
| Fibria 2027 – Yield | % | 5.40 | 4.64 | 5.07 | 16% | 6% | ||||||||||||||
| Suzano 2028 – Price | USD/k | 89.49 | 91.34 | 87.93 | -2% | 2% | ||||||||||||||
| Suzano 2028 – Yield | % | 5.69 | 4.94 | 5.44 | 15% | 5% | ||||||||||||||
| Suzano 2029 – Price | USD/k | 100.20 | 103.31 | 102.25 | -3% | -2% | ||||||||||||||
| Suzano 2029 – Yield | % | 5.94 | 5.13 | 5.48 | 16% | 8% | ||||||||||||||
| Suzano 2030 – Price | USD/k | 96.08 | 99.69 | 96.81 | -4% | -1% | ||||||||||||||
| Suzano 2030 – Yield | % | 5.91 | 5.07 | 5.63 | 17% | 5% | ||||||||||||||
| Suzano 2031 – Price | USD/k | 88.43 | 92.15 | 88.30 | -4% | 0% | ||||||||||||||
| Suzano 2031 – Yield | % | 6.07 | 5.23 | 5.80 | 16% | 5% | ||||||||||||||
| Suzano 2032 – Price | USD/k | 83.01 | 87.03 | 83.16 | -5% | 0% | ||||||||||||||
| Suzano 2032 – Yield | % | 6.14 | 5.29 | 5.77 | 16% | 6% | ||||||||||||||
| Suzano 2047 – Price | USD/k | 104.72 | 110.25 | 105.31 | -5% | -1% | ||||||||||||||
| Suzano 2047 – Yield | % | 6.59 | 6.15 | 6.55 | 7% | 1% | ||||||||||||||
| Treasury 10 years | % | 4.57 | 3.79 | 3.88 | 21% | 18% | ||||||||||||||
Note: Senior Notes issued with face value of 100 USD/k.
Page 34 of 45
4Q24 EARNINGS RELEASE | | ||||||||||||||||
RATINGS
| Agency | National Scale | Global Scale | Outlook | ||||||||
| Fitch Ratings | AAA | BBB- | Stable | ||||||||
| Standard & Poor’s | br.AAA | BBB- | Stable | ||||||||
| Moody’s | Aaa.br | Baa3 | Positive | ||||||||
Page 35 of 45
4Q24 EARNINGS RELEASE | | ||||||||||||||||
UPCOMING EVENTS
Earnings Conference Call (4Q24)
Date: February 13th, 2025 (Thursday)
| Portuguese (simultaneous translation) | English | ||||
| 10:00 a.m. (Brasília) | 10:00 a.m. (Brasília) | ||||
| 8 a.m. (New York) | 8:00 a.m. (New York) | ||||
| 1:00 p.m. (London) | 1:00 p.m. (London) | ||||
The conference call will be held in English and feature a presentation, with simultaneous webcast. The access links will be available on the Company’s Investor Relations website (www.suzano.com.br/ri).
If you are unable to participate, the webcast link will be available for future consultation on the Investor Relations website of Suzano.
IR CONTACTS
Marcos Assumpção
Camila Nogueira
Roberto Costa
Mariana Spinola
André Azambuja
Luísa Puccini
Arthur Trovo
Tel.: +55 (11) 3503-9330
ri@suzano.com.br
www.suzano.com.br/ri
Page 36 of 45
4Q24 EARNINGS RELEASE | | ||||||||||||||||
APPENDICES
APPENDIX 1 – Operating Data
Revenue Breakdown (R$ '000) | 4Q24 | 3Q24 | Δ Q-o-Q | 4Q23 | Δ Y-o-Y | 2024 | 2023 | Δ Y-o-Y | ||||||||||||||||||
| Exports | 11,522,651 | 9,715,968 | 19% | 7,946,224 | 45% | 37,829,439 | 30,892,283 | 22% | ||||||||||||||||||
| Pulp | 10,610,274 | 9,143,023 | 16% | 7,316,042 | 45% | 35,298,204 | 28,533,066 | 24% | ||||||||||||||||||
| Paper | 912,377 | 572,945 | 59% | 630,182 | 45% | 2,531,235 | 2,359,217 | 7% | ||||||||||||||||||
| Domestic Market | 2,654,347 | 2,557,578 | 4% | 2,425,321 | 9% | 9,573,843 | 8,863,292 | 8% | ||||||||||||||||||
| Pulp | 585,349 | 659,962 | -11% | 453,846 | 29% | 2,295,259 | 2,144,199 | 7% | ||||||||||||||||||
| Paper | 2,068,998 | 1,897,616 | 9% | 1,971,475 | 5% | 7,278,584 | 6,719,093 | 8% | ||||||||||||||||||
| Total Net Revenue | 14,176,998 | 12,273,546 | 16% | 10,371,545 | 37% | 47,403,282 | 39,755,575 | 19% | ||||||||||||||||||
| Pulp | 11,195,623 | 9,802,985 | 14% | 7,769,888 | 44% | 37,593,462 | 30,677,265 | 23% | ||||||||||||||||||
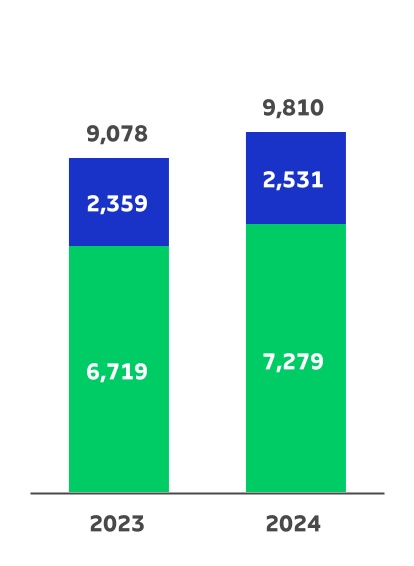
| Paper | 2,981,375 | 2,470,561 | 21% | 2,601,657 | 15% | 9,809,820 | 9,078,310 | 8% | ||||||||||||||||||
| Sales volume (‘000) | 4Q24 | 3Q24 | Δ Q-o-Q | 4Q23 | Δ Y-o-Y | 2024 | 2023 | Δ Y-o-Y | ||||||||||||||||||
| Exports | 3,251,298 | 2,556,854 | 27% | 2,698,453 | 20% | 10,600,114 | 9,882,402 | 7% | ||||||||||||||||||
| Pulp | 3,113,900 | 2,459,208 | 27% | 2,580,950 | 21% | 10,167,658 | 9,514,618 | 7% | ||||||||||||||||||
| Paper | 137,398 | 97,646 | 41% | 117,503 | 17% | 432,456 | 367,784 | 18% | ||||||||||||||||||
| Paperboard | 60,920 | 9,120 | — | 5,468 | — | 87,218 | 21,427 | — | ||||||||||||||||||
| Printing & Writing | 75,627 | 86,053 | -12% | 111,994 | -32% | 340,318 | 346,194 | -2% | ||||||||||||||||||
| Other paper¹ | 851 | 2,473 | — | 41 | — | 4,920 | 163 | — | ||||||||||||||||||
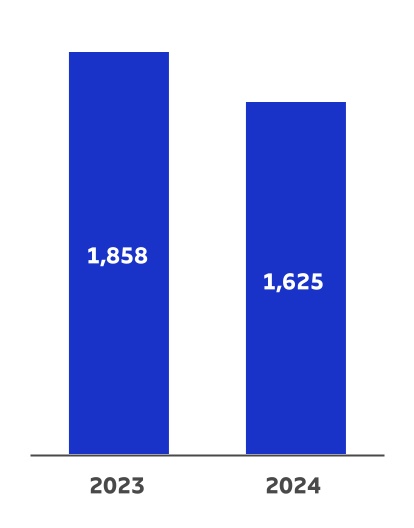
| Domestic Market | 463,036 | 438,268 | 6% | 449,089 | 3% | 1,700,318 | 1,624,336 | 5% | ||||||||||||||||||
| Pulp | 169,992 | 176,069 | -3% | 180,111 | -6% | 696,972 | 700,823 | -1% | ||||||||||||||||||
| Paper | 293,044 | 262,199 | 12% | 268,978 | 9% | 1,003,346 | 923,513 | 9% | ||||||||||||||||||
| Paperboard | 42,524 | 42,579 | — | 37,343 | 14% | 153,412 | 145,047 | 6% | ||||||||||||||||||
| Printing & Writing | 186,763 | 155,896 | 20% | 161,449 | 16 | 600,807 | 580,196 | 4% | ||||||||||||||||||
| Other paper¹ | 63,757 | 63,724 | — | 70,186 | -9% | 249,127 | 198,270 | 26% | ||||||||||||||||||
| Total Sales Volume | 3,714,334 | 2,995,122 | 24% | 3,147,542 | 18% | 12,300,432 | 11,506,738 | 7% | ||||||||||||||||||
| Pulp | 3,283,892 | 2,635,277 | 25% | 2,761,061 | 19% | 10,864,630 | 10,215,441 | 6% | ||||||||||||||||||
| Paper | 430,442 | 359,845 | 20% | 386,481 | 11 | 1,435,802 | 1,291,297 | 11% | ||||||||||||||||||
| Paperboard | 103,444 | 51,699 | 100% | 42,811 | 142% | 240,630 | 166,474 | 45% | ||||||||||||||||||
| Printing & Writing | 262,390 | 241,949 | 8% | 273,443 | -4% | 941,125 | 926,390 | 2% | ||||||||||||||||||
| Other paper¹ | 64,608 | 66,197 | -2% | 70,227 | -8% | 254,047 | 198,433 | 28% | ||||||||||||||||||
1Paper of other manufacturers sold by Suzano and tissue paper.
Page 37 of 45
4Q24 EARNINGS RELEASE | | ||||||||||||||||
Average net price (R$/t) | 4Q24 | 3Q24 | Δ Q-o-Q | 4Q23 | Δ Y-o-Y | 2024 | 2023 | Δ Y-o-Y | ||||||||||||||||||
| Exports | 3,544 | 3,800 | -7% | 2,945 | 20% | 3,569 | 3,126 | 14% | ||||||||||||||||||
| Pulp | 3,407 | 3,718 | -8% | 2,835 | 20% | 3,472 | 2,999 | 16% | ||||||||||||||||||
| Paper | 6,640 | 5,868 | 13% | 5,363 | 24% | 5,853 | 6,415 | -9% | ||||||||||||||||||
| Domestic Market | 5,732 | 5,836 | -2% | 5,401 | 6% | 5,631 | 5,457 | 3% | ||||||||||||||||||
| Pulp | 3,443 | 3,748 | -8% | 2,520 | 37% | 3,293 | 3,060 | 8% | ||||||||||||||||||
| Paper | 7,060 | 7,237 | -2% | 7,330 | -4% | 7,254 | 7,276 | — | ||||||||||||||||||
| Total | 3,817 | 4,098 | -7% | 3,295 | 16% | 3,854 | 3,455 | 12% | ||||||||||||||||||
| Pulp | 3,409 | 3,720 | -8% | 2,814 | 21% | 3,460 | 3,003 | 15% | ||||||||||||||||||
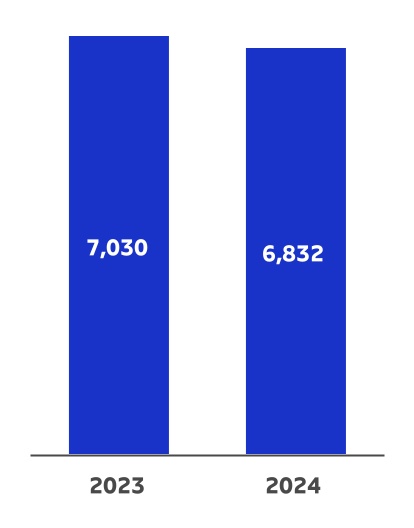
| Paper | 6,926 | 6,866 | 1% | 6,732 | 3% | 6,832 | 7,030 | -3% | ||||||||||||||||||
Average net price (US$/t) | 4Q24 | 3Q24 | Δ Q-o-Q | 4Q23 | Δ Y-o-Y | 2024 | 2023 | Δ Y-o-Y | ||||||||||||||||||
| Exports | 607 | 685 | -11% | 594 | 2% | 662 | 626 | 6% | ||||||||||||||||||
| Pulp | 583 | 670 | -13% | 572 | 2% | 644 | 600 | 7% | ||||||||||||||||||
| Paper | 1,137 | 1,058 | 7% | 1,082 | 5% | 1,086 | 1,284 | -15% | ||||||||||||||||||
| Domestic Market | 982 | 1,052 | -7% | 1,090 | -10% | 1,045 | 1,092 | -4% | ||||||||||||||||||
| Pulp | 590 | 676 | -13% | 509 | 16% | 611 | 613 | — | ||||||||||||||||||
| Paper | 1,209 | 1,305 | -7% | 1,479 | -18% | 1,346 | 1,457 | -8% | ||||||||||||||||||
| Total | 654 | 739 | -12% | 665 | -2% | 715 | 692 | 3% | ||||||||||||||||||
| Pulp | 584 | 671 | -13% | 568 | 3% | 642 | 601 | 7% | ||||||||||||||||||
| Paper | 1,186 | 1,238 | -4% | 1,359 | -13% | 1,268 | 1,407 | -10% | ||||||||||||||||||
| FX Rate R$/US$ | 4Q24 | 3Q24 | Δ Q-o-Q | 4Q23 | Δ Y-o-Y | 2024 | 2023 | Δ Y-o-Y | ||||||||||||||||||
| Closing | 6.19 | 5.45 | 14% | 4.84 | 28% | 6.19 | 4.84 | 28% | ||||||||||||||||||
| Average | 5.84 | 5.55 | 5% | 4.96 | 18% | 5.39 | 5.00 | 8% | ||||||||||||||||||
Page 38 of 45
4Q24 EARNINGS RELEASE | | ||||||||||||||||
APPENDIX 2 – Consolidated Statement of Income and Goodwill Amortization
| Income Statement (R$ ‘000) | 4Q24 | 3Q24 | Δ Q-o-Q | 4Q23 | Δ Y-o-Y | 2024 | 2023 | Δ Y-o-Y | ||||||||||||||||||
| Net Revenue | 14,176,998 | 12,273,546 | 16% | 10,371,545 | 37% | 47,403,282 | 39,755,575 | 19% | ||||||||||||||||||
| Cost of Goods Sold | (8,760,717) | (6,847,701) | 28% | (6,775,564) | 29% | (27,401,527) | (25,076,675) | 9% | ||||||||||||||||||
| Gross Debt | 5,416,281 | 5,425,845 | — | 3,595,981 | 51% | 20,001,755 | 14,678,900 | 36% | ||||||||||||||||||
| Gross Margin | 38% | 44% | -6 p.p. | 35% | 4 p.p. | 42% | 37% | 5 p.p. | ||||||||||||||||||
| Operating Expense/Income | (1,000,460) | (1,316,446) | — | (438,153) | 128% | (4,310,663) | (2,462,612) | 75% | ||||||||||||||||||
| Selling Expenses | (856,759) | (728,319) | 18% | (711,641) | 20% | (2,938,547) | (2,596,377) | 13% | ||||||||||||||||||
| General and Administrative Expenses | (990,245) | (568,854) | 74% | (614,892) | 61% | (2,619,844) | (1,923,228) | 36% | ||||||||||||||||||
| Other Operating Income (Expenses) | 845,547 | (7,945) | — | 901,929 | -6% | 1,261,573 | 2,076,372 | -39% | ||||||||||||||||||
| Equity Equivalence | 997 | (11,328) | — | (13,549) | — | (13,845) | (19,379) | — | ||||||||||||||||||
| EBIT | 4,415,821 | 4,109,399 | 7% | 3,157,828 | 40% | 15,691,092 | 12,216,288 | 28% | ||||||||||||||||||
| Depreciation, Amortization & Depletion | 2,809,949 | 2,303,266 | 22% | 1,787,944 | 57% | 9,223,995 | 7,321,110 | 26% | ||||||||||||||||||
| EBITDA | 7,225,770 | 6,412,665 | 13% | 4,945,772 | 46% | 24,915,087 | 19,537,398 | 28% | ||||||||||||||||||
| EBITDA Margin | 51% | 52% | -1 p.p. | 48% | 3 p.p. | 53% | 49% | 3 p.p. | ||||||||||||||||||
| Adjusted EBITDA¹ | 6,480,919 | 6,522,508 | -1% | 4,504,505 | 44% | 23,849,200 | 18,272,970 | 31% | ||||||||||||||||||
| Adjusted EBITDA Margin¹ | 46% | 53% | -7 p.p. | 43% | 2 p.p. | 50% | 46% | 4 p.p. | ||||||||||||||||||
| Net Financial Result | (15,556,184) | 867,762 | — | 2,269,458 | — | (28,802,145) | 5,780,928 | — | ||||||||||||||||||
| Financial Expenses | 435,391 | 420,938 | 3% | 610,005 | -29% | 1,737,434 | 1,825,649 | -5% | ||||||||||||||||||
| Financial Revenues | (1,691,603) | (1,567,007) | 8% | (1,175,488) | 44% | (5,541,903) | (4,659,162) | 19% | ||||||||||||||||||
| Exchange Rate Variation | (5,370,257) | 782,452 | — | 1,492,094 | — | (9,112,683) | 5,526,714 | — | ||||||||||||||||||
| Net Proceeds Generated by Derivatives | (8,929,715) | 1,231,379 | — | 1,342,847 | — | (15,884,993) | 3,087,727 | — | ||||||||||||||||||
| Earnings Before Taxes | (11,140,363) | 4,977,161 | — | 5,427,286 | — | (13,111,053) | 17,997,216 | — | ||||||||||||||||||
| Income and Social Contribution Taxes | 4,403,791 | (1,739,810) | — | (912,564) | — | 6,066,347 | (3,890,835) | — | ||||||||||||||||||
| Net Income (Loss) | (6,736,572) | 3,237,351 | — | 4,514,722 | — | (7,044,706) | 14,106,381 | -150% | ||||||||||||||||||
| Net Margin | -48% | 26% | -74 p.p. | 44% | -91 p.p. | -15% | 35% | -50 p.p. | ||||||||||||||||||
1Excluding non-recurring items and PPA effects.
| Goodwill amortization - PPA (R$ ‘000) | 4Q24 | 3Q24 | Δ Q-o-Q | 4Q23 | Δ Y-o-Y | ||||||||||||
| COGS | (114,953) | (115,596) | -1% | (145,285) | -21% | ||||||||||||
| Selling Expenses | (206,637) | (207,374) | — | (207,467) | — | ||||||||||||
| General and administrative expenses | (7,978) | (7,974) | — | (2,377) | 236% | ||||||||||||
| Other operational revenues (expenses) | 12,365 | 11,044 | 12% | 20,782 | -41% | ||||||||||||
Page 39 of 45
4Q24 EARNINGS RELEASE | | ||||||||||||||||
APPENDIX 3 – Consolidated Balance Sheet
| Assets (R$ ’000) | 12/31/2024 | 09/30/2024 | 12/31/2023 | ||||||||
| Current Assets | |||||||||||
| Cash and cash equivalents | 9,018,818 | 5,818,031 | 8,345,871 | ||||||||
| Financial investments | 12,971,547 | 11,311,861 | 12,823,886 | ||||||||
| Trade accounts receivable | 9,132,860 | 7,268,889 | 6,848,454 | ||||||||
| Inventories | 7,962,324 | 7,729,122 | 5,946,948 | ||||||||
| Recoverable taxes | 1,109,619 | 1,303,399 | 888,539 | ||||||||
| Derivative financial instruments | 1,006,427 | 1,232,059 | 2,676,526 | ||||||||
| Advance to suppliers | 92,133 | 118,167 | 113,743 | ||||||||
| Other assets | 889,232 | 996,174 | 925,105 | ||||||||
| Total Current Assets | 42,182,960 | 35,777,702 | 38,569,072 | ||||||||
| Non-Current Assets | |||||||||||
| Financial investments | 391,964 | 465,639 | 443,400 | ||||||||
| Recoverable taxes | 1,179,125 | 1,220,442 | 1,373,647 | ||||||||
| Deferred taxes | 7,984,015 | 3,316,202 | 545,213 | ||||||||
| Derivative financial instruments | 2,880,673 | 2,791,429 | 1,753,928 | ||||||||
| Advance to suppliers | 2,503,537 | 2,502,248 | 2,242,229 | ||||||||
| Judicial deposits | 487,993 | 485,353 | 361,693 | ||||||||
| Other assets | 156,880 | 139,656 | 182,463 | ||||||||
| Biological assets | 22,283,001 | 20,832,432 | 18,278,582 | ||||||||
| Investments | 1,816,923 | 1,917,844 | 608,013 | ||||||||
| Property, plant and equipment | 64,986,040 | 64,474,165 | 59,289,069 | ||||||||
| Right of use on lease agreements | 5,180,691 | 5,150,077 | 5,196,631 | ||||||||
| Intangible | 13,902,303 | 14,138,800 | 14,749,085 | ||||||||
| Total Non-Current Assets | 123,753,145 | 117,434,287 | 105,023,953 | ||||||||
| Total Assets | 165,936,105 | 153,211,989 | 143,593,025 | ||||||||
| Liabilities and Equity (R$ ’000) | 12/31/2024 | 09/30/2024 | 12/31/2023 | ||||||||
| Current Liabilities | |||||||||||
| Trade accounts payable | 6,033,285 | 5,341,937 | 5,572,219 | ||||||||
| Loans, financing and debentures | 10,501,387 | 7,721,426 | 4,758,247 | ||||||||
| Accounts payable for lease operations | 872,228 | 794,647 | 753,399 | ||||||||
| Derivative financial instruments | 2,760,273 | 565,392 | 578,763 | ||||||||
| Taxes payable | 363,715 | 612,585 | 443,454 | ||||||||
| Payroll and charges | 1,232,971 | 889,889 | 766,905 | ||||||||
| Liabilities for assets acquisitions and subsidiaries | 21,166 | 17,596 | 93,405 | ||||||||
| Dividends and interest on own capital payable | 2,200,917 | 3,106 | 1,316,528 | ||||||||
| Advance from customers | 145,200 | 170,124 | 172,437 | ||||||||
| Other liabilities | 346,796 | 374,219 | 339,683 | ||||||||
| Total Current Liabilities | 24,477,938 | 16,490,921 | 14,795,040 | ||||||||
| Non-Current Liabilities | |||||||||||
| Loans, financing and debentures | 90,934,144 | 80,049,026 | 72,414,445 | ||||||||
| Accounts payable for lease operations | 6,100,687 | 5,814,627 | 5,490,383 | ||||||||
| Derivative financial instruments | 7,694,547 | 4,853,868 | 1,857,309 | ||||||||
| Liabilities for assets acquisitions and subsidiaries | 99,324 | 90,152 | 93,782 | ||||||||
| Provision for judicial liabilities | 2,926,750 | 2,961,539 | 2,860,409 | ||||||||
| Actuarial liabilities | 721,560 | 850,987 | 833,683 | ||||||||
| Deferred taxes | 12,596 | 12,596 | 11,377 | ||||||||
| Share-based compensation plans | 361,974 | 307,798 | 268,489 | ||||||||
| Advance from customers | 74,715 | 74,715 | 74,715 | ||||||||
| Other liabilities | 116,295 | 104,002 | 83,093 | ||||||||
| Total Non-Current Liabilities | 109,042,592 | 95,119,310 | 83,987,685 | ||||||||
| Total Liabilities | 133,520,530 | 111,610,231 | 98,782,725 | ||||||||
| Shareholders’ Equity | |||||||||||
| Share capital | 19,235,546 | 19,235,546 | 9,235,546 | ||||||||
| Capital reserves | 60,226 | 48,162 | 26,744 | ||||||||
| Treasury shares | (1,339,197) | (1,339,197) | (1,484,014) | ||||||||
| Retained earnings reserves | 12,978,898 | 22,472,411 | 35,376,198 | ||||||||
| Other reserves | 1,348,796 | 1,322,487 | 1,538,296 | ||||||||
| Retained earnings | — | (268,657) | — | ||||||||
| Controlling shareholders’ | 32,284,269 | 41,470,752 | 44,692,770 | ||||||||
| Non-controlling interest | 131,306 | 131,006 | 117,530 | ||||||||
| Total Equity | 32,415,575 | 41,601,758 | 44,810,300 | ||||||||
| Total Liabilities and Equity | 165,936,105 | 153,211,989 | 143,593,025 | ||||||||
Page 40 of 45
4Q24 EARNINGS RELEASE | | ||||||||||||||||
APPENDIX 4 – Consolidated Statement of Cash Flow
| Cash Flow (R$ ’000) | 4Q24 | 4Q23 | 2024 | 2023 | ||||||||||
| OPERATING ACTIVITIES | ||||||||||||||
| Net income (loss) for the period | (6,736,572) | 4,514,723 | (7,044,706) | 14,106,381 | ||||||||||
| Depreciation, depletion and amortization | 2,715,071 | 1,705,090 | 8,874,931 | 6,999,839 | ||||||||||
| Depreciation of right of use | 94,878 | 82,855 | 349,064 | 321,271 | ||||||||||
| Interest expense on lease liabilities | 115,925 | 107,797 | 451,148 | 441,596 | ||||||||||
| Result from sale and disposal of property, plant and equipment and biological assets, net | 30,340 | 157,277 | 163,033 | 331,285 | ||||||||||
| Income (expense) from associates and joint ventures | (997) | 13,549 | 13,845 | 19,379 | ||||||||||
| Exchange rate and monetary variations, net | 8,929,715 | (1,342,847) | 15,884,993 | (3,087,727) | ||||||||||
| Interest expenses on financing, loans and debentures | 1,470,404 | 1,259,595 | 5,413,707 | 4,797,094 | ||||||||||
| Capitalized loan costs | (76,567) | (343,601) | (959,968) | (1,160,364) | ||||||||||
| Accrual of interest on marketable securities | (295,228) | (510,591) | (1,254,424) | (1,352,522) | ||||||||||
| Amortization of transaction costs, premium and discounts | 22,383 | 17,358 | 80,099 | 67,353 | ||||||||||
| Derivative gains, net | 5,370,257 | (1,492,094) | 9,112,683 | (5,526,714) | ||||||||||
| Fair value adjustment of biological assets | (892,527) | (733,516) | (1,431,530) | (1,989,831) | ||||||||||
| Deferred income tax and social contribution | (4,728,751) | 779,975 | (7,431,946) | 3,495,443 | ||||||||||
| Interest on actuarial liabilities | 18,962 | 17,242 | 75,850 | 69,231 | ||||||||||
| Provision for judicial liabilities, net | 44,166 | 58,923 | 138,318 | 139,934 | ||||||||||
| Tax litigation reduction program | — | (14,031) | — | — | ||||||||||
| Provision for doubtful accounts, net | 3,460 | 12,088 | 2,585 | 35,202 | ||||||||||
| Provision for inventory losses, net | 57,557 | 17,115 | 77,353 | 31,419 | ||||||||||
| Provision for loss of ICMS credits, net | 82,918 | 86,450 | 130,727 | 348,628 | ||||||||||
| Other | 52,275 | 37,610 | 69,535 | 66,938 | ||||||||||
| Decrease (increase) in assets | (679,788) | (59,197) | (1,761,659) | 1,768,894 | ||||||||||
| Trade accounts receivable | (1,041,445) | (431,979) | (808,785) | 2,155,448 | ||||||||||
| Inventories | 173,477 | 314,714 | (863,648) | (48,673) | ||||||||||
| Recoverable taxes | 165,895 | (47,361) | (95,411) | (666,681) | ||||||||||
| Other assets | 22,285 | 105,429 | 6,185 | 328,800 | ||||||||||
| Increase (decrease) in liabilities | 1,242,425 | 525,688 | 2,798,112 | 588,117 | ||||||||||
| Trade accounts payable | 1,081,803 | 398,533 | 2,164,832 | 463,003 | ||||||||||
| Taxes payable | (132,453) | 103,405 | 296,169 | 329,556 | ||||||||||
| Payroll and charges | 238,378 | (529) | 364,817 | 73,096 | ||||||||||
| Other liabilities | 54,697 | 24,279 | (27,706) | (277,538) | ||||||||||
| Cash generated from operations | 6,840,306 | 4,897,458 | 23,751,750 | 20,510,846 | ||||||||||
| Payment of interest on financing, loans and debentures | (844,088) | (792,060) | (5,241,389) | (4,728,998) | ||||||||||
| Capitalized loan costs paid | 76,567 | 343,601 | 959,968 | 1,160,364 | ||||||||||
| Interest received on marketable securities | 232,446 | 165,267 | 1,500,437 | 681,268 | ||||||||||
| Payment of income taxes | (102,357) | (52,559) | (366,339) | (308,002) | ||||||||||
| Cash provided by operating activities | 6,202,874 | 4,561,707 | 20,604,427 | 17,315,478 | ||||||||||
| INVESTING ACTIVITIES | ||||||||||||||
| Additions to property, plant and equipment | (2,014,333) | (2,849,649) | (9,190,589) | (11,674,183) | ||||||||||
| Additions to intangible | (19,277) | (99,205) | (162,042) | (104,931) | ||||||||||
| Additions to biological assets | (1,822,887) | (1,445,859) | (7,180,450) | (5,777,952) | ||||||||||
| Proceeds from sales of property, plant and equipment and biological assets | 55,055 | 38,360 | 167,983 | 183,576 | ||||||||||
| Capital increase in affiliates | (4,017) | (13,387) | (41,281) | (48,462) | ||||||||||
| Marketable securities, net | (1,514,192) | 1,995,227 | 205,954 | (5,296,370) | ||||||||||
| Advances for acquisition (receipt) of wood from operations with development and partnerships | (13,511) | (137,050) | (294,952) | (690,908) | ||||||||||
| Dividends received | — | 39,920 | — | 44,789 | ||||||||||
| Asset acquisition | (452,153) | — | (2,595,974) | (1,615,140) | ||||||||||
| Acquisition of subsidiaries | — | — | — | (1,060,718) | ||||||||||
| Acquisition of other investments | — | — | (1,440,503) | — | ||||||||||
| Net cash from acquisition of subsidiaries | — | — | 19,113 | 5,002 | ||||||||||
| Cash used in investing activities | (5,785,315) | (2,471,643) | (20,512,741) | (26,035,297) | ||||||||||
| FINANCING ACTIVITIES | ||||||||||||||
| Proceeds from loans, financing and debentures | 3,579,754 | 973,054 | 15,692,905 | 10,944,794 | ||||||||||
| Proceeds of derivative transactions | (198,308) | 1,174,172 | (550,581) | 3,559,286 | ||||||||||
| Payment of loans, financing and debentures | (279,463) | (812,456) | (9,410,807) | (4,296,447) | ||||||||||
| Payment of leases | (379,193) | (348,426) | (1,325,398) | (1,218,399) | ||||||||||
| Payment of interest on own capital and dividends | (306,333) | (190,120) | (1,624,653) | (192,532) | ||||||||||
| Liabilities for assets acquisitions and subsidiaries | — | — | (58,467) | (116,924) | ||||||||||
| Shares repurchased | — | — | (2,806,764) | (880,914) | ||||||||||
| Cash provided (used) by financing activities | 2,416,457 | 796,224 | (83,765) | 7,798,864 | ||||||||||
| EXCHANGE VARIATION ON CASH AND CASH EQUIVALENTS | 366,771 | (66,880) | 665,026 | (239,125) | ||||||||||
| Increase (decrease) in cash and cash equivalents, net | 3,200,787 | 2,819,408 | 672,947 | (1,160,080) | ||||||||||
| At the beginning of the period | 5,818,031 | 5,526,463 | 8,345,871 | 9,505,951 | ||||||||||
| At the end of the period | 9,018,818 | 8,345,871 | 9,018,818 | 8,345,871 | ||||||||||
| Increase (decrease) in cash and cash equivalents, net | 3,200,787 | 2,819,408 | 672,947 | (1,160,080) | ||||||||||
Page 41 of 45
4Q24 EARNINGS RELEASE | | ||||||||||||||||
APPENDIX 5 – EBITDA
| (R$ '000, except where otherwise indicated) | 4Q24 | 4Q23 | 7/16/1905 | 7/15/1905 | ||||||||||
| Net income | (6,736,572) | 4,514,722 | (7,044,706) | 14,106,381 | ||||||||||
| Net Financial Result | 15,556,184 | (2,269,458) | 28,802,145 | (5,780,928) | ||||||||||
| Income and Social Contribution Taxes | (4,403,791) | 912,564 | (6,066,347) | 3,890,835 | ||||||||||
| EBIT | 4,415,821 | 3,157,828 | 15,691,092 | 12,216,288 | ||||||||||
| Depreciation, Amortization and Depletion | 2,809,949 | 1,787,944 | 9,223,995 | 7,321,110 | ||||||||||
| EBITDA¹ | 7,225,770 | 4,945,772 | 24,915,087 | 19,537,398 | ||||||||||
| EBITDA Margin | 51% | 48% | 53% | 49% | ||||||||||
| Fair Value Update - Biological Asset | (892,529) | (733,516) | (1,431,532) | (1,989,831) | ||||||||||
| Write-off of wood inventory | 11,930 | 22,998 | 11,930 | 22,998 | ||||||||||
| Tax credits - Exclusion of ICMS in the PIS and COFINS calculation base | — | 15,108 | (265) | 15,108 | ||||||||||
| Donations for catastrophes and pandemics | 141 | — | 416 | — | ||||||||||
| Equity method | (997) | 13,549 | 13,845 | 19,379 | ||||||||||
| Extinction of packaging business line | (15) | 8,974 | 1,205 | 8,974 | ||||||||||
| Penalties for termination with contracts | — | — | — | 49,737 | ||||||||||
| Expenses on Asset Acquisition and Business Combinations | 11,993 | 829 | 34,069 | 25,171 | ||||||||||
| Effective loss of the development contract advance program | 4,435 | 52 | 4,435 | 3,265 | ||||||||||
| Accruals for losses on ICMS credits | 82,919 | 86,451 | 130,726 | 348,628 | ||||||||||
| Income from disposal and write-off of property, plant and equipment and biological assets | 37,272 | 144,288 | 169,284 | 232,143 | ||||||||||
| Adjusted EBITDA | 6,480,919 | 4,504,505 | 23,849,200 | 18,272,970 | ||||||||||
| Adjusted EBITDA Margin | 46% | 43% | 50% | 46% | ||||||||||
1The Company's EBITDA is calculated in accordance with CVM Instruction 527 of October 4, 2012.
Page 42 of 45
4Q24 EARNINGS RELEASE | | ||||||||||||||||
APPENDIX 6 – Segmented Income Statement
| Segmented Financial Statement (R$ '000) | 4Q24 | 4Q23 | ||||||||||||||||||||||||
| Pulp | Paper | Non Segmented | Total Consolidated | Pulp | Paper | Non Segmented | Total Consolidated | |||||||||||||||||||
| Net Revenue | 11,195,623 | 2,981,375 | — | 14,176,998 | 7,769,888 | 2,601,657 | — | 10,371,545 | ||||||||||||||||||
| Cost of Goods Sold | (6,836,873) | (1,923,844) | — | (8,760,717) | (5,155,822) | (1,619,742) | — | (6,775,564) | ||||||||||||||||||
| Gross Profit | 4,358,750 | 1,057,531 | — | 5,416,281 | 2,614,066 | 981,915 | — | 3,595,981 | ||||||||||||||||||
| Gross Margin | 39% | 35% | — | 38% | 34% | 38% | — | 35% | ||||||||||||||||||
| Operating Expense/Income | (509,026) | (491,434) | — | (1,000,460) | (128,762) | (309,391) | — | (438,153) | ||||||||||||||||||
| Selling Expenses | (554,266) | (302,493) | — | (856,759) | (453,103) | (258,538) | — | (711,641) | ||||||||||||||||||
| General and Administrative Expenses | (678,631) | (311,614) | — | (990,245) | (426,723) | (188,169) | — | (614,892) | ||||||||||||||||||
| Other Operating Income (Expenses) | 732,168 | 113,379 | — | 845,547 | 764,588 | 137,341 | — | 901,929 | ||||||||||||||||||
| Equity Equivalence | (8,297) | 9,294 | — | 997 | (13,524) | (25) | — | (13,549) | ||||||||||||||||||
| EBIT | 3,849,724 | 566,097 | — | 4,415,821 | 2,485,304 | 672,524 | — | 3,157,828 | ||||||||||||||||||
| Depreciation, Amortization & Depletion | 2,497,196 | 312,753 | — | 2,809,949 | 1,570,420 | 217,524 | — | 1,787,944 | ||||||||||||||||||
| EBITDA | 6,346,920 | 878,850 | — | 7,225,770 | 4,055,724 | 890,048 | — | 4,945,772 | ||||||||||||||||||
| EBITDA Margin | 57% | 29% | — | 51% | 52% | 34% | — | 48% | ||||||||||||||||||
| Adjusted EBITDA¹ | 5,729,507 | 751,412 | — | 6,480,919 | 3,756,297 | 748,208 | — | 4,504,505 | ||||||||||||||||||
| Adjusted EBITDA Margin¹ | 51% | 25% | — | 46% | 48% | 29% | — | 43% | ||||||||||||||||||
| Net Financial Result | — | — | (15,556,184) | (15,556,184) | — | — | 2,269,458 | 2,269,458 | ||||||||||||||||||
| Earnings Before Taxes | 3,849,724 | 566,097 | (15,556,184) | (11,140,363) | 2,485,304 | 672,524 | 2,269,458 | 5,427,286 | ||||||||||||||||||
| Income and Social Contribution Taxes | — | — | 4,403,791 | 4,403,791 | — | — | (912,564) | (912,564) | ||||||||||||||||||
| Net Income (Loss) | 3,849,724 | 566,097 | (11,152,393) | (6,736,572) | 2,485,304 | 672,524 | 1,356,894 | 4,514,722 | ||||||||||||||||||
| Net Margin | 34% | 19% | — | -48% | 32% | 26% | — | 44% | ||||||||||||||||||
1Excluding non-recurring items and PPA effects.
Page 43 of 45
4Q24 EARNINGS RELEASE | | ||||||||||||||||
| Segmented Financial Statement (R$ '000) | 12M24 | 12M23 | ||||||||||||||||||||||||
| Pulp | Paper | Non Segmented | Total Consolidated | Pulp | Paper | Non Segmented | Total Consolidated | |||||||||||||||||||
| Net Revenue | 37,593,462 | 9,809,820 | — | 47,403,282 | 30,677,265 | 9,078,310 | — | 39,755,575 | ||||||||||||||||||
| Cost of Goods Sold | (21,261,705) | (6,139,822) | — | (27,401,527) | (19,694,674) | (5,382,000) | — | (25,076,675) | ||||||||||||||||||
| Gross Profit | 16,331,757 | 3,669,998 | — | 20,001,755 | 10,982,591 | 3,696,309 | — | 14,678,900 | ||||||||||||||||||
| Gross Margin | 43% | 37% | — | 42% | 36% | 41% | — | 37% | ||||||||||||||||||
| Operating Expense/Income | (2,815,877) | (1,494,786) | — | (4,310,663) | (1,537,433) | (925,179) | — | (2,462,612) | ||||||||||||||||||
| Selling Expenses | (1,946,573) | (991,974) | — | (2,938,547) | (1,842,818) | (753,559) | — | (2,596,377) | ||||||||||||||||||
| General and Administrative Expenses | (1,861,148) | (758,696) | — | (2,619,844) | (1,338,831) | (584,397) | — | (1,923,228) | ||||||||||||||||||
| Other Operating Income (Expenses) | 1,042,887 | 218,686 | — | 1,261,573 | 1,678,929 | 397,443 | — | 2,076,372 | ||||||||||||||||||
| Equity Equivalence | (51,043) | 37,198 | — | (13,845) | (34,713) | 15,334 | — | (19,379) | ||||||||||||||||||
| EBIT | 13,515,880 | 2,175,212 | — | 15,691,092 | 9,445,158 | 2,771,130 | — | 12,216,288 | ||||||||||||||||||
| Depreciation, Amortization & Depletion | 8,137,857 | 1,086,138 | — | 9,223,995 | 6,606,870 | 714,240 | — | 7,321,110 | ||||||||||||||||||
| EBITDA | 21,653,735 | 3,261,352 | — | 24,915,087 | 16,052,028 | 3,485,370 | — | 19,537,398 | ||||||||||||||||||
| EBITDA Margin | 58% | 33% | — | 53% | 52% | 38% | — | 49% | ||||||||||||||||||
| Adjusted EBITDA¹ | 20,866,160 | 2,983,040 | — | 23,849,200 | 15,194,660 | 3,078,310 | — | 18,272,970 | ||||||||||||||||||
| Adjusted EBITDA Margin¹ | 56% | 30% | — | 50% | 50% | 34% | — | 46% | ||||||||||||||||||
| Net Financial Result | — | — | (28,802,145) | (28,802,145) | — | — | 5,780,928 | 5,780,928 | ||||||||||||||||||
| Earnings Before Taxes | 13,515,880 | 2,175,212 | (28,802,145) | (13,111,053) | 9,445,158 | 2,771,130 | 5,780,928 | 17,997,216 | ||||||||||||||||||
| Income and Social Contribution Taxes | — | — | 6,066,347 | 6,066,347 | — | — | (3,890,835) | (3,890,835) | ||||||||||||||||||
| Net Income (Loss) | 13,515,880 | 2,175,212 | (22,735,798) | (7,044,706) | 9,445,158 | 2,771,130 | 1,890,093 | 14,106,381 | ||||||||||||||||||
| Net Margin | 36% | 22% | — | -15% | 31% | 31% | — | 35% | ||||||||||||||||||
Page 44 of 45
4Q24 EARNINGS RELEASE | | ||||||||||||||||
Forward-Looking Statements
This release may contain forward-looking statements. Such statements are subject to known and unknown risks and uncertainties due to which such expectations may not happen at all or may substantially differ from what was expected. These risks include, among others, changes in future demand for the Company’s products, changes in factors affecting domestic and international product prices, changes in the cost structure, changes in the seasonal patterns of markets, changes in prices charged by competitors, foreign exchange variations, changes in the political or economic situation of Brazil, as well as emerging and international markets. The forward-looking statements were not reviewed by our independent auditors.
Page 45 of 45