UNITED STATES
SECURITIES AND EXCHANGE COMMISSION
Washington, D.C. 20549
FORM 10-K
(Mark One)
| x | ANNUAL REPORT PURSUANT TO SECTION 13 OR 15(d) OF THE SECURITIES EXCHANGE ACT OF 1934. |
For the fiscal year ended September 26, 2009
OR
| ¨ | TRANSITION REPORT PURSUANT TO SECTION 13 OR 15(d) OF THE SECURITIES EXCHANGE ACT OF 1934. |
For the transition period from to
Commission file number 1-12340
GREEN MOUNTAIN COFFEE ROASTERS, INC.
(Exact name of registrant as specified in its charter)
| | |
| Delaware | | 03-0339228 |
| (State or other jurisdiction of incorporation or organization) | | (I.R.S. Employer Identification No.) |
| | |
| 33 Coffee Lane, Waterbury, Vermont | | 05676 |
| (Address of principal executive offices) | | (zip code) |
(802) 244-5621
(Registrants’ telephone number, including area code)
(Former name, former address and former fiscal year, if changed since last report.)
Securities registered pursuant to Section 12(b) of the Act:
| | |
| Title of each class | | Name of each exchange on which registered |
| Common Stock, $0.10 par value per share | | The Nasdaq Global Market |
Securities registered pursuant to Section 12(g) of the Act:NONE
Indicate by check mark if the registrant is a well-known seasoned issuer, as defined in Rule 405 of the Securities Act. Yes x No ¨
Indicate by check mark if the registrant is not required to file reports pursuant to Section 13 or Section 15(d) of the Act. Yes ¨ No x
Indicate by check mark whether the registrant (1) has filed all reports required to be filed by Section 13 or 15(d) of the Securities Exchange Act of 1934 during the preceding 12 months (or for such shorter period that the registrant was required to file such reports), and (2) has been subject to such filing requirements for the past 90 days. Yes x No ¨
Indicate by check mark whether the registrant has submitted electronically and posted on its corporate Web site, if any, every Interactive Data File required to be submitted and posted pursuant to Rule 405 of Regulation S-T (§232.405 of this chapter) during the preceding 12 months (or for such shorter period that the registrant was required to submit and post such files). Yes ¨ No ¨
Indicate by check mark if disclosure of delinquent filers pursuant to Item 405 of Regulation S-K is not contained herein, and will not be contained, to the best of registrant's knowledge, in definitive proxy or information statements incorporated by reference in Part III of this Form 10-K or any amendment to this Form 10-K. ¨
Indicate by check mark whether the registrant is a large accelerated filer, an accelerated filer, a non-accelerated filer, or a smaller reporting company. See the definitions of “large accelerated filer,” “accelerated filer” and “smaller reporting company” in Rule 12b-2 of the Exchange Act.
Large Accelerated Filer x Accelerated Filer ¨ Non-Accelerated Filer ¨ Smaller Reporting Company ¨
Indicate by check mark whether the registrant is a shell company (as defined in Rule 12b-2 of the Exchange Act). Yes ¨ No x
The aggregate market value of the voting stock of the registrant held by non-affiliates of the registrant on March 28, 2009 was approximately $946,000,000 based upon the closing price of such stock on that date.
As of November 20, 2009, 43,656,266 shares of common stock of the registrant were outstanding.
DOCUMENTS INCORPORATED BY REFERENCE
Portions of the registrant’s definitive Proxy Statement for the 2010 Annual Meeting of Stockholders to be filed with the Securities and Exchange Commission pursuant to Regulation 14A not later than 120 days after the end of the fiscal year covered by this Form 10-K, are incorporated by reference in Part III, Items 10-14 of this Form 10-K.
GREEN MOUNTAIN COFFEE ROASTERS, INC,
Annual Report on Form 10-K
For
Fiscal Year Ended September 26, 2009
Table of Contents
PART I
Overview
Green Mountain Coffee Roasters, Inc. (together with its subsidiaries, the “Company” or “GMCR, Inc.”) is a leader in the specialty coffee and coffee maker businesses. We sell over 200 whole bean and ground coffee selections, cocoa, teas and coffees in K-Cup® portion packs, Keurig® single-cup brewers and other accessories. In recent years, a significant driver of the Company’s growth has been the sale of K-Cups and Keurig brewing systems. We manage our operations through two business segments, Specialty Coffee business unit (SCBU) formerly referred to as Green Mountain Coffee (GMC), and Keurig business unit (Keurig). See Note 9 of the Consolidated Financial Statements included in this Form 10-K.
SCBU sells whole bean and ground coffee selections, as well as K-Cups in domestic wholesale and retail channels and directly to consumers. In addition, SCBU sells Keurig single-cup brewing systems and other accessories directly to consumers and more recently to supermarkets.
Keurig is a pioneer and leading manufacturer of gourmet single-cup brewing systems and targets its premium patented single-cup brewing systems for consumers at home (AH) and away-from-home (AFH) mainly in North America. Keurig sells its AFH single-cup brewers to distributors for offices and its AH single-cup brewers to select retailers such as department stores and club stores for at-home use. Keurig sells coffee, tea and cocoa in K-Cups produced by a variety of roasters, including SCBU, and related accessories to select retailers such as department stores and club stores and also directly to consumers. Keurig earns royalty income from the sale of K-Cups shipped by its licensed roasters.
Corporate Information
Green Mountain Coffee Roasters, Inc. is a Delaware corporation formed in July 1993. Our corporate offices are located at 33 Coffee Lane, Waterbury, Vermont 05676. The main telephone number is (802) 244-5621, and our e-mail address for investor information isinvestor.services@gmcr.com. The address of our Company’s website iswww.GMCR.com.
Corporate Objective and Philosophy
Our Company’s objective is to be a leader in the coffee business by selling high-quality, premium coffee and innovative coffee brewing systems that consistently provide a superior coffee experience. Essential elements of our philosophy and approach include:
High-Quality Coffee.From tree to cup. We are passionate about roasting great coffees and are committed to ensuring that our customers have an outstanding coffee experience. We buy some of the highest-quality Arabica beans available from the world's coffee-producing regions and use a roasting process designed to optimize each coffee’s individual taste and aroma.
Single-Cup Brewing Patented Technology. Our patented single-cup brewing technology, embodied in a premium quality machine, provides coffee and tea drinkers with the benefits of convenience, variety and great taste. Single-cup systems are designed to provide consumers consistent taste, convenience and speed with no mess or coffee waste. The Keurig gourmet single-cup system is based on three fundamental elements:
| | • | | Patented and proprietary K-Cup® portion packs, which contain precisely portioned amounts of gourmet coffees, cocoa and teas in a sealed, low oxygen environment to ensure freshness. |
| | • | | Specially designed proprietary high-speed packaging lines that manufacture K-Cups at the coffee roasters’ facilities using freshly-roasted and ground coffee (or tea or cocoa). |
1
| | • | | Premium quality brewers that precisely control the amount, temperature and pressure of water to provide a cup of coffee, tea or cocoa of a consistent high quality in less than a minute when used with K-Cups. |
The Company holds 33 U.S. and 73 international patents covering a range of its portion pack, packaging line and brewing technology innovations, with additional patent applications in process. In 1998, Keurig launched its first single-cup brewers for the AFH channel and partnered with the Company to manufacture and sell Keurig’s patented K-Cups. Since then Keurig has licensed several other coffee roasters to package gourmet coffees and teas into K-Cups, all of whom pay royalties to Keurig based on the number of K-Cups shipped.
Through K-Cups, we offer the industry’s widest selection of gourmet branded coffees and teas in a proprietary single-cup format. Consumers can choose from over a dozen gourmet brands and over 200 varieties of coffees and teas. Brands which are packaged and sold by SCBU include Green Mountain Coffee®, our co-branded Newman’s Own® Organics brands, our licensed Caribou®and Celestial Seasonings™ brands, and as of March 27, 2009, our Tully’s® Coffee brand. Additionally, as of November 13, 2009, the Company acquired the Timothy’s World Coffee® brand and the licensed Emeril’s brand, which will be packaged and sold by the SCBU segment during fiscal 2010. Keurig partners with other North American K-Cup brands that include Diedrich, Gloria Jean’s and Coffee People, Van Houtte, Bigelow and Twinings.
Customer Service and Distribution.The Company seeks to create customers for life. We believe that coffee is a convenience purchase, and we utilize our multi-channel distribution network of wholesale, retail and consumer direct to make our coffee and single-cup Keurig® brewers widely and easily available to both AH and AFH consumers.
Our operations are coordinated from our headquarters in Waterbury, Vermont and supplemented by regional distribution centers located in Maine, Upstate New York, Massachusetts, Connecticut and Tennessee. Distribution facilities are designed to be located within a two-hour radius of most customers to expedite delivery. In recent years, we have added a packaging and warehousing facility in Essex, Vermont, purchased our manufacturing facility in Knoxville, Tennessee, and expanded our manufacturing and distribution facilities to Seattle, Washington. As part of the Timothy’s acquisition on November 13, 2009, we have added a manufacturing facility in Toronto, Canada.
Socially Responsible Business Practices.We have a long history of supporting social and environmental causes, allocating at least 5% of our pretax income towards such projects. These projects typically involve direct or indirect financial support, donations of products or equipment, and employee volunteer efforts.
Corporate Culture. Our Code of Ethics is an important part of our culture and is applicable to all of our employees and our Board of Directors. The Code of Ethics is posted on our website. In addition, we believe the Company has a highly inclusive and collaborative work environment that encourages employees' individual growth and personal awareness through a culture of personal accountability and continuous learning.
The Products
Coffee
The Company offers high-quality Arabica bean coffee including single-origin, Fair Trade Certified™, organic, flavored, limited edition and proprietary blends sold under the Green Mountain Coffee®, Tully’s® Coffee, Newman’s Own® Organics and, since November 13, 2009, the Timothy’s World Coffee® brands. We carefully select our coffee beans andappropriately roast the coffees to optimize their taste and flavor differences. Our coffee comes in a variety of package types including whole bean, fractional packages (for food service and office environments), and single-cup Keurig K-Cup® portion packs. In addition to coffee, we also sell cocoa and teas in K-Cups. The Company has an exclusive licensing agreement with Celestial Seasonings to produce Celestial Seasonings™ branded teas and Perfect Iced Tea in K-Cups.
2
In fiscal 2009, approximately 30% of SCBU’s total consolidated sales volume was from Fair Trade Certified coffee.
Brewers
We are a leader in selling patented and proprietary single-cup coffee and tea brewing systems under the Keurig® brand name to the AFH and AH channels. Keurig offers a brewer line-up that is differentiated by channel and size of customer, for the AFH channel, and by features of the brewer for the AH channel. Keurig also offers a selection of brewers for the hospitality, wholesale club and consumer direct channel, and a brewer specifically designed for travel.
Marketing and Distribution
To better support customer acquisition and existing customer growth, the Company has separate sales organizations for AFH, AH and consumer direct. Consumer direct provides us the opportunity to effectively position our brands by test-marketing new products, building one-on-one relationships, and having direct correspondence with consumers, all of which gives us the ability to illuminate the Company’s points of difference. The Company’s primary geographic region is North America.
SCBU publishes catalogs and maintains a website to market and sell over 200 coffee varieties, coffee-related equipment and accessories, gift assortments, hand-crafted items from coffee-source countries and Vermont, and gourmet food items covering a wide range of price points. We encourage customers to become members of our “Café EXPRESS” service, a continuity program with customized standing orders for automatic re-shipment. Over the past couple of years, a large portion of our efforts in the consumer direct channel has been directed towards increasing traffic on our website (www.GMCR.com) and marketing of the Keurig single-cup brewers. These efforts, along with the catalog and direct mail programs, are intended to build brand awareness nationwide and boost direct sales to consumers in our less mature geographic regions.
In the U.S. and Canada, Keurig operates in both the AFH and AH segments. In AFH, Keurig targets the office coffee channel with a broad offering of single-cup brewing systems which significantly upgrade the quality of the coffee served in the workplace. Keurig promotes its AFH brewing system through a large, selective but non-exclusive network of AFH distributors in the U.S. and Canada ranging in size from local to regional to national. In AH, Keurig targets gourmet coffee drinkers who wish to enjoy the speed and convenience of single-cup brewing but who do not want to compromise on taste. Keurig promotes its AH brewing system through upscale specialty and department store retailers, select wholesale clubs and mass merchants, on its website (www.keurig.com), through select supermarkets, and through its licensed roasters and authorized AFH distributors. Keurig relies on a single order fulfillment company, MBlock & Sons, to process the majority of orders for our AH single-cup business sold through retailers.
Growth Strategy
In recent years, the primary growth in the coffee industry has come from the specialty coffee category, including demand for single-cup specialty coffee. This growth has been driven by the wider availability of high-quality coffee, the emergence of upscale coffee shops throughout the country, and the general level of consumer knowledge of, and appreciation for, coffee quality. The Company has been benefiting from the overall industry trend plus what we believe to be our carefully developed and distinctive advantages over our competitors.
We are focused on building our brands and profitably growing our business. We believe we can continue to grow sales by increasing customer awareness in existing regions, expanding into new geographic regions, expanding sales in high-growth industry segments such as single-cup coffee and tea, and selectively pursuing other opportunities, including strategic acquisitions.
3
Our growth strategy for Keurig involves developing and managing marketing programs to sell as many brewers as possible to generate ongoing demand for K-Cups®. In addition, we are focused on partnering with other gourmet coffee roasters and tea packers with strong national/regional brands to create additional K-Cup products that will help create consumer demand for the Keurig® single-cup brewing system. When used with the Keurig brewers, K-Cups are designed to provide brewed coffee, tea and cocoa that consistently deliver the taste profiles specified by gourmet roasters and tea packers, which we believe creates attractive opportunities for our roaster partners to expand their geographical presence and take advantage of new industry opportunities in both the AFH and AH single-cup industry segments with minimal investment. Only roasters and other vendors licensed by the Company may benefit from Keurig's technology and distribution network.
In March 2009, we completed the acquisition of the Tully’s® Coffee brand and certain assets of its wholesale business. Tully’s wholesale business division distributes handcrafted coffees and related products via office coffee services, food service distributors, and over 5,000 supermarkets located primarily in the western states. The geographic region encompassed by the Tully’s brand creates an advantaged opportunity for the Company to accelerate growth in the west coast region by capitalizing on Tully’s brand recognition and the loyalty of their customer base. On November 13, 2009, we acquired Timothy’s World Coffee® brand and wholesale business. Headquartered in Toronto, Canada, Timothy’s is a premium coffee company that produces specialty coffee, tea and other beverages predominantly in K-Cup portion packs. The acquisition of Timothy’s will enable geographic expansion with a Canadian brand platform that includes manufacturing and distribution synergies. In addition, we have submitted a proposal to acquire Diedrich Coffee, Inc. which, if successful, we believe would enable us to more effectively reach consumers in the southern California region and take advantage of manufacturing and distribution synergies in that region.
Competition
The specialty coffee segment of the coffee industry is highly competitive and fragmented. Within it we compete against larger companies that possess greater marketing and operating resources than our Company. The primary methods of competition in specialty coffee include price, service, product performance and brand differentiation. Our Company competes against all sellers of specialty coffee, including Dunkin’ Donuts®, Peet’s® and Starbucks®. When selling to supermarkets, we also compete with “commercial” coffee roasters, to the extent that we are also trying to “upsell” consumers into the specialty coffee segment. Some multi-national consumer goods companies have divisions or subsidiaries selling specialty coffees. For example, The J.M. Smucker Company distributes both Folgers® and premium Millstone® and Brothers™ brands, as well as Dunkin’ Donuts packaged coffees by license. Nestle S.A. markets the premium Nespresso® single-cup espresso system as well as other less premium coffee brands. When selling direct to consumers, we compete with established roasters such as Gevalia®, a division of Kraft Foods, Inc., as well as with other direct mail companies. In foodservice, we compete against private label roasters, as well as brands such as Seattle’s Best Coffee® and Starbucks®.
Similar to specialty coffee, the coffeemaker industry is also highly competitive and we compete against larger companies that possess greater marketing and operating resources than the Company. The primary methods of competition are essentially the same as in specialty coffee; price, product performance and brand differentiation. Through the Keurig segment, our Company also competes against all sellers of coffeemakers, including companies such as Bunn-O-Matic Corporation and Mars, Inc. (through its FLAVIA® unit) for AFH customers and companies such as Conair, Inc., Jarden Corporation, Phillips Electronics NV and Robert Bosch GmbH for AH customers. Specifically, the Company also competes within the small but growing single-cup segment of the coffeemaker industry with other single-cup coffee and tea delivery systems, including: FLAVIA® Beverage Systems (manufactured and marketed by Mars, Inc.), the TASSIMO beverage system (manufactured and marketed by Robert Bosch GmbH and Kraft Foods, Inc.), the SENSEO® brewing system (manufactured and marketed by Philips Electronics NV and Sara Lee Corporation) and a number of additional single-cup pod brewing systems and brands.
4
SCBU was the first roaster to sell coffee in Keurig’s innovative single-cup brewing system, and we have established a leadership position in the sale of K-Cup® portion packs. Other coffee roasters and specialty tea suppliers also participate in the proprietary Keurig® system, including: Diedrich Coffee, Inc., (which include the Diedrich Coffee, Gloria Jean’s Coffees and Coffee People brands), Timothy’s Coffees of the World, Inc., (which includes the Emeril’s Coffee brand), Van Houtte, Inc., R.C. Bigelow, Inc. and R. Twinings and Company Limited. As of November 13, 2009, the Company acquired the Timothy’s World Coffee® brand and the licensed Emeril’s brand, which will be included in the SCBU family of brands in fiscal 2010. While to some extent these brands compete against our own Green Mountain Coffee®, Tully’s Coffee® and co-branded Newman’s Own® Organics brands or our licensed Caribou® and Celestial Seasonings™ branded K-Cups, they are subject to a royalty, which is paid to us for each K-Cup shipped.
We expect competition in these segments to remain intense, both within our existing customer base and as we expand into new regions. In both business segments, we compete primarily by providing high-quality coffee and single-cup coffeemakers, easy access to our products, superior customer service and a comprehensive approach to customer relationship management. We believe that our ability to provide a convenient and broad network of outlets from which to purchase our products is an important factor in our ability to compete. Through our multi-channel distribution network of wholesale, retail and consumer direct operations, with particular emphasis for SCBU on brand trial through K-Cups, we believe we differentiate ourselves from many of our larger competitors, who specialize in only one primary channel of distribution. We also believe that SCBU’s product offering is distinctive because we offer a wide array of coffees, including flavored, Fair Trade Certified™, and organic coffees. Green Mountain Coffee also offers products that feature licensed brand partnerships, including Newman’s Own Organics, Celestial Seasonings and Caribou. Within Keurig, we believe our constant innovation and focus on quality, all directed to delivering a consistently superior cup of coffee, differentiates us among competitors in the single-cup coffeemaker industry. We also seek to differentiate ourselves through our socially- and environmentally-responsible business practices. While our Company believes we currently compete favorably with respect to all of these factors, there can be no assurance that we will be able to compete successfully in the future.
Green Coffee Cost and Supply
SCBU sold approximately 40 million pounds of coffee in fiscal 2009. We utilize a combination of outside brokers and direct relationships with farms, estates, cooperatives and cooperative groups for our supply of green coffees. Outside brokers provide the largest supply of our green coffee. The supply and price of coffee are subject to high volatility. Supply and price of all coffee grades are affected by multiple factors, such as weather, pest damage, politics and economics in the producing countries.
Cyclical swings in commodity markets are common and the most recent years have been especially volatile for the “c” price of coffee (the price per pound quoted by the Coffee, Sugar and Cocoa Exchange). The “c” price of coffee declined during fiscal 2009, consistent with most other commodity markets, as compared to fiscal 2008 when “c” prices had reached record levels for the 5-year historical period. It is expected that coffee prices will remain volatile in the coming years. In addition to the “c” price, coffee of the quality sought by us tends to trade on a negotiated basis at a substantial premium or “differential” above the “c” price. These differentials also are subject to significant variations and have generally been on the rise in recent years.
For coffees that SCBU purchases with differentials above the “c” price of coffee, we generally fix the price of our coffee contracts for approximately two fiscal quarters, and at times three fiscal quarters, prior to delivery so that we can adjust our sales prices to marketplace conditions. SCBU believes this approach is the best way to provide our customers with a fair price for our coffee. On September 26, 2009, we had approximately $90.8 million in green coffee purchase commitments, of which approximately 46% had a fixed price. In addition, from time to time we purchase coffee futures contracts and coffee options when we are not able to enter into coffee purchase commitments or when the price of a significant portion of committed contracts has not been fixed. On September 26, 2009, we held futures contracts covering approximately 1.1 million pounds of coffee.
5
In fiscal 2009, 33% of our purchases were from Fair Trade certified sources. This provides an assurance that the organized farmer groups are receiving the Fair Trade minimum price and the group is a democratically managed cooperative. In fiscal 2009, 41% of our purchases were from farm-identified sources, which means that we know the farms, estates or coops, and can develop a relationship directly with the farmers. We believe that our “farm-identified” strategy helps us secure long-term supplies of high-quality coffee.
Intellectual Property
The Company owns a number of United States trademarks and service marks that have been registered with the United States Patent and Trademark Office. We anticipate maintaining our trademark and service mark registrations with the United States Patent and Trademark Office. We also own other trademarks and service marks for which we have applications for U.S. registration. The Company has further registered or applied for registration of certain of its trademarks and service marks in the United Kingdom, the European Union, Canada, Japan, the People's Republic of China, South Korea, Taiwan and other foreign countries. The Company has licenses to use other marks, all subject to the terms of the agreements under which such licenses are granted.
The Company holds 33 U.S. patents and 73 international patents related to our Keurig® brewing and portion pack technology. Of these, 86 are utility patents and 20 are design patents. We view these patents as very valuable but do not view any single patent as critical to the Company’s success. We own patents that cover significant aspects of our products and certain patents of ours will expire in the future. The two principal patents associated with our current generation K-Cup® portion packs will expire in 2012, and we have pending patent applications associated with this technology which, if ultimately issued as patents, would have expiration dates extending to 2023. Our agreements with our roasters are more than simple patent licenses. Roasters with agreements with the Company have access to and benefit from Keurig’s technology and distribution network and we believe these benefits will help us to maintain royalty revenue irrespective of our patent status.
We have diligently protected intellectual property through the use of domestic and international patents and trademark registrations. We regularly monitor commercial activity in the countries in which we operate to guard against potential infringement. In January 2007, we filed a patent infringement lawsuit against Kraft Foods, Inc., Kraft Foods Global, Inc. and Tassimo Corporation (collectively “Kraft”) in the United States District Court for the District of Delaware asserting that Kraft’s T DISC single-serve beverage cartridges infringe upon Keurig’s United States Patent number 6,607,762. In October 2008, we entered into a Settlement and License Agreement to completely settle the patent litigation with Kraft. Pursuant to the terms of the Settlement and License Agreement, Kraft paid $17 million on October 31, 2008 to the Company and Keurig has granted to Kraft and its affiliates a limited, non exclusive, perpetual, worldwide, fully paid up license of Keurig’s United States Patents Numbered 6,607,762 (the “762 Patent”) and 7,377,162 (the “162 Patent”), and United States and foreign counterpart patents connected to the 762 Patent or 162 Patent, for use in connection with the manufacture, distribution and sale of beverage brewing machines and certain beverage filter cartridges.
Seasonality
Historically, we have experienced variations in sales from quarter-to-quarter due to the holiday season and a variety of other factors, including, but not limited to, general economic trends, the cost of green coffee, competition, marketing programs and weather. Because of the seasonality of our business, results for any quarter are not necessarily indicative of the results that may be achieved for the full fiscal year.
Employees
As of September 26, 2009, the Company had 1,499 full-time employees and 18 part-time employees. We supplement our workforce with temporary workers from time to time, especially in the first quarter of each fiscal year to service increased customer and consumer demand during the peak November-December holiday season.
6
Available information
Our Company files annual, quarterly, and current reports, proxy statements, and other documents with the Securities and Exchange Commission (SEC) under the Securities Exchange Act of 1934 (the “Exchange Act”). The public may read and copy any materials that the Company files with the SEC at the SEC’s Public Reference Room at 100 F Street, NE, Washington, DC 20549. The public may obtain information on the operation of the Public Reference Room by calling the SEC at 1-800-SEC-0330. Also, the SEC maintains an Internet website that contains reports, proxy and information statements, and other information regarding issuers, including GMCR, Inc., that file electronically with the SEC. The public can obtain any documents that we file with the SEC atwww.sec.gov.
Our Company maintains a website atwww.GMCR.com. Our filings with the SEC, including without limitation, our annual reports on Form 10-K, quarterly reports on Form 10-Q and current reports on Form 8-K, are available through a link maintained on our website under the heading “Investor Services—Stock Quotes and Filings.” Information contained on our website is not incorporated by reference into this report.
Risks Related to the Company’s Business
The Company’s business, its future performance and forward-looking statements are affected by general industry and market conditions and growth rates, general U.S. and non-U.S. economic and political conditions (including the global economy), competition, interest rate and currency exchange rate fluctuations and other events. The following items are representative of the risks, uncertainties and other conditions that may impact our business, future performance and the forward-looking statements that we make in this report or that we may make in the future.
Risks Related to Our Operations
Our financial performance is highly dependent upon the sales of K-Cup® portion packs.
A significant and increasing percentage of our total revenue has been attributable to royalties and other revenue from sales of K-Cups for use with our Keurig® single-cup brewing systems. In fiscal 2009, total consolidated net sales of K-Cups, Keurig brewers and royalties earned upon shipment of K-Cups by licensed roasters represent approximately 81% of consolidated net sales. Continued acceptance of Keurig single-cup brewing systems and sales of K-Cups to our installed base of brewers are significant factors in our growth plans. Any substantial or sustained decline in the acceptance of Keurig single-cup brewing systems or sales of our K-Cups would materially adversely affect us. Keurig’s single cup brewing system competes against all sellers of coffeemakers, including companies such as Bunn-O-Matic Corporation, Mars, Inc., Jarden Corporation, Conair, Inc., Phillips Electronics NV and Robert Bosch GmbH. The Company also competes within the small but growing single-cup segment of the coffeemaker industry with other single-cup coffee and tea delivery systems, including: FLAVIA® Beverage Systems (manufactured and marketed by Mars, Inc.), the TASSIMO beverage system (manufactured and marketed by Robert Bosch GmbH and Kraft Foods, Inc.), the SENSEO® brewing system (manufactured and marketed by Philips Electronics NV and Sara Lee Corporation) and a number of additional single-cup pod brewing systems and brands. If we do not succeed in effectively differentiating ourselves from our competitors, based on technology or otherwise, or our competitors adopt our strategies, then our competitive position may be weakened and our sales of Keurig single-cup brewing systems and K-Cups, and accordingly our profitability, may be materially adversely affected.
Our intellectual property may not be valid, enforceable, or commercially valuable.
While we make efforts to develop and protect our intellectual property, the validity, enforceability and commercial value of our intellectual property rights may be reduced or eliminated by the discovery of prior inventions by third parties, the discovery of similar marks previously used by third parties, the successful
7
independent development by third parties of the same or similar confidential or proprietary innovations or changes in the supply or distribution chains that render our rights obsolete.
Many factors bear upon the exclusive ownership and exploitation right to intellectual properties, including, without limitation, prior rights of third parties, nonuse and/or nonenforcement by us, and/or related entities. Our ability to compete effectively depends, in part, on our ability to maintain the proprietary nature of our technologies, which include the ability to obtain, protect and enforce patents and other trade secrets and know how relating to our technology. We own patents that cover significant aspects of our products, and certain patents of ours will expire in the near future. In the United States, we have patents expiring between 2012 and 2017 associated with the K-Cup portion packs presently used in Keurig brewers. We also have pending patent applications associated with current K-Cup® portion packs technology. These applications may not issue, or if they issue, they may not be enforceable, may be challenged, invalidated or circumvented by others. Additionally, we have a number of portion pack patents that extend to 2021 but which we have elected not to commercialize yet and may never commercialize. In addition, Keurig continues to invest in further innovation in portion packs and brewing technology and takes steps it believes are appropriate to protect all such innovation. We are prepared to protect our patents vigorously; however, there can be no assurance that we will prevail in any intellectual property infringement litigation we institute to protect our intellectual property rights given the complex technical issues and inherent uncertainties in litigation. Even if we prevail in litigation, such litigation could result in substantial costs and diversion of resources and could materially adversely affect us. In addition, the validity, enforceability and value of our intellectual property depends in part on the continued maintenance and prosecution of such rights through applications, maintenance documents, and other filings, and rights may be lost through the intentional or inadvertent failure to make such necessary filings. Similarly, third parties may allege that our activities violate their intellectual properties. To the extent we are required to defend our self against such a claim, no assurance can be given that we will prevail. Such defense could be costly and materially adversely affect our business and prospects.
Competition in specialty coffee is intense and could affect our sales and profitability.
The specialty coffee business is highly fragmented. Competition in specialty coffee is increasingly intense as relatively low barriers to entry encourage new competitors to enter the marketplace. In addition, we believe that maintaining and developing our brands, including Green Mountain Coffee®, Keurig® and Tully’s Coffee® and our licensed co-branded Newman’s Own Organic® coffees, are important to our success and that the importance of brand recognition may increase to the extent that competitors offer products similar to ours. Many of our current and potential competitors have substantially greater financial, marketing and operating resources and access to capital than we do. Our primary competitors in specialty coffee include Dunkin’ Donuts, New England Coffee Company, Peet’s Coffee & Tea, Starbucks Corporation, The J.M. Smucker Company (with the Millstone® brand and The Folgers Coffee Company subsidiary) and Kraft Foods, Inc. (with the Gevalia® Kaffe brand). There are numerous smaller, regional brands that also compete in the specialty coffee business. In addition, we compete indirectly against all other coffee brands in the marketplace. A number of nationwide coffee marketers, such as The Folgers Coffee Company (a subsidiary of The J.M Smucker Company), Kraft Foods, Inc., Nestlé USA, Procter & Gamble, Inc., and Sara Lee Corporation are distributing premium coffee brands in supermarkets. These premium coffee brands may serve as substitutes for our coffee. If we do not succeed in effectively differentiating ourselves from our competitors in specialty coffee, including by developing and maintaining our brands, or our competitors adopt our strategies, then our competitive position may be weakened and our sales of specialty coffee, and accordingly our profitability, may be materially adversely affected.
Because all of our single-cup brewers are manufactured by a single manufacturer in China, a significant disruption in the operation of this manufacturer or political unrest in China could materially adversely affect us.
We have only one manufacturer of single-cup brewers. Any disruption in production or inability of our manufacturer to produce adequate quantities to meet our needs, whether as a result of a natural disaster or other
8
causes, could significantly impair our ability to operate our business on a day-to-day basis. Furthermore, our manufacturer is located in China. This exposes us to the possibility of product supply disruption and increased costs in the event of changes in the policies of the Chinese government, political unrest or unstable economic conditions in China, or developments in the U.S. that are adverse to trade, including enactment of protectionist legislation. Any of these matters could materially adversely affect us.
Product recalls and/or product liability may adversely impact us.
We are subject to regulation by a variety of regulatory authorities, including the Consumer Product Safety Commission. In the event our manufacturer of single-cup brewers, which is located in China, does not adhere to product safety requirements or our quality control standards, we might not identify a deficiency before brewers ship to our customers. The failure of our third party manufacturer to produce merchandise that adheres to our quality control standards could damage our reputation and brands and lead to customer litigation against us. If our manufacturer is unable or unwilling to recall products failing to meet our quality standards, we may be required to remove merchandise or recall those products at a substantial cost to us. We may be unable to recover costs related to product recalls.
We may not be able to enter into license agreements with coffee roasters and other third parties to manufacture, distribute and sell K-Cups® or maintain our current license agreements, or it may be expensive to do so. In addition, our current licensees may fail to perform their obligations under existing licensing agreements.
We license the right to manufacture, distribute and sell K-Cups on an exclusive or non-exclusive basis to gourmet coffee roasters and tea packers in return for royalty payments from the licensees when they ship the K-Cups. Although many licensees are willing to enter into such licensing agreements, there can be no assurance that such agreements will be negotiated on terms favorable to us, or at all. In addition, our current licensees may fail to perform their obligations under such licensing agreements due to operational disruptions, economic hardship or bankruptcy. Our failure to enter into similar licensing agreements in the future or the failure of our licensees to perform their obligations under existing license agreements could limit our ability to develop and sell our products and could cause our business to suffer.
We also have an exclusive coffee license agreement with Newman’s Own® Organics. We produce a line of several co-branded Newman’s Own Organics coffees under the Newman’s Own Organics and Green Mountain Coffee® brand names. In addition, from time to time, we enter into licensing agreements to allow for the development, marketing and sale of single-cup brewing systems by other companies. We recently announced license and distribution agreements with Conair Corporation for the Mr. Coffee® brand and Jarden Corporation for the Cuisinart® brand. The failure to maintain these agreements could adversely impact our future growth.
Our increasing reliance on a limited number of specialty farms could impair our ability to maintain or expand our business.
Because an increasing amount of our supply of Arabica coffee beans comes from specifically identified specialty farms, estates, and cooperatives, we are more dependent upon a limited number of suppliers than some of our competitors. In fiscal 2009, approximately 41% of our green coffee purchases were “farm-identified”. The timing of these purchases is dictated by when the coffee becomes available (after the annual crop), which does not always coincide with the period in which we need green coffee to fulfill customer demand. This can lead to higher and more variable inventory levels. Any deterioration of our relationship with these suppliers, or problems experienced by these suppliers, could lead to inventory shortages. In such case, we may not be able to fulfill the demand of existing customers, supply new customers, or expand other channels of distribution. A raw material shortage could result in decreased revenue or could impair our ability to maintain or expand our business.
9
Our business is highly dependent on sales of specialty coffee, and if demand for specialty coffee decreases, our business would suffer.
Substantially all of our revenues are dependent on demand for specialty coffee. In addition, demand for specialty coffee is a driving factor in the sales of our Keurig® single-cup brewing systems. Demand for specialty coffee and demand for our Keurig single-cup brewing systems is affected by many factors, including:
| | • | | Changes in consumer tastes and preferences; |
| | • | | Changes in consumer lifestyles; |
| | • | | National, regional and local economic conditions; |
| | • | | Perceptions or concerns about the environmental impact of our products; |
| | • | | Demographic trends; and |
| | • | | Perceived or actual health benefits or risks. |
Because we are highly dependent on consumer demand for specialty coffee, a shift in consumer preferences away from specialty coffee or our product offerings would harm our business more than if we had more diversified product offerings. If customer demand for our specialty coffee decreases, our sales would decrease and we would be materially adversely affected.
Our roasting methods are not proprietary, so competitors may be able to duplicate them, which could harm our competitive position.
We consider our roasting methods essential to the flavor and richness of our coffee and, therefore, essential to our various brands. Because our roasting methods cannot be patented, we would be unable to prevent competitors from copying our roasting methods if such methods became known. If our competitors copy our roasting methods, the value of our brands could be diminished and we could lose customers to our competitors. In addition, competitors could develop roasting methods that are more advanced than ours, which could also harm our competitive position.
We depend on the expertise of key personnel. If these individuals leave or change their role within the Company without effective replacements, our operations could suffer.
The success of our business is dependent to a large degree on our President and Chief Executive Officer, Lawrence J. Blanford, and the other members of our management team. We have an employment agreement with Mr. Blanford that expires on May 3, 2012. If Mr. Blanford or the other members of our management team leave without effective replacements, our ability to implement our business strategy could be impaired.
We may be able to incur substantial additional indebtedness in the future, which could restrict our ability to operate our business.
We may be able to incur substantial additional indebtedness in the future. In addition, future disruptions in the financial markets, such as have been recently experienced, could affect our ability to obtain new or additional debt financing or to refinance our existing indebtedness on favorable terms (or at all), and have other adverse effects on us. We have a $225 million revolving credit facility. On June 29, 2009, we exercised our increase option in the form of a $50 million term loan, to be amortized at the rate of 10% annually, commencing on September 30, 2009. All borrowings under the credit agreement, including the outstanding balance under the term loan, are due on December 3, 2012. In addition, on June 29, 2009, we amended the credit facility to remove the capital expenditures limitation covenant and adjusted the definition of the fixed charge coverage ratio to modify the capital expenditures captured in the definition to 50% of unfinanced capital expenditures. As of September 26, 2009 approximately $50 million was outstanding under our term loan and $28 million was outstanding on our revolving line of credit under this credit facility. The incurrence of debt under our credit facility could adversely affect our business. Our debt obligations could:
| | • | | Increase our vulnerability to general adverse economic and industry conditions; |
10
| | • | | Require us to dedicate a substantial portion of our cash flow from operations to payments on our indebtedness, thereby reducing the availability of our cash flow for other purposes; |
| | • | | Impair our rights to our intellectual property, which have been pledged as collateral under our credit facility, upon the occurrence of a default; |
| | • | | Limit our flexibility in planning for, or reacting to, changes in our business and the industry in which we operate, thereby placing us at a competitive disadvantage compared to our competitors that may have less debt; and |
| | • | | Limit, by the financial and other restrictive covenants in our debt agreements, our ability to borrow additional funds and have a material adverse effect on us if we fail to comply with the covenants in our debt agreements because such failure could result in an event of default which, if not cured or waived, could result in a substantial amount of our indebtedness becoming immediately due and payable. |
A significant interruption in the operation of our roasting, manufacturing or distribution capabilities could materially adversely affect us.
We currently roast our coffee at three facilities: Waterbury, Vermont; Knoxville, Tennessee; and Seattle, Washington. In addition, as part of the Timothy’s acquisition on November 13, 2009, we added a fourth manufacturing facility in Toronto, Canada. We expect to be able to meet current and forecasted demand for the near term. However, if demand increases more than we currently forecast, we will need to either expand our current roasting capabilities internally or acquire additional roasting capacity and the failure to do so in a timely or cost effective manner could have a negative impact on our business. Significant interruption in the operation of our current facilities, whether as a result of a natural disaster or other causes, could significantly impair our ability to operate our business on a day-to-day basis.
In addition, we and other licensed coffee roasters manufacture the K-Cups® sold for use with our single-cup brewer systems. We manufacture K-Cups at our Vermont, Tennessee and Washington State facilities, and any significant disruption in our or our licensees ability to manufacture adequate quantities of K-Cups to meet our needs, whether as a result of a natural disaster or other causes, could adversely affect our business and financial results. We currently have three distribution facilities, one located adjacent to our roasting facility in Waterbury, Vermont, another located in Essex, Vermont and a third at our facility in Knoxville, Tennessee. Any disruption to our distribution facilities could significantly impair our ability to operate our business. In addition, because we have our coffee roasting and primary distribution facilities in Vermont, our ability to ship coffee and receive shipments of raw materials could be adversely affected during winter months as a result of severe winter conditions and storms.
Our order processing and fulfillment systems may fail or limit user traffic, which could cause us to lose sales.
We processes all customer orders through an order fulfillment facility in Waterbury, Vermont. We are dependent on our ability to maintain our computer and telecommunications equipment at this facility in effective working order and to protect against damage from fire, natural disaster, power loss, telecommunications failure or similar events. In addition, growth of our customer base may strain or exceed the capacity of our systems and lead to degradations in performance or systems failure. We have experienced capacity constraints in the past that have resulted in decreased levels of customer service, such as increased customer call center wait times and delays in service to customers for limited periods of time. Although we continually review and consider upgrades to our order fulfillment infrastructure and provide for system redundancies to limit the likelihood of systems overload or failure, substantial damage to our systems or a systems failure that causes interruptions for a number of days could adversely affect our business. Additionally, if we are unsuccessful in updating and expanding our order fulfillment infrastructure, our ability to grow may be constrained.
11
Our reliance on a single order fulfillment company for our Keurig subsidiary’s at home business exposes us to significant credit risk.
We rely on a single order fulfillment company, M.Block & Sons, Inc., to process the majority of orders for our At-Home (AH) single-cup business sold through retailers. We sell a significant number of brewers and K-Cups® to this third party fulfillment company for re-sale to certain retailers. Receivables from this company were approximately 51% of our consolidated accounts receivable balance at September 26, 2009. Accordingly, we are subject to significant credit risk regarding the creditworthiness of this company. The inability of this company to perform its obligations to us, whether due to a deterioration in its financial condition or otherwise, could result in significant losses that could materially adversely affect us. If our relationship with this company is terminated, we can provide no assurance that we would be able to contract with another third party to provide these services to use in a timely manner or on favorable terms.
Because we rely heavily on common carriers to deliver our coffee and brewers, any disruption in their services or increase in shipping costs could adversely affect our business.
We rely on a number of common carriers to deliver coffee and brewers to our customers and distribution centers. We have no control over these common carriers and the services provided by them may be interrupted as a result of labor shortages, contract disputes or other factors. If we experience an interruption in these services, we may be unable to ship our products in a timely manner. A delay in shipping could:
| | • | | Have an adverse impact on the quality of the coffee, hot cocoa or tea shipped, and thereby adversely affect our brands and reputation; |
| | • | | Result in the disposal of an amount of coffee, hot cocoa or tea that could not be shipped in a timely manner; and |
| | • | | Require us to contract with alternative, and possibly more expensive, common carriers. |
Any significant increase in shipping costs could lower our profit margins or force us to raise prices, which could cause our revenue and profitability to suffer.
Our acquisition of certain assets from Tully’s Coffee Corporation was completed on March 27, 2009, and our acquisition of the wholesale business of Timothy’s Coffee of the World, Inc., was completed on November 13, 2009 . The failure to successfully integrate Tully’s and Timothy’s wholesale businesses into our business may cause us to fail to realize the expected synergies, cost savings and other benefits expected from these acquisitions, which could significantly affect us.
The integration of these wholesale businesses into our business presents significant challenges and risks to our business, including:
| | • | | Distraction of management from regular business concerns; |
| | • | | Assimilation and retention of employees and customers of Tully’s and Timothy’s; |
| | • | | Managing the West Coast-based Tully’s wholesale operations and employees, both of which are distant from our current headquarters and operation locations; |
| | • | | Managing the Canadian-based Timothy’s wholesale operations and employees, both of which are distant from our current headquarters and operation locations; |
| | • | | Expansion into new geographies; |
| | • | | Integration of technologies, services and products; and |
| | • | | Achievement of appropriate internal control over financial reporting. |
We may fail to successfully complete the integration of these businesses into our business and, as a result, may fail to realize the synergies, cost savings and other benefits expected from these acquisitions. We may fail to
12
grow and build profits in the Tully’s or Timothy’s business lines or achieve sufficient cost savings through the integration of customer service or administrative and other operational activities. Furthermore, we must achieve these objectives without adversely affecting our revenues. If we are not able to successfully achieve these objectives, the anticipated benefits of these acquisitions may not be realized fully or at all, or it may take longer to realize them than expected, and our results of operations could be materially adversely affected.
Tully’s has a history of operating losses, and our ability to achieve and then maintain the profitability of its business lines will depend on our ability to manage and control operating expenses and to generate and sustain increased levels of revenue. Our expectation to achieve profitability from this business may not be realized, and losses on the Tully’s business may continue as we integrate its operations into our business.
Strategic investments or acquisitions may result in additional risks and uncertainties in our business.
We may seek to grow our business through opportunistic strategic investments or acquisitions. From time to time we may be in various stages of negotiation with parties relating to the possible investment in or acquisition of businesses or assets, including our current discussions with Diedrich Coffee, Inc. We are unable to predict whether our negotiations will result in any agreement to invest in or acquire a business or an asset or whether any such transaction will be consummated on favorable terms or at all. Additionally, we may pursue an acquisition that is not accretive initially due to its long term strategic value.
In addition, to the extent we are successful in completing one or more opportunistic strategic investments or acquisitions, we would face numerous risks and uncertainties integrating the relevant businesses and systems, including the need to combine accounting and data processing systems and management controls and to retain relationships with customers and business partners.
Due to the seasonality of many of our products and other factors, our operating results are subject to quarterly fluctuations.
Historically, we have experienced increased sales of our Keurig® single-cup brewing systems in our first fiscal quarter due to the holiday season. Because of the seasonality of our business, results for any quarter are not necessarily indicative of the results that may be achieved for the full fiscal year. The impact on sales volume and operating results due to the timing and extent of these factors can significantly impact our business. For these reasons, quarterly operating results should not be relied upon as indications of our future performance.
Risks Related to our Industry
Increases in the cost of high-quality Arabica coffee beans or cost of materials used to produce our brewers could reduce our gross margin and profit.
We utilize a combination of outside brokers and direct relationships with farms, estates, cooperatives and cooperative groups for our supply of green coffees. Outside brokers provide the largest supply of our green coffee. The supply and price of coffee are subject to high volatility. Although most coffee trades in the commodity market at a price referred to as the “c” price (the price per pound quoted by the Coffee, Sugar and Cocoa Exchange), coffee of the quality we are seeking tends to trade on a negotiated basis at a substantial premium or “differential” above the “c” price, depending upon the supply and demand at the time of purchase. Supply and price can be affected by multiple factors, such as weather, pest damage, politics and economics in the producing countries.
Cyclical swings in commodity markets are common and the most recent years have been especially volatile for the “c” price of coffee. The “c” price of coffee declined during fiscal 2009, consistent with most other commodity markets, as compared to fiscal 2008 when “c” prices had reached record levels for the 5-year historical period. It is expected that coffee prices will remain volatile in the coming years. In addition to the “c”
13
price, coffee of the quality sought by us tends to trade on a negotiated basis at a substantial premium or “differential” above the “c” price. These differentials also are subject to significant variations and have generally been on the rise in recent years.
We generally try to pass on coffee price increases and decreases to our customers. There can be no assurance that we will be successful in passing on these cost increases to customers without losses in sales volume or gross margin. Additionally, even if higher green coffee costs can be offset on a dollar-for-dollar basis by price increases, this still lowers our gross margin as a percentage of sales. Similarly, rapid and sharp decreases in the cost of green coffee could also force us to lower sales prices before realizing cost reductions in our green coffee inventory and purchase commitments.
Significant fluctuations in the cost of other commodities, such as steel, petroleum and copper influence prices of plastic and other components used in manufacturing our coffee brewers. Approximately 96% of Keurig brewers shipped in fiscal 2009, were sold to the AH channel at our cost with essentially no gross margin. With respect to the Keurig single-cup AH system, we are continuing to pursue a model designed to penetrate the marketplace, a component of which is to sell brewers and accessories essentially at cost, and are focused on driving new customers into single serve coffee. Any rapid, sharp increases in our cost of manufacturing AH brewers would be unlikely to lead us to raise sales prices to offset such increased cost as our current strategy is to drive penetration and not risk slowing down the rate of sales growth to competitors or before realizing cost reductions in our purchase commitments. There can be no assurance that we will able to maintain our gross margin when such fluctuations occur.
Decreased availability of high-quality Arabica coffee beans could jeopardize our ability to maintain or expand our business.
We roast over 40 different types of green coffee beans to produce more than 100 coffee selections. If one type of green coffee bean were to become unavailable or prohibitively expensive, we believe we could substitute another type of coffee of equal or better quality meeting a similar taste profile. However, a worldwide supply shortage of the high-quality Arabica coffees we purchase could have a material adverse impact on us.
Worldwide or regional shortages of high-quality Arabica coffees can be caused by multiple factors, such as weather, pest damage and economics in the producing countries. In addition, the political situation in many of the Arabica coffee growing regions, including Africa, Indonesia, and Central and South America, can be unstable, and such instability could affect our ability to purchase coffee from those regions. If Arabica coffee beans from a region become unavailable or prohibitively expensive, we could be forced to discontinue particular coffee types and blends or substitute coffee beans from other regions in our blends. Frequent substitutions and changes in our coffee product lines could lead to cost increases, customer alienation and fluctuations in our gross margins.
While production of commercial grade coffee is generally on the rise, many industry experts are concerned about the ability of specialty coffee production to keep pace with demand. Arabica coffee beans of the quality we purchase are not readily available on the commodity markets. We depend on our relationships with coffee brokers, exporters and growers for the supply of our primary raw material, high-quality Arabica coffee beans. In particular, the supply of Fair Trade Certified™ coffees is limited. We may not be able to purchase enough Fair Trade Certified coffees to satisfy the rapidly increasing demand for such coffees, which could impact our revenue growth.
The recent adverse changes in global and domestic economic conditions or a worsening of the United States economy could materially adversely affect us.
Our revenues and performance depend significantly on consumer confidence and discretionary spending, which have recently deteriorated due to current worldwide economic conditions. This economic downturn and decrease in consumer spending may adversely impact our revenues, ability to market our products, build customer loyalty,
14
or otherwise implement our business strategy and further diversify the geographical concentration of our operations. For example, we are highly dependent on consumer demand for specialty coffee and a shift in consumer demand away from specialty coffee due to economic or other consumer preferences would harm our business. Keurig brewer sales may also decline as a result of the economic environment. We also have exposure to various financial institutions under coffee hedging arrangements and interest rate swaps, and the risk of counterparty default is currently higher in light of existing capital market and economic conditions.
Our products must comply with government regulation.
The USDA adopted regulations with respect to a national organic labeling and certification program which became effective in February 2001, and fully implemented in October 2002. Amendments to Canada’s Organic Products regulations as administered by the Canada Organic Office of the Canadian Food Inspection Agency became effective in December 2008. Although the implementation period has not yet been defined, we will be required to apply for recertification of our organic products under the new regulations and update any affected packaging. In addition, similar regulations and requirements exist in the other countries in which we may market our products. Our organic products are covered by these various regulations. Future developments in the regulation of labeling of organic foods could require us to further modify the labeling of our products, which could affect the sales of our products and thus harm our business.
Furthermore, new government laws and regulations may be introduced in the future that could result in additional compliance costs, seizures, confiscations, recalls or monetary fines, any of which could prevent or inhibit the development, distribution and sale of our products. If we fail to comply with applicable laws and regulations, we may be subject to civil remedies, including fines, injunctions, recalls or seizures, as well as potential criminal sanctions, which could have a material adverse effect on us.
We rely on independent certification for a number of our products, the loss of any of which could harm our business.
We rely on independent certification, such as certifications of our products as “organic” or “fair trade,” to differentiate our products from others. The Newman’s Own® Organics product line, combined with the Specialty Coffee business unit’s own branded Fair Traded Certified™ coffee line, represented a combined 30% of the Specialty Coffee business unit’s total consolidated sales volume in fiscal year 2009. The loss of any independent certifications could adversely affect our marketplace position, which could harm our business.
We must comply with the requirements of independent organizations or certification authorities in order to label our products as certified. For example, we can lose our “organic” certification if a manufacturing plant becomes contaminated with non-organic materials or if it is not properly cleaned after a production run. In addition, all raw materials must be certified organic.
| Item 1B. | Unresolved Staff Comments |
None.
SCBU owns a 72,000 square foot warehousing and distribution facility adjacent to our manufacturing plant in Waterbury, Vermont. The land underneath this facility is leased and the lease for the land expires in 2024.
The Company owns a manufacturing and warehousing facility located in Knoxville, Tennessee. The facility has approximately 334,500 square feet of usable space.
15
Our other facilities, all of which are leased, are as follows:
| | | | | | |
Type | | Location | | Approximate
Square Feet | | Expiration
of Lease |
SCBU Manufacturing Space | | Essex, VT Sumner, WA Waterbury, VT | | 99,000
197,800 98,000 | | 2012
2015 2017 |
| | | |
SCBU Warehouse/Distribution/Service/Retail Space | | Wilmington, MA Southington, CT Demeritt Place (I), Waterbury, VT
112 Main Street, Waterbury, VT
Waterbury, VT (Factory Outlet)
Waterbury, VT (Visitor Center)
Biddeford, ME
Latham, NY
Marshall Avenue, Williston, VT | | 17,500 11,200 12,000
3,000
2,000 2,900 10,000
7,500 70,500 | | 2013
2011
2010
2010
2010
2026 2011 2013 2012 |
| | | |
SCBU Administrative and Corporate Offices | | Coffee Lane, Waterbury, VT
Demeritt Place (II), Waterbury,VT 46 Main Street, Waterbury, VT
152 Main Street, Waterbury, VT
Pilgrim Park II, Waterbury, VT
Pilgrim Park V, Waterbury VT
5 New England, Essex, VT | | 3,000
10,00010,900 9,600 22,900 15,000 10,000 | | 2010
2010
2011
20182011 2016 2013 |
| | | |
Keurig Administrative Offices | | Reading, MA
Woburn, MA | | 72,000
7,600 | | 2015
2010 |
In addition to the locations listed above, the Company has inventory at various locations managed by third party warehouses and order fulfillment companies.
We believe our facilities are generally adequate for our current needs and for the remainder of fiscal 2010.
None.
| Item 4. | Submission of Matters to a Vote of Security Holders |
No matters were submitted to a vote of security holders during the fiscal quarter ended September 26, 2009.
16
Executive Officers of the Registrant
Certain biographical information regarding each executive officer of our Company is set forth below:
| | | | | | |
Name | | Age | | Position | | Officer
since |
Lawrence J. Blanford | | 56 | | President, Chief Executive Officer and Director | | 2007 |
Kathryn S. Brooks | | 54 | | Vice President, Human Resources and Organizational Development | | 2001 |
Howard Malovany | | 59 | | Vice President, Corporate General Counsel and Secretary | | 2009 |
R. Scott McCreary | | 50 | | Chief Operating Officer | | 2004 |
Frances G. Rathke | | 49 | | Vice President, Chief Financial Officer, and Treasurer | | 2003 |
Stephen J. Sabol | | 48 | | Vice President of Development | | 1993 |
Michelle V. Stacy | | 53 | | President of Keurig, Incorporated | | 2008 |
Lawrence J. Blanford has served as President, Chief Executive Officer and Director since May 2007. From May 2005 to October 2006, Mr. Blanford held the position of Chief Executive Officer at Royal Group Technologies Ltd., a Canadian building products and home improvements company. From January 2004 to May 2005, Mr. Blanford was Founder and President of Strategic Value Consulting, LLC, a consultancy.
Kathryn S. Brooks has served as Vice President of Human Resources and Organizational Development since April 2001. She was also a Director of the Company from March 2002 to September 2006.
Howard Malovanyhas served as Vice President, Corporate General Counsel and Secretary since February 2009. From 1996 to 2009, Mr. Malovany worked with the Wm. Wrigley Jr. Company, serving most recently as Senior Vice President, Secretary and General Counsel.
R. Scott McCrearyhas served as Chief Operating Officer of the Company since September 2004.
Frances G. Rathke has served as Vice President, Chief Financial Officer and Treasurer of the Company since October 2003.
Stephen J. Sabolhas served as Vice President of Development of the Company since October 2001.
Michelle V. Stacyhas served as President of Keurig, Incorporated since November 2008. From October 2007 to October 2008, Ms. Stacy served as Managing Partner of Archpoint Consulting, a professional services firm. From October 2005 to October 2007, Ms. Stacy was Vice President and General Manager of Global Professional Oral Care with Procter & Gamble. From 1983 to 2005, Ms. Stacy held various executive positions with The Gillette Company.
17
PART II
| Item 5. | Market for the Registrant’s Common Equity, Related Stockholder Matters and Issuer Purchases of Securities |
Price Range of Securities
The Company’s common stock trades on the NASDAQ Global Market under the symbol GMCR. The following table sets forth the high and low closing prices as reported by NASDAQ for the periods indicated as adjusted to reflect the three-for-two stock split effected on June 8, 2009.
| | | | | | |
| | | | | High | | Low |
Fiscal 2008 | | 13 weeks ended December 29, 2007 13 weeks ended March 29, 2008 13 weeks ended June 28, 2008 13 weeks ended September 27, 2008 | | $27.65
$27.75
$29.39
$26.83 | | $19.93
$16.83
$21.10
$21.65 |
Fiscal 2009 | | 13 weeks ended December 27, 2008 13 weeks ended March 28, 2009 13 weeks ended June 27, 2009 13 weeks ended September 26, 2009 | | $27.14
$32.65
$62.57
$70.44 | | $16.24
$22.13
$30.99
$55.61 |
Number of Equity Security Holders
As of November 23, 2009, the number of record holders of the Company’s common stock was 481.
Dividends
The Company has never paid a cash dividend on its common stock and anticipates that for the foreseeable future any earnings will be retained for use in its business and, accordingly, does not anticipate the payment of cash dividends.
Securities Authorized for Issuance Under Equity Compensation Plans
| | | | | | | |
Plan category | | Number of securities
to be issued upon
exercise of
outstanding options,
warrants and rights | | Weighted
average exercise
price of
outstanding
options, warrants
and rights | | Number of securities
remaining available for
future issuance under
equity compensation plans
(excluding securities
reflected in column (a)) |
| | | (a) | | (b) | | (c) |
Equity compensation plans approved by security holders | | 3,300,125 | | $ | 12.83 | | 1,087,028 |
| | | | | | | |
Equity compensation plans not approved by security holders(1) | | 628,475 | | $ | 13.34 | | — |
| | | | | | | |
Total | | 3,928,600 | | $ | 12.91 | | 1,087,028 |
| | | | | | | |
| (1) | Includes compensation plans assumed in the Keurig acquisition and inducement grants to Lawrence Blanford, Howard Malovany and Michelle Stacy. See Note 16 of the Consolidated Financial Statements included in this Form 10-K. |
18
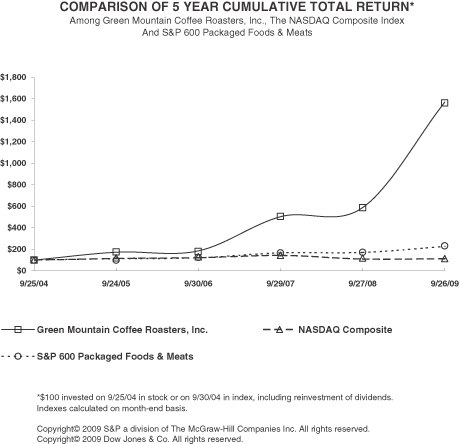
Performance graph
| Item 6. | Selected Financial Data |
The table below shows selected financial data for our last five fiscal years. Our fiscal year is based on a 52-week year for all years presented, except fiscal 2006 which was comprised of 53 weeks. There were no cash dividends paid during the past five fiscal years.
| | | | | | | | | | | | | | | | |
| | | Fiscal Years Ended |
| | | Sept. 26, 2009(1)(3) | | | Sept. 27, 2008(1) | | Sept. 29, 2007(1) | | Sept. 30, 2006(1) | | Sept. 24, 2005 |
| | | In thousands, except per share data |
Net sales | | $ | 803,045 | | | $ | 500,277 | | $ | 341,651 | | $ | 225,323 | | $ | 161,536 |
Income before equity in loss of Keurig, Incorporated | | $ | 55,882 | | | $ | 22,299 | | $ | 12,843 | | $ | 9,406 | | $ | 9,448 |
Net income | | $ | 55,882 | | | $ | 22,299 | | $ | 12,843 | | $ | 8,443 | | $ | 8,956 |
Net income per share—diluted | | $ | 1.39 | | | $ | 0.58 | | $ | 0.35 | | $ | 0.24 | | $ | 0.26 |
Total assets | | $ | 813,839 | | | $ | 357,648 | | $ | 264,527 | | $ | 234,006 | | $ | 91,147 |
Long-term debt | | $ | 73,013 | | | $ | 123,517 | | $ | 90,050 | | $ | 102,871 | | $ | 5,218 |
Stockholders’ equity | | $ | 590,174 | (2) | | $ | 139,520 | | $ | 99,099 | | $ | 74,940 | | $ | 60,392 |
| (1) | Fiscal 2009, 2008, 2007 and 2006 information presented reflects the acquisition of Keurig, Incorporated on June 15, 2006. |
| (2) | The fiscal 2009 stockholders’ equity balance reflects the impact of the August 12, 2009, equity offering. |
| (3) | Fiscal 2009 information presented reflects the acquisition of the wholesale business and certain assets of Tully’s Coffee Corporation. |
19
| Item 7. | Management’s Discussion and Analysis of Financial Condition and Results of Operations |
The following discussion and analysis is intended to help you understand the results of operations and financial condition of Green Mountain Coffee Roasters, Inc. (together with its subsidiaries, the “Company”). You should read the following discussion and analysis in conjunction with our consolidated financial statements and related notes included elsewhere in this report.
Overview
We are a leader in the specialty coffee and the overall coffee maker businesses. We roast premium, high-quality Arabica bean coffees and offer over 100 coffee selections, including single-origins, estates, certified organics, Fair Trade Certified™, proprietary blends, and flavored coffees that sell under the Green Mountain Coffee®,, Newman’s Own® Organics and, as of March 27, 2009, Tully’s® Coffee brands. Additionally, as of November 13, 2009, we acquired the Timothy’s World Coffee® brand. We also sell cocoa, teas and coffees in K-Cup® portion packs, Keurig® single-cup brewers and other accessories. In recent years, a significant driver of the Company’s growth has been the sale of K-Cups and Keurig brewing systems.
Business Segments
The Company manages its operations through two operating segments, Specialty Coffee Business Unit (SCBU) formerly referred to as Green Mountain Coffee (GMC) and Keurig business unit (Keurig). We evaluate performance primarily based on segment income before taxes. Expenses not specifically related to either operating segment are recorded as “Corporate”.
SCBU sells whole bean and ground coffee, as well as K-Cups, and to a lesser extent, Keurig single-cup brewers and other accessories mainly in domestic wholesale and retail channels, and directly to consumers. The majority of SCBU’s revenue is derived from its North American wholesale channels.
Additionally, on March 27, 2009, the Company acquired certain assets of the Tully’s Coffee Corporation (Tully’s) which are included in SCBU. The SCBU began selling whole bean and ground coffee and coffee in K-Cups under the Tully’s brand in the third quarter of fiscal 2009.
Keurig is a pioneer and leading manufacturer of gourmet single-cup brewing systems and targets its premium patented single-cup brewing systems for consumers at home (AH) or away-from-home (AFH) mainly in North America. Keurig sells its AFH single-cup brewers to distributors for offices and its AH single-cup brewers to select retailers such as department stores and club stores and directly to consumers. Keurig sells coffee, tea and cocoa in K-Cups produced by a variety of roasters, including the SCBU, and related accessories to select retailers such as department stores and club stores and also directly to consumers. Keurig earns royalty income from K-Cups shipped by its licensed roasters.
Cost of sales for the Company consists of the cost of raw materials including coffee beans, flavorings and packaging materials; a portion of our rental expense; the salaries and related expenses of production; distribution and merchandising personnel; depreciation on production equipment; the cost of brewers manufactured by suppliers, and freight, duties and delivery expenses. Selling and operating expenses consist of expenses that directly support sales, including media and advertising expenses; a portion of the rental expense; and the salaries and related expenses of employees directly supporting sales and marketing as well as research and development. General and administrative expenses consist of expenses incurred for corporate support and administration, including a portion of the rental expense and the salaries and related expenses of personnel not elsewhere categorized.
Historically, the SCBU and Keurig operating segments have not shared manufacturing or distribution facilities, except for brewer fulfillment at our Knoxville facility, and administrative functions such as accounting and information services have been decentralized. Throughout this discussion, we refer to the consolidated company
20
as “the Company” and we refer to our operating segments as “SCBU” and “Keurig”. Expenses not specifically related to either operating segment are shown separately as ‘Corporate’. Corporate expenses are comprised mainly of the compensation and other related expenses of the Company’s Chief Executive Officer, Chief Financial Officer, Chief Information Officer, Corporate General Counsel and Secretary, Vice President Human Resources, Vice President of Corporate Social Responsibility, Vice President of Environmental Affairs and other selected employees who perform duties related to our entire enterprise. Corporate expenses also include interest expense, amortization of identifiable intangibles related to the acquisition of Keurig, as well as certain corporate legal expenses and compensation of the board of directors. In addition, fiscal 2009 Corporate expenses are offset by $17,000,000 of proceeds received from the Kraft litigation settlement. Corporate assets include the cash proceeds from the fiscal 2009 equity offering and goodwill and intangible assets related to the Keurig business unit.
Basis of Presentation
Included in this presentation are discussions and reconciliations of net income in accordance with generally accepted accounting principles (GAAP) to net income excluding certain expenses and losses, which we refer to as non-GAAP net income. These non-GAAP measures exclude amortization of identifiable intangibles and one time operating income related to the Company’s patent litigation settlement and the related legal expenses. Non-GAAP net income is not in accordance with, or an alternative to, GAAP. The Company’s management uses these non-GAAP measures in discussing and analyzing its results of operations because it believes the non-GAAP measures provide investors with greater transparency by helping to illustrate the underlying financial and business trends relating to the Company’s results of operations and financial condition and comparability between current and prior periods. Management uses the non-GAAP measures to establish and monitor budgets and operational goals and to evaluate the performance of the Company.
These non-GAAP financial measures should be considered in addition to, and not as a substitute or superior to, the other measures of financial performance prepared in accordance with GAAP. Using only the non-GAAP financial measures to analyze our performance would have material limitations because their calculation is based on the subjective determination of management regarding the nature and classification of events and circumstances that investors may find significant. Management compensates for these limitations by presenting both the GAAP and non-GAAP measures of its results.
Acquisitions
On March 27, 2009, we purchased certain assets of the Tully’s Coffee Corporation for $41.4 million, which includes direct acquisition costs of $1.1 million. We financed this transaction through our existing senior revolving credit facility.
On November 13, 2009, through a wholly owned subsidiary, we acquired the wholesale coffee and beverages business of Timothy’s Coffee of the World, Inc. for an aggregate cash purchase price of approximately $157 million, subject to adjustment. We financed the purchase price through available cash on hand. The purchase price is subject to a working capital adjustment and certain other true ups to be calculated within 120 days of November 13, 2009.
On November 2, 2009, Peet’s Coffee & Tea, Inc. (“Peet’s”) and Diedrich Coffee, Inc. (“Diedrich”) announced entering into an agreement under which Peet’s would acquire Diedrich for $26.00 per share in a cash-and-stock transaction. On November 22, 2009, in response to a proposal from us to acquire Diedrich for $30.00 per share in cash, Peet’s increased its proposal to $32.00 per share, also in a cash-and-stock transaction. On November 23, 2009, we submitted a revised proposal to acquire Diedrich for $32.00 per share in cash, to be effected pursuant to a cash tender offer in a transaction with a total enterprise value of approximately $267 million. As of the filing of this Form 10-K, the Diedrich Board of Directors has determined that our revised offer constitutes a superior proposal, as defined in the existing merger agreement between Diedrich and Peet’s. Upon entering into a
21
definitive merger agreement between us and Diedrich, we would proceed with a cash tender offer to acquire all outstanding shares of Diedrich. We anticipate that we would finance an acquisition of Diedrich through cash on hand and our existing credit facility.
Results of Operations
The following discussion of results of operations should be read in conjunction with “Item 6. Selected Financial Data,” the Consolidated Financial Statements and accompanying Notes thereto and the other financial data included elsewhere in this report.
Summary financial data of the Company
The following table presents certain financial data of the Company expressed as a percentage of net sales for the periods denoted below:
| | | | | | | | | |
| | | Fiscal years ended | |
| | | September 26,
2009 | | | September 27,
2008 | | | September 29,
2007 | |
Net sales | | 100.0 | % | | 100.0 | % | | 100.0 | % |
Cost of sales | | 68.9 | % | | 64.6 | % | | 61.6 | % |
| | | | | | | | | |
Gross profit | | 31.1 | % | | 35.4 | % | | 38.4 | % |
| | | |
Selling and operating expenses | | 15.4 | % | | 18.4 | % | | 21.3 | % |
General and administrative expenses | | 5.9 | % | | 7.8 | % | | 8.9 | % |
Patent litigation (settlement) expense | | (2.1 | )% | | 0.7 | % | | 0.1 | % |
| | | | | | | | | |
Operating income | | 11.9 | % | | 8.5 | % | | 8.1 | % |
| | | |
Other expense | | (0.1 | )% | | (0.1 | )% | | 0.0 | % |
Interest expense | | (0.5 | )% | | (1.1 | )% | | (1.8 | )% |
| | | | | | | | | |
Income before income taxes | | 11.3 | % | | 7.3 | % | | 6.3 | % |
| | | |
Income tax expense | | (4.3 | )% | | (2.8 | )% | | (2.5 | )% |
| | | | | | | | | |
Net income | | 7.0 | % | | 4.5 | % | | 3.8 | % |
| | | | | | | | | |
Segment Summary
Net sales and income before taxes for each of our operating segments are summarized in the tables below. Fiscal 2008 and 2007 amounts have been reclassified to conform with fiscal 2009 presentation.
| | | | | | | | | | | | | | | | | | |
| | | Net sales (in millions) | | | Percent growth | |
| | | 2009 | | | 2008 | | | 2007 | | | 2009 | | | 2008 | |
SCBU | | $ | 382.4 | | | $ | 285.9 | | | $ | 230.5 | | | 34 | % | | 24 | % |
Keurig | | | 420.6 | | | | 214.4 | | | | 111.2 | | | 96 | % | | 93 | % |
Corporate | | | — | | | | — | | | | — | | | — | | | — | |
| | | | | | | | | | | | | | | | | | |
Total Company | | $ | 803.0 | | | $ | 500.3 | | | $ | 341.7 | | | 61 | % | | 46 | % |
| | | | | | | | | | | | | | | | | | |
| | |
| | | Income before taxes (in millions) | | | Percent growth | |
| | | 2009 | | | 2008 | | | 2007 | | | 2009 | | | 2008 | |
SCBU | | $ | 52.6 | | | $ | 27.8 | | | $ | 22.5 | | | 89 | % | | 24 | % |
Keurig | | | 47.5 | | | | 32.6 | | | | 16.8 | | | 46 | % | | 94 | % |
Corporate | | | (7.6 | ) | | | (23.5 | ) | | | (17.4 | ) | | -68 | % | | 35 | % |
Inter-company eliminations | | | (2.2 | ) | | | (0.4 | ) | | | (0.3 | ) | | 404 | % | | 33 | % |
| | | | | | | | | | | | | | | | | | |
Total Company | | $ | 90.4 | | | $ | 36.5 | | | $ | 21.6 | | | 148 | % | | 69 | % |
| | | | | | | | | | | | | | | | | | |
22
Revenue
Company Summary
Net sales for fiscal 2009 increased 61% to $803.0 million, up from $500.3 million reported in fiscal 2008. For fiscal 2008, net sales increased 46% to $500.3 million, up from $341.7 million reported in fiscal 2007. The primary driver of the increase in net sales for fiscal 2009 and fiscal 2008 was the increase in K-Cup net sales, which were up on a consolidated basis, 82% and 85%, respectively. Total K-Cup shipments of coffee, cocoa and tea by all Keurig licensed roasters increased 63% in fiscal 2009 as compared to fiscal 2008, and increased 59% in fiscal 2008 as compared to fiscal 2007.
SCBU
Fiscal 2009
SCBU segment net sales increased by $96.5 million or 34%, to $382.4 million in fiscal 2009 as compared to $285.9 million reported in fiscal 2008. Coffee, tea and cocoa pounds shipped by the SCBU segment increased 30% over fiscal 2008 with the primary driver being the continued growth in K-Cup sales.
Fiscal 2008
SCBU segment net sales increased by $55.4 million or 24%, to $285.9 million in fiscal 2008 as compared to $230.5 million reported in fiscal 2007. Coffee, tea and cocoa pounds shipped by the SCBU segment increased 16% over fiscal 2007 with the primary driver being the continued growth in K-Cup sales.
Keurig
Fiscal 2009
Keurig segment net sales increased by $206.2 million, or 96%, to $420.6 million in fiscal 2009 as compared to $214.4 million reported in fiscal 2008. The increase in Keurig segment net sales was primarily due to higher K-Cup sales of approximately $102.3 million which increased 119% as compared to fiscal 2008. Net sales of At Home brewers and accessories contributed over 40% of the increase in total Keurig segment net sales as compared to fiscal 2008. Additionally, royalty income from the sale of K-Cups from third party licensed roasters increased $15.2 million over fiscal 2008 and totaled $39.5 million.
During fiscal 2009, 1.6 billion K-Cup portion packs were shipped system-wide by all Keurig licensed roasters, up 63% over fiscal 2008. In addition, there were 2.3 million Keurig brewers shipped during fiscal 2009 as compared to 1.0 million shipped in fiscal 2008.
Fiscal 2008
Keurig segment net sales increased by $103.2 million, or 93%, to $214.4 million in fiscal 2008 as compared to $111.2 million reported in fiscal 2007. The increase in Keurig segment net sales was primarily due to higher K-Cup sales of approximately $52.7 million which increased 158% as compared to fiscal 2007. Net sales of At Home brewers and accessories contributed over one-third of the increase in total Keurig segment net sales as compared to fiscal 2007. Additionally, royalty income from the sale of K-Cups from third party licensed roasters increased $9.3 million over fiscal 2007 and totaled $24.4 million.
During fiscal 2008, 1.0 billion K-Cup portion packs were shipped system-wide by all Keurig licensed roasters, up 59% as compared to 0.6 billion in fiscal 2007. In addition, there were 1.0 million Keurig brewers shipped during fiscal 2008 as compared to 0.5 million shipped in fiscal 2007.
23
Gross Profit
Fiscal 2009
Company gross profit for fiscal 2009 totaled $249.8 million, or 31% of net sales, as compared to $176.9 million, or 35% of net sales, in fiscal 2008. The margin decline is due primarily to the increase in sales of AH single-cup brewers, which are sold approximately at cost as part of the Company’s strategy to increase the installed base of Keurig brewers.
Fiscal 2008
Company gross profit for fiscal 2008 totaled $176.9 million, or 35% of net sales, as compared to $131.1 million, or 38% of net sales, in fiscal 2007. The margin decline is due primarily to the increase in sales of AH single-cup brewers, which are sold approximately at cost as part of the Company’s strategy to increase the installed base of Keurig brewers.
Selling, General and Administrative Expenses
Fiscal 2009
Company selling, general and administrative expenses (S,G&A) increased 30% to $171.1 million in fiscal 2009 from $131.2 million in fiscal 2008. As a percentage of sales, S,G&A declined to 21% in fiscal 2009 from 26% in fiscal 2008. This improvement in S,G&A margin was mainly due to leveraging selling and organizational resources on a higher sales base.
Fiscal 2008
Company selling, general and administrative expenses (S,G&A) increased 30% to $134.5 million in fiscal 2008 from $103.4 million in fiscal 2007. As a percentage of sales, S,G&A declined to 26% in fiscal 2008 from 30% in fiscal 2007. This improvement in S,G&A margin was mainly due to leveraging selling and organizational resources on a higher sales base.
Interest Expense
Company interest expense decreased to $4.7 million in fiscal 2009, down from $5.7 million in fiscal 2008. The decrease was primarily due to lower interest rates for the majority of the year on the Company’s outstanding balance under its credit facility.
Interest expense was $6.2 million in fiscal 2007. The decrease in fiscal 2008 as compared to fiscal 2007 was primarily due to lower interest rates on the Company’s outstanding balance under its credit facility.
In fiscal 2009, 2008 and 2007, the Company capitalized $0.6 million, $0.6 million, and $0.4 million of interest expense, respectively.
Income before taxes
Company income before taxes was $90.4 million in fiscal 2009, $36.5 million in fiscal 2008, and $21.6 million in fiscal 2007, as a percentage of net sales, 11%, 7% and 6% respectively.
Excluding the non-cash amortization expenses related to the identifiable intangibles ($5.3 million in fiscal 2009 and $4.8 million in fiscal 2008 and fiscal 2007) and patent litigation settlement and expense ($17.0 million settlement in fiscal 2009, $3.3 million expense in fiscal 2008 and $0.5 million expense in fiscal 2007), the Company’s non-GAAP income before taxes was $78.7 million, $44.6 million and $26.9 million in fiscal 2009, 2008 and 2007, respectively. Non-GAAP income before taxes as a percentage of net sales was, 10%, 9% and 8%, in fiscal 2009, 2008 and 2007, respectively.
The SCBU segment contributed $52.6 million in income before taxes in fiscal 2009, up from $27.8 million in fiscal 2008 and $22.5 million in fiscal 2007.
24
The Keurig segment contributed $47.5 million in income before taxes in fiscal 2009, up from $32.6 million in fiscal 2008 and $16.8 million in fiscal 2007.
The Corporate segment accounted for a reduction of $7.6 million from income before taxes in fiscal 2009, which included the patent litigation settlement, as compared to a reduction of $23.5 million in fiscal 2008 and a reduction of $17.4 million in fiscal 2007.
Taxes
The effective income tax rate for the Company was 38.2 % in fiscal 2009, as compared to 38.9% in fiscal 2008. The effective income tax rate for fiscal 2007 was 40.5%. The decrease in fiscal 2008 was primarily due to foreign tax credits associated with royalties earned on K-Cup portion packs from Canadian licensed roasters.
Net Income and Diluted EPS
Company net income in fiscal 2009 was $55.9 million, an increase of $33.6 million or 151%, as compared to $22.3 million in fiscal 2008. Company net income in fiscal 2007 was $12.8 million.
Company diluted EPS increased $0.81 or 140% to $1.39 per share in fiscal 2009, as compared to $0.58 per share in fiscal 2008. Company diluted EPS in fiscal 2007 was $0.35 per share.
Excluding the impact of certain non-cash expenses illustrated in the financial table provided below, non-GAAP net income increased approximately 79% in fiscal 2009 totaling $48.7 million, or $1.21 per share, as compared to non-GAAP net income of $27.2 million, or $0.71 per share, in fiscal 2008. Non-GAAP net income was $16.0 million, or $0.43 per share in fiscal 2007.
The following tables show a reconciliation of net income and diluted EPS to non-GAAP net income and non-GAAP diluted EPS for fiscal 2009, 2008 and 2007 (in thousands):
| | | | | | | | | | | | | | | | |
| | | For the fiscal year ended September 26, 2009 | |
| | | GAAP | | | Amortization
of identifiable
intangibles | | | Patent Litigation
(settlement)
expense | | | Non-GAAP | |
Net sales | | $ | 803,045 | | | $ | — | | | $ | — | | | $ | 803,045 | |
Cost of sales | | | 553,281 | | | | — | | | | — | | | | 553,281 | |
| | | | | | | | | | | | | | | | |
Gross profit | | | 249,764 | | | | — | | | | — | | | | 249,764 | |
Selling and operating expenses | | | 123,948 | | | | — | | | | — | | | | 123,948 | |
General and administrative expenses | | | 47,103 | | | | (5,318 | ) | | | — | | | | 41,785 | |
Patent litigation (settlement) expense | | | (17,000 | ) | | | — | | | | 17,000 | | | | — | |
| | | | | | | | | | | | | | | | |
Operating income | | | 95,713 | | | | 5,318 | | | | (17,000 | ) | | | 84,031 | |
Other income (expense) | | | (662 | ) | | | — | | | | — | | | | (662 | ) |
Interest expense | | | (4,693 | ) | | | — | | | | — | | | | (4,693 | ) |
| | | | | | | | | | | | | | | | |
Income before income taxes | | | 90,358 | | | | 5,318 | | | | (17,000 | ) | | | 78,676 | |
Income tax expense | | | (34,476 | ) | | | — | | | | — | | | | (34,476 | ) |
| | | | | | | | | | | | | | | | |
Net income | | $ | 55,882 | | | $ | 5,318 | | | $ | (17,000 | ) | | $ | 44,200 | |
| | | | | | | | | | | | | | | | |
Basic income per share: | | | | | | | | | | | | | | | | |
Weighted average shares outstanding | | | 37,993,196 | | | | 37,993,196 | | | | 37,993,196 | | | | 37,993,196 | |
Net income | | $ | 1.47 | | | $ | 0.14 | | | $ | (0.45 | ) | | $ | 1.16 | |
Diluted income per share: | | | | | | | | | | | | | | | | |
Weighted average shares outstanding | | | 40,123,553 | | | | 40,123,553 | | | | 40,123,553 | | | | 40,123,553 | |
Net income | | $ | 1.39 | | | $ | 0.13 | | | $ | (0.42 | ) | | $ | 1.10 | |
25
| | | | | | | | | | | | | | | | |
| |
| | | For the fiscal year ended September 27, 2008 | |
| | | GAAP | | | Amortization
of identifiable
intangibles | | | Patent Litigation
(settlement)
expense | | | Non-GAAP | |
Net sales | | $ | 500,277 | | | $ | — | | | $ | — | | | $ | 500,277 | |
Cost of sales | | | 323,372 | | | | — | | | | — | | | | 323,372 | |
| | | | | | | | | | | | | | | | |
Gross profit | | | 176,905 | | | | — | | | | — | | | | 176,905 | |
Selling and operating expenses | | | 92,182 | | | | — | | | | — | | | | 92,182 | |
General and administrative expenses | | | 39,032 | | | | (4,812 | ) | | | — | | | | 34,220 | |
Patent litigation (settlement) expense | | | 3,279 | | | | — | | | | (3,279 | ) | | | — | |
| | | | | | | | | | | | | | | | |
Operating income | | | 42,412 | | | | 4,812 | | | | 3,279 | | | | 50,503 | |
Other income (expense) | | | (235 | ) | | | — | | | | — | | | | (235 | ) |
Interest expense | | | (5,705 | ) | | | — | | | | — | | | | (5,705 | ) |
| | | | | | | | | | | | | | | | |
Income before income taxes | | | 36,472 | | | | 4,812 | | | | 3,279 | | | | 44,563 | |
Income tax expense | | | (14,173 | ) | | | (1,872 | ) | | | — | | | | (16,045 | ) |
| | | | | | | | | | | | | | | | |
Net income | | $ | 22,299 | | | $ | 2,940 | | | $ | 3,279 | | | $ | 28,518 | |
| | | | | | | | | | | | | | | | |
Basic income per share: | | | | | | | | | | | | | | | | |
Weighted average shares outstanding | | | 35,924,697 | | | | 35,924,697 | | | | 35,924,697 | | | | 35,924,697 | |
Net income | | $ | 0.62 | | | $ | 0.08 | | | $ | 0.09 | | | $ | 0.79 | |
Diluted income per share: | | | | | | | | | | | | | | | | |
Weighted average shares outstanding | | | 38,347,170 | | | | 38,347,170 | | | | 38,347,170 | | | | 38,347,170 | |
Net income | | $ | 0.58 | | | $ | 0.08 | | | $ | 0.09 | | | $ | 0.74 | |
| |
| | | For the fiscal year ended September 29, 2007 | |
| | | | |
| | | GAAP | | | Amortization
of identifiable
intangibles | | | Patent Litigation
(settlement)
expense | | | Non-GAAP | |
Net sales | | $ | 341,651 | | | $ | — | | | $ | — | | | $ | 341,651 | |
Cost of sales | | | 210,530 | | | | — | | | | — | | | | 210,530 | |
| | | | | | | | | | | | | | | | |
Gross profit | | | 131,121 | | | | — | | | | — | | | | 131,121 | |
Selling and operating expenses | | | 72,641 | | | | — | | | | — | | | | 72,641 | |
General and administrative expenses | | | 30,293 | | | | (4,811 | ) | | | — | | | | 25,482 | |
Patent litigation (settlement) expense | | | 488 | | | | — | | | | (488 | ) | | | — | |
| | | | | | | | | | | | | | | | |
Operating income | | | 27,699 | | | | 4,811 | | | | 488 | | | | 32,998 | |
Other income (expense) | | | 54 | | | | — | | | | — | | | | 54 | |
Interest expense | | | (6,176 | ) | | | — | | | | — | | | | (6,176 | ) |
| | | | | | | | | | | | | | | | |
Income before income taxes | | | 21,577 | | | | 4,811 | | | | 488 | | | | 26,876 | |
Income tax expense | | | (8,734 | ) | | | (1,947 | ) | | | — | | | | (10,681 | ) |
| | | | | | | | | | | | | | | | |
Net income | | $ | 12,843 | | | $ | 2,864 | | | $ | 488 | | | $ | 16,195 | |
| | | | | | | | | | | | | | | | |
Basic income per share: | | | | | | | | | | | | | | | | |
Weighted average shares outstanding | | | 34,875,647 | | | | 34,875,647 | | | | 34,875,647 | | | | 34,875,647 | |
Net income | | $ | 0.37 | | | $ | 0.08 | | | $ | 0.01 | | | $ | 0.46 | |
Diluted income per share: | | | | | | | | | | | | | | | | |
Weighted average shares outstanding | | | 37,160,060 | | | | 37,160,060 | | | | 37,160,060 | | | | 37,160,060 | |
Net income | | $ | 0.35 | | | $ | 0.08 | | | $ | 0.01 | | | $ | 0.44 | |
26
Liquidity and Capital Resources
Working capital increased to $413.7 million at September 26, 2009, up from $79.2 million at September 27, 2008. Approximately $291.0 million of the increase is due to a portion of the proceeds received from the public offering of 5,750,000 shares of our common stock in the fourth quarter of fiscal 2009. To a lesser extent, the increase is also attributed to higher inventory levels to ensure both efficiencies and sufficient inventory for anticipated consumer demand for the fiscal 2010 holiday season.
Net cash provided by operating activities was $38.5 million in fiscal 2009 as compared to $1.9 million in fiscal 2008. The increase in operating cash flow was due to an improvement in net income of $33.6 million, which includes the patent litigation settlement of $17.0 million (gross of tax), and the benefit of leveraging selling and organizational resources on a higher sales base.
Cash flows from investing activities included capital expenditures of $48.3 million in fiscal 2009, as compared to $48.7 million in fiscal 2008. Cash flows from investing activities also included purchases of short-term investments of $50.0 million in fiscal 2009.
On March 27, 2009, we purchased certain assets of the Tully’s Coffee Corporation for $40.3 million. Total cash disbursed was $41.4 million which includes direct acquisition costs of $1.1 million. We financed this transaction through our existing senior revolving credit facility.
In 2009, cash flows from financing activities included proceeds generated from the issuance of 5,750,000 shares of our common stock at $67.25 per share. Net proceeds were approximately $369.8 million after deducting the underwriting discount and other offering expenses. Cash flows from financing activities also included $8.2 million generated from the exercise of employee stock options and the issuance of shares under the employee stock purchase plan, up from $5.7 million in fiscal 2008.
In addition, cash flows from operating and financing activities included a $10.4 million tax benefit from the exercise of non-qualified options and disqualifying dispositions of incentive stock options, up from $5.8 million in the prior year. As stock options we have granted are exercised, we will continue to receive proceeds and a tax deduction where applicable; however, we cannot predict either the amounts or the timing of any such proceeds or tax benefits.
Our Company maintains a Revolving Credit Agreement (the “Credit Facility”) with Bank of America, N.A. (Bank of America) and other lenders. On June 29, 2009, we exercised our increase option and amended certain financial covenants. The increase was in the form of a $50.0 million term loan and will be amortized at a rate of 10% annually with payments beginning on September 30, 2009. All borrowings under the Credit Facility, including the outstanding balance under the term loan, are due in December 2012. At September 26, 2009, and September 27, 2008, $78.0 million and $123.5 million were outstanding under the Credit Facility, respectively. Proceeds received from the issuance of our common stock were used to repay a portion of our debt outstanding on Credit Facility.
The Credit Facility is subject to the following financial covenants: a funded debt to adjusted EBITDA covenant and a fixed charge coverage ratio covenant. On June 29, 2009, we amended the credit agreement which removed the capital expenditures limitation covenant and adjusted the definition of the fixed charge coverage ratio to modify the capital expenditures captured in the definition of 50% of unfinanced capital expenditures. We were in compliance with these covenants at September 26, 2009.
The borrowings under the Credit Facility bear interest at prime or Libor rates, plus a margin based on a performance price structure. The average effective interest rate at September 26, 2009, was 6.3%, up from 4.9% at September 27, 2008.
27
The Company is party to interest rate swap agreements. The total notional amounts of these swaps at September 26, 2009, and September 27, 2008, was $75.7 million and $78.5 million, respectively. On September 26, 2009, the effect of these swaps was to limit the interest rate exposure on the outstanding balance of the Credit Facility to a fixed rate versus the 30-day Libor rate as follows: 5.4% on $25.7 million; 2.4% on $30.0 million; and 3.9% on $20.0 million. The total notional amount covered by these swaps will decrease progressively in future periods and terminates on various dates from June 2010 through December 2012.
The fair market value of the interest rate swaps are the estimated amount that we would receive or pay to terminate the agreements at the reporting date, taking into account current interest rates and the credit worthiness of the counterparty. At September 26, 2009, and September 27, 2008, we estimate we would have paid $3.3 million and $0.6 million (gross of tax), respectively, if we terminated the agreements. We designate the swap agreements as cash flow hedges and the changes in the fair value of the swaps are classified in other comprehensive income (a component of equity).
In fiscal year 2009, we paid $2.2 million in additional interest expense pursuant to the swap agreements, up from $1.1 million in fiscal 2008.
We expect to spend between $90.0 million and $110.0 million in capital expenditures in fiscal 2010. Capital expenditures are anticipated to be funded from operating cash flows and proceeds from our issuance of common stock.
On November 13, 2009, we entered into a share purchase agreement to acquire the wholesale coffee and beverage business of Timothy’s Coffees of the World, Inc. (Timothy’s) In this acquisition, we acquired all of the issued and outstanding stock of Timothy’s for a cash purchase price of approximately $157 million, in U.S. dollars and in cash, subject to adjustment. We financed the consideration paid using cash on hand. The purchase price is subject to a working capital adjustment and certain other adjustments to be settled within 120 days of the closing.
In light of our recent and contemplated acquisition activity, we may need to increase our borrowings under our existing line of credit or may seek to amend our credit facility by either increasing the term loan or increasing the size of the credit facility to finance working capital needs. The availability and terms of any such financing would be subject to prevailing market conditions and other factors at that time and there can be no assurance that we will be able to secure financing on terms as favorable as our existing facility.
We believe that our cash flows from operating activities, existing cash and our credit facility will provide sufficient liquidity to pay all liabilities in the normal course of business, fund anticipated capital expenditures and service debt requirements through the next 12 months. However, several risks and uncertainties could cause us to need to raise additional capital through equity and/or debt financing. We also may consider from time to time engaging in stock buyback plans or programs.
A summary of cash requirements related to our outstanding long-term debt, future minimum lease payments and inventory purchase commitments is as follows (in thousands):
| | | | | | | | | | | | |
Fiscal Year | | Long-Term Debt(1) | | Operating Lease
Obligations | | Purchase
Obligations | | Total |
2010 | | $ | 5,030 | | $ | 5,243 | | $ | 228,103 | | $ | 238,376 |
2011 | | | 5,008 | | | 5,385 | | | 73,243 | | $ | 83,636 |
2012 | | | 5,005 | | | 4,657 | | | — | | $ | 9,662 |
2013 | | | 63,000 | | | 3,476 | | | — | | $ | 66,476 |
2014 | | | — | | | 3,284 | | | — | | $ | 3,284 |
Thereafter | | | — | | | 5,926 | | | — | | $ | 5,926 |
Total | | $ | 78,043 | | $ | 27,971 | | $ | 301,346 | | $ | 407,360 |
| (1) | Fiscal 2010 through fiscal 2012 long-term debt obligations are comprised of capital lease obligations and amortizing loan payments for the term loan. |
28
In addition, we have $0.4 million in unrecognized tax benefits. The unrecognized tax benefits relate equally to foreign tax credits at the federal level and research development credits at the state level.
Factors Affecting Quarterly Performance
Historically, the Company has experienced variations in sales and earnings from quarter to quarter due to the holiday season and a variety of other factors, including, but not limited to, general economic trends, the cost of green coffee, competition, marketing programs, weather and special or unusual events. Because of the seasonality of our business, results for any quarter are not necessarily indicative of the results that may be achieved for the full fiscal year.
Critical Accounting Policies
This discussion and analysis of our financial condition and results of operations is based upon our consolidated financial statements, which we prepare in accordance with accounting principles generally accepted in the United States of America. The preparation of these financial statements requires us to make estimates and assumptions that affect the reported amounts of assets and liabilities and disclosure of contingent assets and liabilities at the date of the financial statements, and the reported amounts of revenues and expenses during the reporting period (see Note 2 to our Consolidated Financial Statements included in this Annual Report on Form 10-K). Actual results could differ from those estimates. We believe the following accounting policies and estimates require us to make the most difficult judgments in the preparation of our consolidated financial statements and accordingly are critical.
Cash and Cash Equivalents
The Company considers all highly liquid investments purchased with a maturity of three months or less to be cash equivalents. Cash and cash equivalents include money market funds which are carried at cost, plus accrued interest, which approximates fair value. The Company does not believe that it is subject to any unusual credit or market risk.
Short-term Investments
Short-term investments consist of highly liquid investments, primarily certificates of deposit, with maturities over three months from the date of purchase. These assets are carried at cost, plus accrued interest, which approximates fair value due to the short maturity of these instruments.
Inventories
Inventories are stated at the lower of cost or market. Cost is being measured using an adjusted standard cost method which approximates FIFO (first-in first-out). We regularly review whether the realizable value of our inventory is lower than its carrying value. If our valuation shows that the realizable value is lower than carrying value, we take a charge to expense and directly reduce the value of the inventory.
The Company estimates its reserves for inventory obsolescence by examining its inventories on a quarterly basis to determine if there are indicators that the carrying values exceed net realizable value. Indicators that could result in additional inventory write downs include age of inventory, damaged inventory, slow moving products and products at the end of their life cycles. While management believes that the reserve for obsolete inventory is adequate, significant judgment is involved in determining the adequacy of this reserve.
Inventories consist primarily of green and roasted coffee, including coffee in portion packs, purchased finished goods such as coffee brewers and packaging materials.
29
Financial Instruments
The Company enters into various types of financial instruments in the normal course of business. Fair values are estimated based on assumptions concerning the amount and timing of estimated future cash flows and assumed discount rates reflecting varying degrees of perceived risk. Cash, cash equivalents, accounts receivable, accounts payable and accrued expenses are reported at carrying value and approximate fair value due to the short maturity of these instruments. Long-term debt is also reported at carrying value and approximates fair value due to the fact that the interest rate on the debt is based on variable interest rates (Libor or prime).
The fair value of short-term investments and derivative financial instruments have been determined using market information and valuation methodologies. Changes in assumptions or estimates could affect the determination of fair value, however, management does not believe any such changes would have a material impact on our financial condition, results of operations or cash flows. The fair values of short-term investments and derivative financial instruments are disclosed in Note 15 in the Consolidated Financial Statements included in this Form 10-K.
Hedging Activities
We enter into coffee futures contracts to hedge against price increases in price-to-be-fixed coffee purchase commitments and anticipated coffee purchases. The Company also enters into interest rate swaps to hedge against unfavorable changes in interest rates. These derivative instruments qualify for hedge accounting if the hedging relationship is expected to be highly effective. Effectiveness is determined by how closely the changes in the fair value of the derivative instrument offset the changes in the fair value of the hedged item. If the derivative is determined to qualify for hedge accounting, the effective portion of the change in the fair value of the derivative instrument is recorded in other comprehensive income and recognized in earnings when the related hedged item is sold. The ineffective portion of the change in the fair value of the derivative instrument is recorded directly to earnings. If these derivative instruments do not qualify for hedge accounting, the Company would record the changes in the fair value of the derivative instruments directly to earnings. See “Item 7A. Quantitative and Qualitative Disclosures about Market Risk” and Notes 13 and 14 in the Consolidated Financial Statements included in this Form 10-K.
The Company formally documents hedging instruments and hedged items, and measures at each balance sheet date the effectiveness of its hedges. When it is determined that a derivative is not highly effective, the derivative expires, or is sold or terminated, or the derivative is discontinued because it is unlikely that a forecasted transaction will occur, the Company discontinues hedge accounting prospectively for that specific hedge instrument.
The Company does not engage in speculative transactions, nor does it hold derivative instruments for trading purposes.
Other long-term assets
Other long-term assets consist of deposits and debt issuance costs. Debt issuance costs are being amortized over the respective life of the applicable debt using a method that approximates the effective interest rate method. Debt issuance costs included in other long-term assets in the accompanying consolidated balance sheet at September 26, 2009 and September 27, 2008 were $2.3 million and $1.7 million, respectively.
Goodwill and intangibles
Goodwill and indefinite-lived intangibles are tested for impairment annually, and more frequently if indication of impairment arises.
30
On March 27, 2009, the Company recorded $25.8 million of goodwill for the acquisition of the wholesale business and coffee brand of Tully’s Coffee Corporation (Tully’s). Goodwill and intangibles related to Tully’s are reported in the SCBU segment of the Company. The Company’s evaluation of goodwill impairment involves a comparison between the current fair value and the recorded value of the SCBU reporting unit, including goodwill. The Company uses a discounted cash flow model to determine the fair value of the SCBU reporting unit. A number of significant assumptions and estimates are involved in the application of the discounted cash flow model including discount rate, sales volume and prices, costs to produce and working capital changes. The Company considers historical experience and all available information at the time fair value is estimated.
On June 15, 2006, the Company acquired Keurig and recorded $73.9 million of goodwill. Goodwill from the Keurig acquisition was decreased by $1.4 million in fiscal 2007 and by $133,000 in fiscal 2009 primarily to reflect updated estimates of R&D tax credits earned by Keurig in the years prior to the Company’s merger with Keurig. Goodwill was also decreased by $97,000 in fiscal 2007 and increased by $113,000 in fiscal 2008 due to the final settlements of contingencies related to the merger. Goodwill and intangibles related to Keurig are reported in the Corporate segment of the Company. This goodwill was tested for impairment at the end of fiscal 2009. To complete this impairment test, the Company evaluated the fair value of its Keurig reporting unit using a market capitalization approach.
On June 5, 2001, the Company purchased the coffee business of Frontier Natural Products Co-op (Frontier) and recorded $1.4 million of goodwill related to this acquisition. There have been no changes in this carrying amount since September 29, 2001. Goodwill related to Frontier is reported in the Corporate segment of the Company. On an annual basis, the Company evaluates the fair value of the reporting unit (SCBU) associated with the Frontier acquisition and compares it to the carrying amount of goodwill. Estimation of fair value is dependent on a number of factors, including the market capitalization of the Company and estimates of the Company’s sales of its fair trade and organics products.
Based on the impairment tests performed, there was no impairment of goodwill in fiscal 2009, 2008 and 2007. All intangible assets are being amortized using the straight-line method over their useful lives.
Impairment of Long-Lived Assets
When facts and circumstances indicate that the carrying values of long-lived assets, including fixed assets, may be impaired, an evaluation of recoverability is performed by comparing the carrying value of the assets to projected future cash flows in addition to other quantitative and qualitative analyses. Upon indication that the carrying value of such assets may not be recoverable, the Company recognizes an impairment loss as a charge against current operations. Long-lived assets to be disposed of are reported at the lower of the carrying amount or fair value, less estimated costs to sell. The Company makes judgments related to the expected useful lives of long-lived assets and its ability to realize undiscounted cash flows in excess of the carrying amounts of such assets which are affected by factors such as the ongoing maintenance and improvements of the assets, changes in economic conditions and changes in operating performance. As the Company assesses the ongoing expected cash flows and carrying amounts of its long-lived assets, these factors could cause the Company to realize a material impairment charge.
Provision for Doubtful Accounts
Periodically, management reviews the adequacy of its provision for doubtful accounts based on historical bad debt expense results and current economic conditions using factors based on the aging of its accounts receivable. Additionally, the Company may identify additional allowance requirements based on indications that a specific customer may be experiencing financial difficulties. Actual bad debts could differ materially from the recorded estimates.
31
Advertising costs
The Company expenses the costs of advertising the first time the advertising takes place, except for direct mail campaigns targeted directly at consumers, which are expensed over the period during which they are expected to generate sales. At September 26, 2009 and September 27, 2008, deferred and prepaid advertising costs of $1.3 million and $0.7 million, respectively, were recorded in other current assets in the accompanying consolidated balance sheet. Advertising expense totaled $30.3 million, $17.0 million, and $11.2 million, for the years ended September 26, 2009, September 27, 2008, and September 29, 2007, respectively.
Fixed assets
Fixed assets are carried at cost, net of accumulated depreciation. Expenditures for maintenance, repairs and renewals of minor items are expensed as incurred. Depreciation is calculated using the straight-line method over the assets’ estimated useful lives. The cost and accumulated depreciation for fixed assets sold, retired, or otherwise disposed of are relieved from the accounts, and the resultant gains and losses are reflected in income.
The Company follows an industry-wide practice of purchasing and loaning coffee brewing and related equipment to wholesale customers. These assets are also carried at cost, net of accumulated depreciation.
Depreciation costs of manufacturing and distribution assets are included in cost of sales. Depreciation costs of other assets, including equipment on loan to customers, are included in selling and operating expenses.
Revenue recognition
Revenue from wholesale and consumer direct sales is recognized upon product delivery, and in some cases upon product shipment. The Company has no contractual obligation to accept returns for damaged product nor does it guarantee product sales. Title, risk of loss, damage and insurance responsibility for the products pass from the Company to the buyer upon accepted delivery of the products from the Company’s contracted carrier. The Company will at times agree to accept returns or issue credits for products that are clearly damaged in transit.
Sales of single-cup coffee brewers are recognized net of an estimated allowance for returns. The Company estimates the allowance for returns using an average return rate based on historical experience. Royalty revenue is recognized upon shipment of K-Cups by roasters as set forth under the terms and conditions of various licensing agreements.
In addition, the Company’s customers can earn certain incentives, which are netted against sales or recorded in operating and selling expenses in the consolidated income statements. These incentives include, but are not limited to, cash discounts, funds for promotional and marketing activities, and performance based incentive programs.
Warranty
We provide for the estimated cost of product warranties, primarily using historical information and repair or replacement costs, at the time product revenue is recognized.
Cost of Sales
The Company records external shipping and handling expenses in cost of sales.
32
Income taxes
The Company recognizes deferred tax assets and liabilities for the expected future tax benefits or consequences of temporary differences between the financial statement carrying amounts of existing assets and liabilities, and their respective tax bases. Deferred tax assets and liabilities are measured using enacted tax rates in effect for the year in which those temporary differences are expected to be recovered or settled.
In the first quarter of fiscal 2008, the Company adopted new accounting guidance on the accounting for uncertainty in income taxes. The Company uses a more-likely-than-not measurement attribute for all tax positions taken or expected to be taken on a tax return in order for those tax positions to be recognized in the financial statements.
Stock-based compensation
The Company measures the cost of employee services received in exchange for an award of equity instruments (usually stock options) based on the grant-date fair value of the award. That cost is recognized over the period during which an employee is required to provide service in exchange for the award.
The Company measures the fair value of stock options using the Black-Scholes model and certain assumptions, including the expected life of the stock options, an expected forfeiture rate and the expected volatility of its common stock. The expected life of options is estimated based on options vesting periods, contractual lives and an analysis of the Company’s historical experience. The expected forfeiture rate is based on the Company’s historical experience. The Company uses a blended historical volatility to estimate expected volatility at the measurement date.
Significant customer credit risk and supply risk
The majority of the Company’s customers are located in the United States. Concentration of credit risk with respect to accounts receivable is limited due to the large number of customers in various channels comprising the Company’s customer base. The Company does not require collateral from customers as ongoing credit evaluations of customers’ payment histories are performed. The Company maintains reserves for potential credit losses and such losses, in the aggregate, have not exceeded management’s expectations.
Keurig procures the brewers it sells from a third-party brewer manufacturer. Purchases from this brewer manufacturer amounted to approximately $176.6 million and $91.7 million in fiscal 2009 and fiscal 2008, respectively. Keurig processes the majority of its orders sold through retailers for the at-home channel through a fulfillment company. Revenue processed by this fulfillment company amounted to $282.5 million and $88.6 million and receivables amounted to $46.3 million and $19.6 million at September 26, 2009 and September 27, 2008, respectively.
Research & Development
Research and development expenses are charged to income as incurred. These expenses amounted to $6.1 million in fiscal 2009, $4.1 million in fiscal 2008 and $3.3 million in fiscal 2007. These costs primarily consist of salary and consulting expenses and are recorded in selling and operating expenses in each respective segment of the Company.
Pending accounting pronouncements
In December 2007, the Financial Accounting Standards Board (FASB) issued new accounting guidance on business combinations and noncontrolling interests in consolidated financial statements. This new guidance retains the fundamental requirements in previous guidance for business combinations requiring that the use
33
of the purchase method be used for all business combinations. The acquirer is required to recognize the assets acquired, the liabilities assumed, and any noncontrolling interest in the acquiree at the acquisition date, measured at their fair values as of that date, with limited exceptions as specified in the guidance. Additionally, business combinations will now require acquisition costs to be expensed as incurred, recognition of contingencies, restructuring costs associated with a business combination must generally be expensed prior to the acquisition date and changes in deferred tax asset valuation allowances and income tax uncertainties after the acquisition date generally will affect income tax expense. This guidance applies prospectively to business combinations for which the acquisition date is on or after the beginning of the first annual reporting period beginning on or after December 15, 2008, which is fiscal year 2010 for the Company. For acquisitions completed prior to September 27, 2009, the new guidance requires that changes in deferred tax asset valuation allowances and acquired income tax uncertainties after the measurement period must be recognized in earnings rather than as an adjustment to the cost of the acquisition. On November 13, 2009, the Company acquired the wholesale coffee and beverage business of Timothy’s Coffees of the World, Inc. This acquisition will be reported in accordance with this new accounting guidance. During fiscal 2009, the Company incurred approximately $400,000 of acquisition related expenses which are classified as general and administrative expense in the Statement of Operations. See Note 25 in the Consolidated Financial Statements included in this Form 10-K.
In February 2008, the FASB issued an update to delay the implementation of fair value measurements for nonfinancial assets and nonfinancial liabilities, except for items that are recognized or disclosed at fair value in the financial statements on a recurring basis. This deferral extends the effective date to fiscal years beginning after November 15, 2008, and interim periods within those fiscal years, which is fiscal year 2010 for the Company. The Company implemented fair value measurements for financial assets and liabilities in the first quarter of fiscal 2009. The Company is currently assessing the impact of fair value for nonfinancial assets and nonfinancial liabilities, but does not expect it to have a material impact on its financial statements.
In December 2007, the FASB updated guidance on noncontrolling interests in consolidated financial statements. The updated guidance establishes accounting and reporting standards for the noncontrolling interest in a subsidiary and for the deconsolidation of a subsidiary. It clarifies that a noncontrolling interest in a subsidiary is an ownership interest in the consolidated entity that should be reported as equity in the consolidated financial statements. The amount of net income attributable to the in the statement of operations. It clarifies that changes in a parent’s ownership interest in a subsidiary that do not result in deconsolidation are equity transactions if the parent retains its controlling financial interest. In addition, this guidance requires that a parent recognize a gain or loss in net income when a subsidiary is deconsolidated. This update is effective for fiscal years, and interim periods within those fiscal years, beginning on or after December 15, 2008, which is fiscal 2010 for the Company. The effect of adoption on the Company’s financial statements will depend primarily on the materiality of non-controlling interests arising in future transactions.
Off-Balance Sheet Arrangements
We do not have any off-balance sheet arrangements, and we do not have, nor do we engage in, transactions with any special purpose entities.
Forward-Looking Statements
Certain statements contained herein are not based on historical fact and are “forward-looking statements” within the meaning of the applicable securities laws and regulations. Generally, these statements can be identified by the use of words such as “anticipate,” “believe,”, “could,” “estimate,” “expect,” “feel,” “forecast,” “intend,” “may,” “plan,” “potential,” “project,” “should,” “would,” “and similar expressions intended to identify forward-looking statements, although not all forward-looking statements contain these identifying words. Owing to the uncertainties inherent in forward-looking statements, actual results could differ materially from those stated here. Factors that could cause actual results to differ materially from those in the forward-looking statements include, but are not limited to, the impact on sales and profitability of consumer sentiment in this difficult economic
34
environment, the Company’s success in efficiently expanding operations and capacity to meet growth, the Company’s success in efficiently and effectively integrating Tully’s and Timothy’s wholesale operations and capacity into its Specialty Coffee business unit, the Company’s success in acquiring and, if acquired, successfully integrating Diedrich’s operations, the Company’s success in introducing new product offerings, the ability of our lenders to honor their commitments under our credit facility, competition and other business conditions in the coffee industry and food industry in general, fluctuations in availability and cost of high-quality green coffee, any other increases in costs including fuel, Keurig’s ability to continue to grow and build profits with its roaster partners in the office and At Home and Away from Home businesses, the impact of the loss of major customers for the Company or reduction in the volume of purchases by major customers, delays in the timing of adding new locations with existing customers, the Company’s level of success in continuing to attract new customers, sales mix variances, weather and special or unusual events, as well as other risks described more fully in the Company’s filings with the SEC. Forward-looking statements reflect management’s analysis as of the date of this filing. The Company does not undertake to revise these statements to reflect subsequent developments, other than in its regular, quarterly earnings releases.
| Item 7A. | Quantitative and Qualitative Disclosures about Market Risk |
Market risks relating to our operations result primarily from changes in interest rates and the commodity “c” price of coffee (the price per pound quoted by the Coffee, Sugar and Cocoa Exchange). To address these risks, we enter into hedging transactions as described below. We do not use financial instruments for trading purposes.
For purposes of specific risk analysis, we use sensitivity analysis to determine the impacts that market risk exposures may have on our financial position or earnings.
Interest rate risks
The table below provides information about our debt obligations that are sensitive to changes in interest rates. The table presents principal cash flows and related weighted average interest rates by expected maturity dates.
| | | | | | | | | | | | | | | | | | | | | | | |
Expected maturity date | | 2010 | | | 2011 | | | 2012 | | | 2013 | | | 2014 | | Total | |
Long-term debt: | | | | | | | | | | | | | | | | | | | | | | | |
Variable rate (in thousands) | | $ | 1,250 | | | $ | — | | | $ | — | | | $ | 1,050 | | | $ | — | | $ | 2,300 | |
Average interest rate | | | 5.8 | % | | | — | | | | — | | | | 1.3 | % | | | — | | | 3.7 | % |
Fixed rate (in thousands) | | $ | 3,780 | | | $ | 5,008 | | | $ | 5,005 | | | $ | 61,950 | | | $ | — | | $ | 75,743 | |
Average interest rate | | | 7.3 | % | | | 7.3 | % | | | 7.3 | % | | | 6.2 | % | | | — | | | 0.0 | % |
At September 26, 2009, we had $2.3 million outstanding under our Credit Facility subject to variable interest rates. Should interest rates (LIBOR and Prime rates) increase by 100 basis points, we would incur additional interest expense of $23,000 annually. At September 27, 2008, we had $45.0 million subject to variable interest rates. As discussed further under the heading “Liquidity and Capital Resources” the Company is party to interest rate swap agreements.
The total notional amounts of these swaps at September 26, 2009, and September 27, 2008, was $75.7 million and $78.5 million, respectively. On September 26, 2009, the effect of these swaps was to limit the interest rate exposure on the outstanding balance of the Credit Facility to a fixed rate versus the 30-day Libor rate as follows: 5.4% on $25.7 million; 2.4% on $30.0 million; and 3.9% on $20.0 million. The total notional amount covered by these swaps will decrease progressively in future periods and terminates on various dates from June 2010 through December 2012.
Commodity price risks
The “c” price of coffee is subject to substantial price fluctuations caused by multiple factors, including weather and political and economic conditions in coffee-producing countries. Our gross profit margins can be significantly impacted by changes in the “c” price of coffee. We enter into fixed coffee purchase commitments in
35
an attempt to secure an adequate supply of coffee. These agreements are tied to specific market prices (defined by both the origin of the coffee and the time of delivery) but we have significant flexibility in selecting the date of the market price to be used in each contract. We generally fix the price of our coffee contracts three to nine months prior to delivery, so that we can adjust our sales prices to the market. At September 29, 2009, the Company had approximately $90.8 million in green coffee purchase commitments, of which approximately 46% had a fixed price. At September 27, 2008, the Company had approximately $73.2 million in green coffee purchase commitments, of which approximately 59% had a fixed price.
Commodity price risks at September 27, 2009 are as follows:
| | | | | | | | |
Purchase commitments | | Total Cost(1) | | Pounds | | “c” Price Range |
Fixed | | $ | 41,555,000 | | 23,639,000 | | $ | 1.14 - $1.51 |
Variable | | $ | 49,227,000 | | 27,695,000 | | $ | 1.00 - $1.41 |
| | | | | | | | |
| | $ | 90,782,000 | | 51,334,000 | | | |
| | | | | | | | |
| (1) | Total coffee costs typically include a premium or “differential” above the “c” price. |
Additionally, total coffee pounds include $3.6 million in fixed coffee prices (1.5 million pounds) that are not determined by the “c” price.
In addition, we regularly use commodity-based financial instruments to hedge price-to-be-established coffee purchase commitments with the objective of minimizing cost risk due to market fluctuations. These hedges generally qualify as cash flow hedges. Gains and losses are deferred in other comprehensive income until the hedged inventory sale is recognized in earnings, at which point gains and losses are added to cost of sales. At September 26, 2009, we held outstanding futures contracts covering 1,125,000 pounds of coffee with a fair market value of $90,000, gross of tax. At September 27, 2008, we held outstanding futures contracts covering 1,162,500 pounds of coffee with a fair market value of $(39,000), gross of tax. If we had terminated these contracts on September 26, 2009, we estimate that we would have recognized a gain of $90,000, gross of tax, which represented the fair market value on such date. The average contract price used to calculate the fair value of the contracts outstanding was $1.20 per pound as compared to the weighted average “c” price of $1.28 at September 26, 2009. If the “c” price were to drop on average by 10%, the loss incurred in fiscal 2010 will be approximately $144,000, gross of tax. However, this loss, if realized, would be offset by lower costs of coffee purchased during fiscal 2010.
| Item 8. | Financial Statements and Supplementary Data |
The consolidated financial statements and supplementary data of the Company required in this item are set forth beginning on page F-1 of this Form 10-K.
| Item 9. | Changes in and Disagreements with Accountants on Accounting and Financial Disclosure |
None.
| Item 9A. | Controls and Procedures |
Disclosure Controls and Procedures
The Company’s management, under the supervision and with the participation of the Company’s Chief Executive Officer and Chief Financial Officer, carried out an evaluation of the effectiveness of the design and operation of the Company’s disclosure controls and procedures as of September 26, 2009. Based upon this evaluation, the Company’s Chief Executive Officer and Chief Financial Officer concluded that the Company’s disclosure controls and procedures [as defined in Exchange Act Rule 13a-15(e)] are effective.
36
Management’s Report on Internal Control Over Financial Reporting
The Company’s management is responsible for establishing and maintaining adequate internal control over financial reporting. The Company’s internal control over financial reporting is a process designed under the supervision of its Chief Executive Officer and Chief Financial Officer to provide reasonable assurance regarding the reliability of financial reporting and the preparation of the Company’s financial statements for external purposes in accordance with generally accepted accounting principles. Management evaluates the effectiveness of the Company’s internal control over financial reporting using the criteria set forth by the Committee of Sponsoring Organizations of the Treadway Commission (COSO) in Internal Control—Integrated Framework.
As of September 26, 2009, the Company’s management with the participation of its Chief Executive Officer and Chief Financial Officer, conducted an evaluation of the effectiveness of the design and operation of the Company’s disclosure controls and procedures pursuant to Rule 13a-15 and 15d-15 under the Securities Exchange Act of 1934 (the “Exchange Act”). Based on the evaluation, our Chief Executive Officer and Chief Financial Officer concluded that the Company’s disclosure controls and procedures (as defined in Rule 13a-15 of the Exchange Act) are effective.
The attestation report of PricewaterhouseCoopers LLP is set forth under the heading “Report of Independent Registered Public Accounting Firm,” which is included in the Consolidated Financial Statements filed herewith.
Changes in Internal Control over Financial Reporting
There was no change in the Company’s internal control over financial reporting that occurred during the Company’s most recent fiscal quarter that has materially affected, or is reasonably likely to materially affect, the Company’s internal control over financial reporting.
| Item 9B. | Other Information |
None.
37
PART III
| Item 10. | Directors, Executive Officers and Corporate Governance |
Except for the information regarding the Company’s executive officers, the information called for by this Item is incorporated by reference in this report to our definitive Proxy Statement for the Company’s Annual Meeting of Stockholders to be held in March 2010, which will be filed not later than 120 days after the close of our fiscal year ended September 26, 2009 (the “Definitive Proxy Statement”).
For information concerning the executive officers of the Company, see “Executive Officers of the Registrant” in Part I of this Form 10-K.
| Item 11. | Executive Compensation |
The information required by this item will be incorporated by reference to the information contained in the Definitive Proxy Statement.
| Item 12. | Security Ownership of Certain Beneficial Owners and Management and Related Stockholder Matters |
The information required by this item will be incorporated by reference to the information contained in the Definitive Proxy Statement.
| Item 13. | Certain Relationships and Related Transactions, and Director Independence |
The information required by this item will be incorporated by reference to the information contained in the Definitive Proxy Statement.
| Item 14. | Principal Accounting Fees and Services |
The information required by this item will be incorporated by reference to the information contained in the Definitive Proxy Statement.
38
PART IV
| Item 15. | Exhibits and Financial Statement Schedules |
| | |
Exhibit No. | | Exhibit Title |
| 3.1 | | Certificate of Incorporation, as amended (incorporated by reference to Exhibit 3.1 in the Quarterly Report on Form 10-Q for the 12 weeks ended April 13, 2002). |
| |
| 3.1.1 | | Certificate of Amendment to Certificate of Incorporation, as amended, dated April 6, 2007 (incorporated by reference to Exhibit 3.1 in the Quarterly Report on Form 10-Q for the 12 weeks ended March 31, 2007). |
| |
| 3.2 | | Amended and Restated Bylaws of the Company (incorporated by reference to Exhibit 3.2 in the Annual Report on Form 10-K for the fiscal year ended September 27, 2008). |
| |
| 3.3 | | Certificate of Merger (incorporated by reference to Exhibit 3.3 in the Quarterly Report on Form 10-Q for the 16 weeks ended January 18, 2003). |
| |
| 4.1 | | Amended and Restated Revolving Credit Agreement dated as of December 3, 2007 among Green Mountain Coffee Roasters, Inc., its guarantor subsidiaries, Bank of America, N.A., Banc of America Securities LLC and the other lender parties thereto (incorporated by reference to Exhibit 4.1 in the Annual Report on Form 10-K for the fiscal year ended September 28, 2007). |
| |
| 4.2 | | Amendment No. 1 dated July 18, 2008 to Amended and Restated Revolving Credit Agreement dated as of December 3, 2007 among Green Mountain Coffee Roasters, Inc., its guarantor subsidiaries, Bank of America, N.A., Banc of America Securities LLC and the other lender parties thereto (incorporated by reference to Exhibit 4.2 in the Annual Report on Form 10-K for the fiscal year ended September 27, 2008). |
| |
| 4.3 | | Agreement to Exercise Facility Increase Option and Amendment No. 2 to Amend and Restate Revolving Credit Agreement dated as June 29, 2009 among Green Mountain Coffee Roasters, Inc., its guarantor subsidiaries, Bank of America, N.A., Banc of America Securities LLC and other lender parties thereto (incorporated by reference to Exhibit 4.1 in the Quarterly Report on Form 10-Q for the quarter ended June 27, 2009). |
| |
| 10.1 | | Amended and Restated Lease Agreement, dated November 6, 2007 between Pilgrim Partnership L.L.C. and Green Mountain Coffee, Inc. (incorporated by reference to Exhibit 10.1 in the Annual Report on Form 10-K for the fiscal year ended September 28, 2007). |
| |
| 10.2 | | Green Mountain Coffee Roasters, Inc. Amended and Restated Employee Stock Purchase Plan (incorporated by reference to Exhibit 10.2 in the Quarterly Report on Form 10-Q for the quarter ended March 29, 2008).* |
| |
| 10.3 | | 1999 Stock Option Plan of the Company (incorporated by reference to Exhibit 10.38 in the Quarterly Report on Form 10-Q for the 16 weeks ended January 18, 1999).* |
| |
| | (a) Form of Stock Option Agreement.* |
| |
| 10.4 | | Employment Agreement of Stephen J. Sabol dated as of July 1, 1993 (incorporated by reference to Exhibit 10.41 in the Registration Statement on Form SB-2 (Registration No. 33-66646) filed on July 28, 1993, and declared effective on September 21, 1993).* |
| |
| 10.5 | | 2000 Stock Option Plan of the Company (incorporated by reference to Exhibit 10.105 in the Annual Report on Form 10-K for the fiscal year ended September 30, 2000).* |
| |
| | (a) Form of Stock Option Agreement* |
39
| | |
Exhibit No. | | Exhibit Title |
| 10.6 | | Green Mountain Coffee Roasters, Inc., Employee Stock Ownership Plan. |
| |
| 10.6.1 | | Amendment to Green Mountain Coffee Roasters, Inc. Employee Stock Ownership Plan. |
| |
| 10.7 | | Green Mountain Coffee Roasters, Inc., Employee Stock Ownership Trust (incorporated by reference to Exhibit 10.114 in the Annual Report on Form 10-K for the fiscal year ended September 30, 2000). |
| |
| 10.8 | | Loan Agreement by and between the Green Mountain Coffee Roasters, Inc., Employee Stock Ownership Trust and Green Mountain Coffee, Inc., made and entered into as of April 16, 2001 (incorporated by reference to Exhibit 10.118 in the Quarterly Report on Form 10-Q for the 12 weeks ended April 14, 2001). |
| |
| 10.9 | | 2002 Deferred Compensation Plan, as amended (incorporated by reference to Exhibit 10.9 in the Annual Report on Form 10-K for the fiscal year ended September 27, 2008).* |
| |
| 10.10 | | Employment Agreement between Green Mountain Coffee Roasters, Inc. and Frances G. Rathke dated as of October 31, 2003 (incorporated by reference to Exhibit 10.6 in the Quarterly Report on Form 10-Q for the quarter ended March 28, 2009).* |
| |
| 10.11 | | Letter from Green Mountain Coffee Roasters, Inc. to Frances G. Rathke re: Deferred Compensation Agreement dated as December 7, 2006 (incorporated by reference to Exhibit 10.11 in the Annual Report on Form 10-K for the fiscal year ended September 27, 2008).* |
| |
| 10.12 | | Lease Agreement dated November 15, 2005 between Pilgrim Partnership, LLC and the Company (incorporated by reference to Exhibit 10.21 in Annual Report on Form 10-K for the fiscal year ended September 24, 2005). |
| |
| 10.13 | | Green Mountain Coffee Roasters, Inc. 2006 Incentive Plan, as amended (incorporated by reference to Appendix A of the Definitive Proxy Statement for the March 16, 2006 Annual Meeting of Stockholders).* |
| |
| 10.14 | | Amendment No. 1 dated December 9, 2008 to the Green Mountain Coffee Roasters, Inc. 2006 Incentive Plan, as amended (incorporated by reference to Exhibit 10.29 in the Annual Report on Form 10-K for the fiscal year ended September 27, 2008).* |
| |
| 10.15 | | Merger Agreement dated May 2, 2006 between Green Mountain Coffee Roasters, Inc., Karma Merger Sub, Inc., Keurig Incorporated, and a representative of the security holders of Keurig, Incorporated (incorporated by reference to Exhibit 10.1 to the Current Report on Form 8-K filed on June 20, 2006). |
| |
| 10.16 | | Amendment No. 1 dated June 15, 2006 to Merger Agreement dated May 2, 2006 between Green Mountain Coffee Roasters, Inc., Karma Merger Sub Inc., Keurig, Incorporated and a representative of the security holders of Keurig, Incorporated. (incorporated by reference to Exhibit 10.2 to the Quarterly Report on Form 10-Q for the quarter ended July 1, 2006). |
| |
| 10.17 | | Keurig, Incorporated Fifth Amended and Restated 1995 Stock Option Plan (incorporated by reference to Exhibit 4.1 to the Registration Statement on Form S-8 filed on June 22, 2006).* |
| |
| 10.18 | | Keurig, Incorporated 2005 Stock Option Plan (incorporated by reference to Exhibit 4.2 to the Registration Statement on Form S-8 filed on June 22, 2006).* |
| |
| 10.19 | | Employment Agreement dated May 3, 2007 between Green Mountain Coffee Roasters, Inc. and Lawrence J. Blanford (incorporated by reference to Exhibit 10.28 to the Annual Report on Form 10-K for the year ended September 28, 2007).* |
| |
| 10.20 | | Lease Agreement dated August 16, 2007 between Keurig, Incorporated and Brookview Investments, LLC. (incorporated by reference to Exhibit 10.29 to the Annual Report on Form 10-K for the year ended September 28, 2007). |
40
| | |
Exhibit No. | | Exhibit Title |
| 10.21 | | 2008 Change-In-Control Severance Benefit Plan (incorporated by reference to Exhibit 10.1 to the Quarterly Report on Form 10-Q for the quarter ended March 29, 2008). |
| |
| 10.22 | | Green Mountain Coffee Roasters, Inc. Senior Executive Officer Short Term Incentive Compensation Plan (incorporated by reference to Appendix D of the Definitive Proxy Statement for the March 13, 2008 Annual Meeting of Stockholders).* |
| |
| 10.23 | | Agreement of Sale dated June 2, 2008 by and between MS Plant, LLC and Green Mountain Coffee Roasters, Inc. (incorporated by reference to Exhibit 10.1 to the Quarterly Report on Form 10-Q for the quarter ended June 28, 2008). |
| |
| 10.24 | | Asset Purchase Agreement dated September 15, 2008 by and between Green Mountain Coffee Roasters, Inc., Tully’s Coffee Corporation and Tully’s Bellaccino, LLC (incorporated by reference to Exhibit 10.26 in the Annual Report on Form 10-K for the fiscal year ended September 27, 2008). |
| |
| 10.25 | | Amendment No. 1 dated November 12, 2008 to Asset Purchase Agreement by and between Tully’s Coffee Corporation, Tully’s Bellaccino, LLC and Green Mountain Coffee Roasters, Inc. dated September 15, 2008 (incorporated by reference to Exhibit 10.28 in the Annual Report on Form 10-K for the fiscal year ended September 27, 2008). |
| |
| 10.26 | | Amendment No. 2 to Asset Purchase Agreement dated February 6, 2009 by and between Green Mountain Coffee Roasters, Inc., Tully’s Coffee Corporation and Tully’s Bellaccino, LLC (incorporated by reference to Exhibit 10.3 on Form 8-K dated March 27, 2009). |
| |
| 10.27 | | Settlement and License Agreement dated October 23, 2008 by and between Keurig, Incorporated and Kraft Foods Inc., Kraft Foods Global Inc., and Tassimo Corporation (incorporated by reference to Exhibit 10.27 in the Annual Report on Form 10-K for the fiscal year ended September 27, 2008). |
| |
| 10.28 | | Letter from Green Mountain Coffee Roasters, Inc. to Kathy Brooks re: Offer Letter dated as March 18, 2001 (incorporated by reference to Exhibit 10.1 to the Quarterly Report on Form 10-Q for the quarter ended December 27, 2008).* |
| |
| 10.29 | | Letter from Green Mountain Coffee Roasters, Inc. to Scott McCreary re: Offer Letter dated as September 10, 2004 (incorporated by reference to Exhibit 10.2 to the Quarterly Report on Form 10-Q for the quarter ended December 27, 2008).* |
| |
| 10.30 | | Letter from Green Mountain Coffee Roasters, Inc. to Howard Malovany re: Offer Letter dated as January 8, 2009 (incorporated by reference to Exhibit 10.1 to the Quarterly Report on Form 10-Q for the quarter ended March 28, 2009).* |
| |
| 10.31 | | Letter from Green Mountain Coffee Roasters, Inc. to Michelle Stacy re: Offer Letter dated as March 16, 2009 (incorporated by reference to Exhibit 10.2 to the Quarterly Report on Form 10-Q for the quarter ended March 28, 2009).* |
| |
| 10.32 | | Letter from Green Mountain Coffee Roasters, Inc. to Scott McCreary re: Letter Amendment dated as December 29, 2008 (incorporated by reference to Exhibit 10.3 to the Quarterly Report on Form 10-Q for the quarter ended March 28, 2009).* |
| |
| 10.33 | | Letter from Green Mountain Coffee Roasters, Inc. to Kathy Brooks re: Letter Amendment dated as December 29, 2008 (incorporated by reference to Exhibit 10.4 to the Quarterly Report on Form 10-Q for the quarter ended March 28, 2009).* |
| |
| 10.34 | | Letter from Green Mountain Coffee Roasters, Inc. to Steve Sabol re: Letter Amendment dated as December 31, 2008 (incorporated by reference to Exhibit 10.5 to the Quarterly Report on Form 10-Q for the quarter ended March 28, 2009).* |
41
| | |
Exhibit No. | | Exhibit Title |
| 10.35 | | Share Purchase Agreement dated November 13, 2009 by and between Timothy’s Coffees of the World, Inc., World Coffee Group S.á.r.l., Green Mountain Coffee Roasters, Inc. and Timothy’s Acquisition Corporation (incorporated by reference to Exhibit 2.1 on Form 8-K dated November 13, 2009). |
| |
| 14. | | Green Mountain Coffee Roasters Finance Code of Professional Conduct (incorporated by reference to Exhibit 14 in Annual Report on Form 10-K for the fiscal year ended September 27, 2003). |
| |
| 21. | | Subsidiary List (incorporated by reference to Exhibit 21 to the Annual Report on Form 10-K for the year ended September 29, 2007). |
| |
| 23. | | Consent of PricewaterhouseCoopers LLP. |
| |
| 31.1 | | Principal Executive Officer Certification Pursuant to Securities Exchange Act Rules 13a-14 and 15d-14 as Adopted Pursuant to the Section 302 of the Sarbanes-Oxley Act of 2002. |
| |
| 31.2 | | Principal Financial Officer Certification Pursuant to Securities Exchange Act Rules 13a-14 and 15d-14 as Adopted Pursuant to the Section 302 of the Sarbanes-Oxley Act of 2002. |
| |
| 32.1 | | Principal Executive Officer Certification Pursuant 18 U.S.C. Section 1350 as Adopted Pursuant to Section 906 of the Sarbanes-Oxley Act of 2002. |
| |
| 32.2 | | Principal Financial Officer Certification Pursuant 18 U.S.C. Section 1350 as Adopted Pursuant to Section 906 of the Sarbanes-Oxley Act of 2002. |
| * | Management contract or compensatory plan |
42
SIGNATURES
Pursuant to the requirements of Section 13 or 15(d) of the Securities and Exchange Act of 1934, the Registrant caused this Report to be signed on its behalf by the undersigned, thereunto duly authorized.
GREEN MOUNTAIN COFFEE ROASTERS, INC.
| | |
| |
| By: | | /s/ Frances G. Rathke |
| | FRANCES G. RATHKE Chief Financial Officer, Treasurer and Secretary |
Pursuant to the requirements of the Securities and Exchange Act of 1934, this report has been signed below by the following persons on behalf of the Registrant and in the capacities and on the dates indicated.
| | | | |
Signature | | Title | | Date |
| | |
/s/ Lawrence J. Blanford LAWRENCE J. BLANFORD | | President, Chief Executive Officer
and Director (Principal Executive Officer) | | November 25, 2009 |
| | |
/s/ Frances G. Rathke FRANCES G. RATHKE | | Chief Financial Officer, Treasurer, and Secretary (Principal Financial
and Accounting Officer) | | November 25, 2009 |
| | |
/s/ Robert P. Stiller ROBERT P. STILLER | | Chairman of the Board of
Directors and Founder | | November 25, 2009 |
| | |
/s/ Barbara Carlini BARBARA CARLINI | | Director | | November 25, 2009 |
| | |
/s/ William D. Davis WILLIAM D. DAVIS | | Director | | November 25, 2009 |
| | |
/s/ Jules A. Del Vecchio JULES A. DEL VECCHIO | | Director | | November 25, 2009 |
| | |
/s/ Michael Mardy MICHAEL MARDY | | Director | | November 25, 2009 |
| | |
/s/ Hinda Miller HINDA MILLER | | Director | | November 25, 2009 |
| | |
/s/ David E. Moran DAVID E. MORAN | | Director | | November 25, 2009 |
43
GREEN MOUNTAIN COFFEE ROASTERS, INC.
Index to Consolidated Financial Statements
F-1
Report of Independent Registered Public Accounting Firm
To the Board of Directors and the Stockholders of Green Mountain Coffee Roasters, Inc.
In our opinion, the consolidated financial statements listed in the accompanying index on page F-1 present fairly, in all material respects, the financial position of Green Mountain Coffee Roasters, Inc. and its subsidiary at September 26, 2009 and September 27, 2008, and the results of their operations and their cash flows for each of the three years in the period ended September 26, 2009 in conformity with accounting principles generally accepted in the United States of America. In addition, in our opinion, the financial statement schedule listed in the accompanying index on page F-1 presents fairly, in all material respects, the information set forth therein when read in conjunction with the related consolidated financial statements. Also in our opinion, the Company maintained, in all material respects, effective internal control over financial reporting as of September 26, 2009, based on criteria established inInternal Control—Integrated Framework issued by the Committee of Sponsoring Organizations of the Treadway Commission (COSO). The Company’s management is responsible for these financial statements and financial statement schedule, for maintaining effective internal control over financial reporting and for its assessment of the effectiveness of internal control over financial reporting, included in Management’s Report on Internal Control over Financial Reporting appearing under item 9A. Our responsibility is to express opinions on these financial statements, on the financial statement schedule, and on the Company’s internal control over financial reporting based on our integrated audits. We conducted our audits in accordance with the standards of the Public Company Accounting Oversight Board (United States). Those standards require that we plan and perform the audits to obtain reasonable assurance about whether the financial statements are free of material misstatement and whether effective internal control over financial reporting was maintained in all material respects. Our audits of the financial statements included examining, on a test basis, evidence supporting the amounts and disclosures in the financial statements, assessing the accounting principles used and significant estimates made by management, and evaluating the overall financial statement presentation. Our audit of internal control over financial reporting included obtaining an understanding of internal control over financial reporting, assessing the risk that a material weakness exists, and testing and evaluating the design and operating effectiveness of internal control based on the assessed risk. Our audits also included performing such other procedures as we considered necessary in the circumstances. We believe that our audits provide a reasonable basis for our opinions.
As discussed in Note 15 to the consolidated financial statements, effective September 28, 2008, the Company has changed the manner in which it evaluates the fair value of financial instruments.
Also as discussed in Note 7 to the consolidated financial statements, effective September 30, 2007, the Company has changed the manner in which it evaluates uncertain tax positions.
A company’s internal control over financial reporting is a process designed to provide reasonable assurance regarding the reliability of financial reporting and the preparation of financial statements for external purposes in accordance with generally accepted accounting principles. A company’s internal control over financial reporting includes those policies and procedures that (i) pertain to the maintenance of records that, in reasonable detail, accurately and fairly reflect the transactions and dispositions of the assets of the company; (ii) provide reasonable assurance that transactions are recorded as necessary to permit preparation of financial statements in accordance with generally accepted accounting principles, and that receipts and expenditures of the company are being made only in accordance with authorizations of management and directors of the company; and (iii) provide reasonable assurance regarding prevention or timely detection of unauthorized acquisition, use, or disposition of the company’s assets that could have a material effect on the financial statements.
Because of its inherent limitations, internal control over financial reporting may not prevent or detect misstatements. Also, projections of any evaluation of effectiveness to future periods are subject to the risk that controls may become inadequate because of changes in conditions, or that the degree of compliance with the policies or procedures may deteriorate.
/s/ PricewaterhouseCoopers LLP
Boston, Massachusetts
November 25, 2009
F-2
GREEN MOUNTAIN COFFEE ROASTERS, INC.
CONSOLIDATED BALANCE SHEETS
(Dollars in thousands)
| | | | | | | | |
| | | September 26,
2009 | | | September 27,
2008 | |
| Assets | | | | | | | | |
Current assets: | | | | | | | | |
Cash and cash equivalents | | $ | 241,811 | | | $ | 804 | |
Restricted cash and cash equivalents | | | 280 | | | | 161 | |
Short-term investments | | | 50,000 | | | | — | |
Receivables, less uncollectible accounts and return allowances of $4,792 and $3,002 at September 26, 2009 and September 27, 2008, respectively | | | 91,559 | | | | 54,782 | |
Inventories | | | 137,294 | | | | 85,311 | |
Other current assets | | | 6,706 | | | | 4,886 | |
Deferred income taxes, net | | | 10,151 | | | | 6,146 | |
| | | | | | | | |
Total current assets | | | 537,801 | | | | 152,090 | |
Fixed assets, net | | | 135,981 | | | | 97,678 | |
Intangibles, net | | | 36,478 | | | | 29,396 | |
Goodwill | | | 99,600 | | | | 73,953 | |
Other long-term assets | | | 3,979 | | | | 4,531 | |
| | | | | | | | |
Total assets | | $ | 813,839 | | | $ | 357,648 | |
| | | | | | | | |
| Liabilities and Stockholders’ Equity | | | | | | | | |
Current liabilities: | | | | | | | | |
Current portion of long-term debt | | $ | 5,030 | | | $ | 33 | |
Accounts payable | | | 76,961 | | | | 43,821 | |
Accrued compensation costs | | | 17,264 | | | | 11,669 | |
Accrued expenses | | | 18,570 | | | | 14,645 | |
Income tax payable | | | 2,971 | | | | 2,079 | |
Other short-term liabilities | | | 3,257 | | | | 673 | |
| | | | | | | | |
Total current liabilities | | | 124,053 | | | | 72,920 | |
Long-term debt | | | 73,013 | | | | 123,517 | |
Deferred income taxes, net | | | 26,599 | | | | 21,691 | |
Commitments and contingencies (See Notes 5 and 22) | | | | | | | | |
Stockholders’ equity: | | | | | | | | |
Preferred stock, $0.10 par value: Authorized—1,000,000 shares; No shares issued or outstanding | | | — | | | | — | |
Common stock, $0.10 par value: Authorized—60,000,000 shares; Issued—43,603,684 and 41,690,466 shares at September 26, 2009 and September 27, 2008, respectively | | | 4,360 | | | | 4,169 | |
Additional paid-in capital | | | 450,596 | | | | 61,987 | |
Retained earnings | | | 137,162 | | | | 81,280 | |
Accumulated other comprehensive loss | | | (1,870 | ) | | | (419 | ) |
ESOP unallocated shares, at cost—12,687 and 27,194 shares at September 26, 2009 and September 27, 2008, respectively | | | (74 | ) | | | (161 | ) |
Treasury shares, at cost—0 and 5,208,993 shares at September 26, 2009 and September 27, 2008, respectively | | | — | | | | (7,336 | ) |
| | | | | | | | |
Total stockholders’ equity | | | 590,174 | | | | 139,520 | |
| | | | | | | | |
Total liabilities and stockholders’ equity | | $ | 813,839 | | | $ | 357,648 | |
| | | | | | | | |
The accompanying Notes to Consolidated Financial Statements are an integral part of these financial statements.
F-3
GREEN MOUNTAIN COFFEE ROASTERS, INC.
CONSOLIDATED STATEMENTS OF OPERATIONS (Dollars in thousands except per share data)
| | | | | | | | | | | | |
| | | Fifty-two weeks ended
September 26,
2009 | | | Fifty-two weeks ended
September 27,
2008 | | | Fifty-two weeks ended
September 29,
2007 | |
Net sales | | $ | 803,045 | | | $ | 500,277 | | | $ | 341,651 | |
Cost of sales | | | 553,281 | | | | 323,372 | | | | 210,530 | |
| | | | | | | | | | | | |
Gross profit | | | 249,764 | | | | 176,905 | | | | 131,121 | |
Selling and operating expenses | | | 123,948 | | | | 92,182 | | | | 72,641 | |
General and administrative expenses | | | 47,103 | | | | 39,032 | | | | 30,293 | |
Patent litigation (settlement) expense | | | (17,000 | ) | | | 3,279 | | | | 488 | |
| | | | | | | | | | | | |
Operating income | | | 95,713 | | | | 42,412 | | | | 27,699 | |
Other income (expense) | | | (662 | ) | | | (235 | ) | | | 54 | |
Interest expense | | | (4,693 | ) | | | (5,705 | ) | | | (6,176 | ) |
| | | | | | | | | | | | |
Income before income taxes | | | 90,358 | | | | 36,472 | | | | 21,577 | |
Income tax expense | | | (34,476 | ) | | | (14,173 | ) | | | (8,734 | ) |
| | | | | | | | | | | | |
Net income | | $ | 55,882 | | | $ | 22,299 | | | $ | 12,843 | |
| | | | | | | | | | | | |
Basic income per share: | | | | | | | | | | | | |
Weighted average shares outstanding | | | 37,993,196 | | | | 35,924,697 | | | | 34,875,647 | |
Net income | | $ | 1.47 | | | $ | 0.62 | | | $ | 0.37 | |
| | | |
Diluted income per share: | | | | | | | | | | | | |
Weighted average shares outstanding | | | 40,123,553 | | | | 38,347,170 | | | | 37,160,060 | |
Net income | | $ | 1.39 | | | $ | 0.58 | | | $ | 0.35 | |
The accompanying Notes to Consolidated Financial Statements are an integral part of these financial statements.
F-4
GREEN MOUNTAIN COFFEE ROASTERS, INC.
CONSOLIDATED STATEMENTS OF CHANGES IN STOCKHOLDERS’ EQUITY FOR EACH OF THE THREE YEARS IN THE PERIOD ENDED SEPTEMBER 26, 2009, (Dollars in thousands)
| | | | | | | | | | | | | | | | | | | | | | | | | | | | | | | | | | |
| | | Common stock | | Additional
paid-in
capital | | | Retained
earnings | | Accumulated
other
compre-
hensive (loss) | | | ESOP
unallocated
shares | | | Treasury stock | | | Stockholders’
Equity | |
| | | Shares | | Amount | | | | | Shares | | | Amount | | | Shares | | | Amount | | |
Balance at October 1, 2006 | | 39,539,273 | | $ | 3,953 | | $ | 32,996 | | | $ | 46,138 | | $ | (548 | ) | | (43,965 | ) | | $ | (263 | ) | | (5,208,993 | ) | | $ | (7,336 | ) | | $ | 74,940 | |
Options exercised | | 851,259 | | | 85 | | | 1,912 | | | | | | | | | | | | | | | | | | | | | | | | | 1,997 | |
Issuance of common stock under employee stock purchase plan | | 127,642 | | | 13 | | | 1,113 | | | | | | | | | | | | | | | | | | | | | | | | | 1,126 | |
Allocation of ESOP shares | | | | | | | | 145 | | | | | | | | | | 9,039 | | | | 55 | | | | | | | | | | | 200 | |
Tax expense from allocation of ESOP shares | | | | | | | | (59 | ) | | | | | | | | | | | | | | | | | | | | | | | | (59 | ) |
Stock compensation expense | | | | | | | | 4,552 | | | | | | | | | | | | | | | | | | | | | | | | | 4,552 | |
Tax benefit from exercise of options | | | | | | | | 3,412 | | | | | | | | | | | | | | | | | | | | | | | | | 3,412 | |
Deferred compensation expense | | | | | | | | 51 | | | | | | | | | | | | | | | | | | | | | | | | | 51 | |
Other comprehensive income, net of tax | | | | | | | | | | | | | | | 36 | | | | | | | | | | | | | | | | | | 36 | |
Net income | | — | | | — | | | — | | | | 12,843 | | | — | | | — | | | | — | | | — | | | | — | | | | 12,843 | |
| | | | | | | | | | | | | | | | | | | | | | | | | | | | | | | | | | |
Balance at September 29, 2007 | | 40,518,174 | | $ | 4,051 | | $ | 44,122 | | | $ | 58,981 | | $ | (512 | ) | | (34,926 | ) | | $ | (208 | ) | | (5,208,993 | ) | | $ | (7,336 | ) | | $ | 99,098 | |
Options exercised | | 1,058,319 | | | 106 | | | 3,522 | | | | | | | | | | | | | | | | | | | | | | | | | 3,628 | |
Issuance of common stock under employee stock purchase plan | | 113,973 | | | 12 | | | 2,014 | | | | | | | | | | | | | | | | | | | | | | | | | 2,026 | |
Allocation of ESOP shares | | | | | | | | 153 | | | | | | | | | | 7,732 | | | | 47 | | | | | | | | | | | 200 | |
Tax expense from allocation of ESOP shares | | | | | | | | (61 | ) | | | | | | | | | | | | | | | | | | | | | | | | (61 | ) |
Stock compensation expense | | | | | | | | 6,348 | | | | | | | | | | | | | | | | | | | | | | | | | 6,348 | |
Tax benefit from exercise of options | | | | | | | | 5,782 | | | | | | | | | | | | | | | | | | | | | | | | | 5,782 | |
Deferred compensation expense | | | | | | | | 107 | | | | | | | | | | | | | | | | | | | | | | | | | 107 | |
Other comprehensive income, net of tax | | | | | | | | | | | | | | | 93 | | | | | | | | | | | | | | | | | | 93 | |
Net income | | — | | | — | | | — | | | | 22,299 | | | — | | | — | | | | — | | | — | | | | — | | | | 22,299 | |
| | | | | | | | | | | | | | | | | | | | | | | | | | | | | | | | | | |
Balance at September 27, 2008 | | 41,690,466 | | | 4,169 | | | 61,987 | | | | 81,280 | | | (419 | ) | | (27,194 | ) | | | (161 | ) | | (5,208,993 | ) | | | (7,336 | ) | | | 139,520 | |
Options exercised | | 1,267,456 | | | 127 | | | 5,645 | | | | | | | | | | | | | | | | | | | | | | | | | 5,772 | |
Issuance of common stock under employee stock purchase plan | | 104,755 | | | 10 | | | 2,468 | | | | | | | | | | | | | | | | | | | | | | | | | 2,478 | |
Allocation of ESOP shares | | | | | | | | 912 | | | | | | | | | | 14,507 | | | | 87 | | | | | | | | | | | 999 | |
Issuance of common stock for public equity offering | | 541,007 | | | 54 | | | 34,739 | | | | | | | | | | | | | | | | | | | | | | | | | 34,793 | |
Issuance of common stock from treasury for public equity offering | | | | | | | | 327,664 | | | | | | | | | | | | | | | | | 5,208,993 | | | | 7,336 | | | | 335,000 | |
Stock compensation expense | | | | | | | | 6,697 | | | | | | | | | | | | | | | | | | | | | | | | | 6,697 | |
Tax benefit from exercise of options | | | | | | | | 10,362 | | | | | | | | | | | | | | | | | | | | | | | | | 10,362 | |
Deferred compensation expense | | | | | | | | 122 | | | | | | | | | | | | | | | | | | | | | | | | | 122 | |
Other comprehensive income, net of tax | | | | | | | | | | | | | | | (1,451 | ) | | | | | | | | | | | | | | | | | (1,451 | ) |
Net income | | — | | | — | | | — | | | | 55,882 | | | — | | | — | | | | — | | | — | | | | — | | | | 55,882 | |
| | | | | | | | | | | | | | | | | | | | | | | | | | | | | | | | | | |
Balance at September 26, 2009 | | 43,603,684 | | $ | 4,360 | | $ | 450,596 | | | $ | 137,162 | | $ | (1,870 | ) | | (12,687 | ) | | $ | (74 | ) | | — | | | $ | — | | | $ | 590,174 | |
| | | | | | | | | | | | | | | | | | | | | | | | | | | | | | | | | | |
The accompanying Notes to Consolidated Financial Statements are an integral part of these financial statements.
F-5
GREEN MOUNTAIN COFFEE ROASTERS, INC.
CONSOLIDATED STATEMENTS OF COMPREHENSIVE INCOME
(Dollars in thousands)
| | | | | | | | | | |
| | | Fifty-two weeks ended
September 26, 2009 | | | Fifty-two weeks ended
September 27, 2008 | | Fifty-two weeks ended
September 29, 2007 |
Net income | | $ | 55,882 | | | $ | 22,299 | | $ | 12,843 |
Other comprehensive income, net of tax: | | | | | | | | | | |
Deferred (loss) gain on derivatives designated as cash flow hedges | | | (1,715 | ) | | | 87 | | | 10 |
Loss on derivatives designated as cash flow hedges reclassified to net income | | | 264 | | | | 6 | | | 26 |
| | | | | | | | | | |
Other comprehensive (loss) gain | | | (1,451 | ) | | | 93 | | | 36 |
| | | | | | | | | | |
Comprehensive income | | $ | 54,431 | | | $ | 22,392 | | $ | 12,879 |
| | | | | | | | | | |
The accompanying Notes to Consolidated Financial Statements are an integral part of these financial statements.
F-6
GREEN MOUNTAIN COFFEE ROASTERS, INC.
CONSOLIDATED STATEMENTS OF CASH FLOWS
(Dollars in thousands)
| | | | | | | | | | | | |
| | | Fifty-two weeks ended
September 26, 2009 | | | Fifty-two weeks ended
September 27, 2008 | | | Fifty-two weeks ended
September 29, 2007 | |
Cash flows from operating activities: | | | | | | | | | | | | |
Net income | | $ | 55,882 | | | $ | 22,299 | | | $ | 12,843 | |
Adjustments to reconcile net income to net cash provided by operating activities: | | | | | | | | | | | | |
Depreciation | | | 17,987 | | | | 13,500 | | | | 10,328 | |
Amortization of intangibles | | | 5,318 | | | | 4,812 | | | | 4,811 | |
Loss on disposal of fixed assets | | | 679 | | | | 201 | | | | 133 | |
Provision for doubtful accounts | | | 243 | | | | 1,159 | | | | 620 | |
Loss on futures derivatives | | | 264 | | | | 6 | | | | 26 | |
Tax expense from exercise of non-qualified options and disqualified dispositions of incentive stock options | | | (399 | ) | | | (386 | ) | | | 105 | |
Excess tax benefits from equity-based compensation plans | | | (10,761 | ) | | | (6,168 | ) | | | (3,307 | ) |
Tax expense from allocation of ESOP shares | | | (3 | ) | | | (61 | ) | | | (59 | ) |
Deferred income taxes | | | 1,683 | | | | 549 | | | | 145 | |
Deferred compensation and stock compensation | | | 6,819 | | | | 6,455 | | | | 4,603 | |
Contributions to the ESOP | | | 1,000 | | | | 200 | | | | 200 | |
Changes in assets and liabilities, net of effects of acquisition: | | | | | | | | | | | | |
Receivables | | | (37,020 | ) | | | (16,568 | ) | | | (9,922 | ) |
Inventories | | | (49,792 | ) | | | (46,402 | ) | | | (6,983 | ) |
Income tax payable | | | 11,653 | | | | 6,804 | | | | 5,368 | |
Other current assets | | | (1,850 | ) | | | (1,882 | ) | | | (141 | ) |
Other long-term assets, net | | | 1,769 | | | | (660 | ) | | | (52 | ) |
Accounts payable | | | 25,834 | | | | 8,667 | | | | 8,969 | |
Accrued compensation costs | | | 5,595 | | | | 4,642 | | | | 291 | |
Accrued expenses | | | 3,597 | | | | 4,779 | | | | 1,856 | |
| | | | | | | | | | | | |
Net cash provided by operating activities | | | 38,498 | | | | 1,946 | | | | 29,834 | |
Cash flows from investing activities: | | | | | | | | | | | | |
Acquisition of certain assets of Tully’s Coffee Corporation | | | (41,361 | ) | | | — | | | | — | |
Purchases of short-term investments | | | (50,000 | ) | | | — | | | | — | |
Capital expenditures for fixed assets | | | (48,298 | ) | | | (48,718 | ) | | | (21,844 | ) |
Proceeds from disposal of fixed assets | | | 162 | | | | 407 | | | | 187 | |
| | | | | | | | | | | | |
Net cash used for investing activities | | | (139,497 | ) | | | (48,311 | ) | | | (21,657 | ) |
Cash flows from financing activities: | | | | | | | | | | | | |
Net change in revolving line of credit | | | (95,500 | ) | | | 33,500 | | | | (12,800 | ) |
Proceeds from issuance of common stock under compensation plans | | | 8,253 | | | | 5,653 | | | | 3,123 | |
Proceeds from issuance of common stock for public equity offering | | | 386,688 | | | | — | | | | — | |
Financing costs in connection with public equity offering | | | (16,895 | ) | | | — | | | | — | |
Excess tax benefits from equity-based compensation plans | | | 10,761 | | | | 6,168 | | | | 3,307 | |
Proceeds from borrowings of long-term debt | | | 50,000 | | | | — | | | | 45 | |
Deferred financing fees | | | (1,084 | ) | | | (907 | ) | | | — | |
Repayment of long-term debt | | | (217 | ) | | | (63 | ) | | | (100 | ) |
| | | | | | | | | | | | |
Net cash provided by (used for) financing activities | | | 342,006 | | | | 44,351 | | | | (6,425 | ) |
Net increase (decrease) in cash and cash equivalents | | | 241,007 | | | | (2,014 | ) | | | 1,752 | |
Cash and cash equivalents at beginning of period | | | 804 | | | | 2,818 | | | | 1,066 | |
| | | | | | | | | | | | |
Cash and cash equivalents at end of period | | $ | 241,811 | | | $ | 804 | | | $ | 2,818 | |
| | | | | | | | | | | | |
Supplemental disclosures of cash flow information: | | | | | | | | | | | | |
Cash paid for interest | | $ | 5,118 | | | $ | 6,087 | | | $ | 6,654 | |
Cash paid for income taxes | | $ | 20,368 | | | $ | 6,701 | | | $ | 3,184 | |
Fixed asset purchases included in accounts payable and not disbursed at the end of each year | | $ | 12,509 | | | $ | 5,203 | | | $ | 7,827 | |
Noncash financing activity: | | | | | | | | | | | | |
Debt assumed in conjunction with acquisition of certain assets of Tully’s Coffee Corporation | | $ | 210 | | | $ | — | | | $ | — | |
The accompanying Notes to Consolidated Financial Statements are an integral part of these financial statements.
F-7
GREEN MOUNTAIN COFFEE ROASTERS, INC.
NOTES TO CONSOLIDATED FINANCIAL STATEMENTS
| 1. | Nature of Business and Organization |
Green Mountain Coffee Roasters, Inc. (together with its subsidiaries, “the Company” or “GMCR, Inc.”) is a leader in the specialty coffee and coffee maker businesses. Green Mountain Coffee Roasters, Inc. is a Delaware company.
The Company manages its operations through two business segments, Specialty Coffee business unit (SCBU) and Keurig business unit (Keurig).
SCBU sells whole bean and ground coffee selections, and K-Cups® in domestic wholesale and retail channels and directly to consumers. In addition, SCBU sells Keurig® single-cup brewing systems and other accessories directly to consumers and more recently to supermarkets.
Keurig is a pioneer and leading manufacturer of gourmet single-cup brewing systems and targets its premium patented single-cup brewing systems for consumers at home (AH) or away-from-home (AFH) mainly in North America. Keurig sells its AFH single-cup brewers to distributors for offices and its AH single-cup brewers to select retailers such as department stores and club stores. Keurig sells coffee, tea and cocoa in K-Cups produced by a variety of roasters, including SCBU, and related accessories to select retailers such as department stores and club stores and also directly to consumers. Keurig earns royalty income from the sale of K-Cups shipped by its licensed roasters.
The Company’s fiscal year ends on the last Saturday in September. Fiscal 2009, 2008 and fiscal 2007 represent the years ended September 26, 2009, September 27, 2008, and September 29, 2007, respectively. Each of these fiscal years consists of 52 weeks.
| 2. | Significant Accounting Policies |
Use of estimates
The preparation of financial statements in conformity with accounting principles generally accepted in the United States of America requires the Company to make estimates and assumptions that affect amounts reported in the accompanying consolidated financial statements. Actual results could differ from those estimates.
Basis of Consolidation
The consolidated financial statements include the accounts of the Company and its subsidiaries. All intercompany transactions have been eliminated in consolidation.
Cash and cash equivalents
The Company considers all highly liquid investments purchased with a maturity of three months or less to be cash equivalents. Cash and cash equivalents include money market funds which are carried at cost, plus accrued interest, which approximates fair value. The Company does not believe that it is subject to any unusual credit or market risk.
Short-term Investments
Short-term investments consist of highly liquid investments, primarily certificates of deposit, with maturities over three months from the date of purchase. These assets are carried at cost, plus accrued interest, which approximates fair value due to the short maturity of these instruments.
F-8
GREEN MOUNTAIN COFFEE ROASTERS, INC.
NOTES TO CONSOLIDATED FINANCIAL STATEMENTS—(Continued)
Inventories
Inventories are stated at the lower of cost or market. Cost is being measured using an adjusted standard cost method which approximates FIFO (first-in first-out). The Company regularly reviews whether the realizable value of inventory is lower than its book value. If the valuation shows that the realizable value is lower than book value, a charge is taken to expense and directly reduces the value of the inventory.
The Company estimates its reserves for inventory obsolescence by examining its inventories on a quarterly basis to determine if there are indicators that the carrying values exceed net realizable value. Indicators that could result in additional inventory write downs include age of inventory, damaged inventory, slow moving products and products at the end of their life cycles. While management believes that the reserve for obsolete inventory is adequate, significant judgment is involved in determining the adequacy of this reserve.
Inventories consist primarily of green and roasted coffee, including coffee in portion packs, purchased finished goods such as coffee brewers and packaging materials.
Financial Instruments
The Company enters into various types of financial instruments in the normal course of business. Fair values are estimated based on assumptions concerning the amount and timing of estimated future cash flows and assumed discount rates reflecting varying degrees of perceived risk. Cash, cash equivalents, accounts receivable, accounts payable and accrued expenses are reported at carrying value and approximate fair value due to the short maturity of these instruments. Long-term debt is also reported at carrying value and approximates fair value due to the fact that the interest rate on the debt is based on variable interest rates (Libor or prime).
The fair value of short-term investments and derivative financial instruments have been determined using market information and valuation methodologies. Changes in assumptions or estimates could affect the determination of fair value, however, management does not believe any such changes would have a material impact on our financial condition, results of operations or cash flows. The fair values of short-term investments and derivative financial instruments are disclosed in Note 15.
Hedging Activities
The Company enters into coffee futures contracts to hedge against price increases in price-to-be-fixed coffee purchase commitments and anticipated coffee purchases. The Company also enters into interest rate swaps to hedge against unfavorable changes in interest rates. These derivative instruments qualify for hedge accounting if the hedging relationship is expected to be highly effective. Effectiveness is determined by how closely the changes in the fair value of the derivative instrument offset the changes in the fair value of the hedged item. If the derivative is determined to qualify for hedge accounting, the effective portion of the change in the fair value of the derivative instrument is recorded in other comprehensive income and recognized in earnings when the related hedged item is sold. The ineffective portion of the change in the fair value of the derivative instrument is recorded directly to earnings. If these derivative instruments do not qualify for hedge accounting, the Company would record the changes in the fair value of the derivative instruments directly to earnings. See Notes 13 and 14.
The Company formally documents hedging instruments and hedged items, and measures at each balance sheet date the effectiveness of its hedges. When it is determined that a derivative is not highly effective, the derivative expires, or is sold or terminated, or the derivative is discontinued because it is unlikely that a forecasted transaction will occur, the Company discontinues hedge accounting prospectively for that specific hedge instrument.
F-9
GREEN MOUNTAIN COFFEE ROASTERS, INC.
NOTES TO CONSOLIDATED FINANCIAL STATEMENTS—(Continued)
The Company does not engage in speculative transactions, nor does it hold derivative instruments for trading purposes.
Other long-term assets
Other long-term assets consist of deposits and debt issuance costs. Debt issuance costs are being amortized over the respective life of the applicable debt using a method that approximates the effective interest method. Debt issuance costs included in other long-term assets in the accompanying consolidated balance sheet at September 26, 2009, and September 27, 2008, were $2,291,000 and $1,748,000, respectively.
Goodwill and intangibles
Goodwill and indefinite-lived intangibles are tested for impairment annually, and more frequently if indication of impairment arises.
On March 27, 2009, the Company recorded $25.8 million of goodwill for the acquisition of the wholesale business and coffee brand of Tully’s Coffee Corporation (Tully’s). Goodwill and intangibles related to Tully’s are reported in the SCBU segment of the Company. The Company’s evaluation of goodwill impairment involves a comparison between the current fair value and the recorded value of the SCBU reporting unit, including goodwill. The Company uses a discounted cash flow model to determine the fair value of the SCBU reporting unit. A number of significant assumptions and estimates are involved in the application of the discounted cash flow model including discount rate, sales volume and prices, costs to produce and working capital changes. The Company considers historical experience and all available information at the time fair value is estimated.
On June 15, 2006, the Company acquired Keurig and recorded $73,900,000 of goodwill. Goodwill from the Keurig acquisition was decreased by $1,400,000 in fiscal 2007 and by $133,000 in fiscal 2009 primarily to reflect updated estimates of R&D tax credits earned by Keurig in the years prior to the Company’s merger with Keurig. Goodwill was also decreased by $97,000 in fiscal 2007 and increased by $113,000 in fiscal 2008 due to the final settlements of contingencies related to the merger. Goodwill and intangibles related to Keurig are reported in the Corporate segment of the Company. This goodwill was tested for impairment at the end of fiscal 2009. To complete this impairment test, the Company evaluated the fair value of its Keurig reporting unit using a market capitalization approach.
On June 5, 2001, the Company purchased the coffee business of Frontier Natural Products Co-op (Frontier) and recorded $1,446,000 of goodwill related to this acquisition. There have been no changes in this carrying amount since September 29, 2001. Goodwill related to Frontier is reported in the Corporate segment of the Company. On an annual basis, the Company evaluates the fair value of the reporting unit (SCBU) associated with the Frontier acquisition and compares it to the carrying amount of goodwill. Estimation of fair value is dependent on a number of factors, including the market capitalization of the Company and estimates of the Company’s sales of its fair trade and organics products.
Based on the impairment tests performed, there was no impairment of goodwill in fiscal 2009, 2008 and 2007. All intangible assets are being amortized using the straight-line method over their useful lives.
Impairment of Long-Lived Assets
When facts and circumstances indicate that the carrying values of long-lived assets, including fixed assets, may be impaired, an evaluation of recoverability is performed by comparing the carrying value of the assets
F-10
GREEN MOUNTAIN COFFEE ROASTERS, INC.
NOTES TO CONSOLIDATED FINANCIAL STATEMENTS—(Continued)
to projected future cash flows in addition to other quantitative and qualitative analyses. Upon indication that the carrying value of such assets may not be recoverable, the Company recognizes an impairment loss as a charge against current operations. Long-lived assets to be disposed of are reported at the lower of the carrying amount or fair value, less estimated costs to sell. The Company makes judgments related to the expected useful lives of long-lived assets and its ability to realize undiscounted cash flows in excess of the carrying amounts of such assets which are affected by factors such as the ongoing maintenance and improvements of the assets, changes in economic conditions and changes in operating performance. As the Company assesses the ongoing expected cash flows and carrying amounts of its long-lived assets, these factors could cause the Company to realize an impairment charge.
Provision for Doubtful Accounts
Periodically, management reviews the adequacy of its provision for doubtful accounts based on historical bad debt expense results and current economic conditions using factors based on the aging of its accounts receivable. Additionally, the Company may identify additional allowance requirements based on indications that a specific customer may be experiencing financial difficulties. Actual bad debts could differ materially from the recorded estimates.
Advertising costs
The Company expenses the costs of advertising the first time the advertising takes place, except for direct mail campaigns targeted directly at consumers, which are expensed over the period during which they are expected to generate sales. At September 26, 2009, and September 27, 2008, prepaid advertising costs of $1,257,000 and $673,000, respectively, were recorded in other current assets in the accompanying consolidated balance sheet. Advertising expense totaled $30,274,000, $16,992,000, and $11,230,000, for the years ended September 26, 2009, September 27, 2008, and September 29, 2007, respectively.
Fixed assets
Fixed assets are carried at cost, net of accumulated depreciation. Expenditures for maintenance, repairs and renewals of minor items are expensed as incurred. Depreciation is calculated using the straight-line method over the assets’ estimated useful lives. The cost and accumulated depreciation for fixed assets sold, retired, or otherwise disposed of are relieved from the accounts, and the resultant gains and losses are reflected in income.
The Company follows an industry-wide practice of purchasing and loaning coffee brewing and related equipment to wholesale customers. These assets are also carried at cost, net of accumulated depreciation.
Depreciation costs of manufacturing and distribution assets are included in cost of sales. Depreciation costs of other assets, including equipment on loan to customers, are included in selling and operating expenses.
Revenue recognition
Revenue from wholesale and consumer direct sales is recognized upon product delivery, and in some cases upon product shipment. The Company has no contractual obligation to accept returns for damaged product nor does it guarantee product sales. Title, risk of loss, damage and insurance responsibility for the products pass from the Company to the buyer upon accepted delivery of the products from the Company’s contracted carrier. The Company will at times agree to accept returns or issue credits for products that are clearly damaged in transit.
F-11
GREEN MOUNTAIN COFFEE ROASTERS, INC.
NOTES TO CONSOLIDATED FINANCIAL STATEMENTS—(Continued)
Sales of single-cup coffee brewers are recognized net of an estimated allowance for returns. The Company estimates the allowance for returns using an average return rate based on historical experience. Royalty revenue is recognized upon shipment of K-Cups by roasters as set forth under the terms and conditions of various licensing agreements.
In addition, the Company’s customers can earn certain incentives, which are netted against sales or recorded in operating and selling expenses in the consolidated income statements. These incentives include, but are not limited to, cash discounts, funds for promotional and marketing activities, and performance based incentive programs.
Warranty
We provide for the estimated cost of product warranties, primarily using historical information and repair or replacement costs, at the time product revenue is recognized.
Cost of Sales
The Company records external shipping and handling expenses in cost of sales.
Income taxes
The Company recognizes deferred tax assets and liabilities for the expected future tax benefits or consequences of temporary differences between the financial statement carrying amounts of existing assets and liabilities, and their respective tax bases. Deferred tax assets and liabilities are measured using enacted tax rates in effect for the year in which those temporary differences are expected to be recovered or settled.
In the first quarter of fiscal 2008, the Company adopted new accounting guidance on the accounting for uncertainty in income taxes. The Company uses a more-likely-than-not measurement attribute for all tax positions taken or expected to be taken on a tax return in order for those tax positions to be recognized in the financial statements.
Stock-based compensation
The Company measures the cost of employee services received in exchange for an award of equity instruments (usually stock options) based on the grant-date fair value of the award. That cost is recognized over the period during which an employee is required to provide service in exchange for the award.
The Company measures the fair value of stock options using the Black-Scholes model and certain assumptions, including the expected life of the stock options, an expected forfeiture rate and the expected volatility of its common stock. The expected life of options is estimated based on options vesting periods, contractual lives and an analysis of the Company’s historical experience. The expected forfeiture rate is based on the Company’s historical experience. The Company uses a blended historical volatility to estimate expected volatility at the measurement date.
Significant customer credit risk and supply risk
The majority of the Company’s customers are located in the North America. Concentration of credit risk with respect to accounts receivable is limited due to the large number of customers in various channels comprising the Company’s customer base. The Company does not require collateral from customers as
F-12
GREEN MOUNTAIN COFFEE ROASTERS, INC.
NOTES TO CONSOLIDATED FINANCIAL STATEMENTS—(Continued)
ongoing credit evaluations of customers’ payment histories are performed. The Company maintains reserves for potential credit losses and such losses, in the aggregate, have not exceeded management’s expectations.
Keurig procures the brewers it sells from a third-party brewer manufacturer. Purchases from this brewer manufacturer amounted to approximately $176,567,000 and $91,669,000 in fiscal 2009 and 2008, respectively. Keurig processes the majority of its orders sold through retailers for the at-home channel through a fulfillment company. Revenue processed by this fulfillment company amounted to $282,533,000 and $88,617,000 and receivables amounted to $46,276,000 and $19,598,000 at September 26, 2009, September 27, 2008, respectively.
Research & Development
Research and development expenses are charged to income as incurred. These expenses amounted to $6,100,000 in fiscal 2009, $4,100,000 in fiscal 2008 and $3,300,000 in fiscal 2007. These costs primarily consist of salary and consulting expenses and are recorded in selling and operating expenses in each respective segment of the Company.
Reclassification
The Company has revised the classification of its treasury shares for the periods ending September 27, 2008, and September 29, 2007 on its Consolidated Balance Sheets and Consolidated Statement of Changes In Stockholders’ Equity to reflect the Company’s July 7, 2007 stock dividend of two shares of the Company’s common stock for each outstanding share of common stock with respect to its treasury shares, as well as to include in the presentation of its capital stock disclosure of both the issued and the issued and outstanding shares of common stock as of such dates. The Company has never used treasury shares for issuance upon the exercising of options.
Pending accounting pronouncements
In December 2007, the Financial Accounting Standards Board (FASB) issued new accounting guidance on business combinations and noncontrolling interests in consolidated financial statements. This new guidance retains the fundamental requirements in previous guidance for business combinations requiring that the use of the purchase method be used for all business combinations. The acquirer is required to recognize the assets acquired, the liabilities assumed, and any noncontrolling interest in the acquiree at the acquisition date, measured at their fair values as of that date. Additionally, business combinations will now require that acquisition costs to be expensed as incurred, the recognition of contingencies, restructuring costs associated with a business combination must generally be expensed and changes in deferred tax asset valuation allowances and income tax uncertainties after the acquisition date generally will affect income tax expense. This guidance applies prospectively to business combinations for which the acquisition date is on or after the beginning of the first annual reporting period beginning on or after December 15, 2008, which is fiscal year 2010 for the Company. For acquisitions completed prior to September 27, 2009, the new guidance requires that changes in deferred tax asset valuation allowances and acquired income tax uncertainties after the measurement period must be recognized in earnings rather than as an adjustment to the cost of the acquisition. On November 13, 2009, the Company acquired the wholesale coffee and beverage business of Timothy’s Coffees of the World, Inc. This acquisition will be reported in accordance with this new accounting guidance. During fiscal 2009, the Company incurred approximately $400,000 of acquisition related expenses which are classified as general and administrative expense in the Statement of Operations. See Note 25.
F-13
GREEN MOUNTAIN COFFEE ROASTERS, INC.
NOTES TO CONSOLIDATED FINANCIAL STATEMENTS—(Continued)
In February 2008, the FASB issued an update to delay the implementation of fair value measurements for nonfinancial assets and nonfinancial liabilities, except for items that are recognized or disclosed at fair value in the financial statements on a recurring basis. This deferral extends the effective date to fiscal years beginning after November 15, 2008, and interim periods within those fiscal years, which is fiscal year 2010 for the Company. The Company implemented fair value measurements for financial assets and liabilities in the first quarter of fiscal 2009. The Company is currently assessing the impact of fair value for nonfinancial assets and nonfinancial liabilities, but does not expect it to have a material impact on its financial statements.
In December 2007, the FASB clarified guidance on noncontrolling interests in consolidated financial statements. The clarification establishes accounting and reporting standards for the noncontrolling interest in a subsidiary and for the deconsolidation of a subsidiary. It clarifies that a noncontrolling interest in a subsidiary is an ownership interest in the consolidated entity that should be reported as equity in the consolidated financial statements. The amount of net income attributable to the noncontrolling interest will be included in the statement of operations. It clarifies that changes in a parent’s ownership interest in a subsidiary that do not result in deconsolidation are equity transactions if the parent retains its controlling financial interest. In addition, this guidance requires that a parent recognize a gain or loss in net income when a subsidiary is deconsolidated. This update is effective for fiscal years, and interim periods within those fiscal years, beginning on or after December 15, 2008, which is fiscal 2010 for the Company. The effect of adoption on the Company’s financial statements will depend primarily on the materiality of non-controlling interests arising in future transactions.
On May 19, 2009, the Company announced that its Board of Directors had approved a three-for-two stock split effected in the form of a stock dividend of one share for every two issued shares. The stock dividend was distributed on June 8, 2009, to stockholders of record at the close of business on May 29, 2009. The par value of the common stock remained unchanged at $0.10 per share. All share and per share data presented in this report have been adjusted to reflect this stock split.
On July 6, 2007, the Company announced that its Board of Directors had approved a three-for-one stock split effected in the form of a 200% stock dividend for all issued shares. The stock split shares were distributed on July 27, 2007, to stockholders of record at the close of business on July 17, 2007. The par value of the common stock remained unchanged at $0.10 per share. All share and per share data presented in this report have been adjusted to reflect this stock split.
| 4. | Acquisition of Certain Assets of Tully’s Coffee Corporation |
On September 15, 2008, the Company entered into an Asset Purchase Agreement (the “Agreement”) with Tully’s Coffee Corporation, a Washington corporation, and its wholly-owned subsidiary, Tully’s Bellaccino, LLC, a Washington limited liability company (collectively “Tully’s”) to acquire the Tully’s coffee brand and certain assets of its wholesale business. The transaction was completed on March 27, 2009. Since the date of acquisition, Tully’s results from operations have been included in the Company’s consolidated financial statements.
Tully’s wholesale business division distributes handcrafted coffees and related products via office coffee services, food service distributors, and over 5,000 supermarkets located primarily in the western states. The Company expects the geographic region encompassed by the Tully’s brand to create an advantaged opportunity for the Company to accelerate growth in the west coast by capitalizing on Tully’s brand
F-14
GREEN MOUNTAIN COFFEE ROASTERS, INC.
NOTES TO CONSOLIDATED FINANCIAL STATEMENTS—(Continued)
recognition and the loyalty of its customer base. The purchase price exceeded the fair value of the acquired net assets and, accordingly, $25,780,000 was allocated to goodwill, all of which is tax deductible.
Total consideration under the terms of the Agreement amounted to approximately $40,300,000 in cash. The Agreement contains customary representations, warranties and covenants given by the parties. Under the terms of the Agreement, $3,500,000 of the purchase price was placed in escrow at the closing and will be available to satisfy indemnification claims by the Company under the Agreement for a period of up to 12 months from the completion date.
The total net cash disbursement associated with the Agreement was $41,361,000. This includes $40,300,000 of cash consideration paid to Tully’s for the assets associated with its wholesale business and brand and direct acquisition costs of approximately $1,061,000. The Company also assumed approximately $210,000 in debt which was recorded as a noncash transaction.
The allocation of the purchase price based on fair value of the acquired assets less liabilities assumed is as follows:
| | | |
Inventories | | $ | 2,191,000 |
Fixed assets | | | 1,527,000 |
Intangible assets | | | 12,400,000 |
Goodwill | | | 25,243,000 |
| | | |
Total | | $ | 41,361,000 |
| | | |
In addition, the Company recorded goodwill related to assumed debt of $210,000 and exit and transition related accruals of $327,000. Exit and transition related accruals included the costs associated with the plan to relocate the Tully’s manufacturing facility to a new location which is expected to be completed no later than one year from the acquisition date.
Amortizable intangible assets acquired on March 27, 2009, include approximately $10,300,000 for identifiable customer relationships with an average life of 13 years, approximately $2,000,000 for the Tully’s trade name with an average life of 10 years and approximately $100,000 for non-compete agreements with an average life of 5 years. The weighted-average amortization period for these assets is 12.5 years and will be amortized on a straight-line basis over their respective useful lives. Amortization of intangibles expense (gross of tax) is anticipated to be approximately $1,012,000 in fiscal years 2010 through 2013 and approximately $1,002,000 in fiscal 2014.
Inventories consist of the following:
| | | | | | |
| | | September 26,
2009 | | September 27,
2008 |
Raw materials and supplies | | $ | 26,015,000 | | $ | 19,494,000 |
Finished goods | | | 111,279,000 | | | 65,817,000 |
| | | | | | |
| | $ | 137,294,000 | �� | $ | 85,311,000 |
| | | | | | |
Inventory values above are presented net of $704,000 and $440,000 of obsolescence reserves at September 26, 2009, and September 27, 2008, respectively.
F-15
GREEN MOUNTAIN COFFEE ROASTERS, INC.
NOTES TO CONSOLIDATED FINANCIAL STATEMENTS—(Continued)
At September 26, 2009, the Company had approximately $90,782,000 in green coffee purchase commitments, of which approximately 46% had a fixed price. These commitments extend through 2011. The value of the variable portion of these commitments was calculated using an average “c” price of coffee of $1.33 per pound at September 26, 2009. In addition to its green coffee commitments, the Company had approximately $118,962,000 in fixed price brewer inventory purchase commitments and $91,602,000 in production raw materials commitments at September 26, 2009. The Company believes based on relationships established with its suppliers, that the risk of non-delivery on such purchase commitments is remote.
Fixed assets consist of the following:
| | | | | | | | | | |
| | | Useful Life in Years | | September 26,
2009 | | | September 27,
2008 | |
Production equipment | | 1-15 | | $ | 91,343,000 | | | $ | 68,783,000 | |
Equipment on loan to wholesale customers | | 3-7 | | | 13,278,000 | | | | 12,269,000 | |
Computer equipment and software | | 1-10 | | | 34,018,000 | | | | 24,020,000 | |
Land | | Indefinite | | | 1,391,000 | | | | 1,391,000 | |
Building and building improvements | | 4-30 | | | 15,412,000 | | | | 14,744,000 | |
Furniture and fixtures | | 1-15 | | | 9,064,000 | | | | 6,598,000 | |
Vehicles | | 4-5 | | | 1,181,000 | | | | 1,070,000 | |
Leasehold improvements | | 1-20 or
remaining life of
lease, whichever is less | | | 9,197,000 | | | | 7,135,000 | |
Construction-in-progress | | | | | 27,332,000 | | | | 11,843,000 | |
| | | | | | | | | | |
Total fixed assets | | | | | 202,216,000 | | | | 147,853,000 | |
Accumulated depreciation | | | | | (66,235,000 | ) | | | (50,175,000 | ) |
| | | | | | | | | | |
| | | | $ | 135,981,000 | | | $ | 97,678,000 | |
| | | | | | | | | | |
Total depreciation and amortization expense relating to all fixed assets was $17,987,000, $13,500,000, and $10,328,000 for fiscal 2009, 2008, and 2007, respectively.
Assets classified as construction-in-progress are not depreciated, as they are not ready for production use. All assets classified as construction-in-progress on September 26, 2009, are expected to be in production use before the end of fiscal 2010.
During fiscal 2009, 2008 and 2007, $597,000, $550,000, and $444,000, respectively, of interest expense was capitalized.
The Company regularly undertakes a review of its fixed assets records. In fiscal 2009, 2008 and 2007, the Company recorded impairment charges related to obsolete equipment amounting to $548,000, $32,000, and $125,000, respectively. In fiscal 2009, 2008 and 2007, the impairment charges were recorded in other income (expense) on the Consolidated Statement of Operations, under the SCBU segment of the Company.
F-16
GREEN MOUNTAIN COFFEE ROASTERS, INC.
NOTES TO CONSOLIDATED FINANCIAL STATEMENTS—(Continued)
Intangible assets consist of the following:
| | | | | | | | | | | | | | |
| | | September 26, 2009 | | | September 27, 2008 | |
| | | Gross
Carrying
Amount | | Accumulated
Amortization | | | Gross
Carrying
Amount | | Accumulated
Amortization | |
Intangible assets subject to amortization | | | | | | | | | | | | | | |
Acquired technology | | $ | 21,317,000 | | $ | (9,587,000 | ) | | $ | 21,317,000 | | $ | (7,401,000 | ) |
Customer and roaster agreements | | | 19,700,000 | | | (7,820,000 | ) | | | 19,700,000 | | | (5,444,000 | ) |
Customer relationships | | | 10,367,000 | | | (428,000 | ) | | | 67,000 | | | (22,000 | ) |
Trade names | | | 3,456,000 | | | (633,000 | ) | | | 1,456,000 | | | (371,000 | ) |
Non-compete agreements | | | 374,000 | | | (268,000 | ) | | | 274,000 | | | (180,000 | ) |
| | | | | | | | | | | | | | |
Total | | $ | 55,214,000 | | $ | (18,736,000 | ) | | $ | 42,814,000 | | $ | (13,418,000 | ) |
| | | | | | | | | | | | | | |
For intangible assets subject to amortization, the Company calculates amortization expense over the period of expected economic benefit. Total amortization expense was $5,318,000 for fiscal 2009 and $4,812,000 for fiscal 2008 and fiscal 2007.
The estimated useful lives of the intangible assets subject to amortization are 7-10 years for acquired technology, 8-10 years for customer and roaster agreements, 7-13 year for customer relationships, 9-10 years for trade names and 2-5 years for non-complete agreements.
The estimated aggregate amortization expense over each of the next five years is as follows:
| | | |
2010 | | $ | 5,605,000 |
2011 | | $ | 5,564,000 |
2012 | | $ | 5,261,000 |
2013 | | $ | 5,180,000 |
2014 | | $ | 4,571,000 |
The provision for income taxes for the years ended September 26, 2009, September 27, 2008, and September 29, 2007, consists of the following:
| | | | | | | | | | | | |
| | | September 26,
2009 | | | September 27,
2008 | | | September 29,
2007 | |
Current tax expense: | | | | | | | | | | | | |
Federal | | $ | 25,257,000 | | | $ | 10,935,000 | | | $ | 6,943,000 | |
State | | | 6,497,000 | | | | 2,010,000 | | | | 1,409,000 | |
Foreign | | | 837,000 | | | | 523,000 | | | | — | |
| | | | | | | | | | | | |
Total current | | | 32,591,000 | | | | 13,468,000 | | | | 8,352,000 | |
| | | | | | | | | | | | |
Deferred tax expense: | | | | | | | | | | | | |
Federal | | | 2,008,000 | | | | 849,000 | | | | 453,000 | |
State | | | (123,000 | ) | | | (144,000 | ) | | | (71,000 | ) |
| | | | | | | | | | | | |
Total deferred | | | 1,885,000 | | | | 705,000 | | | | 382,000 | |
| | | | | | | | | | | | |
Total tax expense | | $ | 34,476,000 | | | $ | 14,173,000 | | | $ | 8,734,000 | |
| | | | | | | | | | | | |
F-17
GREEN MOUNTAIN COFFEE ROASTERS, INC.
NOTES TO CONSOLIDATED FINANCIAL STATEMENTS—(Continued)
Net deferred tax liabilities consist of the following:
| | | | | | | | |
| | | September 26,
2009 | | | September 27,
2008 | |
Deferred tax assets: | | | | | | | | |
Section 263A capitalized expenses | | $ | 1,456,000 | | | $ | 838,000 | |
Deferred hedging losses | | | 1,265,000 | | | | 284,000 | |
Vermont VEPC tax credit | | | — | | | | 268,000 | |
Deferred compensation | | | 3,930,000 | | | | 2,441,000 | |
Other reserves and temporary differences | | | 3,897,000 | | | | 2,583,000 | |
Research and development tax credit carryforwards | | | 524,000 | | | | 389,000 | |
| | | | | | | | |
Gross deferred tax assets | | | 11,072,000 | | | | 6,803,000 | |
| | |
Deferred tax liabilities: | | | | | | | | |
Prepaid expenses | | | (397,000 | ) | | | — | |
Depreciation | | | (16,602,000 | ) | | | (10,238,000 | ) |
Intangible assets | | | (10,521,000 | ) | | | (12,110,000 | ) |
| | | | | | | | |
Gross deferred tax liabilities | | | (27,520,000 | ) | | | (22,348,000 | ) |
| | | | | | | | |
Net deferred tax liabilities | | $ | (16,448,000 | ) | | $ | (15,545,000 | ) |
| | | | | | | | |
A reconciliation for continuing operations between the amount of reported income tax expense and the amount computed using the U.S. Federal Statutory rate of 35% is as follows:
| | | | | | | | | | | | |
| | | September 26,
2009 | | | September 27,
2008 | | | September 29,
2007 | |
Tax at U.S. Federal Statutory rate | | $ | 31,612,000 | | | $ | 12,400,000 | | | $ | 7,336,000 | |
Increase (decrease) in rates resulting from: | | | | | | | | | | | | |
Qualified stock option compensation accounting under FAS123R | | | 643,000 | | | | 699,000 | | | | 648,000 | |
State taxes, net of federal benefit | | | 4,950,000 | | | | 1,801,000 | | | | 723,000 | |
Section 199 deduction | | | (1,921,000 | ) | | | (906,000 | ) | | | (243,000 | ) |
Other | | | (808,000 | ) | | | 179,000 | | | | 270,000 | |
| | | | | | | | | | | | |
Tax at effective rates | | $ | 34,476,000 | | | $ | 14,173,000 | | | $ | 8,734,000 | |
| | | | | | | | | | | | |
The total amount of unrecognized tax benefits at September 26, 2009, and September 27, 2008, was $444,000 and $554,000, respectively. The unrecognized tax benefits relate to foreign tax credits at the federal level and research and development credits at the state level. During 2009, the company released $378,000 of this reserve related to R&D credits, $174,000 of which applied to credits earned by Keurig prior to the acquisition and impacted goodwill. The amount of unrecognized tax benefits at September 26, 2009, that would impact the effective tax rate if resolved in favor of the Company is $341,000. Any release of the reserve related to R&D credits earned prior to the Company’s acquisition of Keurig (currently $103,000) will be an adjustment to the statement of operations in the period released. The Company included $15,000 of interest and penalties in its reserve.
F-18
GREEN MOUNTAIN COFFEE ROASTERS, INC.
NOTES TO CONSOLIDATED FINANCIAL STATEMENTS—(Continued)
A reconciliation of increases and decreases in unrecognized tax benefits is as follows:
| | | | |
Gross tax contingencies—September 27, 2008 | | $ | 554,000 | |
Gross decreases to tax positions in prior periods | | | (378,000 | ) |
Gross increases to current period tax positions | | | 268,000 | |
| | | | |
Gross tax contingencies, September 26, 2009 | | $ | 444,000 | |
| | | | |
At September 26, 2009, and September 27, 2008, the Company has state research and development credit carryforwards of $807,000 and $598,000 respectively, expiring at various dates through 2023. During fiscal 2008, the Company fully utilized its remaining federal net operating loss (“NOL”) and federal research and development credit carryforwards.
The federal research and development tax credit expired on December 31, 2007, but was reinstated on October 3, 2008. The Company claimed a tax credit (and reserved against it) through December 31, 2007. The Company reported an additional $86,000 of federal tax credit and an associated $17,000 reserve as a discrete item in the first quarter of 2009 to recognize this retroactive extension. With this exception, the Company does not expect a significant increase or decrease to the total amount of unrecognized tax benefits within the next 12 months.
The Company manages its operations through two business segments: Specialty Coffee business unit (SCBU) and Keurig business unit (Keurig). SCBU sells whole bean and ground coffee selections, and K-Cups, Keurig single cup brewers and other accessories mainly in domestic wholesale and retail channels. Keurig sells their single cup brewers, coffee, cocoa and tea in K-Cups produced by a variety of licensed roasters, including SCBU, and related accessories mainly in domestic wholesale and retail channels. Throughout this report, unless otherwise noted, the information provided is on a consolidated basis.
The Company evaluates performance based on several factors, including business segment income before taxes. The operating segments do not share manufacturing or distribution facilities, except for brewer fulfillment at our Knoxville facility, and most administrative functions such as accounting and information services are decentralized. In the event any materials and/or services are provided to one segment by the other, the transaction is valued at estimated market price and eliminated in consolidation. The costs of the Company’s manufacturing operations are captured within the SCBU segment while the Keurig segment does not have manufacturing facilities and purchases its saleable products from third parties, including the SCBU. The Company’s property, plant and equipment, inventory and accounts receivable are captured and reported discretely within each operating segment.
Expenses not specifically related to either operating segment are shown separately as “Corporate”. Corporate expenses are comprised mainly of the compensation and other related expenses of the Company’s Chief Executive Officer, Chief Financial Officer, Chief Information Officer, Corporate General Counsel and Secretary, Vice President Human Resources, Vice President of Corporate Social Responsibility, Vice President of Environmental Affairs and other selected employees who perform duties related to our entire enterprise. Corporate expenses also include interest expense, amortization of identifiable intangibles related to the acquisition of Keurig, as well as certain corporate legal expenses and compensation of the board of directors. In addition, fiscal 2009 Corporate expenses are offset by $17,000,000 of proceeds received from the Kraft litigation settlement. Corporate assets include the cash proceeds from the fiscal 2009 equity offering and goodwill and intangible assets related to the Keurig business unit.
F-19
GREEN MOUNTAIN COFFEE ROASTERS, INC.
NOTES TO CONSOLIDATED FINANCIAL STATEMENTS—(Continued)
| | | | | | | | | | | | | | | | | |
For the fiscal year ended September 26, 2009 (Dollars in thousands) | | SCBU | | Keurig | | Corporate | | | Eliminations | | | Consolidated |
Sales to unaffiliated customers | | $ | 382,495 | | $ | 420,550 | | $ | — | | | $ | — | | | $ | 803,045 |
Intersegment sales | | $ | 91,401 | | $ | 72,860 | | $ | — | | | $ | (164,261 | ) | | $ | — |
Net sales | | $ | 473,896 | | $ | 493,410 | | $ | — | | | $ | (164,261 | ) | | $ | 803,045 |
Income before taxes | | $ | 52,623 | | $ | 47,514 | | $ | (7,582 | ) | | $ | (2,197 | ) | | $ | 90,358 |
Total assets | | $ | 489,821 | | $ | 157,067 | | $ | 383,957 | | | $ | (217,006 | ) | | $ | 813,839 |
Stock compensation | | $ | 2,325 | | $ | 1,951 | | $ | 2,421 | | | $ | — | | | $ | 6,697 |
Interest expense | | $ | — | | $ | — | | $ | 4,693 | | | $ | — | | | $ | 4,693 |
Property additions | | $ | 46,245 | | $ | 3,580 | | $ | — | | | $ | — | | | $ | 49,825 |
Depreciation and amortization | | $ | 16,508 | | $ | 1,985 | | $ | 4,812 | | | $ | — | | | $ | 23,305 |
| | | | | | | | | | | | | | | | | |
For the fiscal year ended September 27, 2008 (Dollars in thousands) | | SCBU | | Keurig | | Corporate | | | Eliminations | | | Consolidated |
Sales to unaffiliated customers | | $ | 285,894 | | $ | 214,383 | | $ | — | | | $ | — | | | $ | 500,277 |
Intersegment sales | | $ | 34,158 | | $ | 39,191 | | $ | — | | | $ | (73,349 | ) | | $ | — |
Net sales | | $ | 320,052 | | $ | 253,574 | | $ | — | | | $ | (73,349 | ) | | $ | 500,277 |
Income before taxes | | $ | 27,823 | | $ | 32,588 | | $ | (23,503 | ) | | $ | (436 | ) | | $ | 36,472 |
Total assets | | $ | 252,127 | | $ | 86,680 | | $ | 103,349 | | | $ | (84,508 | ) | | $ | 357,648 |
Stock compensation | | $ | 1,978 | | $ | 2,519 | | $ | 1,851 | | | $ | — | | | $ | 6,348 |
Interest expense | | $ | — | | $ | — | | $ | 5,705 | | | $ | — | | | $ | 5,705 |
Property additions | | $ | 45,173 | | $ | 3,545 | | $ | — | | | $ | — | | | $ | 48,718 |
Depreciation and amortization | | $ | 11,792 | | $ | 1,708 | | $ | 4,812 | | | $ | — | | | $ | 18,312 |
| | | | | | | | | | | | | | | | | |
For the fiscal year ended September 29, 2007 (Dollars in thousands) | | SCBU | | Keurig | | Corporate | | | Eliminations | | | Consolidated |
Sales to unaffiliated customers | | $ | 230,487 | | $ | 111,164 | | $ | — | | | $ | — | | | $ | 341,651 |
Intersegment sales | | $ | 11,471 | | $ | 23,607 | | $ | — | | | $ | (35,078 | ) | | $ | — |
Net sales | | $ | 241,958 | | $ | 134,771 | | $ | — | | | $ | (35,078 | ) | | $ | 341,651 |
Income before taxes | | $ | 22,453 | | $ | 16,771 | | $ | (17,366 | ) | | $ | (281 | ) | | $ | 21,577 |
Total assets | | $ | 153,423 | | $ | 40,382 | | $ | 108,048 | | | $ | (37,326 | ) | | $ | 264,527 |
Stock compensation | | $ | 1,690 | | $ | 1,565 | | $ | 1,037 | | | $ | — | | | $ | 4,292 |
Interest expense | | $ | — | | $ | — | | $ | 6,176 | | | $ | — | | | $ | 6,176 |
Property additions | | $ | 19,715 | | $ | 2,129 | | $ | — | | | $ | — | | | $ | 21,844 |
Depreciation and amortization | | $ | 8,798 | | $ | 1,660 | | $ | 4,811 | | | $ | — | | | $ | 15,269 |
The Company offers a one-year warranty on all Keurig brewers it sells. Keurig provides for the estimated cost of product warranties, primarily using historical information and repair or replacement costs, at the time product revenue is recognized. During fiscal 2007, the Company experienced higher warranty returns associated with a defective component for specific brewers manufactured during calendar 2006. The defective component was replaced with an improved component for all brewers beginning in January 2007. Replacement costs amounted to $1,600,000, of which $1,400,000 was recovered from the component manufacturer. This recovery was reflected in Keurig’s fiscal 2007 cost of sales.
F-20
GREEN MOUNTAIN COFFEE ROASTERS, INC.
NOTES TO CONSOLIDATED FINANCIAL STATEMENTS—(Continued)
The changes in the carrying amount of product warranty reserves for fiscal 2009 are as follows:
| | | | |
| Year ended September 26, 2009 | |
Balance at September 27, 2008 | | $ | 648,000 | |
Provision charged to income, net of reimbursements | | | 3,082,000 | |
Usage | | | (3,006,000 | ) |
| | | | |
Balance at September 26, 2009 | | $ | 724,000 | |
| | | | |
The changes in the carrying amount of product warranty reserves for fiscal 2008 are as follows:
| | | | |
| Year ended September 27, 2008 | |
Balance at September 29, 2007 | | $ | 815,000 | |
Provision charged to income | | | 2,322,000 | |
Usage | | | (2,489,000 | ) |
| | | | |
Balance at September 27, 2008 | | $ | 648,000 | |
| | | | |
The Company maintains a Revolving Credit Agreement (the “Credit Facility”) with Bank of America, N.A. (Bank of America) and other lenders. On December 3, 2007, the Company amended its Credit Facility to increase the facility from $125,000,000 to $225,000,000, extend the expiration date of the Credit Facility from June 15, 2011, to December 3, 2012, and amend certain financial covenants. Additionally, on June 29, 2009, the Company exercised its increase option and further amended certain financial covenants. The increase was in the form of a $50,000,000 term loan and will be amortized at a rate of 10% annually with payments beginning on September 30, 2009. The Company paid fees to its lenders for amendments to the Credit Facility of $1,000,000 in the fourth quarter of fiscal 2009, $711,000 in the first quarter of fiscal 2008 and $112,000 in the fourth quarter of fiscal 2008. The Company also incurred $168,000 in other financing fees related to these amendments.
At September 26, 2009, and September 27, 2008, $28,000,000 and $123,500,000 were outstanding under the Credit Facility, respectively. Additionally, a $50,000,000 term loan was outstanding under the Credit Facility at September 26, 2009. The Credit Facility is secured by all assets of the Company. The Credit Facility contains various negative covenants, including limitations on: liens; investments; loans and advances; indebtedness; mergers, consolidations and acquisitions; asset sales; dividends and distributions or repurchases of the Company’s capital stock; transactions with affiliates; certain burdensome agreements; and changes in the Company’s lines of business.
The Credit Facility is subject to the following financial covenants: a funded debt to adjusted EBITDA covenant and a fixed charge coverage ratio. On June 29, 2009, the Company amended the credit agreement which removed the capital expenditures limitation covenant and adjusted the definition of the fixed charge coverage ratio to modify the capital expenditures captured in the definition of 50% of unfinanced capital expenditures.
The borrowings under the Credit Facility bear interest at prime or Libor rates, plus a margin based on a performance price structure. At September 26, 2009, the interest rate charged on the $28,000,000 revolver borrowings under the Credit Facility was 1.25% (one-month Libor plus 100 basis points). The interest rates charged on the term loan at September 26, 2009, were 5.75% (Prime plus 250 basis points) on $1,250,000
F-21
GREEN MOUNTAIN COFFEE ROASTERS, INC.
NOTES TO CONSOLIDATED FINANCIAL STATEMENTS—(Continued)
and 3.75% (one-month Libor plus 350 basis points) on $48,750,000. However, the rate charged on $75,700,000 of the $76,750,000 Libor-based borrowings was fixed through swap agreements (see below). Therefore, the rate paid by the Company on that portion of the debt was in effect 6.41% (3.80% plus spread).
At September 27, 2008, interest rates charged on the Credit Facility were as follows: 5.25% (Prime rate plus 25 basis points) on $6,500,000 and 4.45% (one month Libor plus 125 basis points) on $117,000,000. However, the rate charged on $78,446,667 of the $117,000,000 one-month Libor was fixed through swap agreements (see below). Therefore, the rate paid by the Company on that portion of the debt was in effect 5.11% (3.86% plus 125 basis points).
Interest on Libor loans is paid in arrears on the maturity date of such loans. The variable portion of the Credit Facility accrues interest daily and is paid quarterly, in arrears. The Company also pays a commitment fee on the average daily unused portion of the Credit Facility.
At September 26, 2009, and September 27, 2008, the Company also had $345,000 in outstanding letters of credit for leased office space and $9,655,000 available under the Credit Facility to issue letters of credit.
The Company is party to interest rate swap agreements. The notional amounts of these swaps at September 26, 2009, and September 27, 2008, was $75,700,000 and $78,466,667, respectively. The effect of these swaps was to limit the interest rate exposure to a fixed rate at September 26, 2009, as follows: 5.44% versus the 30-day Libor rate on $25,700,000; 2.35% versus the 30-day Libor rate on $30,000,000; and 3.87% versus the 30-day Libor rate on $20,000,000. The swap’s notional amounts will decrease progressively in future periods and terminates on various dates from June 2010 through December 2012.
In accordance with the swap agreements and on a monthly basis, interest expense is calculated based on the floating 30-day Libor rate and the fixed rate. If interest expense calculated is greater based on the 30-day Libor rate, the lender pays the difference to the Company; if interest expense as calculated is greater based on the fixed rate, the Company pays the difference to the lender. In fiscal years 2009, 2008 and 2007, the Company paid $2,151,000, $1,050,000 and $66,000, respectively, in additional interest expense pursuant to the swap agreements.
The fair market value of the interest rate swaps are the estimated amount that the Company would receive or pay to terminate the agreements at the reporting date, taking into account current interest rates and the credit worthiness of the counterparty. At September 26, 2009 and September 27, 2008, the Company estimates it would have paid $3,257,000 and $634,000 (gross of tax), respectively, had it terminated the agreements. The Company designates the swap agreements as cash flow hedges and the fair value of these swaps are classified in accumulated other comprehensive income.
| | | | | | |
| | | September 26,
2009 | | September 27,
2008 |
Revolving line of credit | | $ | 28,000,000 | | $ | 123,500,000 |
Term loan | | | 50,000,000 | | | — |
Office equipment capital leases | | | 43,000 | | | 50,000 |
| | | | | | |
| | | 78,043,000 | | | 123,550,000 |
Less current portion | | | 5,030,000 | | | 33,000 |
| | | | | | |
| | $ | 73,013,000 | | $ | 123,517,000 |
| | | | | | |
F-22
GREEN MOUNTAIN COFFEE ROASTERS, INC.
NOTES TO CONSOLIDATED FINANCIAL STATEMENTS—(Continued)
Manufacturing and Office Equipment Capital Leases
The Company leases manufacturing equipment, copiers and fax machines. These leases require monthly installments of principal and interest totaling approximately $4,300. Maturities vary from October 2009 to July 2012.
Maturities
Maturities of long-term debt for years subsequent to September 26, 2009, are as follows:
| | | |
Fiscal Year |
2010 | | $ | 5,030,000 |
2011 | | | 5,009,000 |
2012 | | | 5,004,000 |
2013 | | | 63,000,000 |
2014 | | | — |
| | | |
| | $ | 78,043,000 |
| | | |
On August 12, 2009, the Company issued 5,750,000 shares of common stock at $67.25 per share, of which 5,208,993 shares were issued from treasury. Net proceeds were approximately $369,793,000, net of underwriting discount and other offering expenses. The Company used the proceeds to repay debt and for general corporate purposes.
The Company regularly enters into coffee futures contracts to hedge forecasted purchases of green coffee and therefore designates these contracts as cash flow hedges. At September 26, 2009, the Company held outstanding futures contracts covering 1,125,000 pounds of coffee with a fair market value of $90,000. At September 26, 2009, deferred gains on futures contracts designated as cash flow hedges amounted to $121,000 ($72,000, net of taxes). These futures contracts are hedging coffee purchases forecasted to take place in the next six months and the related gains will be reflected in cost of sales in the first three fiscal quarters of 2010, when the related finished goods inventory is sold. The deferred gains are classified as other comprehensive income (a component of equity). At September 27, 2008, deferred losses on futures contracts designated as cash flow hedges amounted to $70,000 ($43,000, net of taxes).
The total losses on coffee futures contracts that were included in cost of sales in fiscal 2009, 2008 and 2007 amounted to $443,000 ($264,000 net of tax), $9,000 ($6,000 net of tax) and $45,000 ($26,000 net of tax), respectively. The fair market value for the futures is calculated at the end of each fiscal quarter, in consideration of information provided by a major financial institution, based on the market prices of identical (or similar) instruments that are regularly traded in readily observable markets.
The Company is exposed to certain risks relating to ongoing business operations. The primary risks that are mitigated by financial instruments are interest rate risk and commodity price risk. The Company uses interest rate swaps to mitigate interest rate risk associated with the Company’s variable-rate borrowings and regularly enters into coffee futures contracts to hedge price-to-be-established coffee purchase commitments of green coffee with the objective of minimizing cost risk due to market fluctuations. The Company does not hold or issue derivative financial instruments for trading purposes.
F-23
GREEN MOUNTAIN COFFEE ROASTERS, INC.
NOTES TO CONSOLIDATED FINANCIAL STATEMENTS—(Continued)
The Company designates the swap agreements and coffee futures contracts as cash flow hedges and measures the effectiveness of these derivative instruments at each balance sheet date. The changes in the fair value of these instruments are classified in accumulated other comprehensive income (OCI). Gains and losses on these instruments are reclassified into earnings in the same period or periods during which the hedged transaction affects earnings. If it is determined that a derivative is not highly effective, the gains and losses will be reclassified into earnings upon determination.
The Company has interest rate swap agreements with Bank of America N.A. (Bank of America) and Sovereign Bank. During fiscal 2009, 2008 and 2007, the Company paid $2,151,000, $1,050,000 and $66,000, respectively, pursuant to the swap agreements, which increased interest expense.
The following table summarizes the interest rate swaps outstanding at September 26, 2009:
| | | | | | | | | | | | |
Hedged Transaction | | Notional
Amount of
Underlying
Debt | | Fixed Rate
Received | | | Maturity | | Fair Value of
Swap | |
30-day LIBOR | | $ | 30,000,000 | | 2.35 | % | | 2010 | | $ | (438,000 | ) |
30-day LIBOR | | $ | 25,700,000 | | 5.44 | % | | 2011 | | $ | (1,551,000 | ) |
30-day LIBOR | | $ | 20,000,000 | | 3.87 | % | | 2013 | | $ | (1,268,000 | ) |
| | | | | | | | | | | | |
| | $ | 75,700,000 | | | | | | | $ | (3,257,000 | ) |
| | | | | | | | | | | | |
The following table summarized the coffee futures contracts outstanding at September 26, 2009:
| | | | | | | | |
Coffee
Pounds | | Average
Contract
Price | | “C”
Price | | Maturity | | Fair Value of
Futures
Contract |
| 1,125,000 | | $1.20 | | $1.28 | | December 2009 | | $90,000 |
| | | | | | | | | |
| 1,125,000 | | | | | | | | $90,000 |
| | | | | | | | | |
The following table discloses the fair value of the Company’s financial instruments included in the Consolidated Balance Sheets:
| | | | | | | | | | |
| Fair Value of Derivative Instruments (Net of Tax) |
| | | |
| | | September 26,
2009 | | | September 27,
2008 | | | Balance Sheet
Classification |
Coffee Futures | | $ | 90,000 | | | $ | (39,000 | ) | | Other current assets
(Other current liabilities) |
Interest Rate Swaps | | $ | (3,257,000 | ) | | $ | (634,000 | ) | | Other short-term liabilities |
| | | | | | | | | | |
Total | | $ | (3,167,000 | ) | | $ | (673,000 | ) | | |
| | | | | | | | | | |
F-24
GREEN MOUNTAIN COFFEE ROASTERS, INC.
NOTES TO CONSOLIDATED FINANCIAL STATEMENTS—(Continued)
The following table discloses the effect of the Company’s financial instruments included in the Consolidated Statement of Operations:
| | | | | | | | | | |
| Effect of Derivatives Instruments on Earnings (Gross of Tax) for Fiscal 2009 | |
| | | Amount of
Gain or
(Loss) in OCI | | | Location of Gain
or (Loss)
Reclassified from
OCI into Income | | Amount of
Gain or (Loss)
Reclassified
from OCI
into Income | |
Coffee Futures | | $ | (251,000 | ) | | Cost of Sales | | $ | (443,000 | ) |
Interest Rate Swaps | | $ | (2,624,000 | ) | | Interest Expense | | $ | — | |
| | | | | | | | | | |
Total Derivatives | | $ | (2,875,000 | ) | | | | $ | (443,000 | ) |
| | | | | | | | | | |
| | | | | | | | | | |
| Effect of Derivatives Instruments on Earnings (Gross of Tax) for Fiscal 2008 | |
| | | Amount of
Gain or
(Loss) in OCI | | | Location of Gain
or (Loss)
Reclassified from
OCI into Income | | Amount of
Gain or (Loss)
Reclassified
from OCI
into Income | |
Coffee Futures | | $ | (79,000 | ) | | Cost of Sales | | $ | (9,000 | ) |
Interest Rate Swaps | | $ | 237,000 | | | Interest Expense | | $ | — | |
| | | | | | | | | | |
Total Derivatives | | $ | 158,000 | | | | | $ | (9,000 | ) |
| | | | | | | | | | |
The Company estimates the deferred losses of coffee futures will be reclassified to net income within the next nine months, which is consistent with the period over which the Company hedges its exposure to the variability in future cash flows. The Company hedges a portion of its exposure to the variability in interest rates through the maturity date of its credit facility.
The Company is exposed to credit loss in the event of nonperformance by the other parties to these financial instruments, however nonperformance is not anticipated.
| 15. | Fair Value Measurements |
The Company measures fair value as the selling price that would be received for an asset, or paid to transfer a liability, in the principal or most advantageous market on the measurement date. The hierarchy established by the FASB prioritizes fair value measurements based on the types of inputs used in the valuation technique. The inputs are categorized into the following levels:
Level 1 – Observable inputs such as quoted prices in active markets for identical assets or liabilities
Level 2 – Inputs other than quoted prices that are observable, either directly or indirectly, for identical or similar assets and liabilities in active or non-active markets
Level 3 – Unobservable inputs not corroborated by market data, therefore requiring the entity to use the best available information, including management assumptions
F-25
GREEN MOUNTAIN COFFEE ROASTERS, INC.
NOTES TO CONSOLIDATED FINANCIAL STATEMENTS—(Continued)
The following table discloses the level used by fair value measurements at September 26, 2009:
| | | | | | | | | | | | |
| | | Fair Value Measurements Using | | Balance Sheet Classification |
| | | Level 1 | | Level 2 | | | Level 3 | |
Short-term Investment | | $ | — | | $ | 50,000,000 | | | $ | — | | Short-term investments |
Derivatives | | $ | — | | $ | 90,000 | | | $ | — | | Other current assets |
Derivatives | | $ | — | | $ | (3,257,000 | ) | | $ | — | | Other short-term liabilities |
| | | | | | | | | | | | |
Total | | $ | — | | $ | (46,833,000 | ) | | $ | — | | |
| | | | | | | | | | | | |
The following table discloses the level used by fair value measurements at September 27, 2008:
| | | | | | | | | | | | |
| | | Fair Value Measurements Using | | Balance Sheet Classification |
| | | Level 1 | | Level 2 | | | Level 3 | |
Derivatives | | $ | — | | $ | (673,000 | ) | | $ | — | | Other short-term liabilities |
| | | | | | | | | | | | |
Total | | $ | — | | $ | (673,000 | ) | | $ | — | | |
| | | | | | | | | | | | |
Derivative financial instruments include coffee futures contracts and interest rate swap agreements. Short-term investments include certificates of deposit. To determine fair value, the Company utilizes the market approach valuation technique for the coffee futures contracts and certificates of deposit and the income approach for the interest rate swap agreements. The Company uses Level 2 inputs that are based on market data of identical (or similar) instruments that are in observable markets. All derivatives on the balance sheet are recorded at fair value with changes in fair value recorded in other comprehensive income for temporary valuation adjustments and in the statement of operations for settlement of contracts.
| 16. | Employee Compensation Plans |
Stock Option Plans
On May 20, 1999, the Company registered on Form S-8 the 1999 Stock Option Plan (the “1999 Plan”). Under this plan, 2,250,000 shares of common stock are available for grants of both incentive and non-qualified stock options. Grants under the 1999 Plan generally expire 10 years after the grant date, or earlier if employment terminates. At September 26, 2009 and September 27, 2008, options for 0 shares and 303 shares of common stock were available for grant under the plan, respectively.
On September 25, 2001, the Company registered on Form S-8 the 2000 Stock Option Plan (the “2000 Plan”). Under this plan, 3,600,000 shares of common stock are available for grants of both incentive and non-qualified stock options. Grants under the 2000 Plan generally expire 10 years after the grant date, or earlier if employment terminates. At September 26, 2009 and September 27, 2008, options for 27 shares and 258 shares of common stock were available for grant under the plan, respectively.
On March 16, 2006, stockholders of the Company approved the Company’s 2006 Incentive Plan (the “2006 Plan”). The 2006 Plan was amended on March 13, 2008, to which the total shares of common stock authorized for issuance increased to 2,400,000 from 1,350,000 at fiscal 2007 year end. Awards other than stock options are limited to a total of 270,000 over the life of the 2006 Plan. At September 26, 2009 and September 27, 2008, options for 234,603 shares and 599,463 shares of common stock were available for grant under the plan, respectively.
F-26
GREEN MOUNTAIN COFFEE ROASTERS, INC.
NOTES TO CONSOLIDATED FINANCIAL STATEMENTS—(Continued)
In connection with the acquisition of Keurig, the Company assumed the existing outstanding unvested option awards of the Keurig, Incorporated Fifth Amended and Restated 1995 Stock Option Plan (the “1995 Plan”) and the Keurig, Incorporated 2005 Stock Option Plan (the “2005 Plan”). No shares under either the 1995 Plan or the 2005 Plan were eligible for post-acquisition awards. At September 26, 2009, and September 27, 2008, 31,845 and 49,383 options out of the 462,303 options for shares of common stock granted were outstanding under 1995 Plan, respectively. At September 26, 2009, and September 27, 2008, 176,630 options and 240,860 options out of the 496,859 options granted for shares of common stock were outstanding under the 2005 Plan, respectively. All awards assumed in the acquisition were initially granted with a four-year vesting schedule and continue to vest in accordance with their existing terms.
On May 3, 2007, Mr. Lawrence Blanford commenced his employment as the President and Chief Executive Officer of the Company. Pursuant to the terms of the employment, the Company made an inducement grant on May 4, 2007, to Mr. Blanford of a non-qualified option to purchase 315,000 shares of the Company’s common stock, with an exercise price equal to fair market value on the date of the grant. The shares subject to the option will vest in 20% installments on each of the first five anniversaries of the date of the grant, provided that Mr. Blanford remains employed with the Company on each vesting date.
On November 3, 2008, Ms. Michelle Stacy commenced her employment as the President of Keurig, Incorporated. Pursuant to the terms of the employment, the Company made an inducement grant on November 3, 2009, to Ms. Stacy of a non-qualified option to purchase 52,500 shares of the Company’s common stock, with an exercise price equal to fair market value on the date of the grant. The shares subject to the option will vest in 25% installments on each of the first four anniversaries of the date of the grant, provided that Ms. Stacy remains employed with the Company on each vesting date.
On February 9, 2009, Mr. Howard Malovany commenced his employment as the Vice President, Corporate General Counsel and Secretary of the Company. Pursuant to the terms of the employment, the Company made an inducement grant on February 9, 2009, to Mr. Malovany of a non-qualified option to purchase 52,500 shares of the Company’s common stock, with an exercise price equal to fair market value on the date of the grant. The shares subject to the option will vest in 25% installments on each of the first four anniversaries of the date of the grant, provided that Mr. Malovany remains employed with the Company on each vesting date.
Under the 1999 Plan and the 2000 Plan, the option price for each incentive stock option shall not be less than the fair market value per share of common stock on the date of grant, with certain provisions which increase the option price to 110% of the fair market value of the common stock if the grantee owns in excess of 10% of the Company’s common stock at the date of grant. Under the 1999 Plan, the option price for each non-qualified stock option shall not be less than 85% of the fair market value of the common stock at the date of grant. The 2000 Plan does not have restrictions on the pricing of non-qualified grants. The 2006 Plan requires the exercise price for all awards requiring exercise to be no less than 100% of fair market value per share of common stock on the date of grant, with certain provisions which increase the option price to 110% of the fair market value of the common stock if the grantee owns in excess of 10% of the Company’s common stock at the date of grant. Options under the 1999 Plan, the 2000 Plan and the 2006 Plan become exercisable over periods determined by the Board of Directors, generally in the range of four to five years.
F-27
GREEN MOUNTAIN COFFEE ROASTERS, INC.
NOTES TO CONSOLIDATED FINANCIAL STATEMENTS—(Continued)
Option activity is summarized as follows:
| | | | | | |
| | | Number of
Shares | | | Average
Exercise Price |
Outstanding at September 27, 2008 | | 4,713,917 | | | | 9.26 |
Granted | | 500,394 | | | | 28.17 |
Exercised | | (1,267,457 | ) | | | 6.14 |
Canceled | | (43,676 | ) | | | 19.00 |
| | | | | | |
Outstanding at September 26, 2009 | | 3,903,178 | | | | 12.99 |
| | | | | | |
Exercisable at September 26, 2009 | | 2,178,395 | | | $ | 8.40 |
The following table summarizes information about stock options expected to vest at September 26, 2009:
| | | | | | | | | |
Range of exercise price | | Number of
options
outstanding | | Weighted average
remaining
contractual life
(in years) | | Weighted average
exercise price | | Intrinsic value at
September 26, 2009 |
$ 0.49 - $68.93 | | 3,852,345 | | 6.66 | | 12.87 | | $ | 216,094,000 |
The following table summarizes information about stock options exercisable at September 26, 2009:
| | | | | | | | | |
Range of exercise price | | Number of
options
exercisable | | Weighted average
remaining
contractual life
(in years) | | Weighted average
exercise price | | Intrinsic value at
September 26, 2009 |
$ 0.49 - $28.32 | | 2,178,395 | | 5.49 | | 8.40 | | $ | 131,825,000 |
Compensation expense is recognized only for those options expected to vest, with forfeitures estimated based on the Company’s historical employee turnover experience and future expectations.
The Company uses a blend of recent and historical volatility to estimate expected volatility at the measurement date. The expected life of options is estimated based on options vesting periods, contractual lives and an analysis of the Company’s historical experience.
Income before income taxes was reduced by $6,697,000, $6,348,000 and $4,292,000 (gross of tax), respectively, due to the recognition of stock compensation expense for the years ended September 26, 2009, September 27, 2008, and September 29, 2007, respectively. Net of tax, stock compensation expense was $4,731,000, $4,755,000 and $3,335,000 for the years ended September 26, 2009, September 27, 2008, and September 29, 2007, respectively.
Total unrecognized share-based compensation costs related to unvested stock options expected to vest were approximately $13,033,000 as of September 26, 2009, which related to approximately 1,674,000 shares. This unrecognized cost is expected to be recognized over a weighted average period of approximately 2 years at September 26, 2009. The intrinsic values of options exercised during fiscal 2009 and fiscal 2008 were approximately $35,151,000 and $22,217,000, respectively. The Company’s policy is to issue new shares upon exercise of stock options.
The grant-date fair value of employee share options and similar instruments is estimated using the Black-Scholes option-pricing model with the following assumptions for grants issued during fiscal 2009: an expected life averaging 6 years; an average volatility of 52%; no dividend yield; and a risk-free interest rate averaging 2%. The weighted-average fair value of options granted during fiscal 2009 was $13.71.
F-28
GREEN MOUNTAIN COFFEE ROASTERS, INC.
NOTES TO CONSOLIDATED FINANCIAL STATEMENTS—(Continued)
The following assumptions were used for option grants issued during fiscal 2008: an expected life averaging 6 years; an average volatility of 45%; no dividend yield; and a risk-free interest rate averaging 3%. The weighted-average fair value of options granted during fiscal 2008 was $9.63.
The following assumptions were used for option grants issued during fiscal 2007: an expected life averaging 6 years; an average volatility of 39%; no dividend yield; and a risk-free interest rate averaging 5%. The weighted-average fair value of options granted during fiscal 2007 was $6.43.
Employee Stock Purchase Plan
On October 5, 1998, the Company registered on Form S-8 the 1998 Employee Stock Purchase Plan. On March 13, 2008, the plan was amended and renamed the Amended and Restated Employee Stock Purchase Plan (ESPP). Under this plan, eligible employees may purchase shares of the Company’s common stock, subject to certain limitations, at the lesser of 85 percent of the beginning or ending withholding period fair market value as defined in the plan. There are two six-month withholding periods in each fiscal year. At September 26, 2009, and September 27, 2008, options for 727,820 and 832,575 shares of common stock were available for purchase under the plan, respectively.
The grant-date fair value of employees’ purchase rights granted during fiscal 2009 under the Company’s ESPP is estimated using the Black-Scholes option-pricing model with the following assumptions: an expected life equal to 6 months; an average volatility of 66%; no dividend yield; and an average risk-free interest rate equal to 1.0%. The weighted-average fair value of purchase rights granted during fiscal 2009 was $9.49.
The assumptions used for fiscal 2008 ESPP grants were: an expected life equal to 6 months; an average volatility of 59%; no dividend yield; and an average risk-free interest rate equal to 3%. The weighted-average fair value of purchase rights granted during fiscal 2008 was $6.68.
The assumptions used for fiscal 2007 ESPP grants were: an expected life equal to 6 months; an average volatility of 36%; no dividend yield; and an average risk-free interest rate equal to 5%. The weighted-average fair value of purchase rights granted during fiscal 2007 was $2.69.
| 17. | Defined Contribution Plan |
The Company has a defined contribution plan which meets the requirements of section 401(k) of the Internal Revenue Code. As of January 1, 2008, the defined contribution plan of the Keurig subsidiary was merged into the Company’s defined contribution plan. All regular full-time employees of the Company who are at least eighteen years of age and work a minimum of 36 hours per week are eligible to participate in the plan. The plan allows employees to defer a portion of their salary on a pre-tax basis and the Company contributes 50% of amounts contributed by employees up to 6% of their salary. Company contributions to the plan amounted to $1,525,000, $1,245,000, and $856,000, for the years ended September 26, 2009, September 27, 2008, and September 29, 2007, respectively.
Prior to January 1, 2008, the Keurig subsidiary of the Company had a separate defined contribution plan that met the requirements of section 401(k) of the Internal Revenue Code. All regular full-time employees of Keurig who were at least eighteen years of age and had completed three months of service were eligible to participate in the plan. The plan allowed employees to defer a portion of their salary on a pre-tax basis and the Company contributed 50% of amounts contributed by employees up to 6% of their salary. Company contributions to the Keurig plan amounted to $62,000 for the fiscal quarter ended December 29, 2007, and $296,000 for the fiscal year ended September 29, 2007.
F-29
GREEN MOUNTAIN COFFEE ROASTERS, INC.
NOTES TO CONSOLIDATED FINANCIAL STATEMENTS—(Continued)
| 18. | Employee Stock Ownership Plan |
On September 14, 2000, the Board of Directors of the Company adopted a resolution establishing the Green Mountain Coffee, Inc., Employee Stock Ownership Plan (the “ESOP”) and the related Green Mountain Coffee, Inc., Employee Stock Ownership Trust (the “Trust”). The ESOP is qualified under sections 401(a) and 4975(e)(7) of the Internal Revenue Code. All employees of the Company (not including its Keurig subsidiary prior to 2009) with one year or more of service who are at least twenty-one years of age are eligible to participate in the Plan, in accordance with the terms of the Plan. The Company may, at its discretion, contribute shares of Company stock or cash that is used to purchase shares of Company stock. Company contributions are credited to eligible participants’ accounts pro-rata based on their compensation. Plan participants become vested in their Plan benefits ratably over four years from the date of hire of the employee.
In April 2001, a total of 56,250 shares were purchased at a cost of $197,000 in the open market and distributed directly to participants. On April 16, 2001, the Company made a $2,000,000 loan to the Trust to provide funds for the open-market purchases of the Company’s common stock. This loan bears interest at an annual rate of 8.5% and provides for annual repayments to the Company. The maturity date of the loan is the last business day of the Company’s fiscal 2010 year. Between April 19, 2001, and August 21, 2001, the Trust purchased 332,100 shares of the Company’s common stock at an average price of $6.03 per share. The fair value of unearned ESOP shares at September 26, 2009, and September 27, 2008, was $875,000 or $68.93 per share and $703,000 or $25.87 a share, respectively.
Compensation costs for the ESOP recorded by the Company were $1,000,000 for the year ended September 26, 2009, and $200,000 for each of the years ended September 27, 2008, and September 29, 2007.
After the close of 2008 and 2007 calendar years, 7,732 shares and 9,039 shares were transferred from the unallocated ESOP pool of shares and allocated to participants’ accounts, respectively. At September 26, 2009, 14,507 shares had been committed to be released to participants’ accounts at the end of the calendar 2009 year.
| 19. | Deferred Compensation Plan |
The 2002 Deferred Compensation Plan, amended in December 2007, permits certain highly compensated officers and employees of the Company and non-employee directors to defer eligible compensation payable for services rendered to the Company. Participants may elect to receive deferred compensation in the form of cash payments or shares of Company Common Stock on the date or dates selected by the participant or on such other date or dates specified in the Deferred Compensation Plan. The Deferred Compensation Plan is in effect for compensation earned on or after September 29, 2002. As of September 26, 2009, and September 27, 2008, 124,578 shares and 127,988 shares of Common Stock were available for future issuance under this Plan, respectively. As of September 26, 2009, and September 27, 2008, rights to acquire 25,422 and 22,012 shares of Common Stock were outstanding under this Plan, respectively.
| 20. | Patent Litigation Settlement |
On October 23, 2008, Keurig entered into a Settlement and License Agreement with Kraft Foods, Inc., Kraft Foods Global, Inc., and Tassimo Corporation (collectively “Kraft”) providing for a complete settlement of Keurig’s previously filed lawsuit against Kraft. Pursuant to the terms of the Settlement and License Agreement, Kraft paid to Keurig a lump sum of $17,000,000 and Keurig grants to Kraft and its affiliates a limited, non-exclusive, perpetual, worldwide, fully paid up license of certain Keurig patents.
F-30
GREEN MOUNTAIN COFFEE ROASTERS, INC.
NOTES TO CONSOLIDATED FINANCIAL STATEMENTS—(Continued)
| 21. | Related party transactions |
The Company uses travel services provided by Heritage Flight, a charter air services company acquired in September 2002 by Mr. Stiller, the Company’s former CEO and current Chairman of the Board. During fiscal years 2009, 2008, and 2007, the Company was billed a total of $230,000, $305,000, and $234,000, respectively, by Heritage Flight for travel services provided to various employees of the Company.
| 22. | Commitments, Lease Contingencies and Contingent Liabilities |
Leases
The Company leases office and retail space, production, distribution and service facilities, and certain equipment under various non-cancelable operating leases, with terms ranging from one to twenty years. Property leases normally require payment of a minimum annual rental plus a pro-rata share of certain landlord operating expenses. Total rent expense under all operating leases was $6,759,000, $5,208,000, and $3,693,000 in fiscal 2009, 2008, and 2007, respectively.
Minimum future lease payments under non-cancellable operating leases for years subsequent to September 26, 2009, are as follows:
| | | |
Fiscal Year | | Operating Leases |
2010 | | $ | 5,243,000 |
2011 | | | 5,385,000 |
2012 | | | 4,657,000 |
2013 | | | 3,476,000 |
2014 | | | 3,284,000 |
Thereafter | | | 5,926,000 |
| | | |
Total minimum lease payments | | $ | 27,971,000 |
| | | |
Stock Appreciation Rights
In conjunction with its purchase of Keurig’s stock in 2002, the Company had issued Stock Appreciation Rights (SARs). Upon consummation of a liquidity event involving the stock of Keurig as defined in the SARs agreement, the Company would be required to record an expense equal to the difference between the value of Keurig’s stock and the price paid by the Company when it acquired Keurig stock in 2002. The Merger was not considered a liquidity event, and therefore no payments under these SARs agreements were made upon consummation of the Merger. However, the agreement remains in effect and, under certain circumstances, if the Company were to sell Keurig, the sale may trigger a liquidity event under the agreement. At September 26, 2009, the Company estimated that it would have been required to record an expense equal to $7,006,000, had a liquidity event occurred.
F-31
GREEN MOUNTAIN COFFEE ROASTERS, INC.
NOTES TO CONSOLIDATED FINANCIAL STATEMENTS—(Continued)
The following table illustrates the reconciliation of the numerator and denominator of basic and diluted income per share from continuing operations (dollars in thousands, except share and per share data):
| | | | | | | | | |
| | | Year Ended |
| | | September 26,
2009 | | September 27,
2008 | | September 29,
2007 |
Numerator—basic and diluted earnings per share: | | | | | | | | | |
Net income | | $ | 55,882 | | $ | 22,299 | | $ | 12,843 |
| | | | | | | | | |
Denominator: | | | | | | | | | |
Basic earnings per share—weighted average shares outstanding | | | 37,993,196 | | | 35,924,697 | | | 34,875,647 |
Effect of dilutive securities—stock options | | | 2,130,357 | | | 2,422,473 | | | 2,284,413 |
| | | | | | | | | |
Diluted earnings per share—weighted average shares outstanding | | | 40,123,553 | | | 38,347,170 | | | 37,160,060 |
| | | | | | | | | |
Basic earnings per share | | $ | 1.47 | | $ | 0.62 | | $ | 0.37 |
Diluted earnings per share | | $ | 1.39 | | $ | 0.58 | | $ | 0.35 |
For the fiscal years ended September 26, 2009, September 27, 2008, and September 29, 2007, 216,000, 351,000, and 639,000 options for shares of common stock, respectively, have been excluded in the calculation of diluted earnings per share because they were antidilutive.
| 24. | Unaudited Quarterly Financial Data |
The following table presents the quarterly information for fiscal 2009 (dollars in thousands, except per share data). Each fiscal quarter comprises 13 weeks.
| | | | | | | | | | | | |
Fiscal 2009 | | December 27,
2008 | | March 28,
2009 | | June 27,
2009 | | September 26,
2009 |
Net sales | | $ | 196,980 | | $ | 193,351 | | $ | 190,509 | | $ | 222,205 |
Gross profit | | $ | 53,350 | | $ | 61,981 | | $ | 64,081 | | $ | 70,352 |
Net income | | $ | 14,384 | | $ | 12,983 | | $ | 14,140 | | $ | 14,375 |
Earnings per share: | | | | | | | | | | | | |
Basic | | $ | 0.39 | | $ | 0.35 | | $ | 0.38 | | $ | 0.35 |
Diluted | | $ | 0.36 | | $ | 0.33 | | $ | 0.36 | | $ | 0.34 |
The following table presents the quarterly information for fiscal 2008 (dollars in thousands, except per share data). Each fiscal quarter comprises 13 weeks.
| | | | | | | | | | | | |
Fiscal 2008 | | December 29,
2007 | | March 29,
2008 | | June 28,
2008 | | September 27,
2008 |
Net sales | | $ | 126,445 | | $ | 120,877 | | $ | 118,120 | | $ | 134,835 |
Gross profit | | $ | 43,289 | | $ | 44,713 | | $ | 42,494 | | $ | 46,409 |
Net income | | $ | 2,925 | | $ | 5,957 | | $ | 6,329 | | $ | 7,088 |
Earnings per share: | | | | | | | | | | | | |
Basic | | $ | 0.08 | | $ | 0.17 | | $ | 0.18 | | $ | 0.20 |
Diluted | | $ | 0.08 | | $ | 0.16 | | $ | 0.16 | | $ | 0.18 |
F-32
GREEN MOUNTAIN COFFEE ROASTERS, INC.
NOTES TO CONSOLIDATED FINANCIAL STATEMENTS—(Continued)
On November 13, 2009, the Company entered into a Share Purchase Agreement to acquire the wholesale coffee and beverage business of Timothy’s Coffees of the World, Inc. (Timothy’s). In this acquisition, the Company acquired all of the issued and outstanding stock of Timothy’s for a cash purchase price of approximately $157,000,000, in U.S. dollars, subject to adjustment. The transaction was financed using cash on hand. The purchase price is subject to a working capital adjustment and certain other adjustments to be settled within 120 days of the closing. The acquisition includes the Timothy’s World Coffee brand and wholesale business and does not include the retail business. Timothy’s will be maintained as a wholly-owned Canadian subsidiary, with operations integrated into the SCBU segment. Since the Share Purchase Agreement was consummated subsequent to the end of the Company’s reporting period, Timothy’s results of operations are not included in the Consolidated Statement of Operations contained herein.
The initial accounting for this acquisition was incomplete as of the date in which the Company’s financial statements were issued. Accordingly, the Company will provide the required disclosures in the financial statements for the first quarter ending December 26, 2009, including the acquisition-date fair value of each major class of assets and liabilities acquired, any contingent consideration and the total amount of goodwill acquired and deductible for tax purposes.
The Company incurred approximately $400,000 of acquisition-related expenses in the fourth quarter of fiscal 2009, which are classified as general and administrative expense.
On November 2, 2009, Peet’s Coffee & Tea, Inc. (Peet’s) and Diedrich Coffee, Inc. (Diedrich) announced entering into an agreement under which Peet’s would acquire Diedrich for $26.00 per share in a cash-and-stock transaction. On November 22, 2009, in response to a proposal from the Company to acquire Diedrich for $30.00 per share in cash, Peet’s increased its proposal to $32.00 per share, also in a cash-and-stock transaction. On November 23, 2009, the Company submitted a revised proposal to acquire Diedrich for $32.00 per share in cash, to be effected pursuant to a cash tender offer in a transaction with a total enterprise value of approximately $265 million. As of the filing of this Form 10-K, the Diedrich Board of Directors has determined that our revised offer constitutes a superior proposal, as defined in the existing merger agreement between Diedrich and Peet’s. Upon entering into a definitive merger agreement between the Company and Diedrich, the Company would proceed with a cash tender offer to acquire all outstanding shares of Diedrich. The Company anticipates that it would finance an acquisition of Diedrich through cash on hand and the existing credit facility.
The Company has performed an evaluation of subsequent events through November 25, 2009, which is the date the financial statements were issued.
F-33
Schedule II—Valuation and Qualifying Accounts
for the fiscal years ended
September 26, 2009, September 27, 2008, and September 29, 2007
| | | | | | | | | | | | | | | |
| | | Additions |
Description | | Balance at
Beginning of
Period | | Charged to
Costs and
Expenses | | Charged to
Reserve for
Returns | | Deductions | | Balance at
End of
Period |
Allowance for doubtful accounts: | | | | | | | | | | | | | | | |
Fiscal 2009 | | $ | 3,002,000 | | $ | 243,000 | | $ | 1,547,000 | | $ | — | | $ | 4,792,000 |
Fiscal 2008 | | $ | 1,600,000 | | $ | 1,159,000 | | $ | 243,000 | | $ | — | | $ | 3,002,000 |
Fiscal 2007 | | $ | 1,021,000 | | $ | 620,000 | | $ | — | | $ | 41,000 | | $ | 1,600,000 |
| |
| | | Additions |
Description | | Balance at
Beginning of
Period | | Charged to
Costs and
Expenses | | Charged to
Other
Accounts | | Deductions | | Balance at
End of
Period |
Warranty reserve: | | | | | | | | | | | | | | | |
Fiscal 2009 | | $ | 648,000 | | $ | 3,082,000 | | $ | — | | $ | 3,006,000 | | $ | 724,000 |
Fiscal 2008 | | $ | 815,000 | | $ | 2,322,000 | | $ | — | | $ | 2,489,000 | | $ | 648,000 |
Fiscal 2007 | | $ | 230,000 | | $ | 1,928,000 | | $ | — | | $ | 1,343,000 | | $ | 815,000 |
| |
| | | Additions |
Description | | Balance at
Beginning of
Period | | Charged to
Costs and
Expenses | | Charged to
Other
Accounts | | Deductions | | Balance at
End of
Period |
Inventory obsolescence reserve: | | | | | | | | | | | | | | | |
Fiscal 2009 | | $ | 440,000 | | $ | 1,801,000 | | $ | — | | $ | 1,537,000 | | $ | 704,000 |
Fiscal 2008 | | $ | 348,000 | | $ | 1,141,000 | | $ | — | | $ | 1,049,000 | | $ | 440,000 |
Fiscal 2007 | | $ | 219,000 | | $ | 861,000 | | $ | — | | $ | 732,000 | | $ | 348,000 |
The accompanying Notes to Consolidated Financial Statements are an integral part of these financial statements.
F-34