
New York Community Bancorp, Inc.
Measure the difference.
Invest in the strength.
First Quarter 2003
Investor Presentation
May 2003

Forward-looking Statements and Risk Factors
This presentation contains certain forward-looking statements with regard to the Company's prospective performance and strategies within the meaning of Section 27A of the Securities Act of 1933, as amended, and Section 21E of the Securities Exchange Act of 1934, as amended. The Company intends such forward-looking statements to be covered by the safe harbor provisions for forward-looking statements contained in the Private Securities Litigation Reform Act of 1995, and is including this statement for purposes of said safe harbor provisions.
Forward-looking statements, which are based on certain assumptions, and describe future plans, strategies, and expectations of the Company, are generally identified by use of the words "plan," "believe," "expect," "intend," "anticipate," "estimate," "project," or other similar expressions. The Company's ability to predict results or the actual effects of its plans and strategies is inherently uncertain. Accordingly, actual results may differ materially from anticipated results. Factors that could have a material adverse effect on the operations of the Company and its subsidiaries include, but are not limited to, changes in market interest rates, general economic conditions, legislation, and regulation; changes in the monetary and fiscal policies of the U.S. Government, including policies of the U.S. Treasury and the Federal Reserve Board; changes in the quality or composition of the loan or investment portfolios; changes in deposit flows, competition, and demand for financial services and loan, deposit, or investment products in the Company's local markets; changes in local real estate values; changes in accounting principles and guidelines; war or terrorist activities; and other economic, competitive, governmental, regulatory, geopolitical, and technological factors affecting the Company's operations, pricing, and services.
Specific factors that could cause future results to vary from current management expectations are detailed from time to time in the Company's SEC filings, which are available at the Company's web site, www.myNYCB.com.
Readers are cautioned not to place undue reliance on these forward-looking statements, which speak only as of the date of this presentation. Except as required by applicable law or regulation, the Company undertakes no obligation to update these forward-looking statements to reflect events or circumstances that occur after the date on which such statements were made.
2

Measure the difference.
Industry data - SNL DataSource as of 5/14/03
NYCB data - Company reports
NYCB 2000 and 2001 data based on core earnings. Please see footnote 1 in the Appendix on page 30.
The graphs and tables on pages 4, 5, 6, 8, 16, and 26 of this presentation reflect the Company's cash or core earnings for certain periods. Please see the footnotes on pages 30 and 32 for a reconciliation of the Company's GAAP and core earnings and GAAP and cash earnings for the periods indicated.
For a reconciliation of stockholders' equity and tangible stockholders' equity, please see the footnote on page 31.
ROA
ROE
Efficiency ratio
NPAs/Total assets
NCOs/Average loans
May 2003 ThriftINVESTOR
SNL DataSource
Ranking Criteria
%
2.59
22.60
25.50
0.15
0.00
NYCB
Cash(2)
2002
%
2.29
19.95
25.32
0.15
0.00
NYCB GAAP
*
**
Measure the Difference: Performance
NYCB has been ranked the nation's top-performing large thrift for the past 5 years.*
Industry
Average**
0.87
9.07
62.67
0.70
0.19
%
3 Mos. 2003
NYCB
Cash(2)
%
2.40
21.69
23.92
0.12
0.00
2.24
20.22
25.19
0.12
0.00
%
NYCB GAAP
0.95
10.08
61.81
0.62
0.19
%
Industry
Average**
4
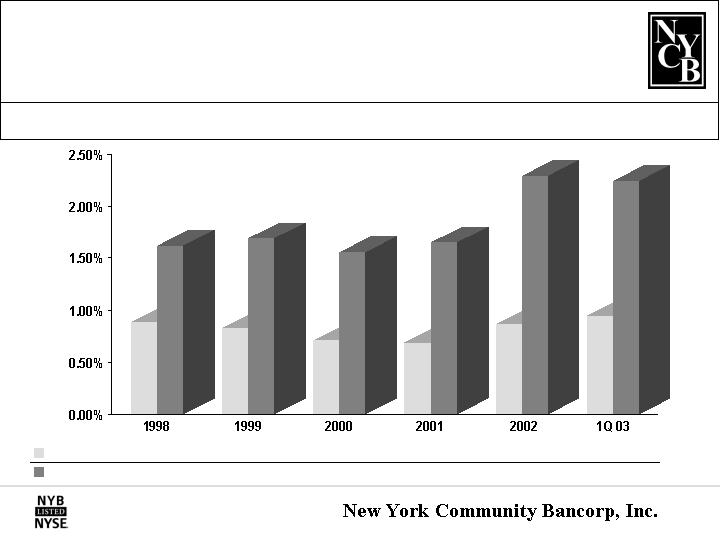
Measure the Performance: ROA
NYCB's 1Q 2003 ROA exceeded the industry average by 129 basis points.
U.S. Thrifts
0.89%
0.83%
0.71%
0.69%
0.87%
NYCB
1.62%
1.69%
1.56%
1.65%
2.29%
2.24%
(3)
(3)
0.95%
5

Measure the Performance: ROE
U.S. Thrifts
NYCB
7.92%
17.32%
7.72%
22.99%
7.40%
19.40%
7.89%
18.30%
9.07%
19.95%
10.08%
20.22%
(4)
(4)
NYCB's 1Q 2003 ROE exceeded the industry average by 1,014 basis points.
6
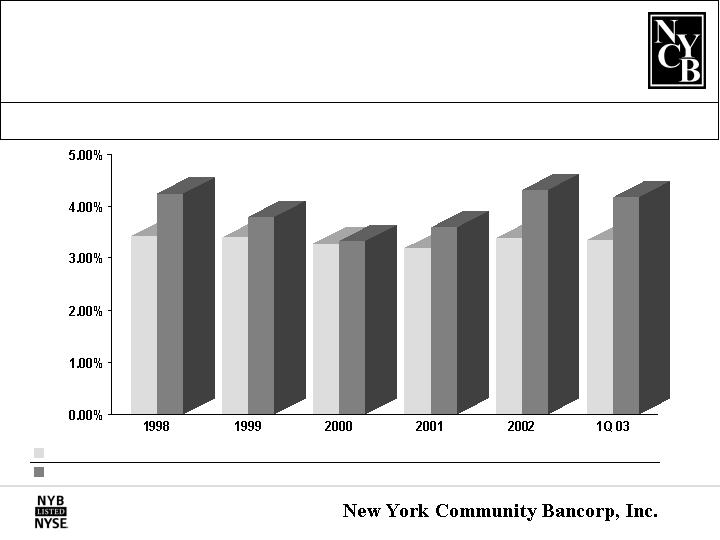
Measure the Performance: Net Interest Margin
NYCB's margin has consistently exceeded the industry average.
U.S. Thrifts
3.42%
3.40%
3.28%
3.19%
3.39%
NYCB
4.24%
3.79%
3.33%
3.59%
4.31%
4.17%
3.35%
7
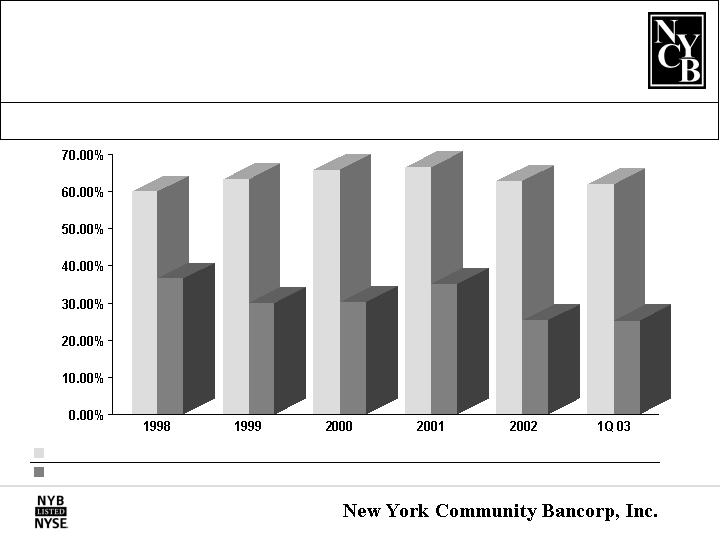
NYCB consistently ranks among the nation's most efficient thrifts.
Measure the Performance: Efficiency Ratio
NYCB
U.S. Thrifts
59.84%
63.13%
65.72%
66.42%
62.67%
36.51%
29.95%
30.20%
35.03%
25.32%
25.19%
(5)
(5)
61.81%
8
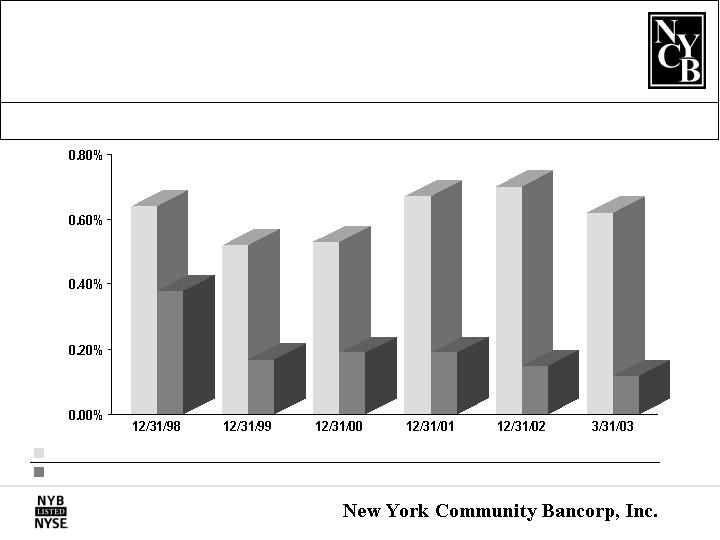
Measure the Quality: NPAs/Total Assets
Exceptional asset quality has been a hallmark of NYCB throughout its public life.
U.S. Thrifts
0.64%
0.52%
0.53%
0.67%
0.70%
NYCB
0.38%
0.17%
0.19%
0.19%
0.15%
0.12%
0.62%
9

Measure the Quality: NPLs/Total Loans
NYCB's asset quality reflects the strong performance of its multi-family loans.
U.S. Thrifts
0.76%
0.62%
0.61%
0.81%
0.83%
NYCB
0.41%
0.19%
0.25%
0.32%
0.30%
0.26%
0.76%
10
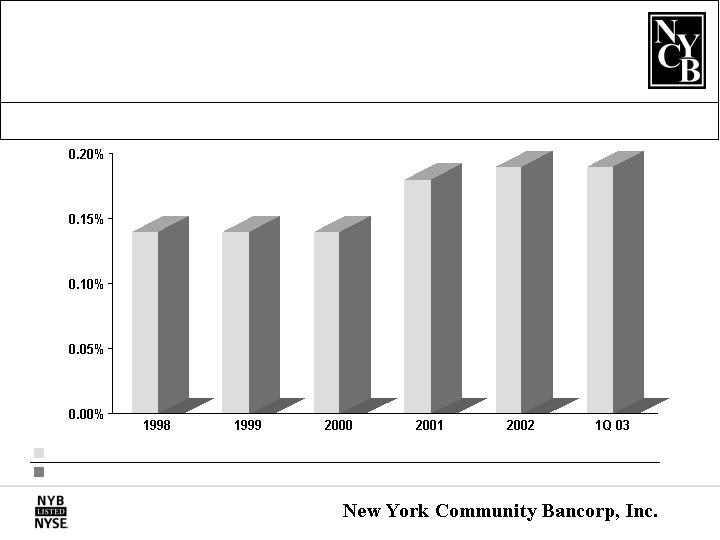
Measure the Quality: NCOs/Average Loans
The absence of any net charge-offs attests to NYCB's underwriting standards.
U.S. Thrifts
0.14%
0.14%
0.14%
0.18%
0.19%
NYCB
0.00%
0.00%
0.00%
0.00%
0.00%
0.00%
0.19%
11

Invest in the strength.
Strength: Industry Leader
#1 Top-performing Large Thrift in the U.S.
(for the 5th consecutive year)
#1 Best-performing Company - Total Returns
(Savings & Loans)
#4 Most Efficient Bank Holding Company
Among the Largest 500
ThriftINVESTOR
May 2003
The Wall Street Journal
March 10, 2003
American Banker
December 13, 2002
#20 Best-performing Company in the
Standard & Poor's MidCap 400 Index
BusinessWeek
Spring 2003
NYCB's performance and returns on investment have earned national recognition.
13
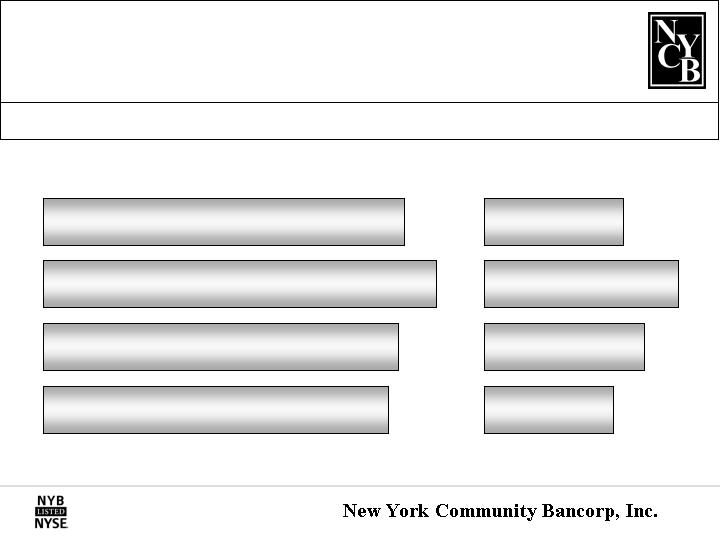
Strength: Market Leader
NYCB is a leading lender, depository, and producer of revenues.
SNL DataSource
Singer's Annuity and Funds Report
*
**
MARKET
LEADER
The leading producer of multi-family loans
for portfolio in New York City
The second largest thrift depository in Queens
and Staten Island*
The leading supermarket banking franchise
in the metro New York region*
Ranked within the top 3% of US thrifts generating
income from investment product sales**
The fifth largest thrift depository in New York City*
14

Total assets
Multi-family loans
Mortgage originations
Core deposits
Stockholders' equity
Tangible stockholders' equity(6)
1-4 family loans
NPAs / Total assets
Measure the Strength: Balance Sheet
The balance sheet has benefited from M&A, restructuring, and leveraged growth.
23
38
123
9
35
108
80
4
%
%
%
%
%
%
%
bp
Improvement
Since 12/31/01
bn
bn
bn
bn
bn
mn
mn
%
12/31/02
$11.3
$4.5
$2.6
$3.3
$1.3
$647.5
$265.7
0.15
bn
bn
mn
bn
bn
mn
mn
%
3/31/03
$12.0
$4.8
$771.1
$3.4
$1.3
$674.0
$232.6
0.12
15

Measure the Strength: Earnings
NYCB's 1Q 2003 earnings rose 45% year-over-year.
Diluted EPS†
Net interest income
Other operating income
ROA
Spread
Margin
Efficiency ratio
$0.50
$108.3
$26.4
2.24
4.03
4.17
25.19
mn
mn
%
%
%
%
64
81
12
64
74
72
971
%*(1)
%
%
bp*(3)
bp
bp
bp*(5)
1Q 2003
$1.67
$373.3
$101.8
2.29
4.12
4.31
25.32
mn
mn
%
%
%
%
2002
Y-O-Y
Improvement
40
30
34
24
3
1
754
%
%
%
bp
bp
bp
bp
Y-O-Y
Improvement
* As compared to 2001 core measures.
† Reflects a 4-for-3 stock split on May 21, 2003.
16
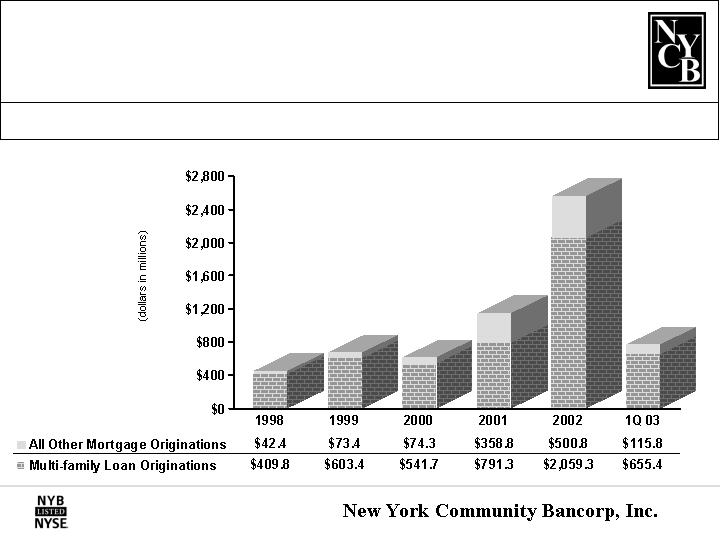
Strength: Multi-family Market Niche
NYCB is the #1 multi-family lender for portfolio in NYC.
17
Strength: Multi-family Lending Strategy
The strength of NYCB's performance reflects its emphasis on multi-family lending.
Rent-controlled / Rent-stabilized buildings
5-year fixed / 5-year adjustable term
Average term to refi: 4 years
Average loan: $2.0 million
Average LTV ratio: 58%
Stabilized cash flow
Pre-payment penalties: 5-4-3-2-1 points
A PROFITABLE, EFFICIENT, & RISK-AVERSE LOAN PORTFOLIO
No net charge-offs since 1987
18
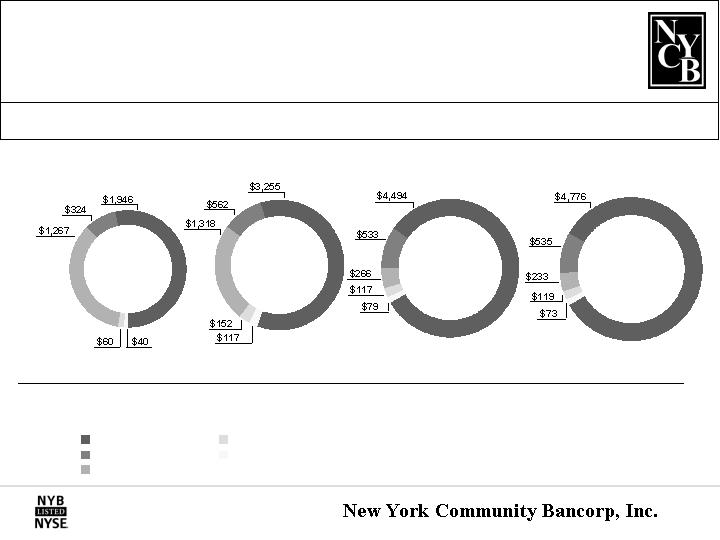
Strength: Risk-averse Loan Portfolio
The structure of NYCB's loan portfolio provides insulation against credit risk.
*
**
***
Includes loans acquired in the Haven transaction.
Includes loans acquired in the Richmond County transaction.
Reflects the securitization of 1-4 family loans totaling
$572.5 million in 2Q 2002.
(dollars in millions)
12/31/00
12/31/01
12/31/02
3/31/03
$3,636*
7.97%
$5,405**
7.71%
$5,489***
7.49%
$5,736
7.56%
Total Loans
Average Yield
Multi-family
Commercial real estate
1-4 family
Construction
Other
19

Total securities available for sale
Estimated weighted average yield
Strength: Investment Strategy
NYCB's securities portfolio is a source of cash flows for loan production.
(dollars in millions)
Available-for-Sale Securities
at March 31, 2003
Mortgage-backed and -related securities
Capital trust notes
Other
Mortgage-backed and -related securities
Estimated weighted average life
$4,079
4.7%
$3,663
1.7 years
20
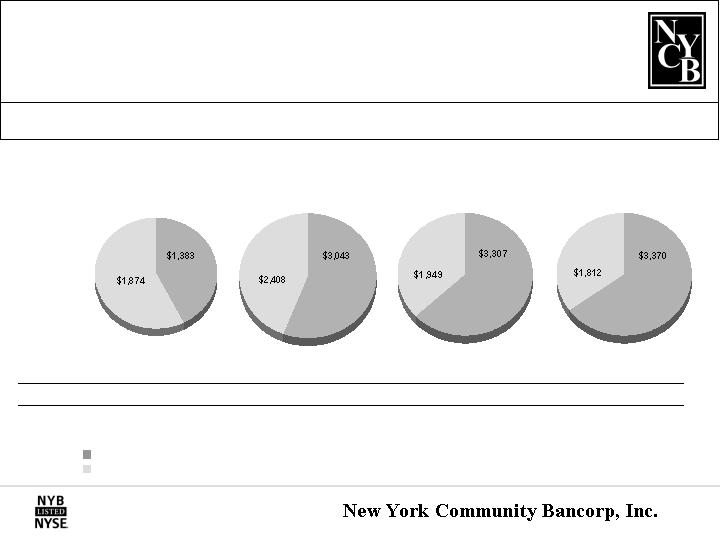
Core/Total Deposits
Total Deposits
Average Cost
42.5%
$3.3 Bn*
4.14%
55.8%
$5.5 Bn**
3.41%
62.9%
$5.3 Bn***
1.83%
Strength: Deposit Mix
12/31/01
12/31/00
12/31/02
Core deposits have grown 144% since 12/31/00.
(dollars in millions)
65.0%
$5.2 Bn
1.44%
3/31/03
Includes deposits acquired in the Haven transaction.
Includes deposits acquired in the Richmond County transaction.
Reflects the divestiture of 14 in-store branches.
*
**
***
Core deposits
CDs
21
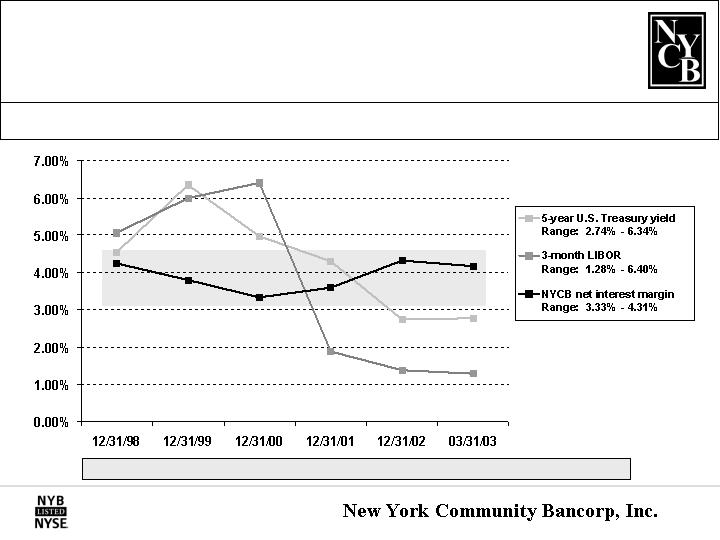
Strength: Interest Rate Risk Management
NYCB's margin has provided a cushion against interest rate volatility.
4.24%
3.79%
3.33%
3.59%
4.31%
NYCB NIM
4.17%
22
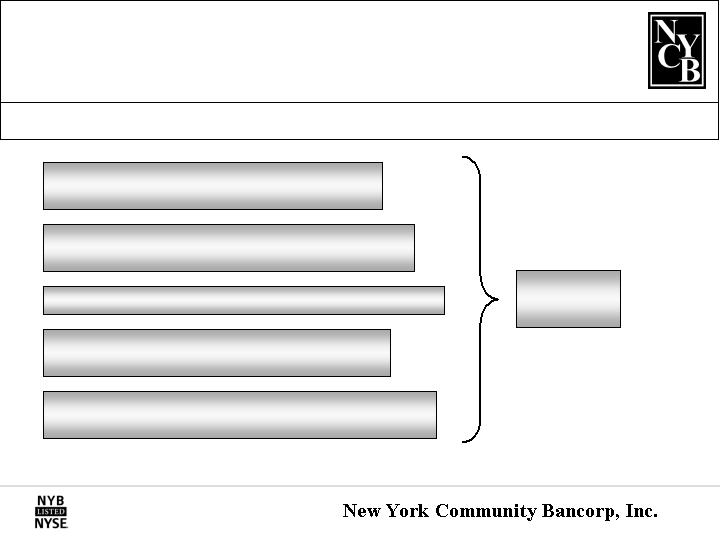
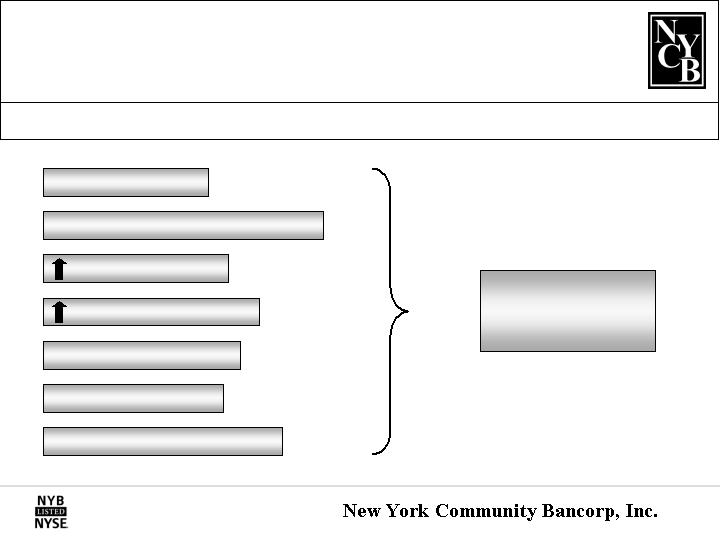
Strength: Efficiency
The consistent efficiency of NYCB's operations stems from several sources.
Emphasis on multi-family lending
Franchise expansion through M & A
De novo branch expansion at turn-key locations
Hub & spoke approach to in-store branching
Profitable conduit relationships
Sale of third-party products
EFFICIENCY
23
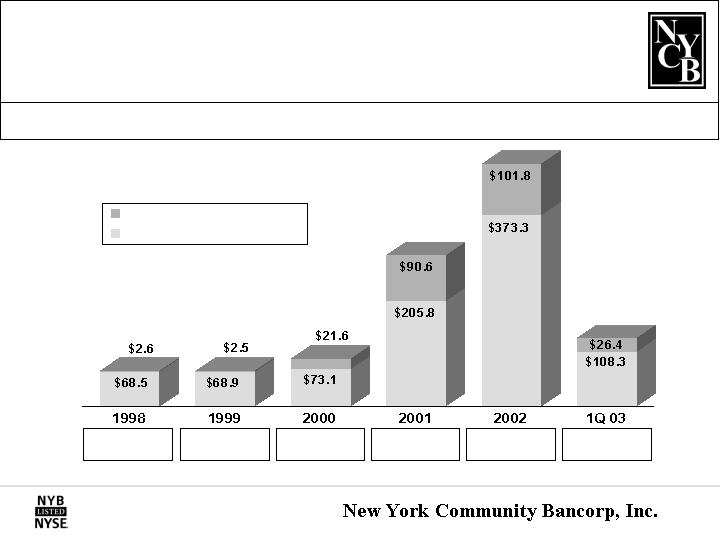
Strength: Revenue Generation
Total Revenues
$71.4
Other operating income represented 20% of 1Q 2003 revenues.
(dollars in millions)
Total Revenues
$94.7
Total Revenues
$296.4
Total Revenues
$475.1
Total Revenues
$134.7
Total Revenues
$71.1
Other operating income
Net interest income
24
Strength: Capital Management
NYCB actively manages its capital.
CAPITAL MANAGEMENT STRATEGIES
8 stock splits in 9 years, including a
4-for-3 split on 5/21/03
$147.5 million, net, generated in 2Q 02 secondary offering
4.3 million shares repurchased in 2002;
1.1 million in 1Q 03
57-fold increase in quarterly cash dividend,
including a 40% increase in 2003 to date
$267 million, net, generated in 4Q 02
offering of BONUSESSM Units
$600 million shelf registration filed in 1Q 03
25
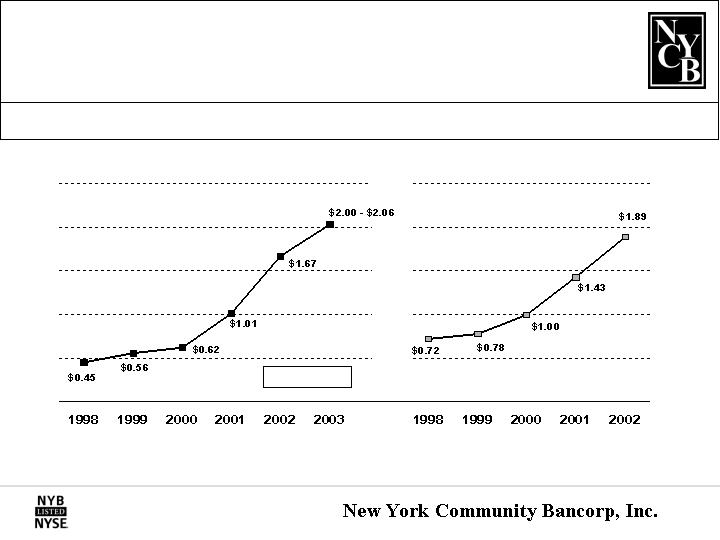
Strength: Earnings Capacity
NYCB projects 20% - 24% diluted EPS growth in 2003.
Diluted GAAP EPS*
Diluted Cash EPS*(7)
CAGR: 35.20%
Co. Estimates
(1)
(1)
Diluted GAAP and diluted cash EPS have been adjusted to reflect a 4-for-3 stock split on 5/21/03 and 3-for-2 stock splits on 3/29/01 and 9/20/01.
*
26
Strength: 2003 Projections
Several factors are currently expected to support diluted EPS growth in 2003.
REVENUE AND EXPENSE PROJECTIONS
~ 15% asset growth
~ 20% net multi-family loan growth
net interest income
other operating income
< 30% efficiency ratio
No loan loss provisions
~ 32% - 33% effective tax rate
27
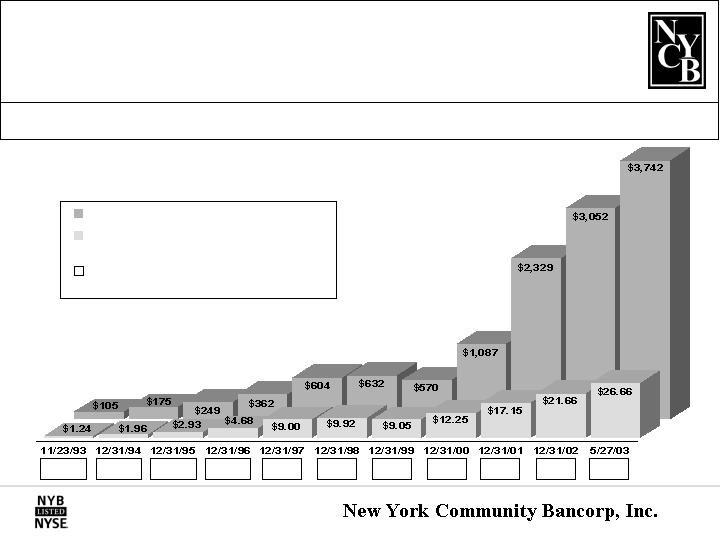
Market capitalization
Price per share (adjusted for 8 splits including a 4-for-3 stock split on 5/21/03)
Annual yield produced by $0.84 per share dividend on shares purchased at this date
Strength: Shareholder Value Creation
(dollars in millions, except share data)
67.74%
42.86%
28.67%
17.95%
9.33%
8.47%
9.28%
6.86%
4.90%
3.88%
3.15%
Since the IPO, the value of NYCB's shares has appreciated 2,050%.
28
NYCB has provided significant returns to its shareholders.
Strength: Returns to Shareholders
% Appreciation
Share Price
Dividend
2,050
359
104
5,700
152
110
NYCB – November 23, 1993
Haven – June 27, 2000*
Richmond County – March 27, 2001*
%
%
Reflects appreciation in the price per share and the quarterly cash dividend since the merger transaction was announced.
*
29

Reconciliation of GAAP and Non-GAAP Measures
Appendix
30
1.
As calculated in accordance with GAAP, the Company's 2000 and 2001 diluted earnings per share were $0.42 and $1.01, respectively. The 2000 amount reflected a gain of $13.5 million recorded in other operating income and a charge of $24.8 million recorded in operating expenses, resulting in a net charge of $11.4 million, or $0.20 per diluted share. The 2001 amount included a gain of $39.6 million recorded in other operating income and charges of $23.5 million and $3.0 million, respectively, recorded in operating expenses and income tax expense, resulting in an after-tax net charge of $836,000, or $0.01 per diluted share.
2.
The Company calculated its diluted cash earnings per share for 2002 by adding back to the year's net income non-cash items totaling $30.5 million. The Company calculated its diluted cash earnings per share for 1Q 2003 by adding back to the quarter's net income non-cash items totaling $4.9 million. Please see the table on page 32 for a reconciliation of the Company's diluted GAAP and cash earnings per share for the respective periods.
3.
As calculated in accordance with GAAP, the Company's 2000 and 2001 ROA were 1.06% and 1.63%, respectively. The Company's 2000 and 2001 core ROA excluded from net income the respective items identified in footnote 1, above.
4.
As calculated in accordance with GAAP, the Company's 2000 and 2001 ROE were 13.24% and 18.16%, respectively. The Company's 2000 and 2001 core ROE excluded from net income the respective items identified in footnote 1, above.
5.
As calculated in accordance with GAAP, the Company's 2000 and 2001 efficiency ratio were 52.08% and 38.04%, respectively. The Company's 2000 core efficiency ratio excluded a gain of $13.5 million on the sale of a Bank-owned property from other operating income and a merger-related charge of $24.8 million from operating expenses. Its 2001 core efficiency ratio excluded a gain of $39.6 million on the sale of certain assets from other operating income and a merger-related charge of $23.5 million from operating expenses.
6.
Please see the table on page 31 for a reconciliation of the Company's stockholders' equity and tangible stockholders' equity at March 31, 2003 and December 31, 2002 and 2001.
7.
Please see the table on page 32 for a reconciliation of the Company's diluted GAAP and diluted cash earnings per share for the years ended December 31, 1998, 1999, 2000, 2001, and 2002 .

(dollars in thousands)
Average stockholders' equity
Subtract:
Goodwill
�� Core deposit intangible
Average tangible stockholders' equity
Net income
Return on average stockholders' equity
Return on average tangible stockholders' equity
(dollars in thousands)
Average stockholders' equity
Subtract:
Goodwill
Core deposit intangible
Average tangible stockholders' equity
Net income
Return on average stockholders' equity
Return on average tangible stockholders' equity
Reconciliation of Stockholders' Equity and Tangible Stockholders' Equity
$575,290
314,109
19,583
$241,598
$104,467
18.16
43.24
$1,149,231
624,518
51,500
$ 473,213
$229,230
19.95
48.44
2002
2001
For the Years Ended December 31,
For the Three Months Ended
March 31, 2003
$1,332,946
624,518
50,000
$ 658,428
$67,368
20.22
40.93
%
%
%
Appendix
31
Appendix
(in thousands, except per share data)
Net income
Add back:
Amortization and appreciation of stock-related benefit plans
Associated tax benefits
Dividends on unallocated ESOP shares
Amortization of core deposit intangible and goodwill
Total additional contributions to tangible stockholder's equity
Cash earnings
Basic cash earnings per share
Diluted cash earnings per share
(in thousands, except per share data)
Net income
Add back:
Amortization and appreciation of stock-related benefit plans
Associated tax benefits
Dividends on unallocated ESOP shares
Amortization of core deposit intangible
Total additional contributions to tangible stockholder's equity
Cash earnings
Basic cash earnings per share
Diluted cash earnings per share
Cash Earnings Reconciliation
$26,944
6,724
8,071
2,019
--
16,814
$43,758
$0.77
$0.72
$31,664
2,559
7,269
2,857
--
12,685
$44,349
$0.80
$0.78
$24,477
24,795
5,953
2,776
494
34,018
$58,495
$1.04
$1.00
$104,467
22,775
11,000
2,302
8,428
44,505
$148,972
$1.46
$1.43
$229,230
5,902
15,860
2,718
6,000
30,480
$259,710
$1.91
$1.89
2002
2001
2000
1999
1998
For the Years Ended December 31,
$46,321
1,429
14,727
530
1,500
18,186
$64,507
$0.49
$0.49
$67,368
1,711
807
901
1,500
4,919
$72,287
$0.53
$0.53
2003
2002
For the Three Months Ended March 31,
32
For more information:
The Company trades on the NYSE under the symbol "NYB".
Log onto our web site: www.myNYCB.com
E-mail requests to: iangarola@myNYCB.com
Call Investor Relations at: (516) 683-4420
New York Community Bancorp, Inc.
615 Merrick Avenue
Westbury, NY 11590
Write to:
33
5/27/03