
Third Quarter 2003
Investor Presentation
Combining Strengths/Creating Value

Forward-looking Statements and Risk Factors
This presentation, and other written materials and oral statements made by management, may contain certain forward-looking statements
regarding the Company’s prospective performance and strategies, including the recent merger with Roslyn Bancorp, Inc., within the meaning of
Section 27A of the Securities Act of 1933, as amended, and Section 21E of the Securities Exchange Act of 1934, as amended. The Company
intends such forward-looking statements to be covered by the safe harbor provisions for forward-looking statements contained in the Private
Securities Litigation Reform Act of 1995, and is including this statement for purposes of said safe harbor provisions.
Forward-looking statements, which are based on certain assumptions and describe future plans, strategies, and expectations of the Company,
are generally identified by use of the words “plan,” “believe,” “expect,” “intend,” “anticipate,” “estimate,” “project,” or other similar expressions. The
Company’s ability to predict results or the actual effects of its plans and strategies, is inherently uncertain. Accordingly, actual results may differ
materially from anticipated results.
The following factors, among others, could cause the actual results of the merger to differ materially from the expectations stated in this
presentation: the ability to successfully integrate the companies following the merger, including integration of information systems and retention of
key personnel; the ability to effect the proposed restructuring; the ability to fully realize the expected cost savings and revenues; and the ability to
realize the expected cost savings and revenues on a timely basis.
Factors that could have a material adverse effect on the operations of the Company and its subsidiaries include, but are not limited to, changes in
general economic conditions; interest rates, deposit flows, loan demand, real estate values, competition, and demand for financial services and
loan, deposit, and investment products in the Company’s local markets; changes in the quality or composition of the loan or investment portfolios;
changes in accounting principles, policies, or guidelines; changes in legislation and regulation; changes in the monetary and fiscal policies of the
U.S. Government, including policies of the U.S. Treasury and the Federal Reserve Board; war or terrorist activities, and other economic,
competitive, governmental, regulatory, geopolitical, and technological factors affecting the Company’s operations, pricing, and services.
The Company undertakes no obligation to update these forward-looking statements to reflect events or circumstances that occur after the date on
which such statements were made.

Since 11/23/93, the value of NYCB’s shares has appreciated as much as 2,931%.
Market capitalization
Price per share (adjusted for 8 splits
including a 4-for-3 stock split on 5/21/03)
Annual yield produced by $1.00 per share
dividend on shares purchased at this date
(dollars in millions, except per share data)
80.6%
51.0%
34.1%
21.4%
11.1%
10.1%
11.0%
8.2%
5.8%
4.6%
3.4%
3.2%
2.7%
Combining Strengths/Creating Value: Market Cap

Combining Strengths/Creating Value: Market Cap
With a market cap of $7 billion, we are the nation’s third most valuable thrift.
1
Washington Mutual
2
Golden West
3
New York Community
4
Hudson City
5
Sovereign
1
Computer Associates
2
New York Community
3
North Fork
4
Keyspan
5
Kimco Realty
1
New York Community
2
GreenPoint Financial
3
Astoria Financial
4
Independence Community
5
Staten Island Bancorp
U.S. THRIFTS
LONG ISLAND-
BASED COMPANIES
NEW YORK THRIFTS
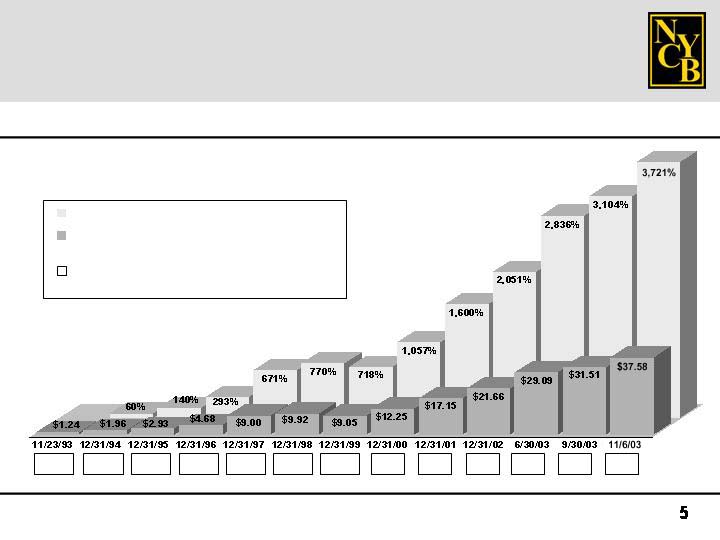
Since 11/23/93, the total return to our charter investors has been as high as 3,721%.
Combining Strengths/Creating Value: Total Returns
Total return from 11/23/93 through the date noted,
assuming dividends were reinvested
Price per share (adjusted for 8 splits including
a 4-for-3 stock split on 5/21/03)
Annual yield produced by $1.00 per share
dividend on shares purchased at this date
(dollars in millions, except per share data)
80.6%
51.0%
34.1%
21.4%
11.1%
10.1%
11.0%
8.2%
5.8%
4.6%
3.4%
3.2%
2.7%

%
%
(a)
Total return provided since the date noted, assuming dividends were reinvested
(b)
Reflects increase in NYCB’s quarterly cash dividend since NYCB’s IPO and since each merger transaction was announced
Each of our merger transactions has provided an opportunity for share value creation.
Combining Strengths/Creating Value: Total Returns
Total Return
thru 11/6/03 (a)
Increase in
Dividend (b)
3,721
557
195
40
6,657
200
200
19
NYCB – November 23, 1993
Haven – June 27, 2000
Richmond County – March 27, 2001
Roslyn – June 27, 2003
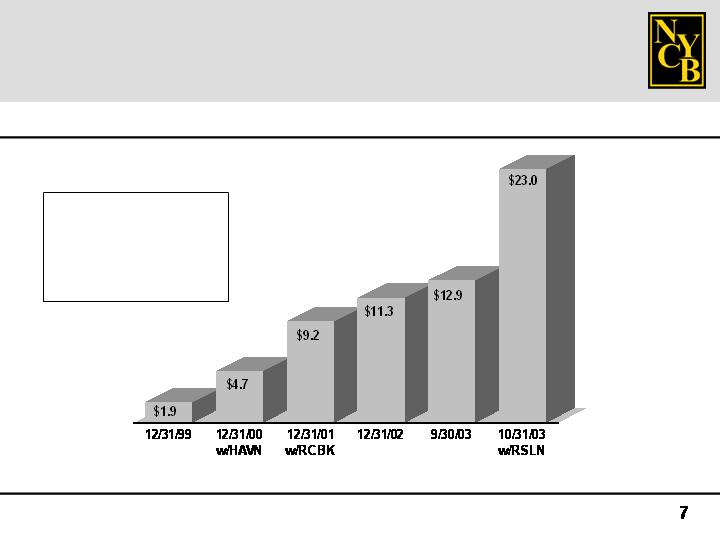
Combining Strengths/Creating Value: Total Assets
With assets of approximately $23 billion, we are the largest thrift in New York State.
(dollars in billions)
1.
New York Community
2.
GreenPoint Financial
3.
Astoria Financial
4.
Independence Community
5.
Staten Island Bancorp
SUFFOLK
NASSAU
QUEENS
BROOKLYN
STATEN
ISLAND
MANHATTAN
BRONX
NEW JERSEY
WESTCHESTER
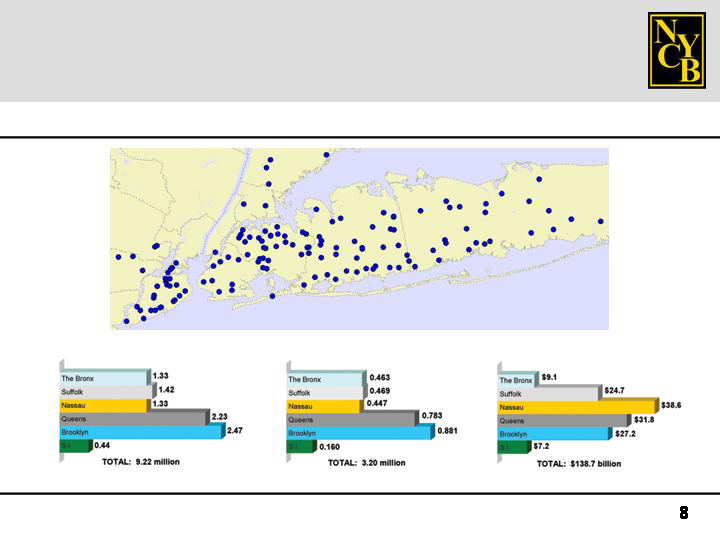
Map Source: Y-Merge.com, a division of SNL Financial
POPULATION
(in millions)
HOUSEHOLDS
(in millions)
TOTAL DEPOSITS
(in billions)
We serve over one million accounts in a highly attractive marketplace.
Combining Strengths/Creating Value: The Marketplace
We rank among the leading thrifts in our core markets.
Rank
Total
Deposit
Share
Thrift
Rank
Total
Deposit
Share
Thrift
Rank
Total
Deposit
Share
Thrift
QUEENS
STATEN ISLAND
NASSAU
Source: SNL DataSource. Deposit data as of June 30, 2003.
Combining Strengths/Creating Value: The Franchise
SIB
33.82%
NYCB
19.33
WM
7.04
ICBC
3.58
AF
9.16%
NYCB
8.73
GPT
6.97
Ridgewood
4.38
ICBC
1
2
3
4
5
1
2
3
4
1
2
3
4
2.62
GPT
10.57%
NYCB
9.92
AF
9.29
WM
7.04

We compete for depositors by emphasizing convenience and community.
Combining Strengths/Creating Value: The Franchise
Convenience:
Multiple delivery channels; 147 locations; 24/7 access
Service:
State-of-the-art technology expedites transaction processing,
account access
Choices:
Full-service menu of traditional banking products is
complemented by an extensive range of third-party investment
products
Focus:
Strong consumer orientation attracts depositors underserved
by commercial banks
Longevity:
We’ve been serving depositors for more than 140 years
Brand Equity:
Community identity is maintained through local divisions
staffed from, and involved in, the neighborhoods where our
customers live and work
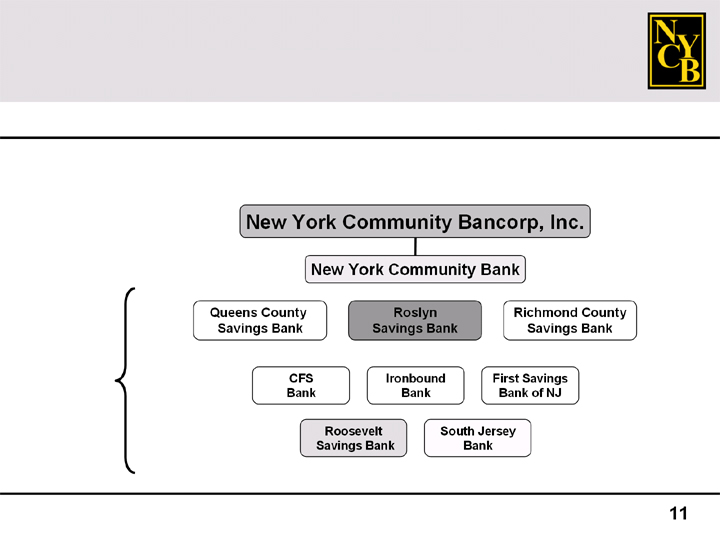
Multiple
Community
Divisions
Our structure recognizes and capitalizes on the brand equity of our divisional banks.
Combining Strengths/Creating Value: The Franchise
We are the leading producer of multi-family loans for portfolio in New York City.
All Other Loan Originations
Multi-family Loan Originations
Pipeline
(in millions)
$616
$1,150
$2,560
$2,357
Total
(9 Mos.
Originations)
Combining Strengths/Creating Value: The Lending Niche
(stand-alone)
$681
$1,459

We compete for borrowers by emphasizing our niche lending expertise.
Combining Strengths/Creating Value: The Lending Niche
Expertise:
Originating multi-family and construction loans with the best
credit results over many decades of cyclical change
Service:
Rapid response and consistency expedite loan origination
process
Relationships:
Long-standing relationships with several of NYC’s leading
mortgage brokers and property owners; primary relationship
with 9 of Long Island’s top 10 developers
Flexibility:
Loans are tailored to suit the needs of the borrower while
preserving credit quality
Capacity:
As a larger company, we have the ability to originate
significantly larger loans to the best cash-flow property
owners and developers

Rent-controlled /-stabilized buildings
generate stable cash flow
5-year fixed / 5-year adjustable term
Pre-payment penalties: 5-4-3-2-1
points
Average term to refi: 4 years
Average loan at 9/30/03: $2.1 million
Average LTV ratio at 9/30/03: 56.4%
No net charge-offs since 1987
We have a profitable, efficient, and risk-averse lending niche.
Construction loans currently yielding
spreads of approximately 300 bps
Adjustable rate loans, tied to prime
or LIBOR
Average project takes 18-24 months
to complete
No net charge-offs on construction
loans originated since 1993
Multi-family Loans
Construction Loans
Combining Strengths/Creating Value: The Lending Niche
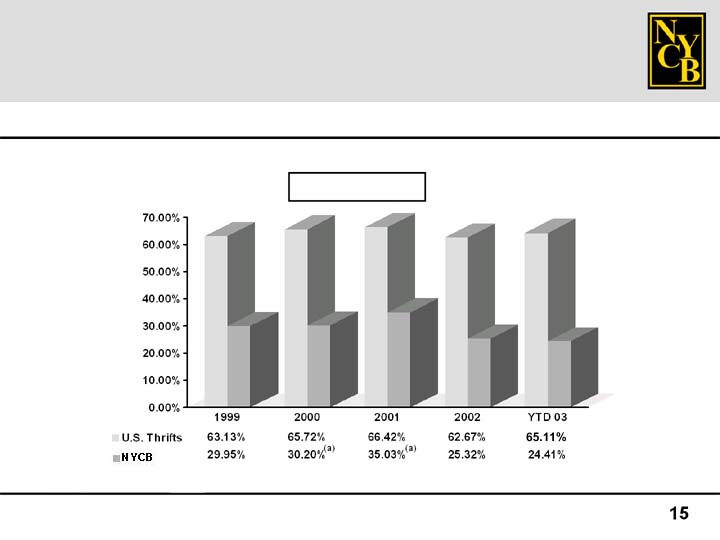
Efficiency Ratio
(a) Core efficiency ratio; please see reconciliation to GAAP efficiency ratio on Page 26, #1.
Industry Data Source: SNL Financial
We have been ranked the nation’s 3rd most efficient bank holding company.
Combining Strengths/Creating Value: Efficiency
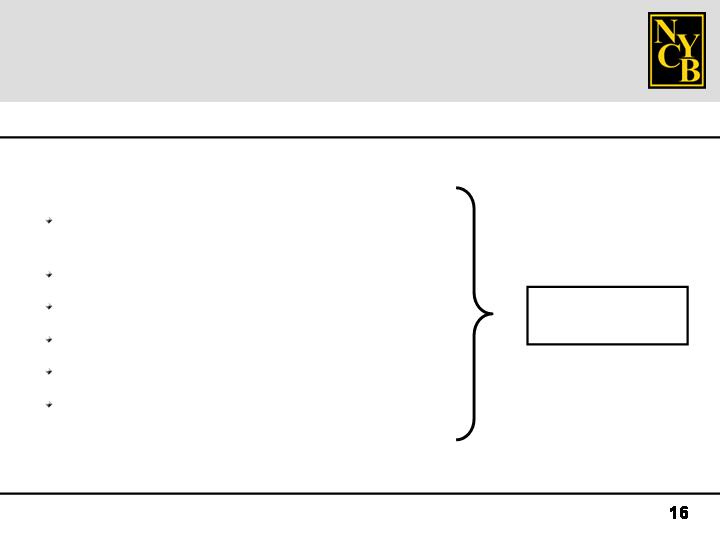
Emphasis on multi-family / construction
lending
Above-average deposits per traditional branch
Franchise expansion through M & A
Cost-effective de novo branch expansion
Hub & spoke approach to in-store branching
Profitable third-party alliances
SOURCES OF
EFFICIENCY
Combining Strengths/Creating Value: Efficiency
Efficiency is a key component of our lending and retail banking strategies.
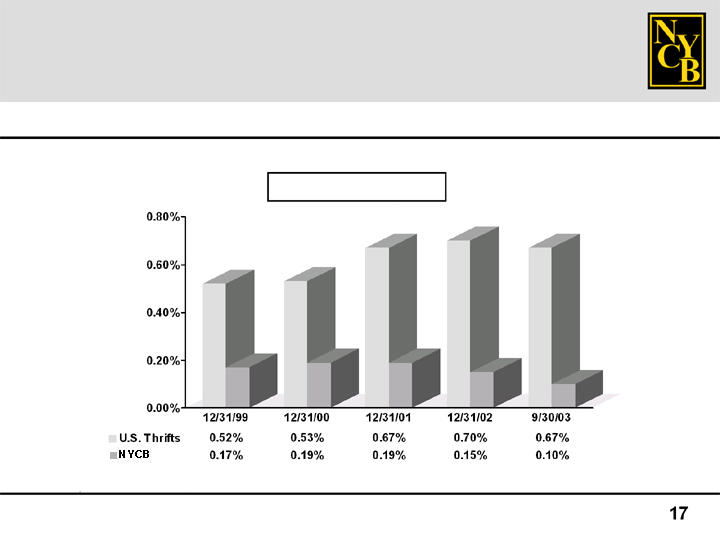
Exceptional asset quality has been a hallmark of NYCB throughout our public life.
NPAs to Total Assets
Industry Data Source: SNL Financial
Combining Strengths/Creating Value: Asset Quality

The quality of our assets attests to our underwriting standards.
NCOs to Average Loans
Industry Data Source: SNL Financial
Combining Strengths/Creating Value: Asset Quality

We have been ranked the nation’s top-performing thrift for the past 5 years. (a)
(a)
May 2003 ThriftINVESTOR
(b)
SNL DataSource
(c)
Please see reconciliation to GAAP earnings on Page 26, #2.
Ranking
Criteria
NYCB
Cash (c)
NYCB
GAAP
Industry
Average (b)
At or for the
9 Months Ended
September 30, 2003
NYCB
Cash (c)
NYCB
GAAP
Industry
Average (b)
At or for the
12 Months Ended
December 31, 2002
Combining Strengths/Creating Value: Performance
ROA
ROE
Efficiency ratio
NPAs/Total assets
NCOs/Average loans
2.59%
22.60
25.50
0.15
0.00
2.29%
19.95
25.32
0.15
0.00
0.87%
9.07
62.67
0.70
0.19
2.57%
23.84
22.90
0.10
0.00
2.29%
21.24
24.41
0.10
0.00
0.86%
9.15
65.11
0.67
0.22
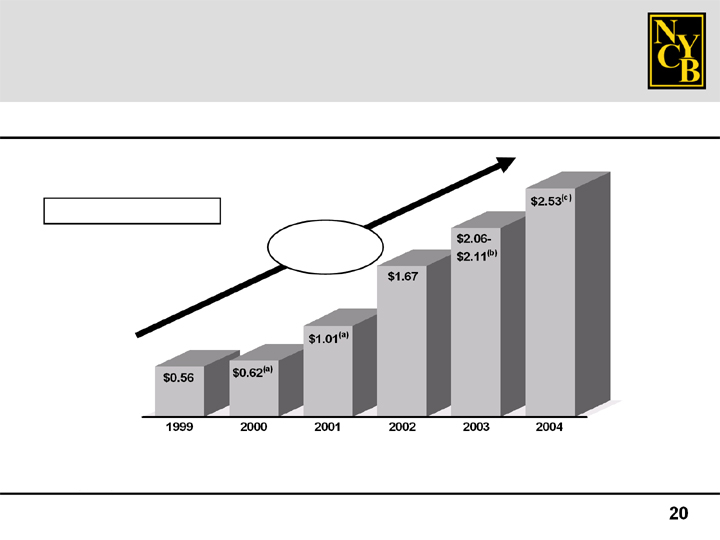
(a)
Diluted core EPS; please see reconciliation to diluted GAAP EPS on Page 26, #3.
(b)
Company estimates, excluding the impact of the RSLN merger and the anticipated sale of the South Jersey Bank Division in 4Q 03.
(c)
On June 27, 2003, the Company projected 2004 diluted EPS of $2.53, reflecting a projected $3.5 billion reduction in securities, which was expected to reduce pro forma diluted EPS from $2.72 to $2.53. The Company currently expects to issue updated 2004 diluted EPS projections in January 2004, when it issues its full-year 2003 earnings release.
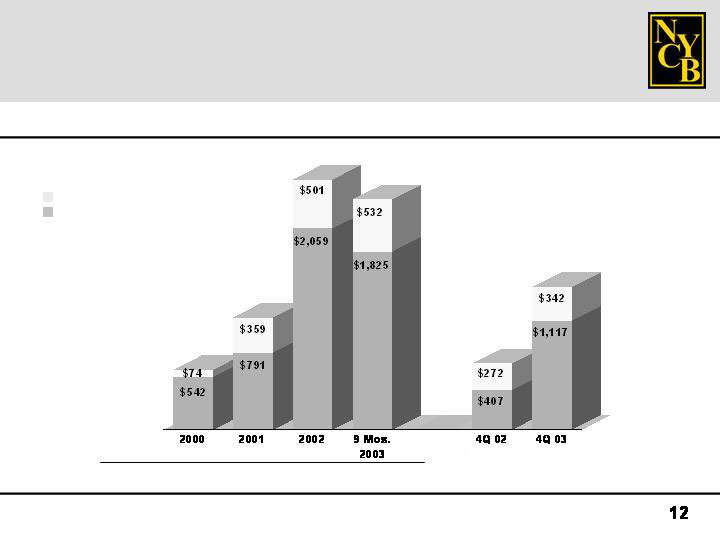
We expect to exceed the 10% earnings accretion originally projected for 2004.
CAGR:
35.20%
Combining Strengths/Creating Value: Performance
DILUTED EPS GROWTH

Systems conversion is set for the holiday weekend of January 17 – 19
Post-conversion, the divisional structure will capitalize on the brand equity in
three key markets:
Roslyn Savings Bank Division: 59 branches serving Long Island
Queens County Savings Bank Division: 32 branches serving Queens
Roosevelt Savings Bank Division: 9 branches serving Brooklyn
Assets and liabilities are currently under assessment to determine the best mix
in the current rate environment
Significant cash flows generated by Roslyn’s securities portfolio being invested
in higher yielding assets
Combined 4Q 2003 mortgage pipeline exceeds $2 billion
Our post-merger integration is progressing on schedule.
Combining Strengths/Creating Value: Post-merger Integration
Post-HAVN
Sold loans and securities
Downsized borrowings
Post-RCBK
Sold and securitized loans
Post-RSLN
Anticipate downsizing securities
and borrowings by approximately
$3.5 billion
Reduces interest rate risk
Reduces credit risk
Reduces extension risk
Enhances the quality of earnings
Enhances net interest margin
Strategy
Benefits
We restructured the balance sheet following each of our prior merger transactions.
Combining Strengths/Creating Value: Post-merger Integration

Our record of value creation has earned national recognition…
#1 Top-performing Large Thrift in the U.S.
(for the 5th consecutive year)
ThriftINVESTOR
May 2003
#1 Best-performing Company – Total Returns
(Savings & Loans)
#2 Best-performing CEO (based on total returns
to shareholders and compensation)
The Wall Street Journal
March 10, 2003
Forbes
May 12, 2003
#3 Most Efficient Bank Holding Company
Among the Largest 500
American Banker
September 4, 2003
#7 Fastest Growing Company in America
Fortune Magazine
September 1, 2003
Combining Strengths/Creating Value: Investment Returns

Combining Strengths/Creating Value: Investment Returns
…and we believe the best is yet to come.
With more assets, an expanded franchise, and
greater earnings potential, we believe we are
better positioned today to create shareholder value
than at any prior time in our ten-year history.

We trade on the NYSE under the symbol “NYB”.
For More Information:
Log onto our web site: www.myNYCB.com
E-mail requests to: iangarola@myNYCB.com
Call Investor Relations at: (516) 683-4420
Write to:
New York Community Bancorp, Inc.
615 Merrick Avenue
Westbury, NY 11590

Appendix
1.
As calculated in accordance with GAAP, the Company’s 2000 and 2001 efficiency ratios were 52.08% and 38.04%, respectively. The Company’s
2000 core efficiency ratio excluded a gain of $13.5 million on the sale of a Bank-owned property from other operating income and a merger-related
charge of $24.8 million from operating expenses. Its 2001 core efficiency ratio excluded a gain of $39.6 million on the sale of certain assets from
other operating income and a merger-related charge of $23.5 million from operating expenses.
2.
The Company calculated its diluted cash earnings per share for 2002 by adding back to the year’s net income non-cash items totaling $30.5 million.
The Company calculated its diluted cash earnings per share for 9 Months 2003 by adding back to nine-month 2003 net income non-cash items
totaling $25.9 million. Please see the table below for a reconciliation of the Company’s diluted GAAP and cash earnings per share for the respective
periods.
Reconciliation of GAAP and Non-GAAP Measures
(in thousands, except per share data)
Net income
Add back:
Amortization and appreciation of stock-related benefit plans
Associated tax benefits
Dividends on unallocated ESOP shares
Amortization of core deposit intangible and goodwill
Total additional contributions to tangible stockholder’s equity
Cash earnings
Basic cash earnings per share
Diluted cash earnings per share
$211,306
6,375
12,046
3,017
4,500
25,938
$237,244
$1.77
$1.73
$229,230
5,902
15,860
2,718
6,000
30,480
$259,710
$1.91
$1.89
2002
2003
For the Twelve Months Ended
December 31,
For the Nine Months Ended
September 30,
3.
As calculated in accordance with GAAP, the Company’s 2000 and 2001 diluted earnings per share were $0.42 and $1.01, respectively. The 2000
amount reflected a gain of $13.5 million recorded in other operating income and a charge of $24.8 million recorded in operating expenses, resulting in a
net charge of $11.4 million, or $0.20 per diluted share. The 2001 amount included a gain of $39.6 million recorded in other operating income and
charges of $23.5 million and $3.0 million, respectively, recorded in operating expenses and income tax expense, resulting in an after-tax net charge of
$836,000, or $0.01 per diluted share.