STRATEGIES & STRENGTHS
2003Investor Presentation
Smith Barney Citigroup
Financial Services Conference
January 28, 2004
2 or other similar expressions. The Inc., is after the date on “project,” “estimate,” “anticipate,” “intend,” demand, real estate values, competition, and demand for financial services and Federal Reserve Board; war or terrorist activities; and other economic, “expect,” This presentation, and other written materials and oral statements made by management, may contain certain forward-looking statements regarding the Company’s prospective performance and strategies within the meaning of Section 27A of the Securities Act of 1933, as amended, and Section 21E of the Securities Exchange Act of 1934, as amended. The Company intends such forward-looking statements to be covered by “believe,” competitive, governmental, regulatory, geopolitical, and technological factors affecting the Company’s operations, pricing, and services. The Company undertakes no obligation to update these forward-looking statements to reflect events or circumstances that occur Forward-looking Statements and Risk Factors the safe harbor provisions for forward-looking statements contained in the Private Securities Litigation Reform Act of 1995, and is including this statement for purposes of said safe harbor provisions. Forward-looking statements, which are based on certain assumptions and describe future plans, strategies, and expectations of the Company, are generally identified by use of the words “plan,” Company’s ability to predict results or the actual effects of its plans and strategies, including the recent merger with Roslyn Bancorp, inherently uncertain. Accordingly, actual results may differ materially from anticipated results. The following factors, among others, could cause the actual results of the merger to differ materially from the expectations stated in this presentation: the ability to successfully integrate the companies following the merger, including the retention of key personnel; the ability to effect the proposed restructuring; the ability to fully realize the expected cost savings and revenues; and the ability to realize the expected cost savings and revenues on a timely basis. Factors that could have a material adverse effect on the operations of the Company and its subsidiaries include, but are not limited to, changes in general economic conditions; interest rates, deposit flows, loan loan, deposit, and investment products in the Company’s local markets; changes in the quality or composition of the loan or investment portfolios; changes in accounting principles, policies, or guidelines; changes in legislation and regulation; changes in the monetary and fiscal policies of the U.S. Government, including policies of the U.S. Treasury and the which such statements were made.
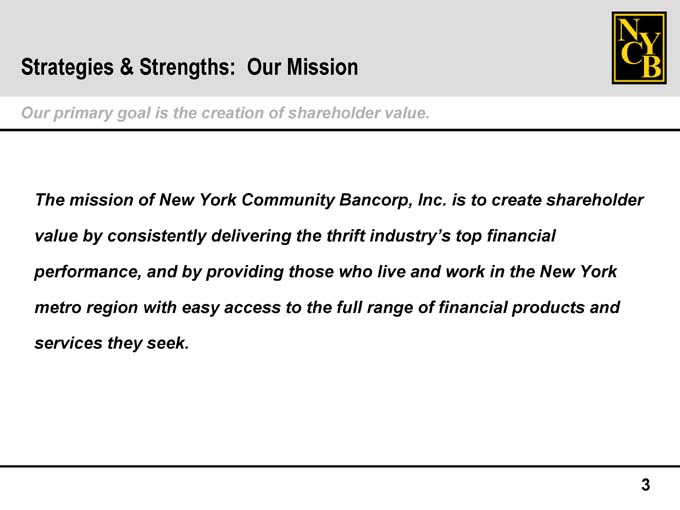
Strategies & Strengths: Our Mission
3 York The mission of New York Community Bancorp, Inc. is to create shareholder value by consistently delivering the thrift industry’s top financial performance, and by providing those who live and work in the New metro region with easy access to the full range of financial products and Our primary goal is the creation of shareholder value. services they seek.
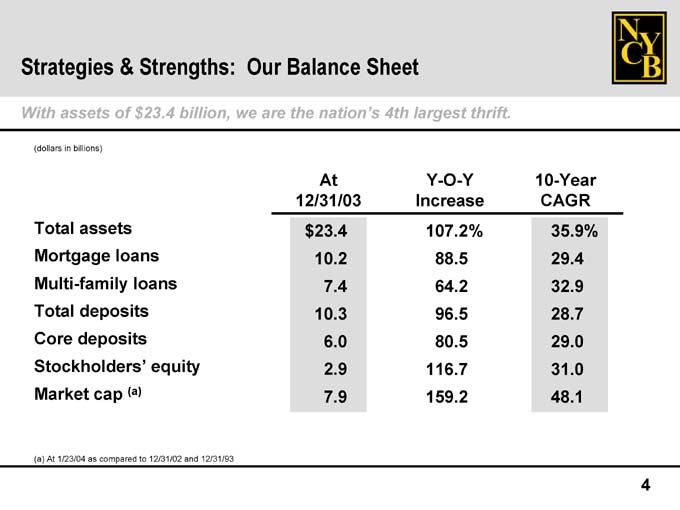
4 % 10-Year CAGR 35.9 29.4 32.9 28.7 29.0 31.0 48.1 % Y-O-Y Increase 107.2 88.5 64.2 96.5 80.5 116.7 159.2 Our Balance Sheet At 12/31/03 $23.4 10.2 7.4 10.3 6.0 2.9
7.9 Core deposits (a) Strategies & Strengths: With assets of $23.4 billion, we are the nation’s 4th largest thrift. (dollars in billions) Total assets Mortgage loans Multi-family loans Total deposits Stockholders’ equity Market cap (a) At 1/23/04 as compared to 12/31/02 and 12/31/93
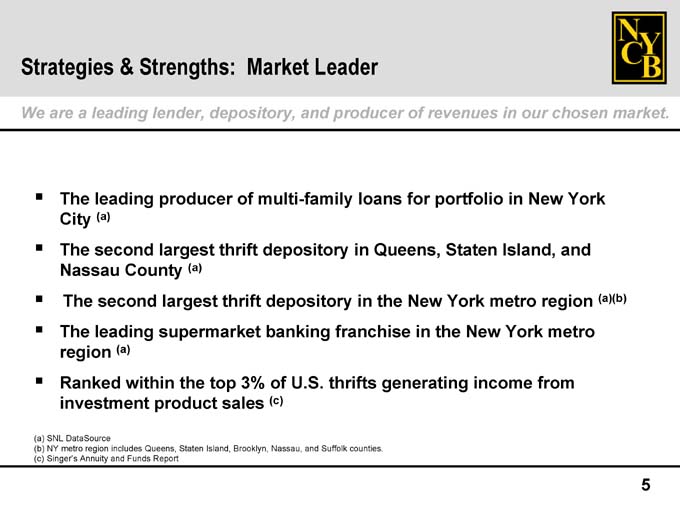
5 our chosen market. (a)(b) Market Leader (c) (a) (a) (a) The second largest thrift depository in the New York metro region investment product sales The leading producer of multi-family loans for portfolio in New York City The second largest thrift depository in Queens, Staten Island, and Nassau County The leading supermarket banking franchise in the New York metro region Ranked within the top 3% of U.S. thrifts generating income from SNL DataSource NY metro region includes Queens, Staten Island, Brooklyn, Nassau, and Suffolk counties. Singer’s Annuity and Funds Report Strategies & Strengths: We are a leading lender, depository, and producer of revenues in ? ? ? ? ? (a) (b) (c)
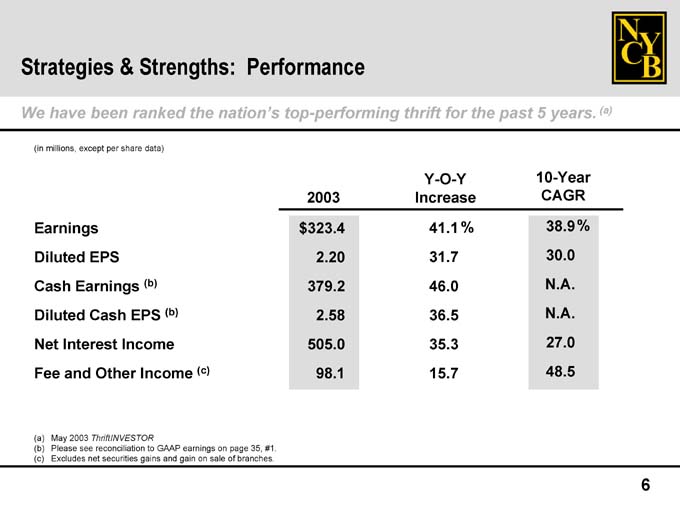
6 (a) % 10-Year CAGR 38.9 30.0 N.A. N.A. 27.0 48.5 % Y-O-Y Increase 41.1 31.7 46.0 36.5 35.3 15.7 Performance 2003 $323.4 2.20 379.2 2.58 505.0 98.1 (c) (b) (b) ThriftINVESTOR Please see reconciliation to GAAP earnings on page 35, #1. Diluted Cash EPS May 2003 Excludes net securities gains and gain on sale of branches. Strategies & Strengths: We have been ranked the nation’s top-performing thrift for the past 5 years. (in millions, except per share data) Earnings Diluted EPS Cash Earnings Net Interest Income Fee and Other Income (a) (b) (c)
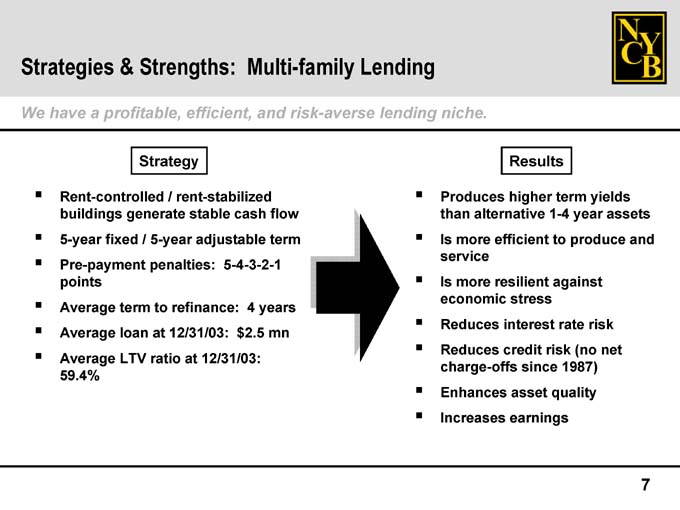
• assets and 7 yields risk net year produce (no 1987) term 1-4 to against rate quality risk Results higher alternative efficient resilient stress interest credit since asset earnings more service more charge-offs Enhances Produces than Is Is economic Reduces Reduces Increases • ? ? ? ? ? • years mn 4 $2.5 12/31/03: rent-stabilized refinance: 12/31/03: at / Strategy to at ratio term loan LTV • Rent-controlled points Average Average Average 59.4% • ? ? ? • niche. • Lending lending • risk-averse • Multi-family and flow term • cash adjustable 5-4-3-2-1 efficient, stable 5-year penalties: • Strengths: generate / • & profitable, fixed a buildings 5-year Pre-payment have • Strategies We ?
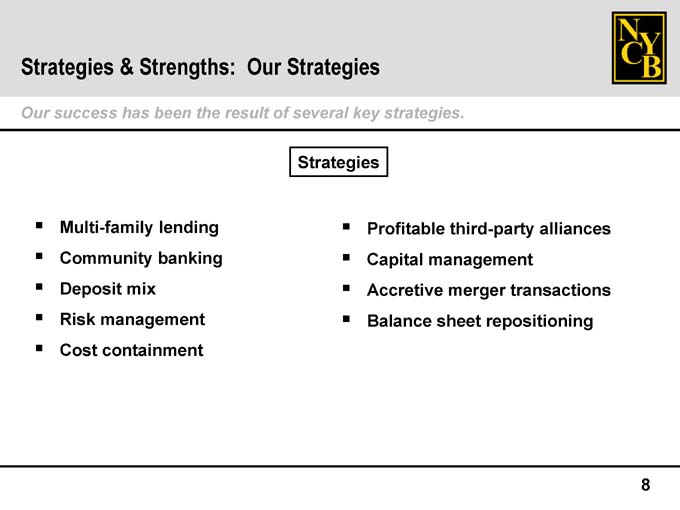
• 8 • alliances transactions repositioning third-party management merger sheet Profitable Capital Accretive Balance Strategies ? ? ? mix containment Deposit Cost • ? • strategies. key • Strategies several Our of • result the lending banking • Strengths: been • & has management success Multi-family Community Risk • Strategies Our ? ?
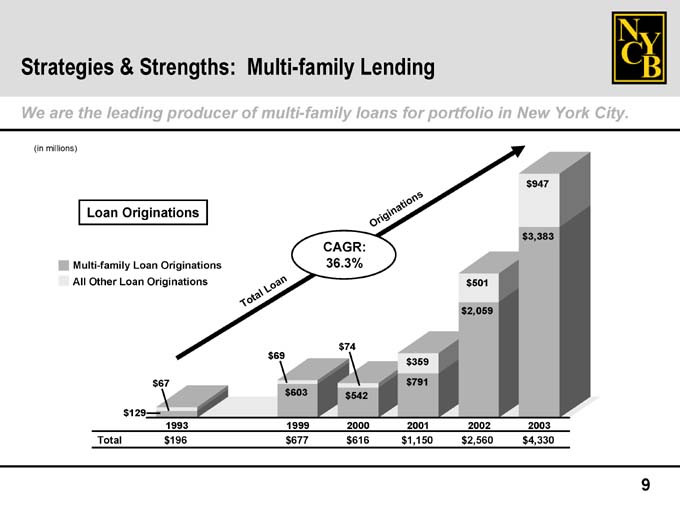
9 $947 $3,383 2003 $4,330 $501 $2,059 2002 $2,560 s n o $359 $791 2001 i t $1,150 a n i g i r O 2000 $616 $542 $74 CAGR: 36.3% $603 1999 $677 n a o L $69 l a t Multi-family Lending o T 1993 $196 $67 $129 Loan Originations Multi-family Loan Originations All Other Loan Originations Total Strategies & Strengths: We are the leading producer of multi-family loans for portfolio in New York City. (in millions)
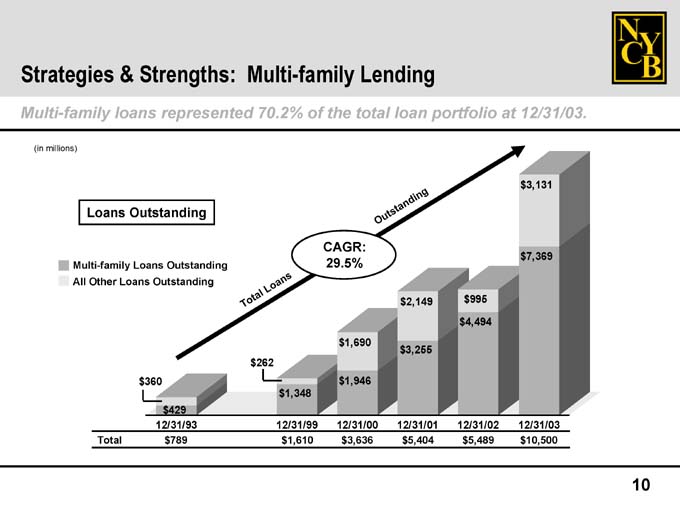
Strategies & Strengths: Multi-family LendingMulti-family loans represented 70.2% of the total loan portfolio at 12/31/03.
Loans OutstandingMulti-family Loans Outstanding All Other Loans Outstanding
12/31/93 12/31/99 12/31/00 12/31/01 12/31/02 12/31/03 Total $ 789 $ 1,610 $ 3,636 $ 5,404 $ 5,489 $ 10,500
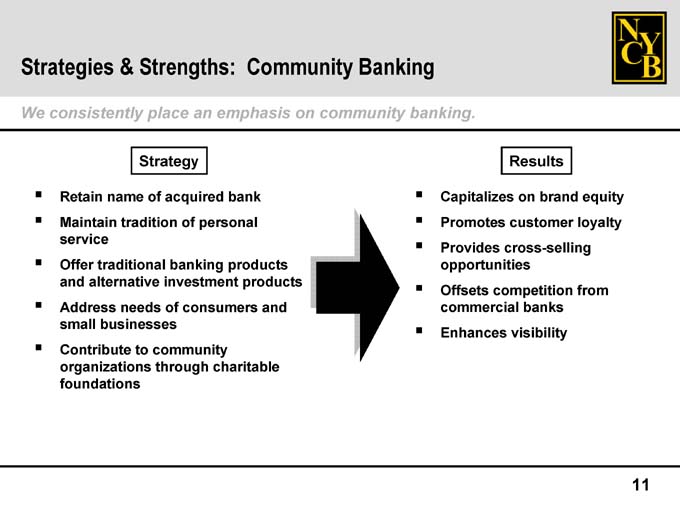
• 11 • equity loyalty from brand banks Results on customer cross-selling competition visibility Capitalizes Promotes Provides opportunities Offsets commercial Enhances • ? ? ? • products and bank products consumers charitable acquired banking investment of community through • Strategy of name traditional alternative needs businesses to Retain service Offer and Address small Contribute organizations foundations • ? ? ? • banking. Banking community • Community on • emphasis personal an • Strengths: place of • & tradition • Strategies consistently Maintain We
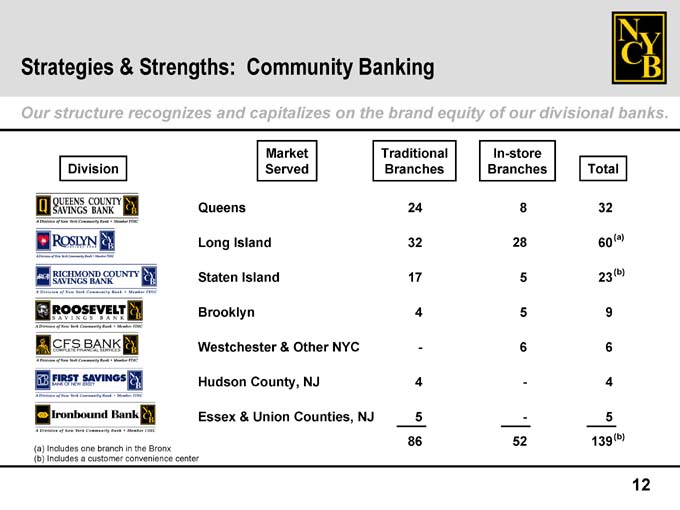
12 (a) (b) (b) Total 32 60 23 9 6 4 5 139 In-store Branches 8 28 5 5 6—- 52 Traditional Branches 24 32 17 4—4 5 86 Community Banking Market Served Queens Long Island Staten Island Brooklyn Westchester & Other NYC Hudson County, NJ Essex & Union Counties, NJ Division Includes one branch in the Bronx Includes a customer convenience center Strategies & Strengths: Our structure recognizes and capitalizes on the brand equity of our divisional banks. (a) (b)
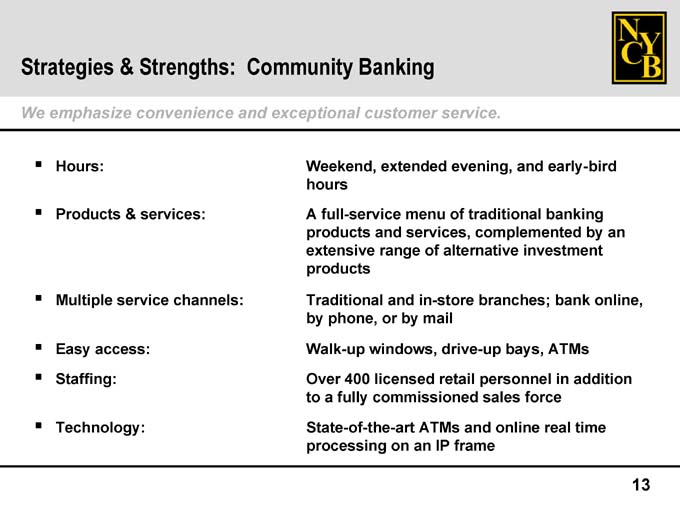
13 Community Banking Weekend, extended evening, and early-bird hours A full-service menu of traditional banking products and services, complemented by an extensive range of alternative investment products Traditional and in-store branches; bank online, by phone, or by mail Walk-up windows, drive-up bays, ATMs Over 400 licensed retail personnel in addition to a fully commissioned sales force State-of-the-art ATMs and online real time processing on an IP frame Hours: Products & services: Multiple service channels: Easy access: Staffing: Technology: Strategies & Strengths: We emphasize convenience and exceptional customer service. ? ? ? ? ? ?
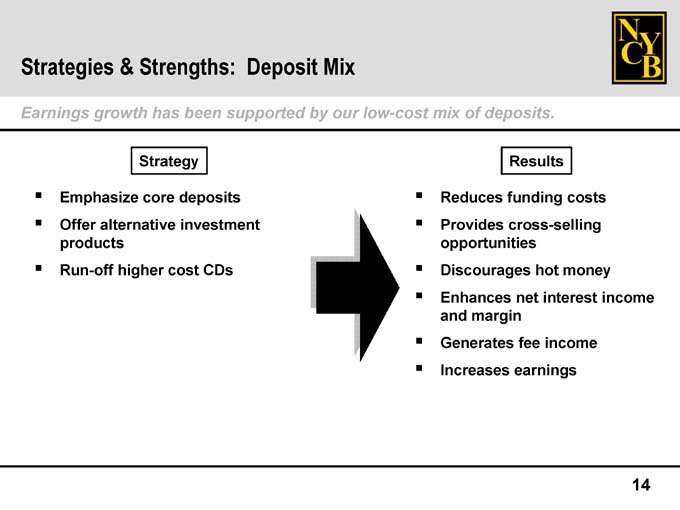
• income 14 costs money interest income hot deposits. Results funding cross-selling net fee earnings of Reduces Provides opportunities Discourages Enhances margin Generates mix and Increases low-cost ? ? ? ? ? • Mix our • by Deposit supported been deposits investment CDs cost Strengths: has Strategy core & growth alternative higher Emphasize Offer products Run-off • Strategies Earnings ? ? ?
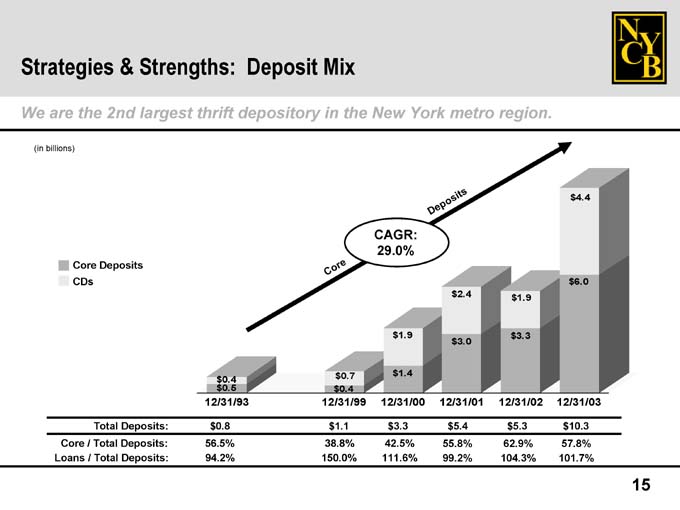
15 $4.4 $6.0 12/31/03 $10.3 57.8% 101.7% $1.9 $3.3 12/31/02 $5.3 62.9% 104.3% s t i s o $2.4 $3.0 $5.4 55.8% 99.2% p 12/31/01 e D $1.9 $1.4 $3.3 42.5% 111.6% 29.0% 12/31/00 CAGR: e r $0.7 Deposit Mix o C $0.4 12/31/99 $1.1 38.8% 150.0% $0.4$0.5 12/31/93 $0.8 56.5% 94.2% Total Deposits: Core Deposits CDs Core / Total Deposits: Loans / Total Deposits: Strategies & Strengths: We are the 2nd largest thrift depository in the New York metro region. (in billions)
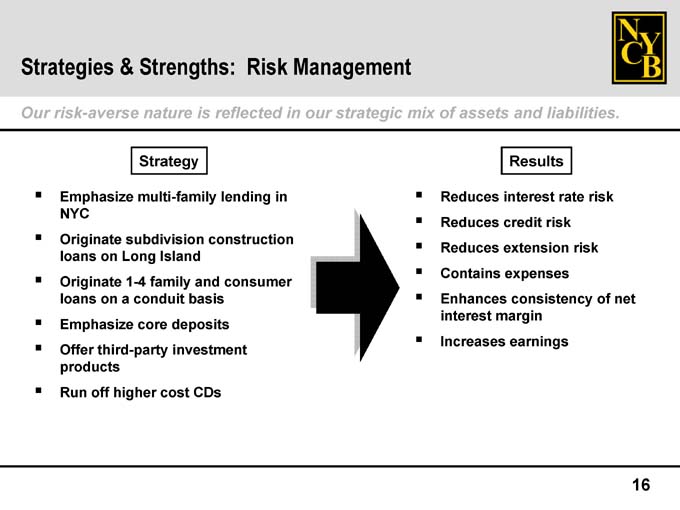
• 16 • net risk of risk liabilities. rate risk and Results interest credit extension expenses consistency margin earnings assets Reduces Reduces Reduces Contains Enhances interest Increases of • mix ? ? ? ? ? • strategic • Management our • in • Risk in consumer reflected lending construction is and basis deposits investment CDs Strengths: nature Strategy Island family cost multi-family subdivision conduit core 1-4 • Long a higher Originate on
on third-party off risk-averse Emphasize NYC loans Originate loans Emphasize Offer products Run • Strategies Our ? ? ? ? ? ?
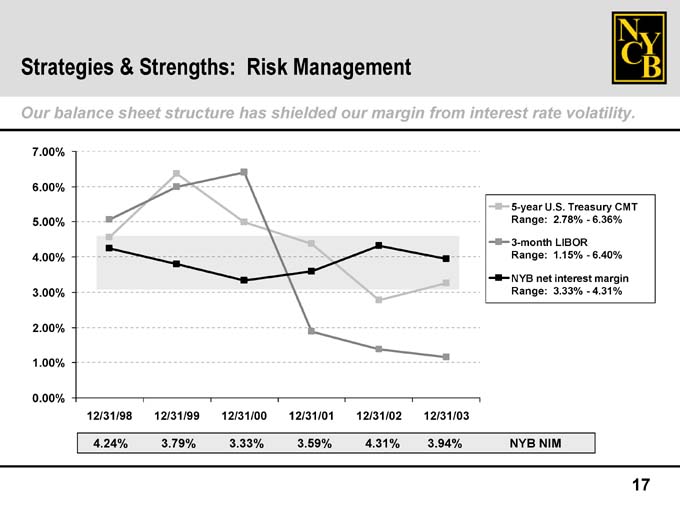
17 2.78%—6.36% 1.15%—6.40% NYB net interest margin 3.33%—4.31% 5-year U.S. Treasury CMT Range: 3-month LIBOR Range: Range: NYB NIM 12/31/03 3.94% 12/31/02 4.31% Risk Management 12/31/01 3.59% 12/31/00 3.33% 12/31/99 3.79% 12/31/98 4.24% Strategies & Strengths: Our balance sheet structure has shielded our margin from interest rate volatility. 7.00% 6.00% 5.00% 4.00% 3.00% 2.00% 1.00% 0.00%
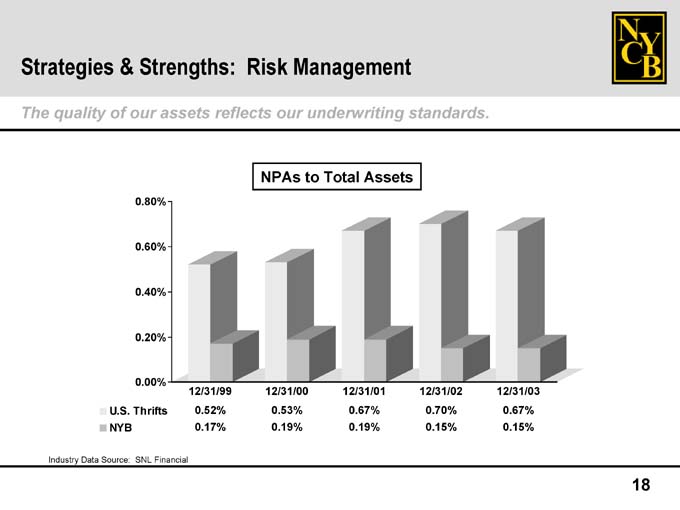
18 12/31/03 0.67% 0.15% 12/31/02 0.70% 0.15% 12/31/01 0.67% 0.19% Risk Management NPAs to Total Assets 12/31/00 0.53% 0.19% 12/31/99 0.52% 0.17% 0.80% 0.60% 0.40% 0.20% 0.00% U.S. Thrifts SNL Financial Strategies & Strengths: The quality of our assets reflects our underwriting standards. NYB Industry Data Source:
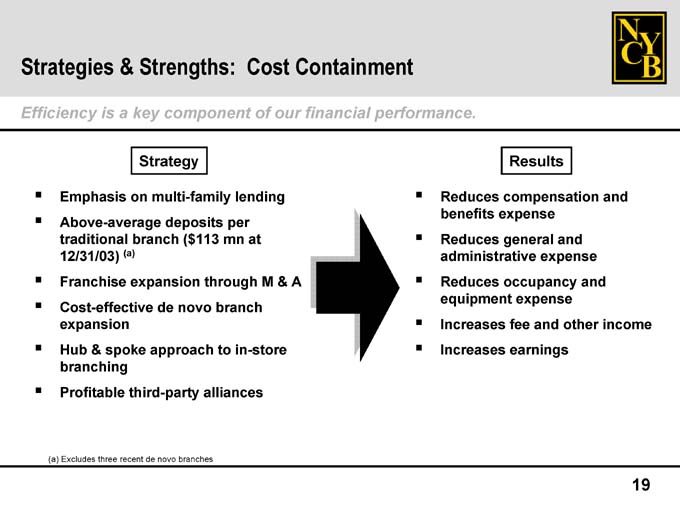
19 Results Reduces compensation and benefits expense Reduces general and administrative expense Reduces occupancy and equipment expense Increases fee and other income Increases earnings ? ? ? ? ? Cost Containment Strategy (a) Franchise expansion through M & A Hub & spoke approach to in-store Emphasis on multi-family lending Above-average deposits per traditional branch ($113 mn at 12/31/03) Cost-effective de novo branch expansion branching Profitable third-party alliances (a) Excludes three recent de novo branches Strategies & Strengths: Efficiency is a key component of our financial performance. ? ? ? ? ? ?
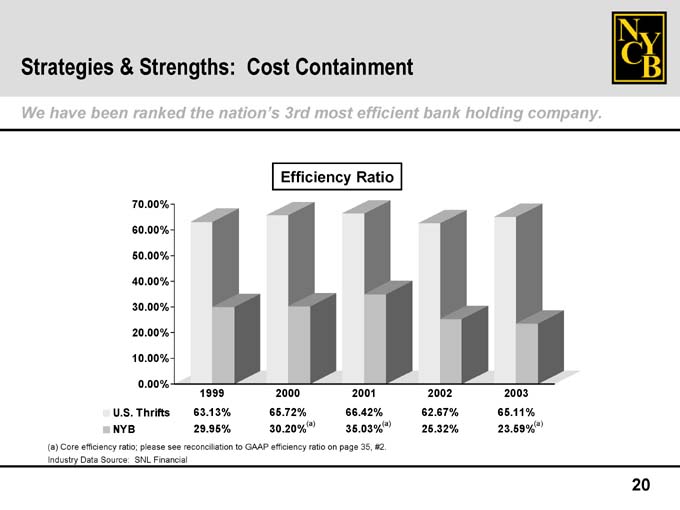
20 company. (a) 2003 65.11% 23.59% 2002 62.67% 25.32% (a) 2001 66.42% 35.03% Efficiency Ratio (a) Cost Containment 2000 65.72% 30.20% 1999 63.13% 29.95% 70.00% 60.00% 50.00% 40.00% 30.00% 20.00% 10.00% 0.00% SNL Financial Strategies & Strengths: We have been ranked the nation’s 3rd most efficient bank holding U.S. Thrifts NYB (a) Core efficiency ratio; please see reconciliation to GAAP efficiency ratio on page 35, #2. Industry Data Source:
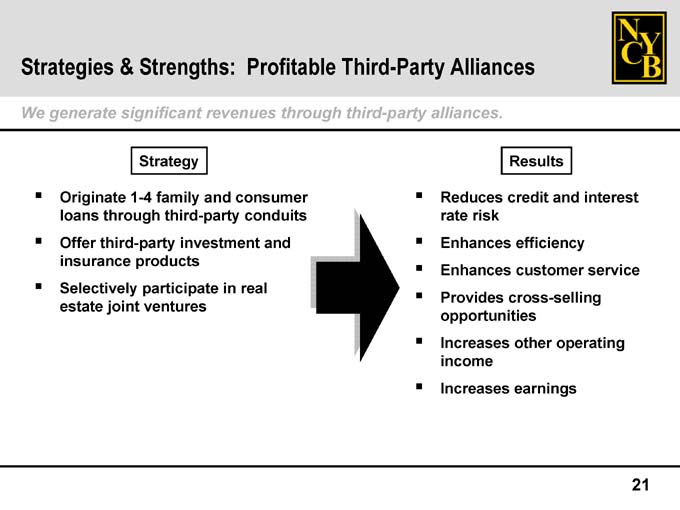
Strategies & Strengths: Profitable Third-Party Alliances We generate significant revenues through third-party alliances.
Strategy
Originate 1-4 family and consumer loans through third-party conduits
Offer third-party investment and insurance products
Selectively participate in real estate joint ventures
Results
Reduces credit and interest rate risk
Enhances efficiency
Enhances customer service
Provides cross-selling opportunities
Increases other operating income
Increases earnings
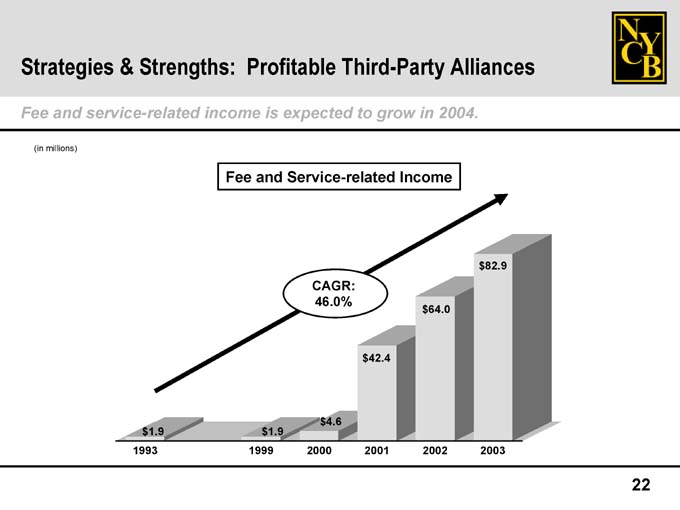
22 $82.9 2003 $64.0 2002 $42.4 2001 CAGR: 46.0% $4.6 2000 Profitable Third-Party Alliances Fee and Service-related Income $1.9 1999 $1.9 1993 Strategies & Strengths: Fee and service-related income is expected to grow in 2004. (in millions)
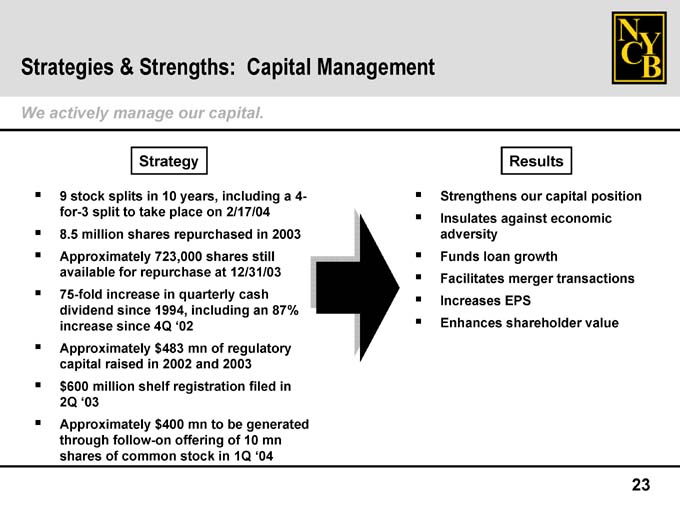
• position 23 economic transactions value capital Results our growth merger shareholder against EPS adversity loan Facilitates Increases Strengthens Insulates Funds Enhances • Management ? ? ? ? ? • 4-a 2003 87% in in mn ‘04 Capital still an filed generated 12/31/03 cash 10 1Q including 2/17/04 regulatory 2003 be of at in capital. on shares
including of and to our years, quarterly mn mn stock place repurchased ‘02 registration offering • 10 723,000 in 1994, 4Q $483 2002 $400 Strengths: Strategy in take shares repurchase in shelf & manage splits to for increase since since follow-on common split million raised million of stock ‘03 actively 9 for-3 8.5 Approximately available 75-fold dividend increase Approximately capital $600 2Q Approximately through shares • Strategies We ? ? ? ? ? ? ?
Strategies & Strengths: Capital Management
The follow-on offering is expected to benefit the Company in several ways.
Generates proceeds of approximately $400 million
40% accretive to tangible book value per share
Accretive to diluted EPS
Funds multi-family loan production
Bolsters capital strength and flexibility
Positions the Company well for future acquisitions
Supports various corporate purposes, including share buybacks
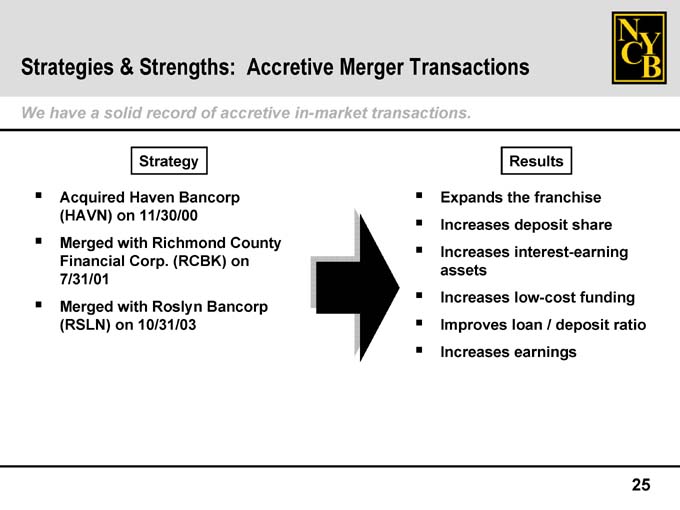
• ratio 25 share funding deposit franchise deposit interest-earning low-cost / earnings Results the loan Expands Increases Increases assets Increases Improves Increases • ? ? ? ? • Bancorp Bancorp Strategy Roslyn 10/31/03 Haven with on Acquired 7/31/01 Merged (RSLN) • ? • Transactions transactions. • Merger Accretive in-market • accretive County on of Richmond (RCBK) Strengths: record 11/30/00 Corp. & solid on with a (HAVN) Merged Financial • Strategies have • We
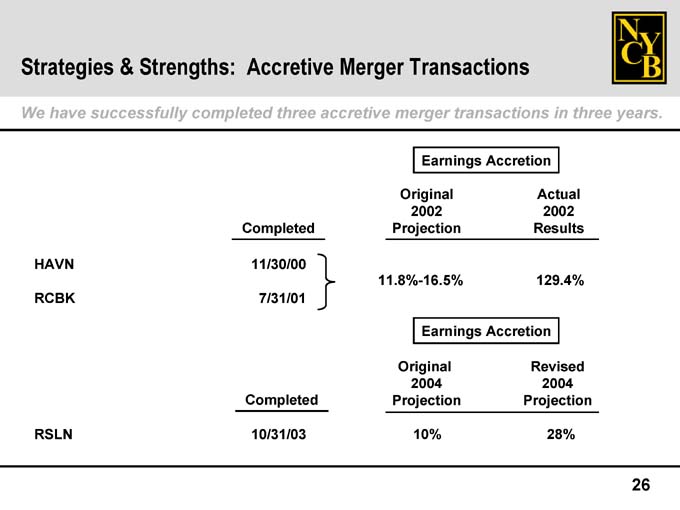
Strategies & Strengths: Accretive Merger Transactions
We have successfully completed three accretive merger transactions in three years.
Earnings Accretion Original Actual 2002 2002 Completed Projection ResultsHAVN 11/30/00 11.8%-16.5% 129.4%RCBK 7/31/01 Earnings Accretion Original Revised 2004 2004 Completed Projection ProjectionRSLN 10/31/03 10% 28%
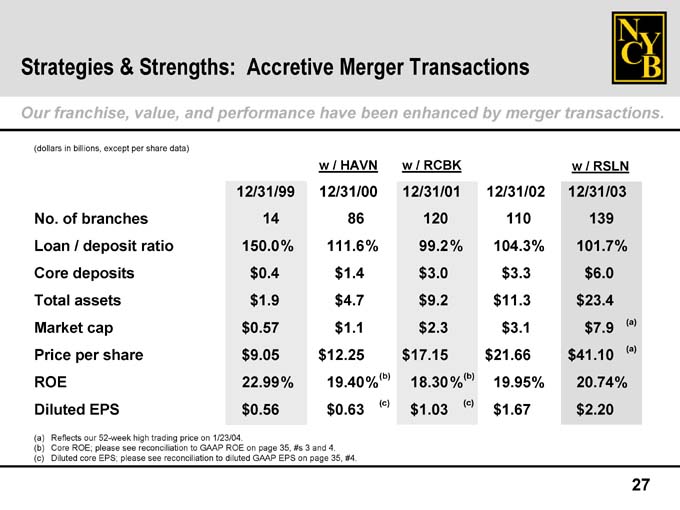
27 (a) (a) RSLN % % 139 / $6.0 $7.9 101.7 $23.4 20.74 $2.20 w 12/31/03 $41.10 % % 12/31/02 110 104.3 $3.3 $11.3 $3.1 $21.66 19.95 $1.67 (b) (c) RCBK % % 120 99.2 $3.0 $9.2 $2.3 / 12/31/01 18.30 $1.03 w $17.15 (b) (c) % % HAVN 86 #4. $1.4 $4.7 $1.1 / 12/31/00 111.6 19.40 $0.63 w $12.25 and 4. % % Accretive Merger Transactions 12/31/99 14 150.0 $0.4 $1.9 $0.57 $9.05 22.99 $0.56 Core ROE; please see reconciliation to GAAP ROE on page 35, #s 3 Market cap Diluted EPS Reflects our 52-week high trading price on 1/23/04. Diluted core EPS; please see reconciliation to diluted GAAP EPS on page 35, Strategies & Strengths: Our franchise, value, and performance have been enhanced by merger transactions. (dollars in billions, except per share data) No. of branches Loan / deposit ratio Core deposits Total assets Price per share ROE (a) (b) (c)
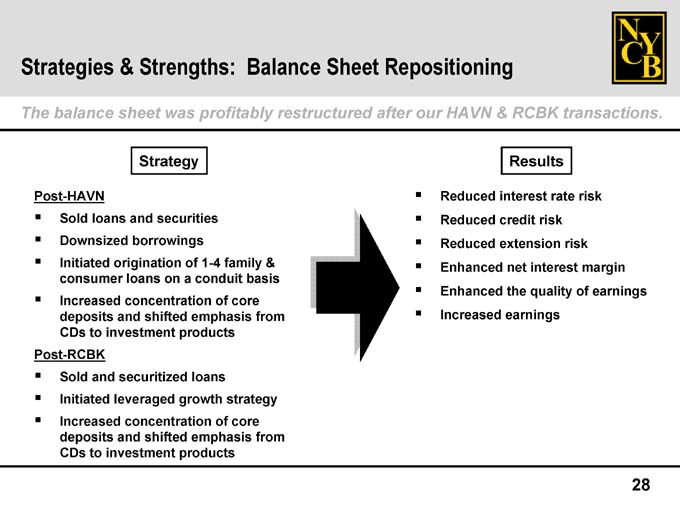
Balance Sheet Repositioning Strategies & Strengths:
The balance sheet was profitably restructured after our HAVN & RCBK transactions.
• |
| margin earnings risk of risk rate risk interest quality interest credit extension net the earnings Reduced Reduced Reduced Enhanced Enhanced Increased |
• |
| ? ? ? ? |
HAVN
-
Post
• |
| & basis from family core of 1-4 conduit emphasis of a products securities borrowings on shifted and loans concentration origination and investment loans consumer to Sold Downsized Initiated Increased deposits CDs |
• |
| ? ? |
RCBK
-
Post
• |
| from strategy core loans growth of emphasis products securitized concentration shifted leveraged and investment and Increased to Sold Initiated deposits CDs |
• |
| ? |
28
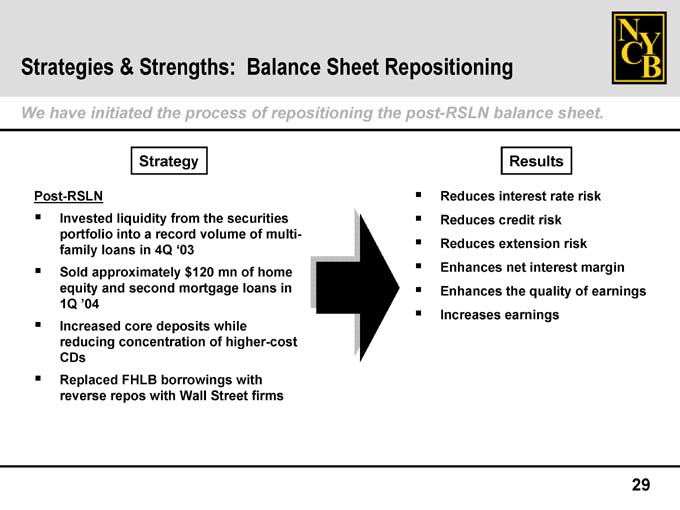
Strategies & Strengths: Balance Sheet Repositioning
We have initiated the process of repositioning the post-RSLN balance sheet.
Strategy
Post-RSLN
Invested liquidity from the securities portfolio into a record volume of multi-family loans in 4Q ‘03
Sold approximately $120 mn of home equity and second mortgage loans in 1Q ’04
Increased core deposits while reducing concentration of higher-cost CDs
Replaced FHLB borrowings with reverse repos with Wall Street firms
Results
Reduces interest rate risk
Reduces credit risk
Reduces extension risk
Enhances net interest margin
Enhances the quality of earnings
Increases earnings
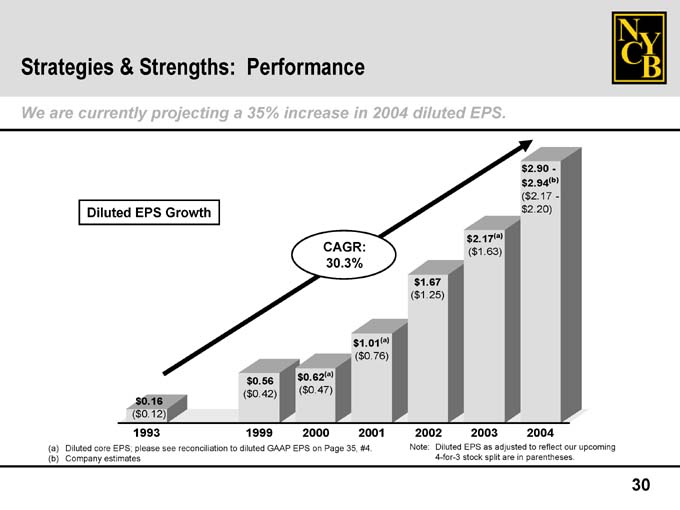
Strategies & Strengths: Performance
We are currently projecting a 35% increase in 2004 diluted EPS.
Diluted core EPS; please see reconciliation to diluted GAAP EPS on Page 35, #4.
Company estimates
Note: Diluted EPS as adjusted to reflect our upcoming 4-for-3 stock split are in parentheses.
• 31 • the multi-family the of and of benefit • 2004. volume deposits ratio in full-year provision core the growth record in loss a efficiency earnings increase reflecting loan our drive reflecting an portfolio of • Performance by income, • to income, funded industry-leading securities suspension our expected operating of Strengths: are interest the of merger & factors net production, other continued Higher loan liquidity Higher Roslyn The Continuation • Strategies Several ? ? ?
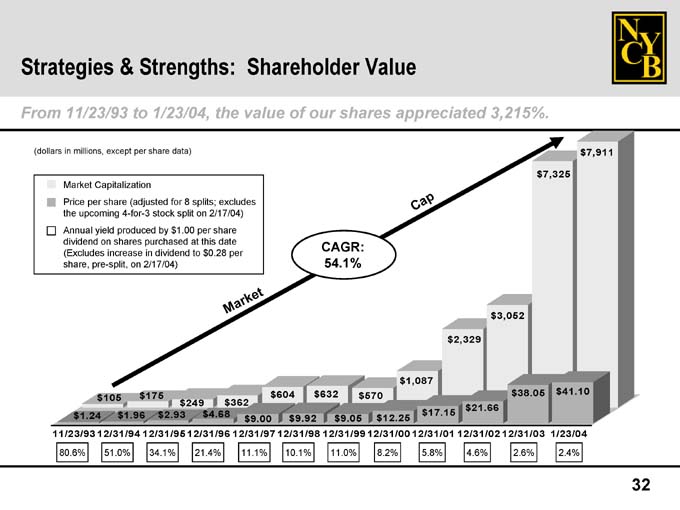
Strategies & Strengths: Shareholder Value
From 11/23/93 to 1/23/04, the value of our shares appreciated 3,215%.
Market Capitalization
Price per share (adjusted for 8 splits; excludes the upcoming 4-for-3 stock split on 2/17/04)
Annual yield produced by $1.00 per share dividend on shares purchased at this date (Excludes increase in dividend to $0.28 per share, pre-split, on 2/17/04)
33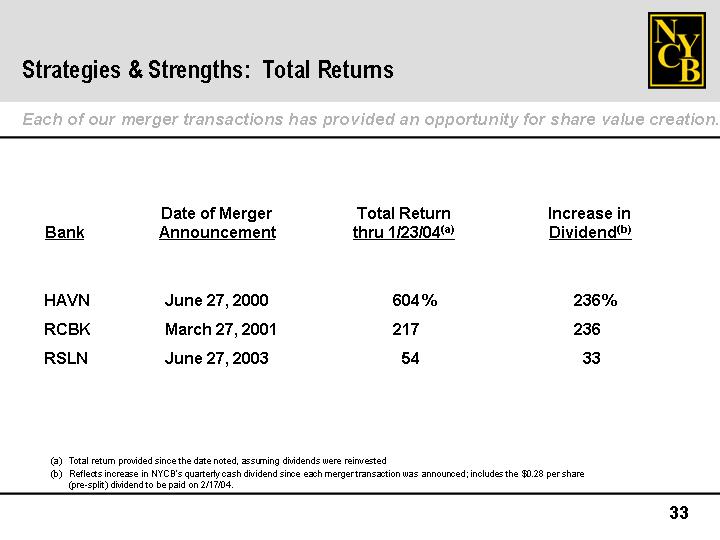
(b)
% Increase in Dividend 236 236 33
(a)
% 1/23/04 604 217 54 Total Return
Total Returns thru
Date of Merger Announcement June 27, 2000 March 27, 2001 June 27, 2003 Total return provided since the date noted, assuming dividends were reinvested Reflects increase in NYCB’s quarterly cash dividend since each merger transaction was announced; includes the $0.28 per share (pre-split] dividend to be paid on 2/17/04.
Strategies & Strengths: Each of our merger transactions has provided an opportunity for share value creation. Bank HAVN RCBK RSLN (a) (b)
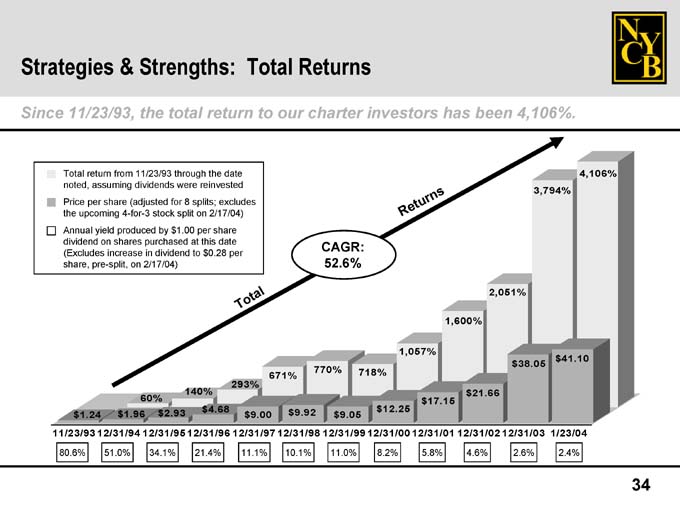
34 4,106% 3,794% $41.10 2.4% 2,051% $38.05 2.6% 1,600% $21.66 4.6% 1,057% $17.15 5.8% 718% $12.25 8.2% CAGR: 52.6% $9.05 11.0% 770% $9.92 10.1% Total Returns 671% 293% $9.00 11.1% $4.68 21.4% 140% $2.93 34.1% 60% $1.96 51.0% Total return from 11/23/93 through the date noted, assuming dividends were reinvested Price per share (adjusted for 8 splits; excludes the upcoming 4-for-3 stock split on 2/17/04) Annual yield produced by $1.00 per share dividend on shares purchased at this date (Excludes increase in dividend to $0.28 per share, pre-split, on 2/17/04) $1.24 Strategies & Strengths: Since 11/23/93, the total return to our charter investors has been 4,106%. 11/23/9312/31/9412/31/9512/31/9612/31/9712/31/9812/31/9912/31/0012/31/0112/31/0212/31/03 1/23/04 80.6%
Strategies & Strengths: Total Returns
Each of our merger transactions has provided an opportunity for share valuecreation.
Date of Merger Total Return Increase inBank Announcement thru 1/23/04(a) Dividend(b)HAVN June 27, 2000 604% 236%RCBK March 27, 2001 217 236RSLN June 27, 2003 54 33
(a) Total return provided since the date noted, assuming dividends werereinvested(b) Reflects increase in NYCB’s quarterly cash dividend since each mergertransaction was announced; includes the $0.28 per share (pre-split) dividend tobe paid on 2/17/04. on the pre-split number of shares.
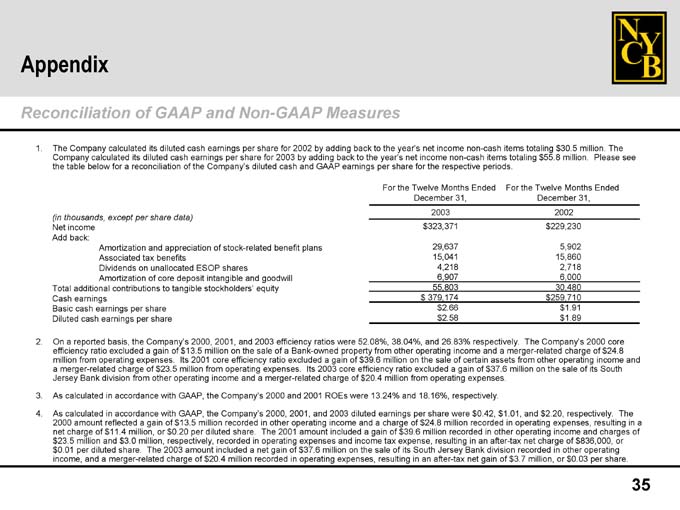
AppendixReconciliation of GAAP and Non-GAAP Measures
1. The Company calculated its diluted cash earnings per share for 2002 by addingback to the year’s net income non-cash items totaling $30.5 million. The Companycalculated its diluted cash earnings per share for 2003 by adding back to theyear’s net income non-cash items totaling $55.8 million. Please see the tablebelow for a reconciliation of the Company’s diluted cash and GAAP earnings pershare for the respective periods.
For the Twelve Months Ended For the Twelve Months Ended December 31, December 31, 2003 2002 (in thousands, except per share data) Net income $ 323,371 $ 229,230 Add back: Amortization and appreciation of stock-related benefit plans 29,637 5,902 Associated tax benefits 15,041 15,860 Dividends on unallocated ESOP shares 4,218 2,718 Amortization of core deposit intangible and goodwill 6,907 6,000 Total additional contributions to tangible stockholders’ equity 55,803 30,480 Cash earnings $ 379,174 $ 259,710 Basic cash earnings per share $ 2.66 $ 1.91Diluted cash earnings per share $ 2.58 $ 1.89
2. On a reported basis, the Company’s 2000, 2001, and 2003 efficiency ratioswere 52.08%, 38.04%, and 26.83% respectively. The Company’s 2000 core efficiencyratio excluded a gain of $13.5 million on the sale of a Bank-owned property fromother operating income and a merger-related charge of $24.8 million fromoperating expenses. Its 2001 core efficiency ratio excluded a gain of $39.6million on the sale of certain assets from other operating income and amerger-related charge of $23.5 million from operating expenses. Its 2003 coreefficiency ratio excluded a gain of $37.6 million on the sale of its SouthJersey Bank division from other operating income and a merger-related charge of$20.4 million from operating expenses.3. As calculated in accordance with GAAP, the Company’s 2000 and 2001 ROEs were13.24% and 18.16%, respectively.4. As calculated in accordance with GAAP, the Company’s 2000, 2001, and 2003diluted earnings per share were $0.42, $1.01, and $2.20, respectively. The 2000amount reflected a gain of $13.5 million recorded in other operating income anda charge of $24.8 million recorded in operating expenses, resulting in a netcharge of $11.4 million, or $0.20 per diluted share. The 2001 amount included again of $39.6 million recorded in other operating income and charges of $23.5million and $3.0 million, respectively, recorded in operating expenses andincome tax expense, resulting in an after-tax net charge of $836,000, or $0.01per diluted share. The 2003 amount included a net gain of $37.6 million on thesale of its South Jersey Bank division recorded in other operating income, and amerger-related charge of $20.4 million recorded in operating expenses, resultingin an after-tax net gain of $3.7 million, or $0.03 per share.
• 1/28/04 36 • Inc. Bancorp, “NYB”. 683-4420 (516) Avenue 11590 symbol www.myNYCB.com Community NY the iangarola@myNYCB.com at: under site: York Merrick web to: Relations New 615 Westbury, • NYSE our • the requests on onto Investor to: Log E-mail Call Write • Information: trades • • • • More Company • For The