Exhibit 99.1
Fourth Quarter 2004 Investor Presentation
Forward-looking Statements and Risk Factors
This filing, like other written and oral communications presented by the Company and its authorized officers, may contain certain forward-looking statements regarding the
Company’s prospective performance and strategies within the meaning of Section 27A of the Securities Act of 1933, as amended, and Section 21E of the Securities Exchange Act of 1934, as amended. The Company intends such forward-looking statements to be covered by the safe harbor provisions for forward-looking statements contained in the Private Securities Litigation Reform Act of 1995, and is including this statement for purposes of said safe harbor provisions.
Forward-looking statements, which are based on certain assumptions and describe future plans, strategies, and expectations of the Company, are generally identified by use of the words “anticipate,” “believe,” “estimate,” “expect,” “intend,” “plan,” “project,” “seek,” “strive,” “try,” or future or conditional verbs such as “will,” “would,” “should,” “could,” “may,” or similar expressions. The Company’s ability to predict results or the actual effects of its plans or strategies, including, among other things, the balance sheet de-leveraging and liabilities extension strategies announced in July 2004, is inherently uncertain. Accordingly, actual results may differ materially from anticipated results.
There are a number of factors, many of which are beyond our control, that could cause actual conditions, events, or results to differ significantly from those described in the forward-looking statements. These factors include, but are not limited to:
general economic conditions, either nationally or locally in some or all of the areas in which the Company conducts business, or conditions in the securities markets or the banking industry; changes in interest rates, deposit flows, loan demand, real estate values, and demand for financial services and loan, deposit, and investment products in the Company’s local markets; changes in the quality or composition of the loan or investment portfolios; changes in competitive pressures among financial institutions or from non-financial institutions; the Company’s ability to successfully integrate any assets, liabilities, customers, systems, and management personnel the Company acquires into its operations and its ability to realize related revenue synergies and cost savings within expected time frames; the Company’s timely development of new and competitive products or services in a changing environment, and the acceptance of such products or services by customers; the outcome of pending or threatened litigation or of other matters before regulatory agencies, whether currently existing or commencing in the future; changes in accounting principles, policies, practices, or guidelines; changes in legislation and regulation; operational issues and/or capital spending necessitated by the potential need to adopt to industry changes in information technology systems, on which we are highly dependent; changes in the monetary and fiscal policies of the U.S. Government, including policies of the U.S. Treasury and the Federal Reserve Board; war or terrorist activities; and other economic, competitive, governmental, regulatory, and geopolitical factors affecting the Company’s operations, pricing, and services.
Additionally, the timing and occurrence or non-occurrence of events may be subject to circumstances beyond the Company’s control.
Readers are cautioned not to place undue reliance on these forward-looking statements, which speak only as of the date of this filing. Except as required by applicable law or regulation, the Company undertakes no obligation to update these forward-looking statements to reflect events or circumstances that occur after the date on which such statements were made.
2
A Leading Financial Institution in the Metro New York Region
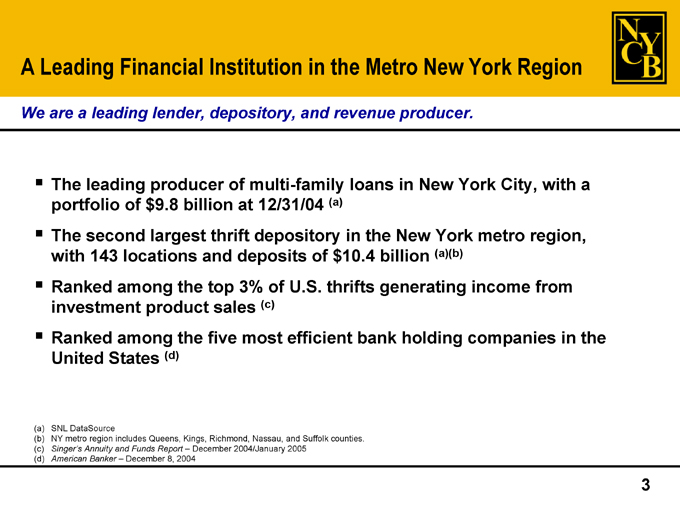
We are a leading lender, depository, and revenue producer.
The leading producer of multi-family loans in New York City, with a portfolio of $9.8 billion at 12/31/04 (a) The second largest thrift depository in the New York metro region, with 143 locations and deposits of $10.4 billion (a)(b) Ranked among the top 3% of U.S. thrifts generating income from investment product sales (c) Ranked among the five most efficient bank holding companies in the United States (d)
(a) SNL DataSource
(b) NY metro region includes Queens, Kings, Richmond, Nassau, and Suffolk counties. (c) Singer’s Annuity and Funds Report – December 2004/January 2005 (d) American Banker – December 8, 2004
3
A Proven Business Model
We have a proven business model built on several fundamental strengths.
A solid balance sheet A profitable lending niche Exceptional asset quality A balanced approach to funding A highly efficient operation An attractive dividend yield The capacity for earnings growth A focus on the future
4
A Solid Balance Sheet
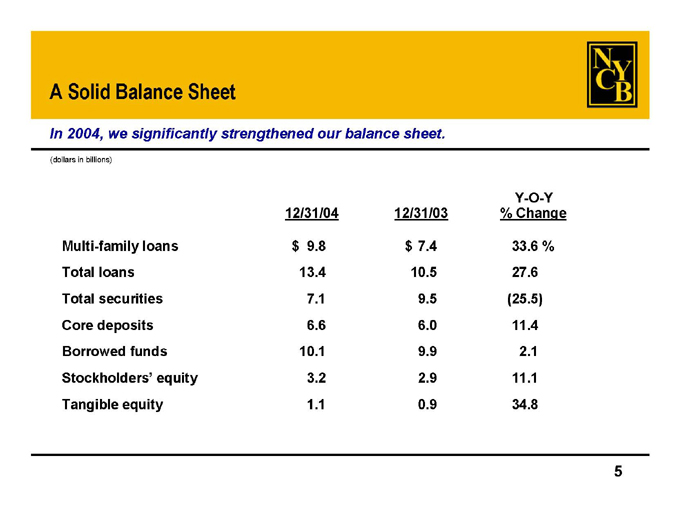
In 2004, we significantly strengthened our balance sheet.
(dollars in billions)
Y-O-Y
12/31/04 12/31/03 % Change
Multi-family loans $9.8 $7.4 33.6%
Total loans 13.4 10.5 27.6
Total securities 7.1 9.5 (25.5)
Core deposits 6.6 6.0 11.4
Borrowed funds 10.1 9.9 2.1
Stockholders’ equity 3.2 2.9 11.1
Tangible equity 1.1 0.9 34.8
5
A Solid Balance Sheet
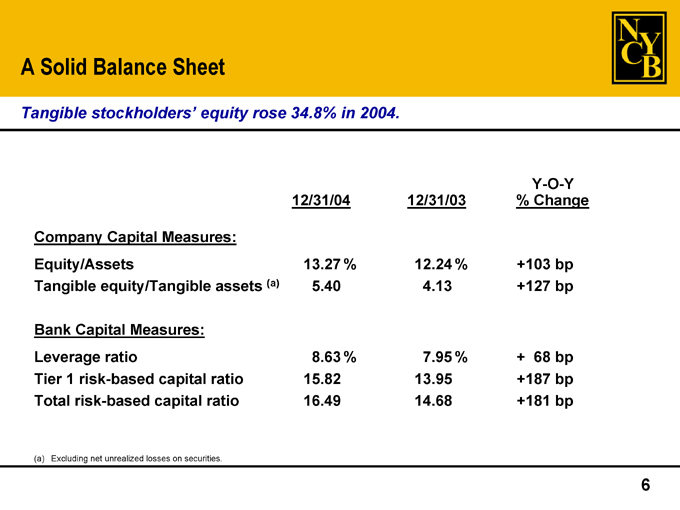
Tangible stockholders’ equity rose 34.8% in 2004.
Y-O-Y
12/31/04 12/31/03 % Change
Company Capital Measures:
Equity/Assets 13.27% 12.24% +103 bp
Tangible equity/Tangible assets (a) 5.40 4.13 +127 bp
Bank Capital Measures:
Leverage ratio 8.63% 7.95% + 68 bp
Tier 1 risk-based capital ratio 15.82 13.95 +187 bp
Total risk-based capital ratio 16.49 14.68 +181 bp
(a) Excluding net unrealized losses on securities.
6
A Solid Balance Sheet
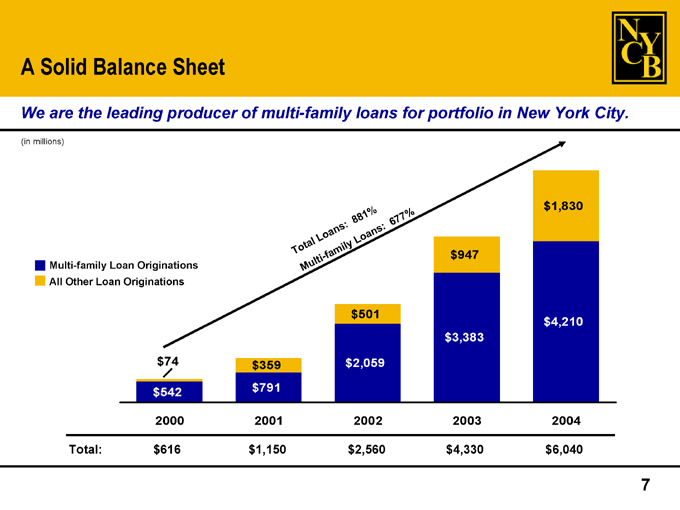
We are the leading producer of multi-family loans for portfolio in New York City.
(in millions)
Multi-family Loan Originations All Other Loan Originations
Total Loans: 881%
Multi-family Loans: 677%
$74
$542
$359 $791
$501
$2,059
$947
$3,383
$1,830
$4,210
2000 2001 2002 2003 2004
Total: $616 $1,150 $2,560 $4,330 $6,040
7
A Solid Balance Sheet
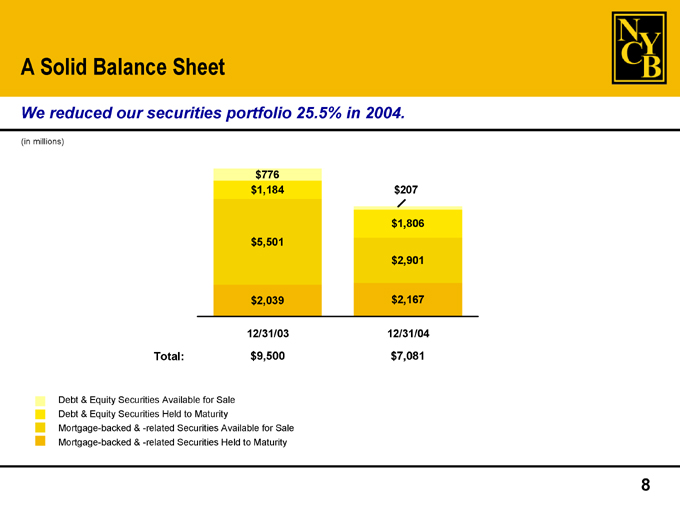
We reduced our securities portfolio 25.5% in 2004.
(in millions)
$776 $1,184
$5,501
$2,039
12/31/03
$207 $1,806 $2,901 $2,167 12/31/04
Total: $9,500 $7,081
Debt & Equity Securities Available for Sale Debt & Equity Securities Held to Maturity
Mortgage-backed & -related Securities Available for Sale Mortgage-backed & -related Securities Held to Maturity
8
A Profitable Lending Niche: Multi-Family Lending
Our primary lending niche is highly profitable, efficient, and resilient.
Niche: Rent-controlled and -stabilized buildings in NYC 5-year fixed / 5-year adjustable rates Pre-payment penalties: 5-4-3-2-1 points in years 1 through 5 Loan structure enhances term yields Longstanding relationships with leading mortgage brokers Represents a significant source of deposits No losses in more than 20 years
9
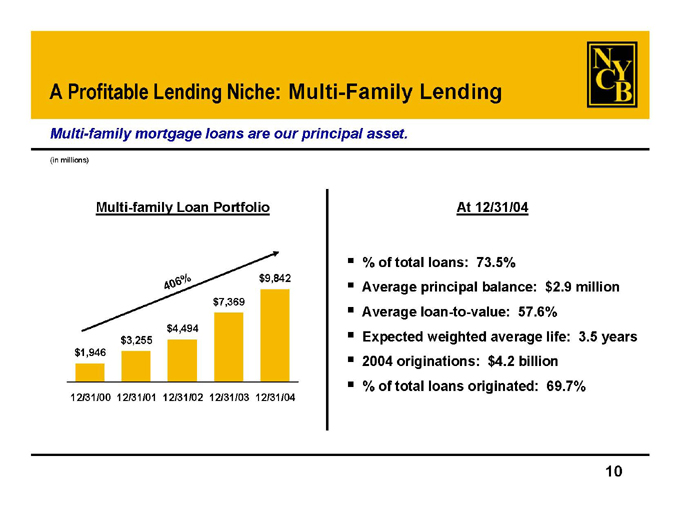
A Profitable Lending Niche: Multi-Family Lending
Multi-family mortgage loans are our principal asset.
(in millions)
Multi-family Loan Portfolio
406%
$1,946
$3,255
$4,494
$7,369
$9,842
12/31/00 12/31/01 12/31/02 12/31/03 12/31/04
At 12/31/04
% of total loans: 73.5%
Average principal balance: $2.9 million Average loan-to-value: 57.6% Expected weighted average life: 3.5 years 2004 originations: $4.2 billion% of total loans originated: 69.7%
10
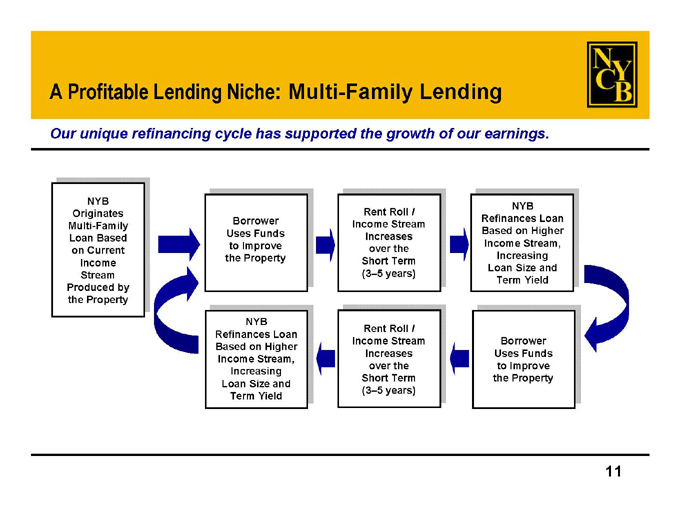
A Profitable Lending Niche: Multi-Family Lending
Our unique refinancing cycle has supported the growth of our earnings.
NYB Originates Multi-Family Loan Based on Current Income Stream Produced by the Property
Borrower Uses Funds to Improve the Property
Rent Roll / Income Stream Increases over the Short Term (3–5 years)
NYB Refinances Loan Based on Higher Income Stream, Increasing Loan Size and Term Yield
NYB Refinances Loan Based on Higher Income Stream, Increasing Loan Size and Term Yield
Rent Roll / Income Stream Increases over the Short Term (3–5 years)
Borrower Uses Funds to Improve the Property
11
A Profitable Lending Niche: Commercial Real Estate Lending
Our CRE loans are made in accordance with the same terms as our multi-family loans.
Niche:
Office and mixed-use buildings in NYC
National credit retail shopping centers on Long Island
5-year fixed / 5-year adjustable rates
Pre-payment penalties: 5-4-3-2-1 points in years 1 through 5 Conservative credit review No losses in more than a decade
12
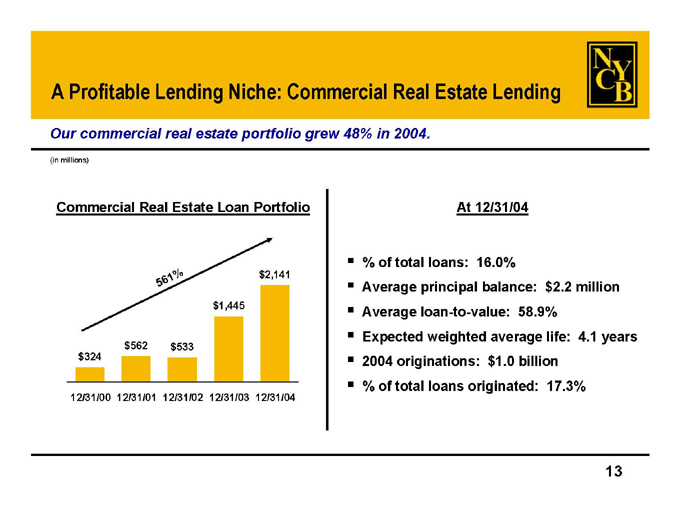
A Profitable Lending Niche: Commercial Real Estate Lending
Our commercial real estate portfolio grew 48% in 2004.
(in millions)
Commercial Real Estate Loan Portfolio
561%
$324
$562
$533
$1,445
$2,141
12/31/00 12/31/01 12/31/02 12/31/03 12/31/04
At 12/31/04
% of total loans: 16.0%
Average principal balance: $2.2 million Average loan-to-value: 58.9% Expected weighted average life: 4.1 years 2004 originations: $1.0 billion% of total loans originated: 17.3%
13
A Profitable Lending Niche: Construction Lending
We lend to 9 of the top 10 developers on Long Island.
Niche: Residential unit subdivisions on Long Island Floating rate tied to various economic indices
Bulk of proceeds distributed upon completion of units with a signed contract of sale No losses in more than a decade
14
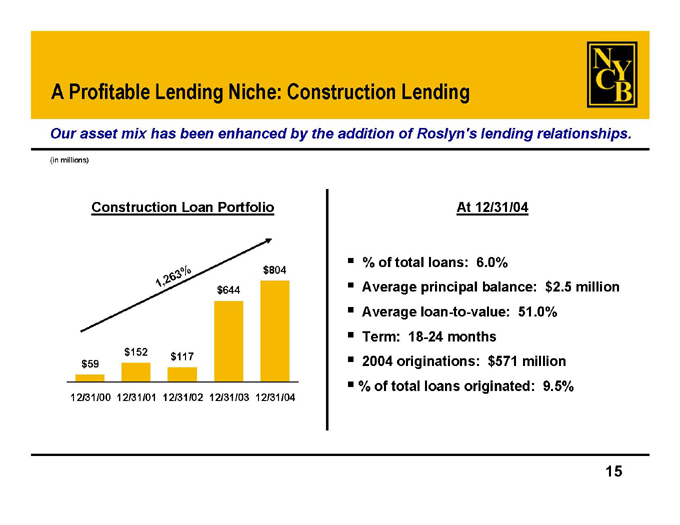
A Profitable Lending Niche: Construction Lending
Our asset mix has been enhanced by the addition of Roslyn’s lending relationships.
(in millions)
Construction Loan Portfolio
1,263%
$59
$152
$117
$644
$804
12/31/00 12/31/01 12/31/02 12/31/03 12/31/04
At 12/31/04
% of total loans: 6.0%
Average principal balance: $2.5 million Average loan-to-value: 51.0% Term: 18-24 months 2004 originations: $571 million% of total loans originated: 9.5%
15
Exceptional Asset Quality
Our loan portfolio is structured to reduce credit risk.
NPAs = 0.12% of total assets at 12/31/04 NPLs = 0.21% of total loans at 12/31/04 Allowance for loan losses = 277.31% of NPLs
No losses on local-market multi-family loans in 20+ years
No losses on residential unit subdivision construction loans in 10+ years 40 consecutive quarters without any net charge-offs from 4Q 1994 through 3Q 2004
16
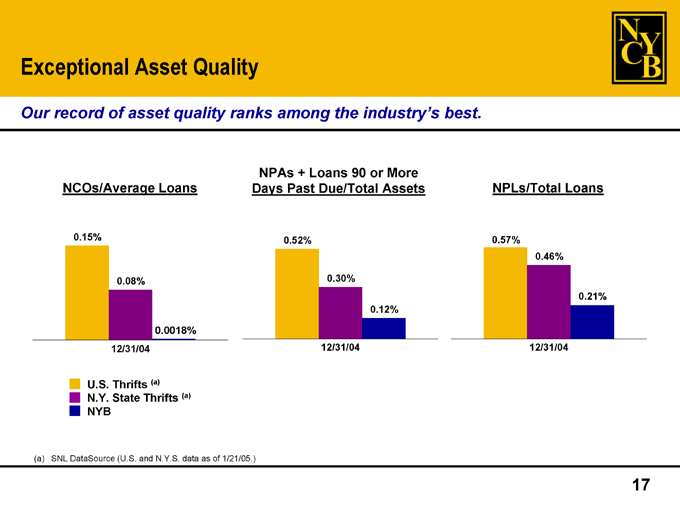
Exceptional Asset Quality
Our record of asset quality ranks among the industry’s best.
NCOs/Average Loans
0.15%
0.08%
0.0018%
12/31/04
NPAs + Loans 90 or More Days Past Due/Total Assets
0.52%
0.30%
0.12%
12/31/04
NPLs/Total Loans
0.57%
0.46%
0.21%
12/31/04
U.S. Thrifts (a) N.Y. State Thrifts (a) NYB
(a) SNL DataSource (U.S. and N.Y.S. data as of 1/21/05.)
17
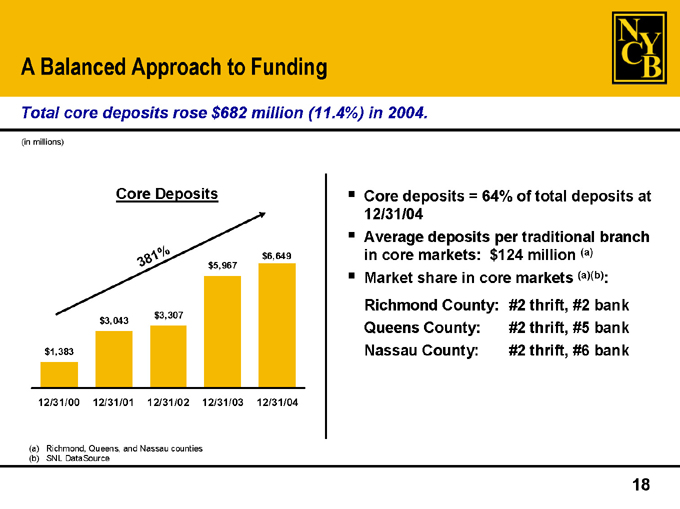
A Balanced Approach to Funding
Total core deposits rose $682 million (11.4%) in 2004.
(in millions)
Core Deposits
381%
$1,383
$3,043
$3,307
$5,967
$6,649
12/31/00 12/31/01 12/31/02 12/31/03 12/31/04
(a) Richmond, Queens, and Nassau counties. (b) SNL DataSource
Core deposits = 64% of total deposits at 12/31/04 Average deposits per traditional branch in core markets: $124 million (a) Market share in core markets (a)(b): Richmond County: #2 thrift, #2 bank Queens County: #2 thrift, #5 bank Nassau County: #2 thrift, #6 bank
18
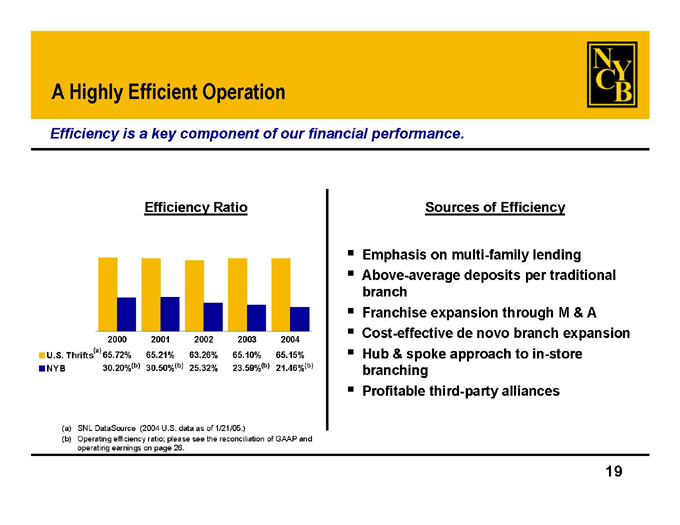
A Highely Efficient Operation
Efficiency is a key component of our financial performance.
Efficiency Ratio
2000 2001 2002 2003 2004
(a)
U.S. Thrifts 65.72% 65.21% 63.26% 65.10% 65.15%
NYB 30.20%(b) 30.50%(b) 25.32% 23.59%(b) 21.46%(b)
(a) SNL DataSource (2004 U.S. data as of 1/21/05.)
(b) Operating efficiency ratio; please see the reconciliation of GAAP and operating earnings on page 26.
Sources of Efficiency
Emphasis on multi-family lending Above-average deposits per traditional branch Franchise expansion through M & A Cost-effective de novo branch expansion Hub & spoke approach to in-store branching Profitable third-party alliances
19

An Attractive Dividend Yield
Our dividend yield currently exceeds 5%.
Increase in Annual Dividend Since 2000 (a)
284%
$0.25
$0.30
$0.43
$0.66
$0.96
2000 2001 2002 2003 2004
(a) The annual dividends shown have been adjusted to reflect 3-for-2 stock splits on 3/29/01 and 9/20/01 and 4-for-3 stock splits on 5/21/03 and 2/17/04.
20
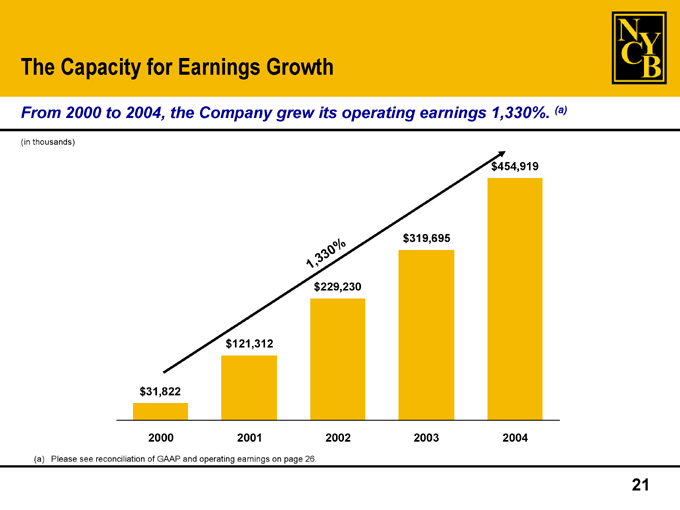
The Capacity for Earnings Growth
From 2000 to 2004, the Company grew its operating earnings 1,330%. (a)
(in thousands)
1,330%
$31,822
$121,312
$229,230
$319,695
$454,919
2000 2001 2002 2003 2004
(a) Please see reconciliation of GAAP and operating earnings on page 26.
21
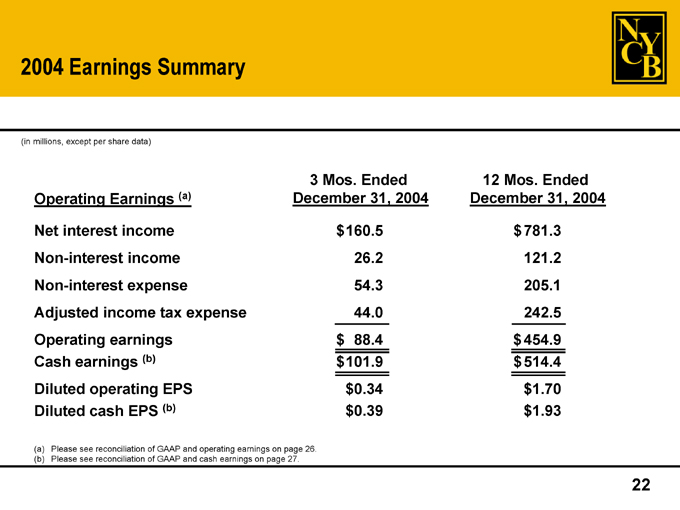
2004 Earnings Summary
(in millions, except per share data)
3 Mos. Ended 12 Mos. Ended
Operating Earnings (a) December 31, 2004 December 31, 2004
Net interest income $160.5 $781.3
Non-interest income 26.2 121.2
Non-interest expense 54.3 205.1
Adjusted income tax expense 44.0 242.5
Operating earnings $88.4 $454.9
Cash earnings (b) $101.9 $514.4
Diluted operating EPS $0.34 $1.70
Diluted cash EPS (b) $0.39 $1.93
(a) Please see reconciliation of GAAP and operating earnings on page 26. (b) Please see reconciliation of GAAP and cash earnings on page 27.
22
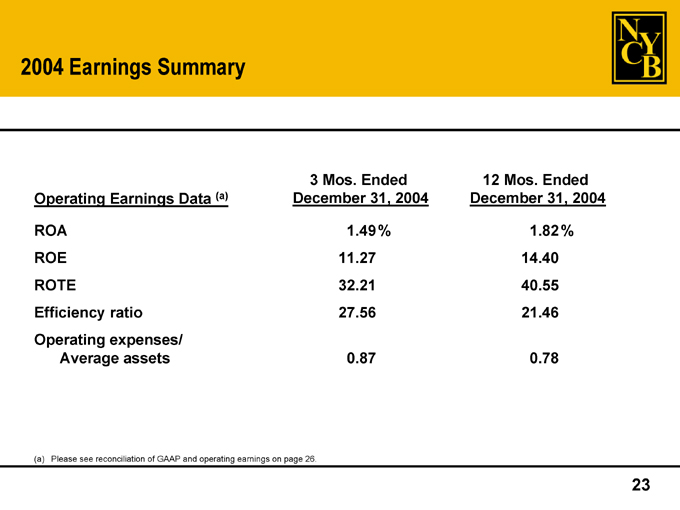
2004 Earnings Summary
3 Mos. Ended 12 Mos. Ended
Operating Earnings Data (a) December 31, 2004 December 31, 2004
ROA 1.49% 1.82%
ROE 11.27 14.40
ROTE 32.21 40.55
Efficiency ratio 27.56 21.46
Operating expenses/
Average assets 0.87 0.78
(a) Please see reconciliation of GAAP and operating earnings on page 26.
23
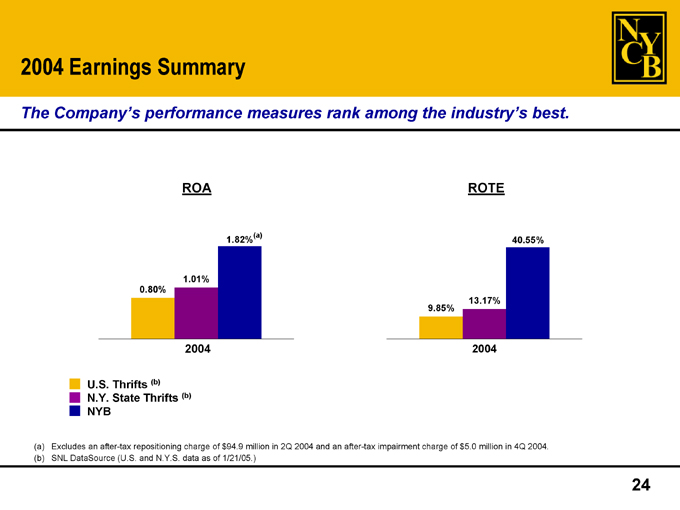
2004 Earnings Summary
The Company’s performance measures rank among the industry’s best.
ROA
0.80%
1.01%
1.82%(a)
2004
U.S. Thrifts (b) N.Y. State Thrifts (b) NYB
ROTE
9.85%
13.17%
40.55%
2004
(a) Excludes an after-tax repositioning charge of $94.9 million in 2Q 2004 and an after-tax impairment charge of $5.0 million in 4Q 2004. (b) SNL DataSource (U.S. and N.Y.S. data as of 1/21/05.)
24
A Focus on the Future
We are focused on achieving the following goals in 2005.
Continue to grow the multi-family loan portfolio Continue to reduce the securities portfolio Continue to increase deposits Maintain tangible capital ratios Maintain asset quality Increase non-interest income Maintain our efficiency Maintain our dividend
25
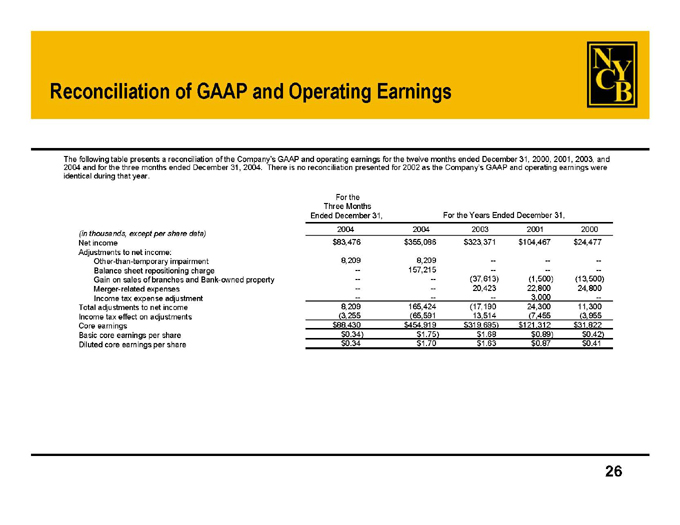
Reconciliation of GAAP and Operating Earnings
The following table presents a reconciliation of the Company’s GAAP and operating earnings for the twelve months ended December 31, 2000, 2001, 2003, and 2004 and for the three months ended December 31, 2004. There is no reconciliation presented for 2002 as the Company’s GAAP and operating earnings were identical during that year.
For the
Three Months
Ended December 31, For the Years Ended December 31,
2004 2004 2003 2001 2000
(in thousands, except per share data)
Net income $83,476 $355,086 $323,371 $104,467 $24,477
Adjustments to net income:
Other-than-temporary impairment 8,209 8,209 — — —
Balance sheet repositioning charge — 157,215 — — —
Gain on sales of branches and Bank-owned property — — (37,613) (1,500) (13,500)
Merger-related expenses — — 20,423 22,800 24,800
Income tax expense adjustment — — — 3,000 —
Total adjustments to net income 8,209 165,424 (17,190) 24,300 11,300
Income tax effect on adjustments (3,255) (65,591) 13,514 (7,455) (3,955)
Core earnings $88,430 $454,919 $319,695 $121,312 $31,822
Basic core earnings per share $0.34 $1.75 $1.68 $0.89 $0.42
Diluted core earnings per share $0.34 $1.70 $1.63 $0.87 $0.41
26

Reconciliation of GAAP and Cash Earnings
The following table presents a reconciliation of the Company’s GAAP and cash earnings for the three and twelve months ended December 31, 2004.
For the For the
Three Months Ended Twelve Months Ended
December 31, 2004 December 31, 2004
(in thousands, except per share data)
Net income $83,476 $355,086
Additional contributions to tangible stockholders’ equity:
Amortization and appreciation of shares held in stock-
related benefit plan 2,149 9,612
Associated tax benefits 3,895 30,266
Dividends on unallocated ESOP shares 1,267 4,866
Amortization of core deposit intangibles 2,860 11,440
Other-than-temporary impairment 8,209 8,209
Total additional contributions to tangible stockholders’ equity 18,380 64,393
Cash earnings $101,856 $419,479
Adjustments to cash earnings:
Net loss on sale of securities relating to balance sheet
repositioning in 2Q 2004 — 157,215
Income tax effect on adjustments — (62,336 )
Cash earnings excluding repositioning charge $101,856 $514,358
Basic cash earnings per share $0.39 $1.98
Diluted cash earnings per share $0.39 $1.93
27
For More Information:
The Company trades on the NYSE under the symbol “NYB”.
Log onto our web site: www.myNYCB.com E-mail requests to: ir@myNYCB.com Call Investor Relations at: (516) 683-4420 Write to: New York Community Bancorp, Inc.
615 Merrick Avenue Westbury, NY 11590
1/26/05
28