Exhibit 99.1
First Quarter 2005 Investor Presentation
Forward-looking Statements and Associated Risk Factors
This filing, like other written and oral communications presented by the Company and its authorized officers, may contain certain forward-looking statements regarding the
Company’s prospective performance and strategies within the meaning of Section 27A of the Securities Act of 1933, as amended, and Section 21E of the Securities Exchange Act of 1934, as amended. The Company intends such forward-looking statements to be covered by the safe harbor provisions for forward-looking statements contained in the Private Securities Litigation Reform Act of 1995, and is including this statement for purposes of said safe harbor provisions.
Forward-looking statements, which are based on certain assumptions and describe future plans, strategies, and expectations of the Company, are generally identified by use of the words “anticipate,” “believe,” “estimate,” “expect,” “intend,” “plan,” “project,” “seek,” “strive,” “try,” or future or conditional verbs such as “will,” “would,” “should,” “could,” “may,” or similar expressions. The Company’s ability to predict results or the actual effects of its plans or strategies is inherently uncertain. Accordingly, actual results may differ materially from anticipated results.
There are a number of factors, many of which are beyond our control, that could cause actual conditions, events, or results to differ significantly from those described in the forward-looking statements. These factors include, but are not limited to:
general economic conditions, either nationally or locally in some or all of the areas in which we conduct our business; conditions in the securities markets or the banking industry; changes in interest rates, which may affect our net income or future cash flows; changes in deposit flows, and in the demand for deposit, loan, and investment products and other financial services in our local markets; changes in real estate values, which could impact the quality of the assets securing our loans; changes in the quality or composition of the loan or investment portfolios; changes in competitive pressures among financial institutions or from non-financial institutions; the Company’s ability to successfully integrate any assets, liabilities, customers, systems, and management personnel the Company may acquire into its operations and its ability to realize related revenue synergies and cost savings within expected time frames; the Company’s timely development of new and competitive products or services in a changing environment, and the acceptance of such products or services by customers; the outcome of pending or threatened litigation or of other matters before regulatory agencies, whether currently existing or commencing in the future; changes in accounting principles, policies, practices, or guidelines; changes in legislation and regulation; operational issues and/or capital spending necessitated by the potential need to adapt to industry changes in information technology systems, on which we are highly dependent; changes in the monetary and fiscal policies of the U.S. Government, including policies of the U.S. Treasury and the Federal Reserve Board; war or terrorist activities; and other economic, competitive, governmental, regulatory, and geopolitical factors affecting the Company’s operations, pricing, and services.
Additionally, the timing and occurrence or non-occurrence of events may be subject to circumstances beyond the Company’s control.
Readers are cautioned not to place undue reliance on these forward-looking statements, which speak only as of the date of this filing. Except as required by applicable law or regulation, the Company undertakes no obligation to update these forward-looking statements to reflect events or circumstances that occur after the date on which such statements were made.
2
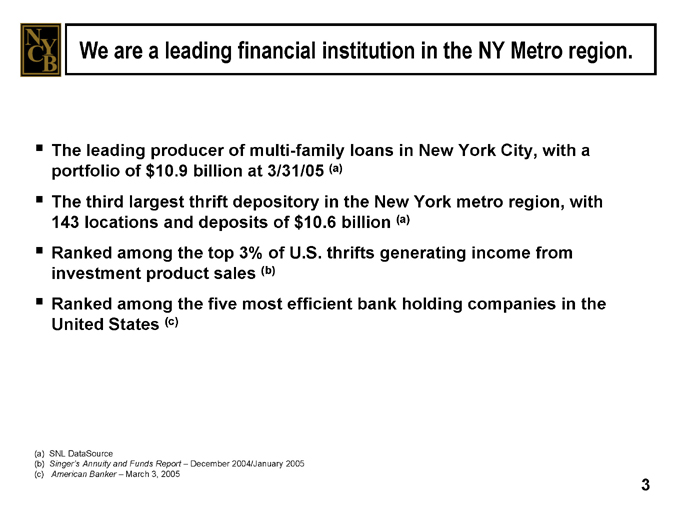
We are a leading financial institution in the NY Metro region.
The leading producer of multi-family loans in New York City, with a portfolio of $10.9 billion at 3/31/05 (a) The third largest thrift depository in the New York metro region, with 143 locations and deposits of $10.6 billion (a) Ranked among the top 3% of U.S. thrifts generating income from investment product sales (b) Ranked among the five most efficient bank holding companies in the United States (c)
(a) SNL DataSource
(b) Singer’s Annuity and Funds Report – December 2004/January 2005 (c) American Banker – March 3, 2005
3

We are focused on producing a solid financial performance.
2005 Goals:
Increasing our share of the multi-family lending market
Complementing our asset mix with CRE and construction loans
Maintaining the quality of our assets Maintaining our efficiency Strengthening our balance sheet
Reducing securities Increasing deposits
Maintaining our capital strength
Maintaining a strong dividend
4
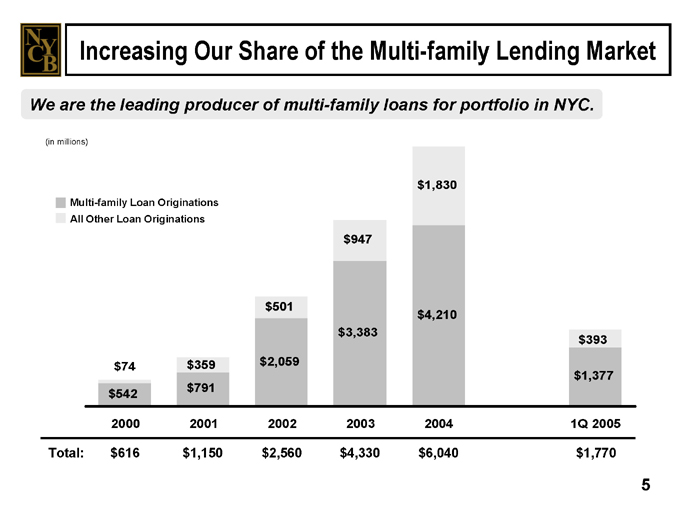
Increasing Our Share of the Multi-family Lending Market
We are the leading producer of multi-family loans for portfolio in NYC.
(in millions)
Multi-family Loan Originations All Other Loan Originations $74 $359 $501 $947 $1,830 $393 $542 $791 $2,059 $3,383 $4,210 $1,377
2000
2001
2002
2003
2004
1Q 2005
Total: $616 $1,150 $2,560 $4,330 $6,040 $1,770
5
Increasing Our Share of the Multi-family Lending Market
We have a highly profitable, efficient, and resilient lending niche.
Niche: Rent-controlled and -stabilized buildings in NYC 5-year fixed / 5-year adjustable rates Pre-payment penalties: 5-4-3-2-1 points in years 1 through 5 Loan structure enhances term yields Longstanding relationships with leading mortgage brokers Represents a growing source of deposits No losses in more than 20 years
6
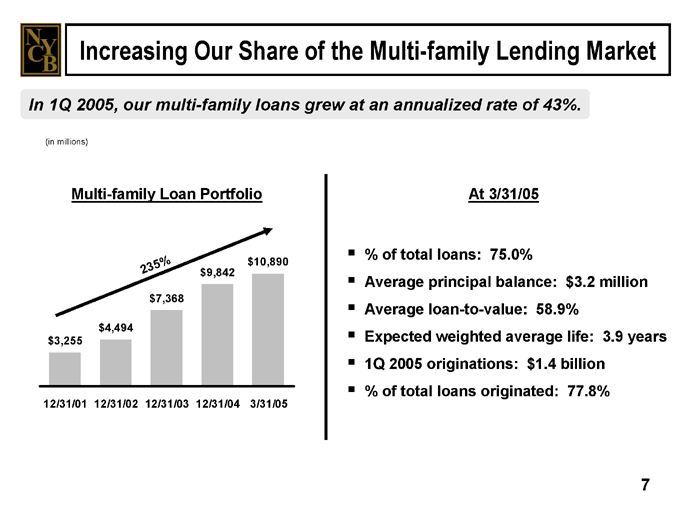
Increasing Our Share of the Multi-family Lending Market
In 1Q 2005, our multi-family loans grew at an annualized rate of 43%.
(in millions)
Multi-family Loan Portfolio
235% $3,255 $4,494 $7,368 $9,842 $10,890
12/31/01
12/31/02
12/31/03
12/31/04
3/31/05
At 3/31/05
% of total loans: 75.0%
Average principal balance: $3.2 million Average loan-to-value: 58.9% Expected weighted average life: 3.9 years 1Q 2005 originations: $1.4 billion % of total loans originated: 77.8%
7
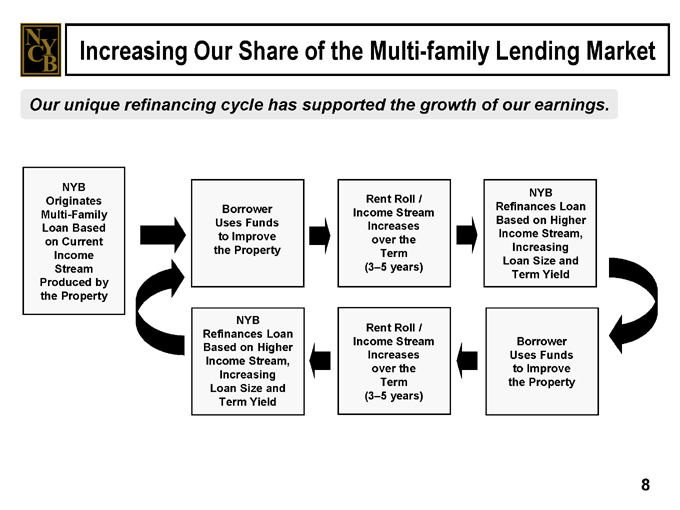
Increasing Our Share of the Multi-family Lending Market
Our unique refinancing cycle has supported the growth of our earnings.
NYB Originates Multi-Family Loan Based on Current Income Stream Produced by the Property
Borrower Uses Funds to Improve the Property
Rent Roll / Income Stream Increases over the Term (3–5 years)
NYB Refinances Loan Based on Higher Income Stream, Increasing Loan Size and Term Yield
NYB Refinances Loan Based on Higher Income Stream, Increasing Loan Size and Term Yield
Rent Roll / Income Stream Increases over the Term (3–5 years)
Borrower Uses Funds to Improve the Property
8
Complementing Our Asset Mix with CRE Loans
Our CRE loans feature a structure similar to that of our multi-family loans.
Niche:
Office and mixed-use buildings in NYC
National credit retail shopping centers in NYC and Long Island
5-year fixed / 5-year adjustable rates
Pre-payment penalties: 5-4-3-2-1 points in years 1 through 5 Conservative credit review No losses in more than a decade
9
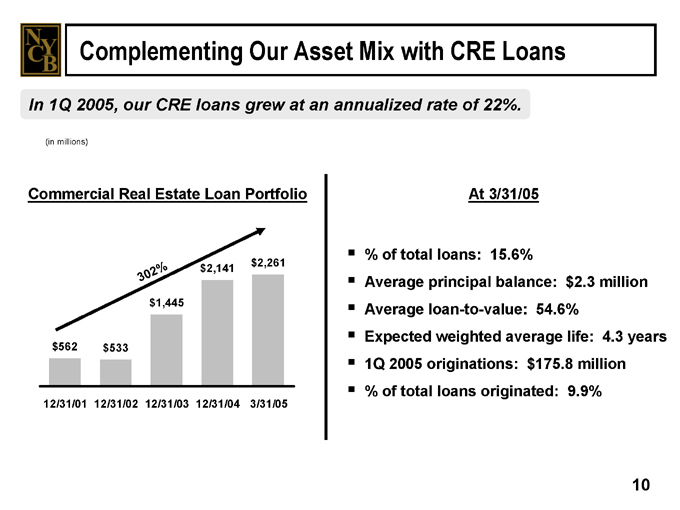
Complementing Our Asset Mix with CRE Loans
In 1Q 2005, our CRE loans grew at an annualized rate of 22%.
(in millions)
Commercial Real Estate Loan Portfolio
302% $562 $533 $1,445 $2,141 $2,261
12/31/01
12/31/02
12/31/03
12/31/04
3/31/05
At 3/31/05
% of total loans: 15.6%
Average principal balance: $2.3 million Average loan-to-value: 54.6% Expected weighted average life: 4.3 years 1Q 2005 originations: $175.8 million % of total loans originated: 9.9%
10
Complementing Our Asset Mix with Construction Loans
We lend to 9 of the top 10 developers on Long Island.
Niche: Residential unit subdivisions on Long Island Floating rate tied to prime Bulk of proceeds distributed upon signed contract of sale No losses in more than a decade
11
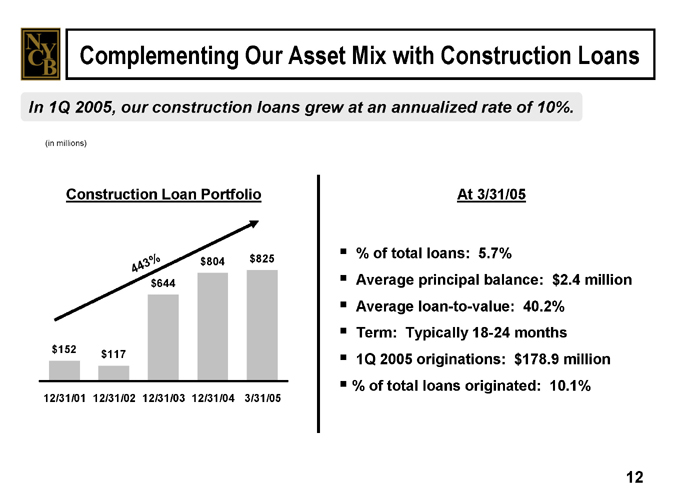
Complementing Our Asset Mix with Construction Loans
In 1Q 2005, our construction loans grew at an annualized rate of 10%.
(in millions)
Construction Loan Portfolio
443% $152 $117 $644 $804 $825
12/31/01
12/31/02
12/31/03
12/31/04
3/31/05
At 3/31/05
% of total loans: 5.7%
Average principal balance: $2.4 million Average loan-to-value: 40.2% Term: Typically 18-24 months 1Q 2005 originations: $178.9 million % of total loans originated: 10.1%
12
Maintaining Asset Quality
The quality of our assets reflects our stringent credit and underwriting standards.
Conservative LTV ratios
Minimum debt coverage ratio: 120%
Mortgage and Real Estate Committee approves all loans
Director and executive officer inspect all properties over $3 million Board of Directors approves all loans over $10 million All properties appraised by independent appraisers All independent appraisals reviewed by in-house appraisal officers Multi-family and commercial real estate loans based on the lower of economic or market value Construction loans disbursed upon receipt of signed contract of sale
13
Maintaining Asset Quality
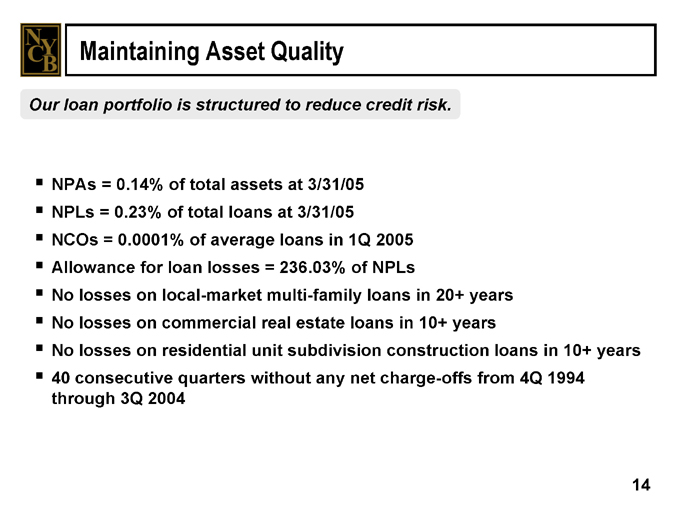
Our loan portfolio is structured to reduce credit risk.
NPAs = 0.14% of total assets at 3/31/05 NPLs = 0.23% of total loans at 3/31/05 NCOs = 0.0001% of average loans in 1Q 2005 Allowance for loan losses = 236.03% of NPLs
No losses on local-market multi-family loans in 20+ years No losses on commercial real estate loans in 10+ years
No losses on residential unit subdivision construction loans in 10+ years 40 consecutive quarters without any net charge-offs from 4Q 1994 through 3Q 2004
14
Maintaining Asset Quality
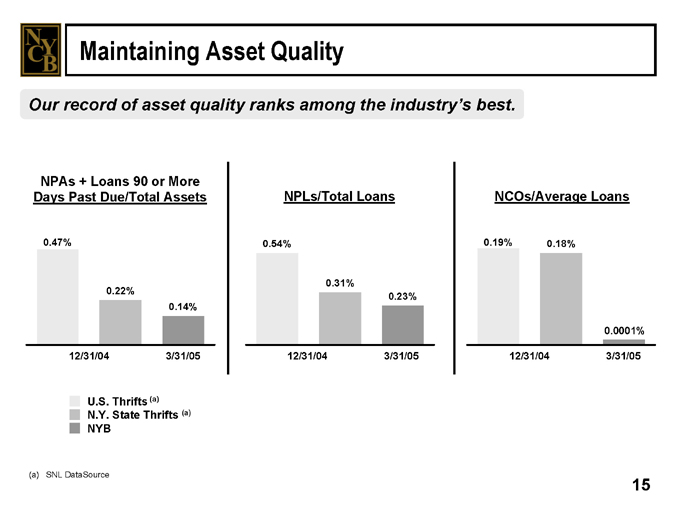
Our record of asset quality ranks among the industry’s best.
NPAs + Loans 90 or More Days Past Due/Total Assets
0.47%
0.22%
0.14%
12/31/04
3/31/05
NPLs/Total Loans
0.54%
0.31%
0.23%
12/31/04
3/31/05
NCOs/Average Loans
0.19%
0.18%
0.0001%
12/31/04
3/31/05
U.S. Thrifts (a) N.Y. State Thrifts (a) NYB
(a) SNL DataSource
15
Maintaining Efficiency
Efficiency is a key component of our financial performance.
Emphasis on multi-family lending Franchise expansion through M & A
HAVN: 56 branches RCBK: 26 branches RSLN: 39 branches
Above-average deposits per traditional branch Hub & spoke approach to in-store branching
89 traditional branches 51 in-store branches 3 customer service centers
Profitable income-producing third-party alliances
1-4 family loans
Insurance and investment products
16
Maintaining Efficiency
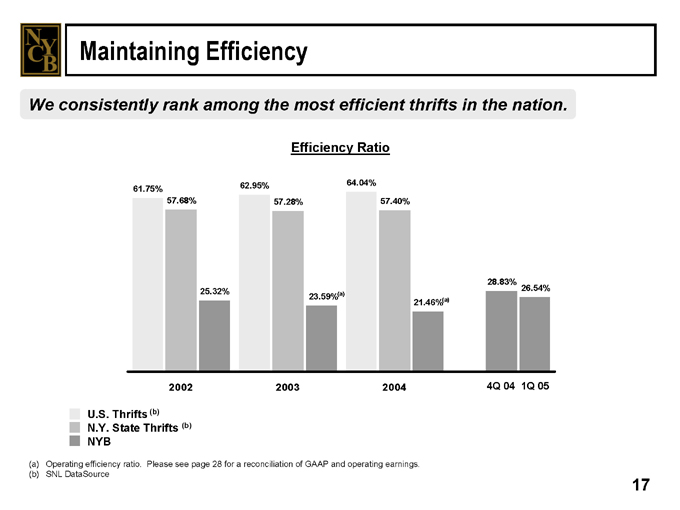
We consistently rank among the most efficient thrifts in the nation.
61.75%
57.68%
25.32%
62.95%
57.28%
23.59%(a)
64.04%
57.40%
21.46%(a)
28.83%
26.54%
2002
2003
2004
4Q 04 1Q 05
U.S. Thrifts (b) N.Y. State Thrifts (b) NYB
(a) Operating efficiency ratio. Please see page 28 for a reconciliation of GAAP and operating earnings. (b) SNL DataSource
17
Strengthening Our Balance Sheet
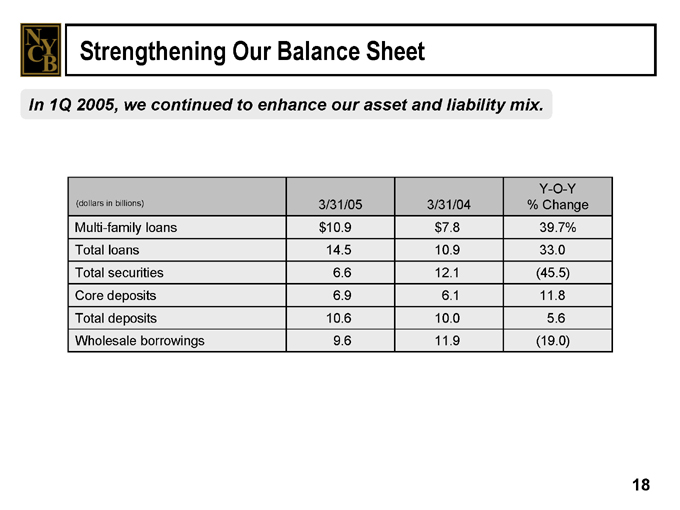
In 1Q 2005, we continued to enhance our asset and liability mix.
Y-O-Y (dollars in billions) 3/31/05 3/31/04 % Change Multi-family loans $10.9 $7.8 39.7% Total loans 14.5 10.9 33.0 Total securities 6.6 12.1 (45.5) Core deposits 6.9 6.1 11.8 Total deposits 10.6 10.0 5.6 Wholesale borrowings 9.6 11.9 (19.0)
18
Strengthening Our Balance Sheet
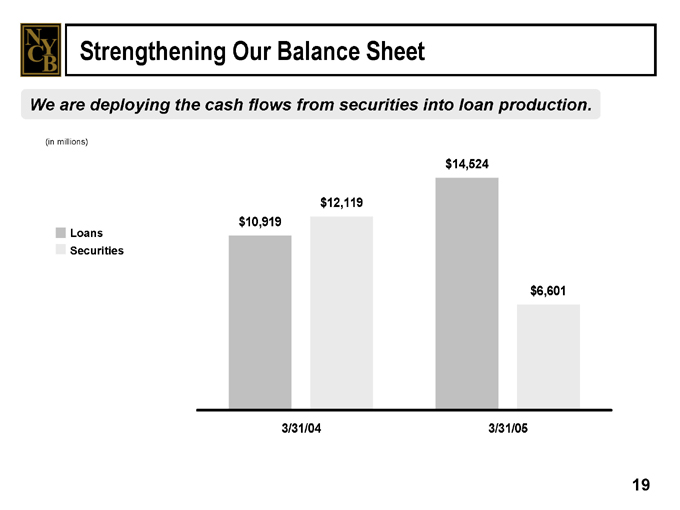
We are deploying the cash flows from securities into loan production.
(in millions)
Loans Securities $10,919 $12,119 $14,524 $6,601
3/31/04
3/31/05
19

Reducing Securities
We reduced our securities portfolio 45.5% in the 12 months ended 3/31/05.
(in millions) $763 $211 $1,904 $1,651 $7,529 $2,712 $1,923 $2,027
3/31/04
3/31/05
Total: $12,119 $6,601
Securities / Assets:
45.7%
26.8%
Debt & Equity Securities Available for Sale Other Securities Held to Maturity Mortgage-related Securities Available for Sale Mortgage-related Securities Held to Maturity
20
Increasing Deposits
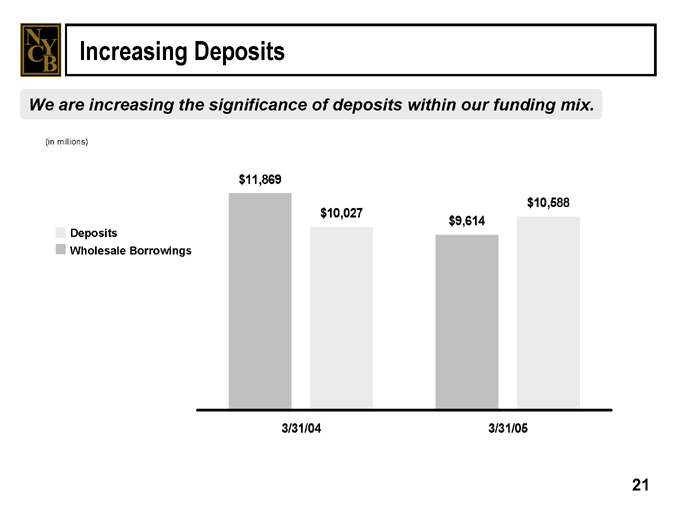
We are increasing the significance of deposits within our funding mix.
(in millions) $11,869 $10,027 $9,614 $10,588
3/31/04
3/31/05
Deposits
Wholesale Borrowings
21
Increasing Deposits
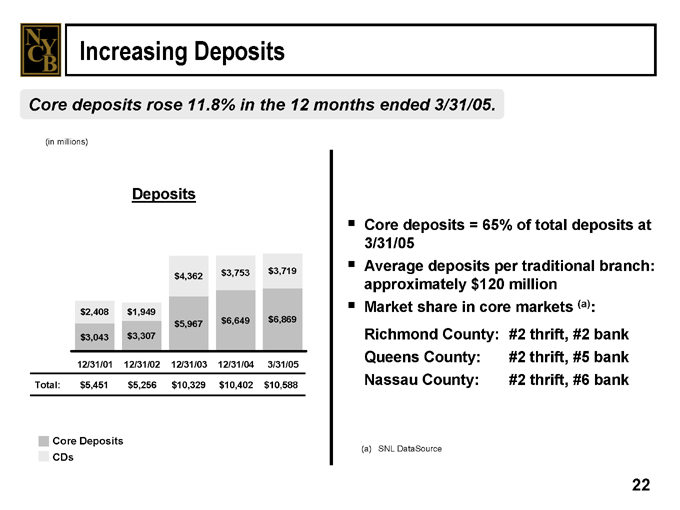
Core deposits rose 11.8% in the 12 months ended 3/31/05.
(in millions)
Deposits $2,408 $1,949 $4,362 $3,753 $3,719 $3,043 $3,307 $5,967 $6,649 $6,869
12/31/01
12/31/02
12/31/03
12/31/04
3/31/05
Total: $5,451 $5,256 $10,329 $10,402 $10,588
Core Deposits CDs
Core deposits = 65% of total deposits at 3/31/05 Average deposits per traditional branch: approximately $120 million Market share in core markets (a): Richmond County: #2 thrift, #2 bank Queens County: #2 thrift, #5 bank Nassau County: #2 thrift, #6 bank
(a) SNL DataSource
22
Increasing Deposits
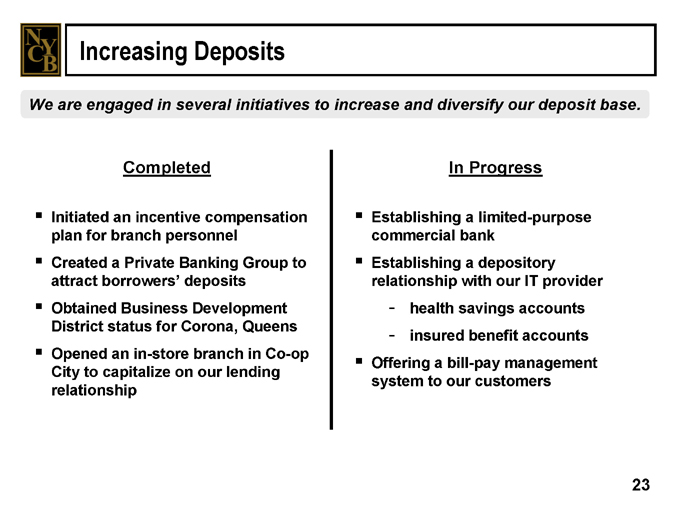
We are engaged in several initiatives to increase and diversify our deposit base.
Completed
Initiated an incentive compensation plan for branch personnel Created a Private Banking Group to attract borrowers’ deposits Obtained Business Development District status for Corona, Queens Opened an in-store branch in Co-op City to capitalize on our lending relationship
In Progress
Establishing a limited-purpose commercial bank Establishing a depository relationship with our IT provider health savings accounts insured benefit accounts
Offering a bill-pay management system to our customers
23
Maintaining Our Capital Strength
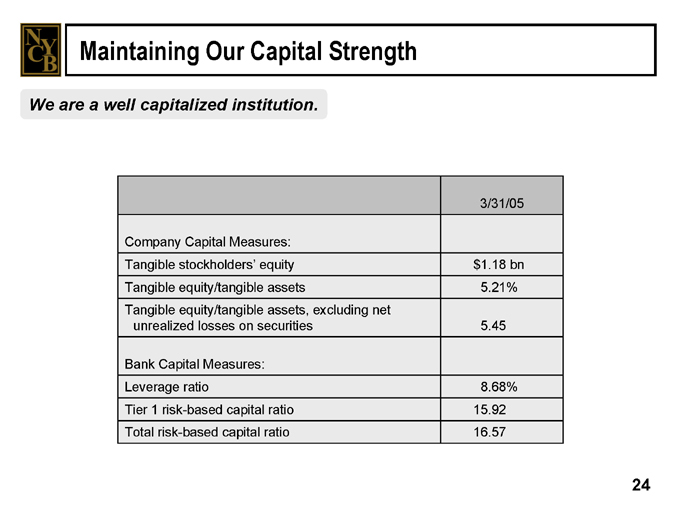
We are a well capitalized institution.
3/31/05
Company Capital Measures:
Tangible stockholders’ equity $1.18 bn Tangible equity/tangible assets 5.21% Tangible equity/tangible assets, excluding net unrealized losses on securities 5.45
Bank Capital Measures:
Leverage ratio 8.68% Tier 1 risk-based capital ratio 15.92 Total risk-based capital ratio 16.57
24
Producing a Solid Financial Performance
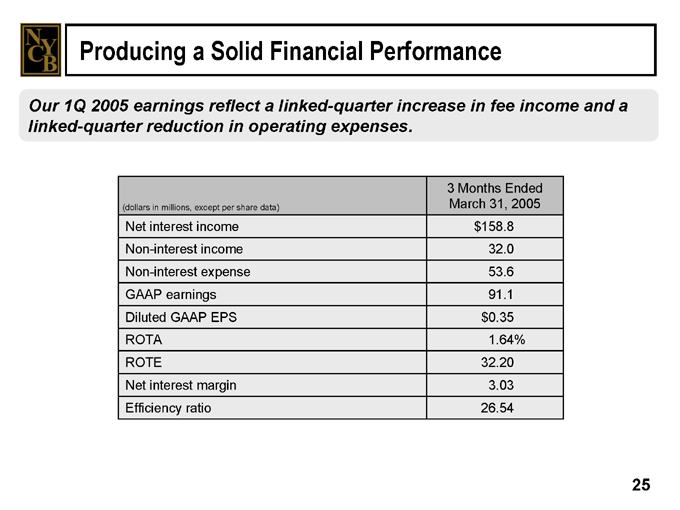
Our 1Q 2005 earnings reflect a linked-quarter increase in fee income and a linked-quarter reduction in operating expenses.
3 Months Ended
(dollars in millions, except per share data) March 31, 2005
Net interest income $158.8 Non-interest income 32.0 Non-interest expense 53.6 GAAP earnings 91.1 Diluted GAAP EPS $0.35 ROTA 1.64% ROTE 32.20 Net interest margin 3.03 Efficiency ratio 26.54
25
Producing a Solid Financial Performance
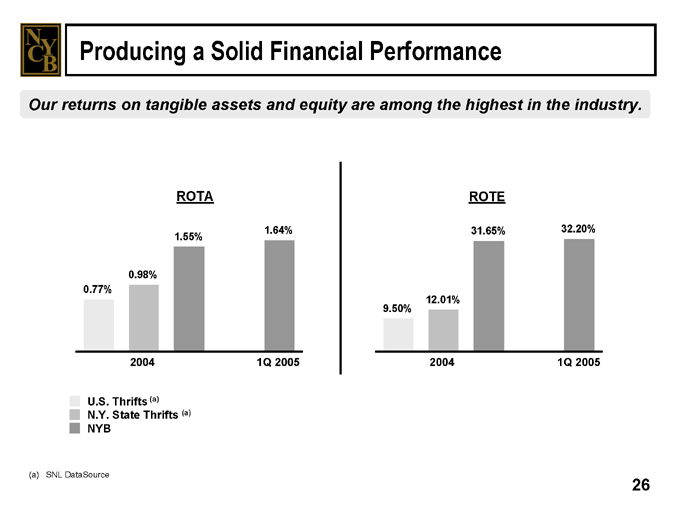
Our returns on tangible assets and equity are among the highest in the industry.
ROTA
0.77%
0.98%
1.55%
1.64%
2004
1Q 2005
ROTE
9.50%
12.01%
31.65%
32.20%
2004
1Q 2005
U.S. Thrifts (a) N.Y. State Thrifts (a) NYB
(a) SNL DataSource
26
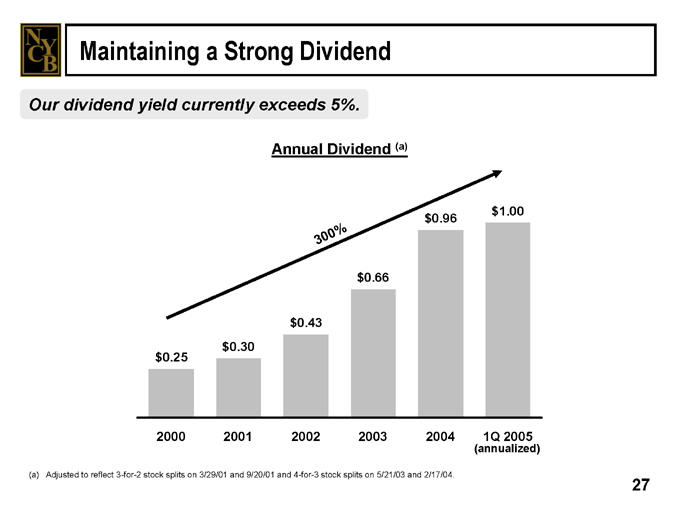
Maintaining a Strong Dividend
Our dividend yield currently exceeds 5%.
Annual Dividend (a)
300% $0.25 $0.30 $0.43 $0.66 $0.96 $1.00
2000
2001
2002
2003
2004
1Q 2005
(annualized)
(a) Adjusted to reflect 3-for-2 stock splits on 3/29/01 and 9/20/01 and 4-for-3 stock splits on 5/21/03 and 2/17/04.
27
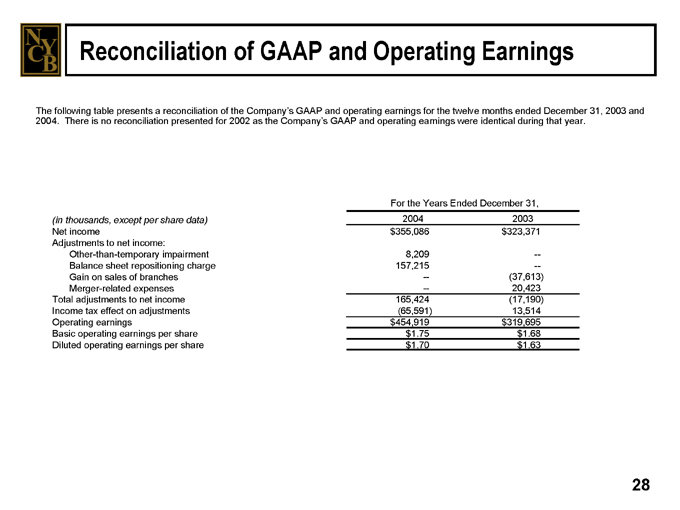
Reconciliation of GAAP and Operating Earnings
The following table presents a reconciliation of the Company’s GAAP and operating earnings for the twelve months ended December 31, 2003 and 2004. There is no reconciliation presented for 2002 as the Company’s GAAP and operating earnings were identical during that year.
For the Years Ended December 31,
(in thousands, except per share data) 2004 2003 Net income $355,086 $323,371 Adjustments to net income: Other-than-temporary impairment 8,209 —Balance sheet repositioning charge 157,215 — Gain on sales of branches — (37,613) Merger-related expenses — 20,423 Total adjustments to net income 165,424 (17,190) Income tax effect on adjustments (65,591) 13,514 Operating earnings $454,919 $319,695 Basic Operating earnings per share $1.75 $1.68 Diluted Operating earnings per share $1.70 $1.63
28
For More Information
The Company trades on the NYSE under the symbol “NYB”.
Log onto our web site: www.myNYCB.com E-mail requests to: ir@myNYCB.com Call Investor Relations at: (516) 683-4420 Write to: New York Community Bancorp, Inc.
615 Merrick Avenue Westbury, NY 11590
4/29/05
29