 Expanding Our Franchise and Market Share in New Jersey through the Acquisition of November 2, 2006 Exhibit 99.2 |
 1 Forward-Looking Statements This presentation, other written materials, and statements management may make regarding the proposed transaction with PennFed Financial Services, Inc., like other written and oral communications presented by New York Community Bancorp, Inc. and its authorized officers, may be forward-looking statements within the meaning of Section 27A of the Securities Act of 1933, as amended, and Section 21E of the Securities Exchange Act of 1934, as amended. New York Community Bancorp, Inc. intends such forward- looking statements to be covered by the safe harbor provisions for forward-looking statements contained in the Private Securities Litigation Reform Act of 1995, and is including this statement for purposes of said safe harbor provisions. Forward-looking statements, which are based on certain assumptions, may be identified by their reference to future periods and include, without limitation, those statements relating to the anticipated effects of the transaction between New York Community Bancorp, Inc. and PennFed Financial Services, Inc. (the “Companies”). The following factors, among others, could cause the actual results of the transaction and the expected benefits of the transaction to the combined company and to the Companies’ shareholders, to differ materially from the expectations-stated in this presentation: the ability of the Companies to consummate the transaction; a materially adverse change in the financial condition or results of operations of either company; the ability of New York Community Bancorp, Inc. to successfully integrate the assets, liabilities, customers, systems, and any management personnel it may acquire into its operations pursuant to the transaction; and the ability to realize the related revenue synergies and cost savings within the expected time frames. In addition, factors that could cause the actual results of the transaction to differ materially from current expectations include, but are not limited to, general economic conditions and trends, either nationally or locally in some or all of the areas in which the Companies and their customers conduct their respective businesses; conditions in the securities markets or the banking industry; changes in interest rates, which may affect the Companies’ net income, the level of prepayment penalties and other future cash flows, or the market value of their assets; changes in deposit flows, and in the demand for deposit, loan, and investment products and other financial services in the Companies’ local markets; changes in the financial or operating performance of the Companies’ customers’ businesses; changes in real estate values, which could impact the quality of the assets securing the Companies’ loans; changes in the quality or composition of the Companies’ loan or investment portfolios; changes in competitive pressures among financial institutions or from non-financial institutions; changes in the customer base of either company; potential exposure to unknown or contingent liabilities of companies targeted by New York Community Bancorp, Inc. for acquisition; the Companies’ timely development of new lines of business and competitive products or services within existing lines of business in a changing environment, and the acceptance of such products or services by the Companies’ customers; any interruption or breach of security resulting in failures or disruptions in customer account management, general ledger, deposit, loan, or other systems; the outcome of pending or threatened litigation or of other matters before regulatory agencies, or of matters resulting from regulatory exams, whether currently existing or commencing in the future; environmental conditions that exist or may exist on properties owned by, leased by, or mortgaged to the Companies; changes in estimates of future reserve requirements based upon the periodic review thereof under relevant regulatory and accounting requirements; changes in banking, securities, tax, environmental, and insurance law, regulations, and policies, and the ability to comply with such changes in a timely manner; changes in accounting principles, policies, practices, or guidelines; changes in legislation and regulation; operational issues stemming from and/or capital spending necessitated by the potential need to adapt to industry changes in information technology systems, on which the Companies are highly dependent; changes in the monetary and fiscal policies of the U.S. Government, including policies of the U.S. Treasury and the Federal Reserve Board; war or terrorist activities; and other economic, competitive, governmental, regulatory, and geopolitical factors affecting the Companies’ operations, pricing, and services. Additionally, the timing and occurrence or non-occurrence of events may be subject to circumstances beyond the Companies’ control. Readers are cautioned not to place undue reliance on these forward-looking statements, which speak only as of the date of this presentation. Except as required by applicable law or regulation, the Companies disclaim any obligation to update any forward-looking statements. Safe Harbor Provisions of the Private Litigation Reform Act of 1995 |
 2 Other Required Legal Disclosures This presentation does not constitute an offer to sell or a solicitation of an offer to buy any securities. New York Community Bancorp, Inc. will file a registration statement containing a proxy statement/prospectus, and other relevant documents concerning the proposed transaction, with the U.S. Securities and Exchange Commission (the “SEC”). WE URGE INVESTORS TO READ THE REGISTRATION STATEMENT CONTAINING THE PROXY STATEMENT/PROSPECTUS, AND ANY OTHER RELEVANT DOCUMENT TO BE FILED WITH SEC, BECAUSE THEY CONTAIN IMPORTANT INFORMATION. Investors will be able to obtain these documents free of charge at the SEC’s web site (www.sec.gov). In addition, documents filed with the SEC by New York Community Bancorp, Inc. will be available free of charge from the Investor Relations Department, New York Community Bancorp, Inc., 615 Merrick Avenue, Westbury, New York 11590. |
 3 Transaction Summary Purchase Price Per Share: $19.50 (1) Transaction Value: $260 million Form of Consideration: 100% NYB Common Stock Exchange Ratio: Fixed at 1.222 NYB shares for each PFSB share Transaction Structure: Tax-free exchange Expected Closing: First Quarter 2007 Estimated Cost Savings: $9.0 million pre-tax (represents 40% of PFSB’s pre-tax operating expenses); 100% realized in 2007 Revenue Synergies: None assumed (1) Based on NYB’s closing price of $15.96 on November 2, 2006. |
 4 Transaction Summary (cont.) Estimated Transaction Costs: $18.6 million after-tax Estimated Core Deposit Intangible: 3% of PFSB’s non-CDs amortized over 10 years (sum-of-the-years digits) Termination Fee: $10 million (3.8% of transaction value) Due Diligence: Completed Required Approvals: PFSB’s shareholders and customary regulatory approvals |
 5 Strategic Rationale Strengthens our market share in New Jersey Improves our position from 26 th to 7 th in Essex County Solidifies our position in Hudson and Union Counties Expands our footprint into Ocean, Middlesex, and Monmouth Counties Provides cost-effective deposits to fund loan growth Franchise Enhancing Significant Cost Savings and Revenue Enhancement Opportunities PFSB’s current efficiency ratio is 62.2% compared to 40.7% for NYB Estimated cost savings of approximately 40% of PFSB’s operating expenses $9.0 million in potential additional earnings from future balance sheet repositioning (1) Provides liquidity through potential sale of PFSB’s 1–4 family loans and securities to fund the production of multi-family and other higher- yielding loans (1) Assumes PFSB’s 1-4 family loans and securities are replaced by multi-family and other higher-yielding loans. |
 6 Strategic Rationale (cont.) Expected to be immediately accretive to our GAAP and cash earnings Low core deposit premium (1) of 10.8% Double-digit internal rate of return without assumed revenue enhancements from balance sheet repositioning Attractive Transaction Pricing Low Execution Risk Strong integration track record – five transactions in last six years PFSB’s assets equate to approximately 8% of NYB’s current assets No social issues Low credit risk (1) Calculated as transaction value less tangible book value divided by total deposits less CDs > $100,000. |
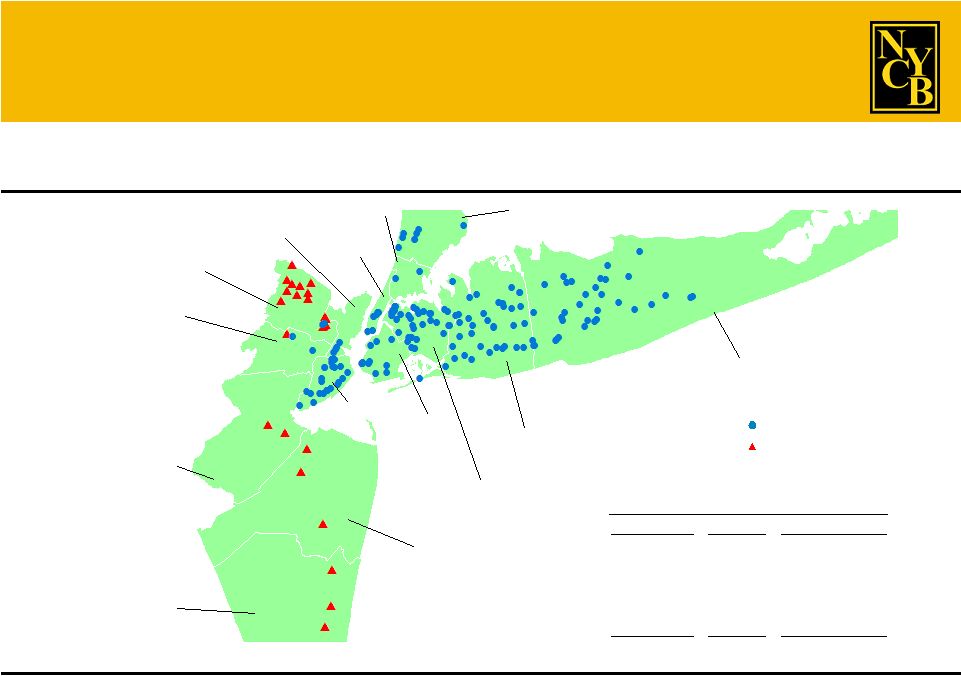 7 Natural Expansion of NYB’s Footprint NYB PFSB Bronx Manhattan Richmond Kings Queens Nassau Suffolk Westchester Essex Union Middlesex Monmouth Ocean Hudson Essex 13 $0.90 Ocean 3 0.14 Monmouth 3 0.13 Middlesex 2 0.13 Hudson 2 0.08 Union 1 0.04 Total 24 $1.43 PFSB Deposits by County (1) County Branches Deposits ($B) Source: SNL Financial. (1) As at June 30, 2006. |
 8 Monmouth Strengthens and Expands Our Market Share Source: SNL Financial. Data as at June 30, 2006. Above analysis is pro forma for pending transactions. Hudson ($ in millions) Union Ocean Middlesex Essex 1 Wachovia 32 $2,756 17.41% 2 Sovereign 22 1,668 10.53 3 PNC 24 1,372 8.67 4 Valley National 26 1,289 8.14 5 Bank of America 33 1,194 7.54 6 JPMorgan Chase 18 1,036 6.54 7 NYB Pro Forma 15 967 6.11 7 Hudson City 10 967 6.11 8 PFSB 13 900 5.68 9 Commerce 8 709 4.48 10 Investors Bancorp 8 708 4.47 26 NYB 2 68 0.43 Total For Institutions In Market 272 $15,836 Market Rank Institution Branches Deposits Share 1 Bank of America 24 $10,534 53.53% 2 Capital One Financial 17 1,208 6.14 3 Provident Financial Services 17 959 4.87 4 Hudson City 8 939 4.77 5 Charles Schwab 1 756 3.84 6 Wachovia 14 559 2.84 7 Valley National 13 508 2.58 8 TD Banknorth 12 499 2.53 9 Pamrapo 9 423 2.15 10 PNC Financial Services Group 11 415 2.11 15 NYB Pro Forma 6 280 1.42 17 NYB 4 195 0.99 22 PFSB 2 85 0.43 Total For Institutions In Market 190 $19,680 Market Rank Institution Branches Deposits Share 1 Wachovia 32 $4,723 31.82% 2 Bank of America 31 1,425 9.60 3 Commerce 13 998 6.72 4 Sovereign 22 915 6.17 5 Union County Savings Bank 4 851 5.73 6 Investors 11 846 5.70 7 PNC Financial Services Group 14 751 5.06 8 Center 8 627 4.22 9 JPMorgan Chase 7 434 2.92 10 Synergy Finl Group 11 430 2.90 20 NYB Pro Forma 3 124 0.84 23 NYB 2 80 0.54 29 PFSB 1 44 0.29 Total For Institutions In Market 214 $14,846 Market Rank Institution Branches Deposits Share 1 Wachovia 30 $2,192 19.47% 2 Commerce 18 1,696 15.06 3 Hudson City 12 1,546 13.74 4 Sovereign 29 1,425 12.65 5 OceanFirst Financial 15 1,195 10.62 6 Bank of America 30 1,072 9.52 7 Investors 6 463 4.11 8 PNC Financial Services Group 11 439 3.90 9 Sun 6 210 1.86 10 Provident Financial Services 6 185 1.65 12 PFSB 3 139 1.23 Total For Institutions In Market 191 $11,257 Market Rank Institution Branches Deposits Share 1 Wachovia 28 $2,956 16.80% 2 PNC Financial Services Group 32 2,721 15.47 3 Bank of America 35 1,870 10.63 4 Amboyoration 12 1,613 9.17 5 Provident Financial Services 23 1,415 8.05 6 Commerce 13 1,246 7.08 7 Sovereign 17 1,208 6.87 8 Washington Mutual 6 446 2.54 9 Bessemer Group 1 376 2.14 10 Magyar 3 332 1.89 21 PFSB 2 126 0.72 Total For Institutions In Market 256 $17,589 Market Rank Institution Branches Deposits Share 1 Wachovia 34 $2,432 17.42% 2 Sovereign 28 1,882 13.48 3 Bank of America 38 1,474 10.56 4 Commerce 17 1,352 9.69 5 PNC Financial Services Group 22 1,165 8.35 6 Investors 9 928 6.65 7 Hudson City 5 792 5.67 8 Central Jersey 13 393 2.81 9 Provident Financial Services 10 377 2.70 10 Sun 12 375 2.69 21 PFSB 3 133 0.95 Total For Institutions In Market 265 $13,958 Market Rank Institution Branches Deposits Share |
 9 Significant Cost Savings and Revenue Enhancement Opportunities Transaction expected to close on or about March 31, 2007 Estimated cost savings of 40% of PFSB’s pre-tax operating expenses to be fully realized in 2007 Opportunity to deploy cash flows from PFSB’s 1-4 family loans and securities into multi-family and other higher- yielding loans Expected to be accretive to both GAAP and Cash EPS in 2007 and 2008 without incremental revenue from potential balance sheet repositioning |
 10 Significant Cost Savings Opportunities Sources of Estimated Cost Savings Compensation and benefits Benefit plans General, administrative, and other Total estimated cost savings Amount (pre-tax) $6.0 1.0 2.0 $9.0 Represents 40% of PFSB’s Pre-Tax Operating Expenses ($ in millions) |
 11 Attractive Transaction Pricing Price/LTM Earnings 21.7x 24.0x Price/2007 Projected EPS (2) 20.0 20.6 Price/2007 Projected EPS + Cost Savings (3) 14.0 — Price/2007 Projected EPS + Balance Sheet 11.8 — Repositioning Synergy (4) Price/2007 Projected EPS + Cost Savings + 9.4 — Balance Sheet Repositioning Synergy (4) Price/Book Value (5) 2.01 2.68 Price/Tangible Book Value (5) 2.01 3.02 Core Deposit Premium (6) 10.8% 20.0% Source: SNL Financial and Company SEC Filings. (1) Precedent transactions include selected bank and thrift deals in NY, NJ, PA, and MD. Data represents medians. (2) 2007 EPS based on I/B/E/S consensus estimate of $0.97. (3) Based on estimated cost savings of $9.0 million (pre-tax). (4) Balance sheet repositioning assumes PFSB’s 1-4 family loans and securities are replaced by multi-family and other higher-yielding loans. (5) Book value and tangible book value per share at September 30, 2006. (6) Calculated as transaction value less tangible book value divided by total deposits less CD > $100,000. Precedent Transactions (1) NYB-PFSB ($ in millions) |
 12 Low Execution Risk NYB has successfully integrated five acquisitions and in each case repositioned the post-merger balance sheet Common community banking focus Pro formas reflect conservative cost savings assumptions and no revenue enhancement Integration to be completed in early 2007 |
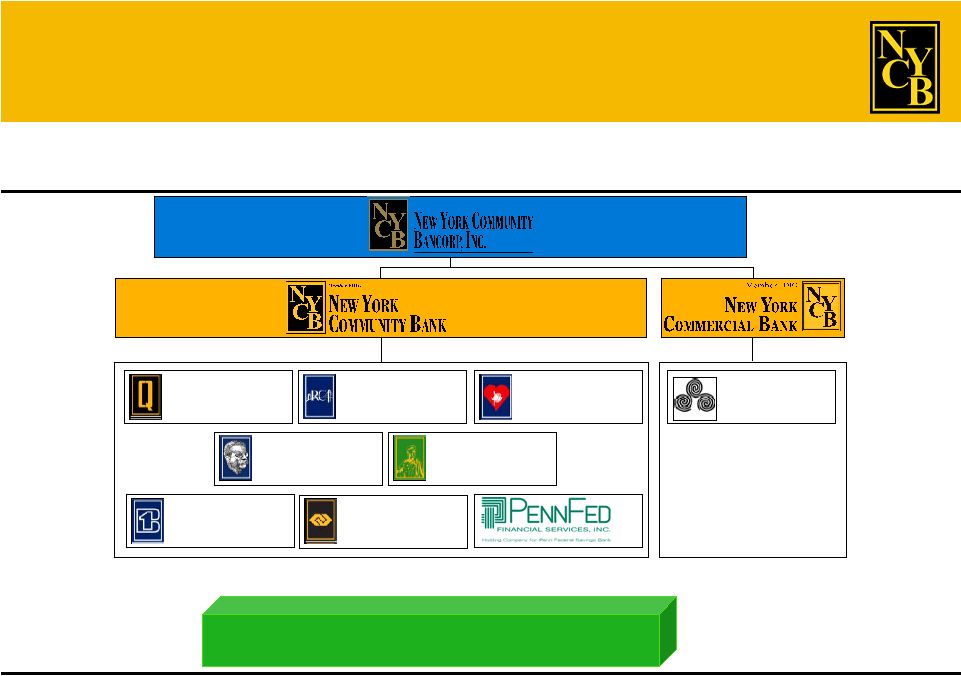 13 Our Corporate Structure NYB’s structure supports back-office consolidation and retention of strong brands. Community Bank Divisions Commercial Bank Divisions Queens County Savings Bank Richmond County Savings Bank Roslyn Savings Bank Roosevelt Savings Bank CFS Bank Ironbound Bank First Savings Bank of NJ Atlantic Bank of New York |
 14 PFSB At-A-Glance (1) (1) Data at or for the quarter ended September 30, 2006. Attractive Community Banking Franchise Strong Credit Culture, Asset Quality, and Capital Ratios Non-Performing Assets/Total Assets 0.09% Non-Performing Loans/Total Loans 0.12 Net Charge-Offs/Average Loans 0.01 Allowance for Loan Losses/Total Loans 0.34 Allowance for Loan Losses/Non-Performing Loans 274.07 Tangible Equity/Tangible Assets 5.33 Total Risk-Based Capital Ratio 13.43 $2.3 billion in assets $1.7 billion in loans: 77% 1–4 family, 13% consumer, 10% commercial and multi-family $1.5 billion in deposits 24 branches in Essex, Ocean, Middlesex, Monmouth, Hudson, and Union Counties in New Jersey #8 ranked depository in Essex County |
 15 PFSB’s Deposit and Loan Composition Deposits (1) Loans (1) (1) At September 30, 2006. Savings 18.6% Non-Jumbo CDs 49.4% Jumbo CDs 11.0% Checking and Money Market 21.0% Total: $1.5B Total: $1.7B Consumer 12.8% Other 0.7% Commercial & Multi-Family 9.9% 1-4 Family 76.6% |
 16 Strong Credit Quality (1) Bank & NYB PFSB Pro Forma Thrift Peers (2) Net Charge-Offs/Average Loans 0.00% 0.01% 0.00% 0.07% Non-Performing Assets/Total Assets 0.12 0.09 0.11 0.27 Allowance for Loan Losses/Total Loans 0.43 0.34 0.42 1.12 Allowance for Loan Losses/ 266.0 274.1 266.1 283.0 Non-Performing Loans (1) At or for the quarter ended September 30, 2006. (2) Average of all publicly traded banks and thrifts in the US. |
 17 Summary Strengthens our franchise and market share in New Jersey Provides cost-effective retail deposits to fund loan growth Opportunity for significant cost savings Significant opportunity to enhance profitability through post-merger balance sheet repositioning Expected to be accretive to GAAP and cash earnings with strong internal rate of return on capital Low execution risk Consistent with our growth-through-acquisition strategy |