 Second Quarter 2007 Investor Presentation Exhibit 99.1 |
 |
 3 Other Required Legal Disclosures This presentation does not constitute an offer to sell or a solicitation of an offer to buy any securities. New York Community Bancorp, Inc. has filed a registration statement containing a proxy statement/prospectus, and other relevant documents concerning the proposed transaction, with the U.S. Securities and Exchange Commission (the “SEC”). WE URGE INVESTORS TO READ THE REGISTRATION STATEMENT CONTAINING THE PROXY STATEMENT/PROSPECTUS, AND ANY OTHER RELEVANT DOCUMENTS FILED WITH THE SEC, BECAUSE THEY CONTAIN IMPORTANT INFORMATION. Investors will be able to obtain these documents free of charge at the SEC’s web site (www.sec.gov). In addition, documents filed with the SEC by New York Community Bancorp, Inc. are available free of charge from the Investor Relations Department, NewYork Community Bancorp, Inc., 615 Merrick Avenue, Westbury, New York 11590. |
 4 With assets of approximately $31.0 billion: (a)(b) - We operate the 5th largest thrift in the nation and the largest in New York State. (c) With a portfolio of approximately $13.6 billion: (b)(d) - We are the leading producer of multi-family loans for portfolio in New York City. (c) With deposits of approximately $14.7 billion, we operate: (b)(e) - the 3rd largest thrift depository in our market (c) ; and - the 14th largest commercial bank depository in our market. (c) With our acquisition of PennFed Financial Services, Inc. on April 2, 2007 and our pending acquisition of Synergy Financial Group, Inc., we operate: - the 2nd largest thrift depository in Essex County (c) ; - the 4th largest thrift depository in Union County (c) ; and - the 5th largest thrift depository in the six NJ counties we serve, combined. (c) We are a leading financial institution in the competitive New York metropolitan region. Note: Please see footnotes on page 30 of this presentation. |
 5 2nd Quarter 2007 Performance Highlights |
 6 Our 2Q 2007 performance was highlighted by improved operating metrics. (a) Please see page 31 for a reconciliation of our GAAP and operating earnings. (b) Please see page 33 for a reconciliation of our GAAP and operating efficiency ratios. (c) Please see page 35 for a reconciliation of our GAAP and non-GAAP capital measures. Operating Earnings Growth: - Our operating EPS rose $0.01on a linked-quarter basis. (a) Margin Expansion: - Our net interest margin rose 12 basis points linked-quarter and 15 basis points year- over-year. Higher Average Yield on Loans: - At 6.44%, our average yield on loans was up 30 basis points linked-quarter and 59 basis points year-over-year. Solid Asset Quality: - Charge-offs totaled $67,000, representing 0.0003% of average loans. - Non-performing assets represented 0.05% of total assets at 6/30/07. Strong Operating Efficiency: - Our operating efficiency ratio was 40.48%. (b) Tangible Capital Strength: - At 6/30/07, tangible stockholders’ equity equaled 5.80% of tangible assets excluding after-tax net unrealized losses on securities and an after-tax loss on the other-than-temporary impairment of securities; including these items, the ratio was 5.57%. (c) |
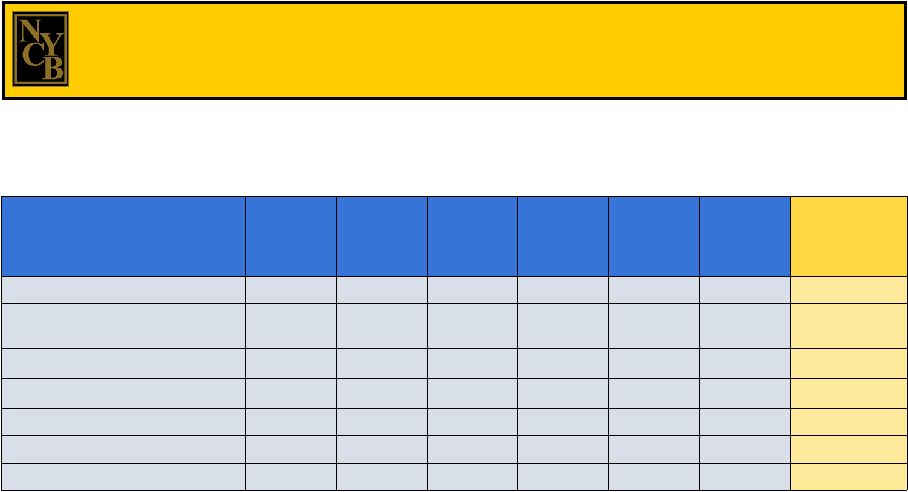 7 Our net interest margin has reflected improvement in a challenging yield curve environment. 3.89 4.65 4.28 2.32% $13,691 5.96 6.14% 1Q 2007 3.83 4.57 4.22 2.27% $8,746 5.86 6.08% 4Q 2006 3.56 4.07 4.14 2.29% $5,305 5.62 5.85% 2Q 2006 3.45 3.72 4.13 2.28% $10,149 5.56 5.81% 1Q 2006 63.0% $22,320 $5,320 Prepayment penalties 5 bp 4.33 4.18 Average cost of borrowed funds 1 bp 3.90 3.74 Average cost of funds (5) bp 4.60 4.34 Average cost of CDs 12 bp 2.44% 2.24% Net interest margin 14 bp 6.10 5.74 Average yield on interest-earning assets 30 bp 6.44% 5.94% Average yield on loans 2Q 2007 Linked-quarter Increase (Decrease) 2Q 2007 3Q 2006 (dollars in thousands) |
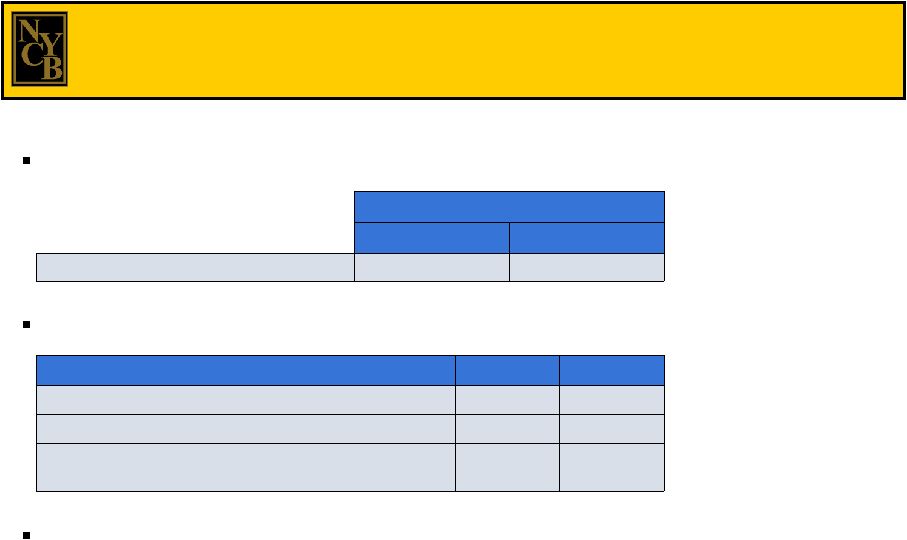 8 Both of our bank subsidiaries are well capitalized institutions: The strength of our capital position has enabled us to pay a strong dividend. 6/30/07 11.21% 7.73% Leverage capital ratio Commercial Bank Community Bank Our tangible capital measures grew year-over-year: 5.80* 5.69 Tangible equity / tangible assets excluding after- tax net unrealized losses on securities (a) 5.57% 5.41% Tangible equity / tangible assets (a) $1.5 $1.4 Tangible stockholders’ equity (a) 6/30/07 6/30/06 (dollars in billions) Our quarterly cash dividend has increased 90-fold since we initiated payments in 3Q 1994 and currently provides a yield of approximately 6.0%. (a) Please see page 35 for a reconciliation of our GAAP and non-GAAP capital measures. * Also excludes the after-tax loss on the other-than-temporary impairment of securities recorded in 2Q 2007. |
 9 In the second and third quarters of 2007, we took a series of actions, each one providing specific benefits. Reduced cost of funds Redeemed Haven Trust I & Roslyn Trust I 4/2/07 Expands franchise in central NJ; increases deposits; provides opportunity to reposition the balance sheet Announced acquisition of Synergy Financial Group, Inc. 5/13/07 Expanded Commercial Bank franchise in NYC; increased deposits; provided quality loans Acquired 11 branches in NYC and certain assets and liabilities from Doral Bank, FSB 7/26/07 Provided cash flows to invest in higher-yielding assets Sold $1.1 billion of mortgage-related securities 7/07 Offset 2Q 2007 impairment loss Sold Atlantic Bank headquarters 7/16/07 Reduced cost of funds Increased interest-earning asset yields Provided cash flows to invest in higher-yielding assets Expanded the Community Bank franchise; increased deposits; provided opportunity to reposition the balance sheet Benefit Prepaid $330.2 million of wholesale borrowings with an average yield of 5.35% 6/07 Purchased $671.2 million of securities with an average yield of 6.24% 4/07 & 6/07 Sold $1.4 billion of 1-4 family & home equity loans in whole or securitized form 4/07-6/07 Acquired PennFed Financial Services, Inc. 4/2/07 Action Date |
 10 Our Business Model |
 11 We have a consistent business model that is focused on building value while building the Company. (a) The proposed acquisition is pending approval of SYNF’s shareholders and certain regulatory agencies. (b) Please see page 33 for a reconciliation of our GAAP and operating efficiency ratios. The growth of our business through accretive mergers and acquisitions: - Completed • November 30, 2000: Haven Bancorp, Inc. (HAVN) • July 31, 2001: Richmond County Financial Corp. (RCBK) • October 31, 2003: Roslyn Bancorp, Inc. (RSLN) • December 30, 2005: Long Island Financial Corp. (LICB) • April 28, 2006: Atlantic Bank of New York (ABNY) • April 2, 2007: PennFed Financial Services, Inc. (PFSB) • July 26, 2007: NYC branch network of Doral Bank, FSB (Doral) - Announced • May 13, 2007: Synergy Financial Group, Inc. (SYNF) (a) The origination of multi-family loans: - $19.4 billion of multi-family loans originated since January 2000, including $1.0 billion in 1H 2007 The maintenance of strong credit standards, resulting in a record of solid asset quality: - Charge-offs of $135,000 in 1H 2007 – all on acquired assets - Non-performing assets represented 0.05% of total assets at 6/30/07 The efficient operation of our Company and our branch network: - Operating efficiency ratio of 40.60% in 1H 2007 (b) The post-merger repositioning of our balance sheet |
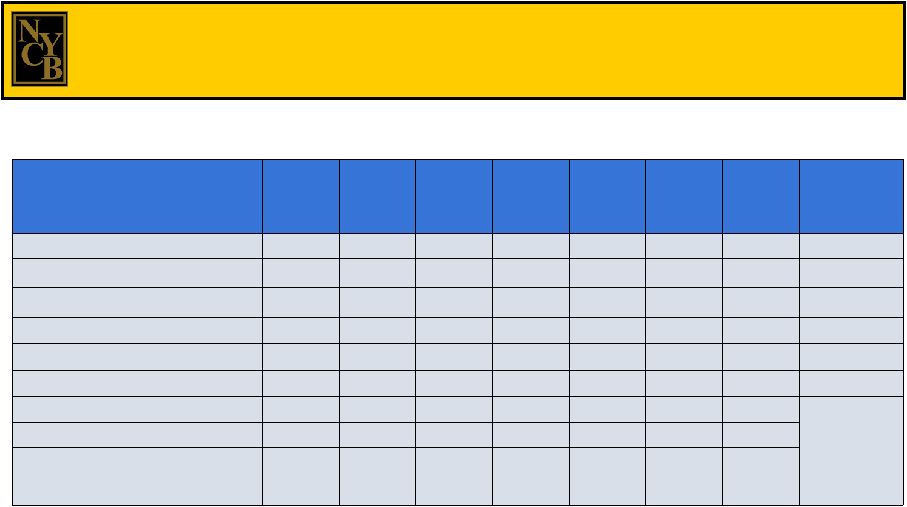 12 Our balance sheet reflects the benefits of our growth-through- acquisition strategy and the organic growth of our loan portfolio. 5.80% * 5.57% 1.5 13.8 6.9 29.6 18.9 $13.5 198 w/ PFSB 6/30/07 5.66% 5.47% 1.4 12.6 6.7 28.5 19.7 $14.5 166 w/ ABNY 12/31/06 5.19% 3.97% 3.65% 4.12% 7.19% Tangible equity / tangible assets (a) 1.3 0.9 0.3 0.2 0.1 Tangible stockholders’ equity (a) 31.0 26.3 23.4 9.2 4.7 1.9 Total assets 5.41% 4.13% 3.60% 4.11% 7.19% Tangible equity / tangible assets excluding after-tax net unrealized losses on securities (a) 14.7 12.1 10.3 5.5 3.3 1.0 Total deposits 7.3 6.9 6.0 3.0 1.4 0.4 Core deposits 19.9 17.0 10.5 5.4 3.6 1.6 Total loans $13.6 $12.9 $ 7.4 $3.3 $1.9 $1.3 Multi-family loans 218 152 139 120 86 14 Number of branches Pro Forma w/ Doral & SYNF (b)(c)(d) 6/30/07 w/ LICB 12/31/05 w/ RSLN 12/31/03 w/ RCBK 12/31/01 w/ HAVN 12/31/00 12/31/99 (dollars in billions) Note: Please see footnotes on page 30 of this presentation. * This ratio also excludes the after-tax loss on the other-than-temporary impairment of securities recorded in 2Q 2007. |
 13 Each of our acquisitions has contributed to the achievement of several key goals. PFSB Provides opportunities for profitable post-merger balance sheet repositioning ABNY Provides cost-effective deposits to fund loan growth Extends our geographic footprint within the Metro New York region Strengthens our deposit market share in existing markets Immediately accretive to GAAP and cash earnings SYNF LICB RSLN RCBK HAVN |
 14 Our business model calls for the cash flows from the sale of acquired assets to be converted into securities and then into loans. (dollars in millions) $1,611 $3,636 $5,405 $5,489 $10,499 $10,919 $13,396 $17,029 $19,653 $18,918 $197 $526 $2,578 $4,652 $9,500 $12,119 $7,081 $5,637 $5,692 $4,926 45.7% 41.2% % of Total Assets: 3/31/04 12/31/04 12/31/05 29.5% 55.7% 21.4% 64.8% 17.3% 69.0% 12/31/06 12/31/00 12/31/01 12/31/02 12/31/03 12/31/99 Loans Securities 10.4% 84.3% 11.2% 77.2% 28.0% 58.7% 41.1% 48.5% 40.5% 44.8% w/ HAVN w/ RCBK w/ RSLN w/ ABNY w/ LICB 19.2% 63.9% 6/30/07 w/ PFSB |
 15 Since repositioning our balance sheet in June 2004, we have completed four acquisitions and announced one other. (a) 55 Savings Institution Branches 3,750 Savings Institution Assets 3,340 Commercial Bank Assets $7,090 Total Assets Acquired 2,647 Savings Institution Deposits 84 Total Branches Acquired $4,870 Total Deposits Acquired 29 Commercial Bank Branches 9.6% Weighted Average Total Deposit Premium 2,223 Commercial Bank Deposits (dollars in millions) (a) Completed acquisitions: LICB, ABNY, PFSB, Doral branches; announced acquisition: SYNF |
 16 The transaction-driven expansion of our franchise has enabled us to compete very effectively against New York’s money center banks. NASSAU COUNTY, NY 100.00 $49,220,400 Total for Institutions in Market 2.25 1,109,590 Signature Bank 10 4.07 2,001,685 HSBC Holdings plc 9 4.69 2,306,740 Commerce Bancorp Inc. 8 5.18 2,551,880 Bank of America Corp. 7 7.30 3,592,143 Washington Mutual Inc. 6 10.04 4,942,587 Astoria Financial Corp. 5 11.20 5,512,324 New York Community 4 12.64 6,220,195 Citigroup Inc. 3 13.16 6,479,473 Capital One Financial Corp. 2 16.56% $ 8,148,830 JPMorgan Chase & Co. 1 Market Share Deposits Institution Rank QUEENS COUNTY, NY (a) 100.00 $37,959,231 Total for Institutions in Market 2.32 881,257 Flushing Financial Corp. 10 2.56 970,644 Sovereign Bancorp Inc. 9 2.81 1,064,945 Washington Mutual Inc. 8 3.89 1,476,714 Ridgewood Savings Bank 7 7.07 2,685,273 HSBC Holdings plc 6 8.08 3,065,367 New York Community 5 8.32 3,157,905 Astoria Financial Corp. 4 12.44 4,722,978 Capital One Financial Corp. 3 13.53 5,135,605 Citigroup Inc. 2 18.97% $ 7,199,592 JPMorgan Chase & Co. 1 Market Share Deposits Institution Rank (dollars in thousands) Source: SNL DataSource (a) Includes deposits acquired from Doral on 7/26/07. RICHMOND COUNTY, NY 100.00 $8,496,029 Total for Institutions in Market 1.71 145,351 Capital One Financial Corp. 10 2.41 204,733 VSB Bancorp Inc. 9 3.02 256,278 HSBC Holdings plc 8 4.00 339,897 Commerce Bancorp Inc. 7 7.11 603,776 Washington Mutual Inc. 6 8.91 757,151 NSB Holding Corp. 5 11.87 1,008,144 Citigroup Inc. 4 12.21 1,037,444 JPMorgan Chase & Co. 3 17.99 1,528,359 New York Community 2 29.33% $2,491,607 Sovereign Bancorp Inc. 1 Market Share Deposits Institution Rank SUFFOLK COUNTY, NY 100.00 $33,793,788 Total for Institutions in Market 2.66 900,089 Commerce Bancorp Inc. 10 3.50 1,183,588 Suffolk Bancorp 9 4.48 1,512,730 Bank of America Corp. 8 4.59 1,550,614 New York Community 7 4.93 1,666,075 HSBC Holdings plc 6 7.24 2,445,807 Citigroup Inc. 5 7.82 2,642,889 Washington Mutual Inc. 4 9.08 3,069,546 Astoria Financial Corp. 3 19.16 6,473,902 JPMorgan Chase & Co. 2 26.03% $ 8,795,547 Capital One Financial Corp. 1 Market Share Deposits Institution Rank ESSEX COUNTY, NJ 100.00 $15,835,652 Total for Institutions in Market 4.47 708,081 Investors Bancorp Inc. 10 4.48 709,304 Commerce Bancorp Inc. 9 6.11 966,905 Hudson City Bancorp Inc. 8 6.11 967,395 New York Community 7 6.54 1,035,703 JPMorgan Chase & Co. 6 7.54 1,194,135 Bank of America Corp. 5 8.14 1,289,226 Valley National Bancorp 4 8.67 1,372,355 PNC Financial Services 3 10.53 1,667,929 Sovereign Bancorp Inc. 2 17.41% $ 2,756,217 Wachovia Corp. 1 Market Share Deposits Institution Rank |
 17 Our acquisition of SYNF will provide us with an established franchise with 20 branches, and solid measures of asset quality and capital. (a) (a) Excludes branch scheduled to open in 3Q 2007. (b) Data at or for the quarter ended 6/30/07. $599 million Deposits $736 million Loans $932 million Assets Balance Sheet Highlights: (b) $259 million Core deposits 0.03 Net charge-offs / average loans Capital Measures: (b) Asset Quality Measures: (b) 10.65% Tangible equity / tangible assets 13.27 Total risk-based capital ratio 0.78 Allowance for loan losses / total loans 0.02% Non-performing assets / total assets |
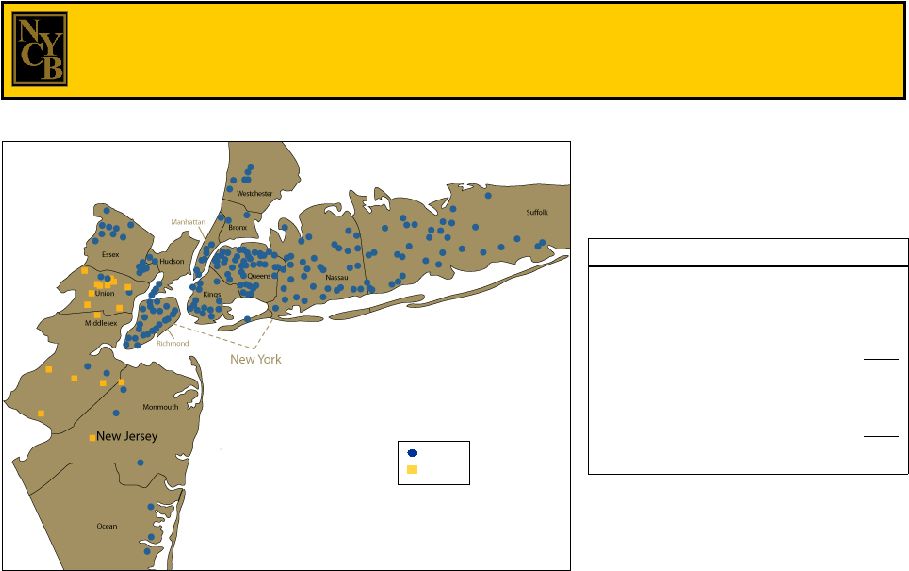 18 Upon completion of the SYNF acquisition, we will have 165 locations in New York and 53 in New Jersey. NYB SYNF New York Commercial Bank 46 In-store branches 110 Traditional branches New York Community Bank 159 Subtotal 3 Customer convenience centers 38 Traditional branches The NYCB Franchise 197 Total locations |
 19 (dollars in thousands) Source: SNL DataSource MIDDLESEX COUNTY, NJ 0.72 126,172 New York Community 21 100.00 $17,588,833 Total for Institutions in Market 0.85 149,201 Synergy Financial Group 18 1.57 275,373 PRO FORMA 13 1.89 331,959 Magyar Bancorp Inc. 10 2.14 375,708 Bessemer Group Inc. 9 2.54 446,480 Washington Mutual Inc. 8 6.87 1,208,072 Sovereign Bancorp Inc. 7 7.08 1,246,048 Commerce Bancorp Inc. 6 8.05 1,415,180 Provident Financial Svcs 5 9.17 1,613,260 Amboy Bancorporation 4 10.63 1,869,718 Bank of America Corp. 3 15.47 2,720,525 PNC Financial Services 2 16.80% $ 2,955,615 Wachovia Corp. 1 Market Share Deposits Institution Rank UNION COUNTY, NJ 100.00 $14,845,834 Total for Institutions in Market 0.84 123,999 New York Community 19 2.90 430,638 Synergy Financial Group 10 2.92 433,791 JPMorgan Chase & Co. 9 3.74 554,637 PRO FORMA 9 4.22 626,892 Center Bancorp Inc. 8 5.06 751,028 PNC Financial Services 7 5.70 845,616 Investors Bancorp Inc. 6 5.73 850,871 Union County Savings 5 6.17 915,445 Sovereign Bancorp Inc. 4 6.72 998,032 Commerce Bancorp Inc. 3 9.60 1,425,080 Bank of America Corp. 2 31.82% $ 4,723,323 Wachovia Corp. 1 Market Share Deposits Institution Rank MONMOUTH COUNTY, NJ 100.00 $13,957,635 Total for Institutions in Market 0.56 78,176 Synergy Financial Group 24 0.95 132,685 New York Community 20 1.51 210,861 PRO FORMA 16 2.63 367,065 Capital One Financial 10 2.70 376,830 Provident Financial Svcs 9 2.81 392,686 Central Jersey Bancorp 8 5.67 791,716 Hudson City Bancorp Inc. 7 6.65 927,945 Investors Bancorp Inc. 6 8.35 1,165,465 PNC Financial Services 5 9.69 1,351,873 Commerce Bancorp Inc. 4 10.56 1,474,342 Bank of America Corp. 3 13.48 1,881,780 Sovereign Bancorp Inc. 2 17.42% $ 2,431,876 Wachovia Corp. 1 Market Share Deposits Institution Rank The SYNF transaction will strengthen our market share in central New Jersey. |
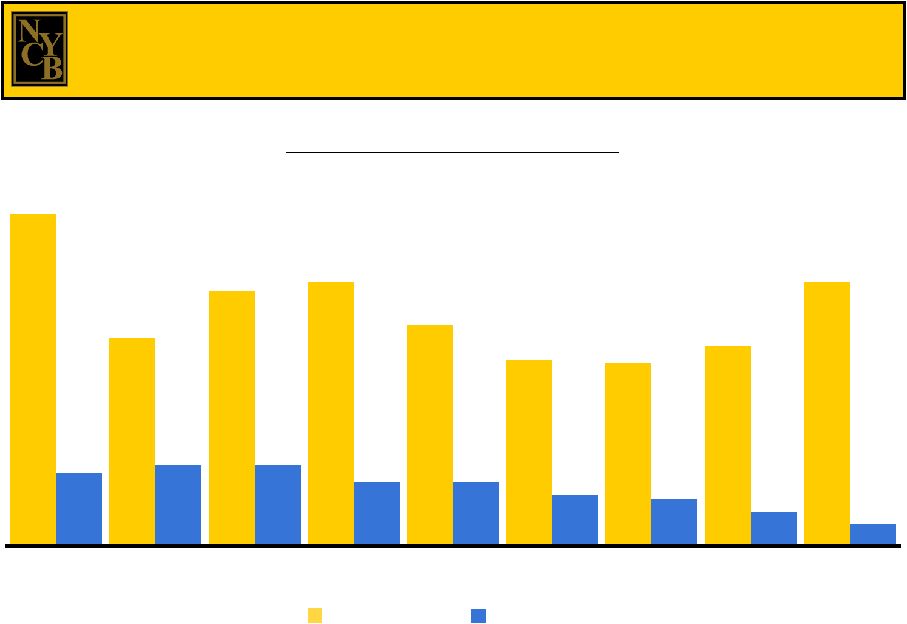
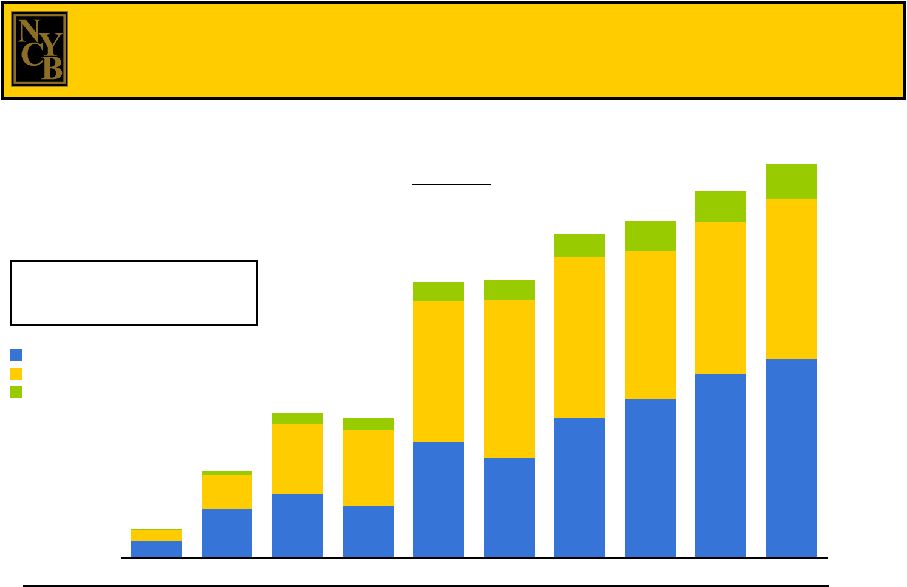 20 $658 $1,874 $2,408 $1,949 $4,362 $3,752 $5,247 $5,945 $6,881 $7,465 $378 $1,212 $2,588 $2,842 $5,247 $5,911 $6,012 $5,551 $5,699 $5,991 $720 $739 $846 $1,123 $1,189 $1,282 $465 $455 $171 $40 12/31/99 12/31/00 12/31/01 12/31/02 12/31/03 12/31/04 12/31/05 12/31/06 6/30/07 Pro Forma $3,257 $5,450 $5,256 $1,076 Total Deposits: $10,329 $10,402 $12,105 $12,619 Total deposits: 41.8% CAGR Core deposits: 46.4% CAGR Demand deposits: 58.8% CAGR CDs NOW, MMAs, and Savings Demand deposits (in millions) Deposits Each of our merger transactions has contributed to deposit growth. w/ HAVN w/ RCBK w/ RSLN w/ ABNY w/ LICB $13,769 w/ PFSB (a) Includes deposits of approximately $370 million acquired on 7/26/07 from Doral. (b) Includes deposits of approximately $599 million expected to be acquired in connection with our pending acquisition of SYNF. (c) Reflects data at 6/30/07. Pro Forma w/ Doral & SYNF (a)(b)(c) $14,738 |
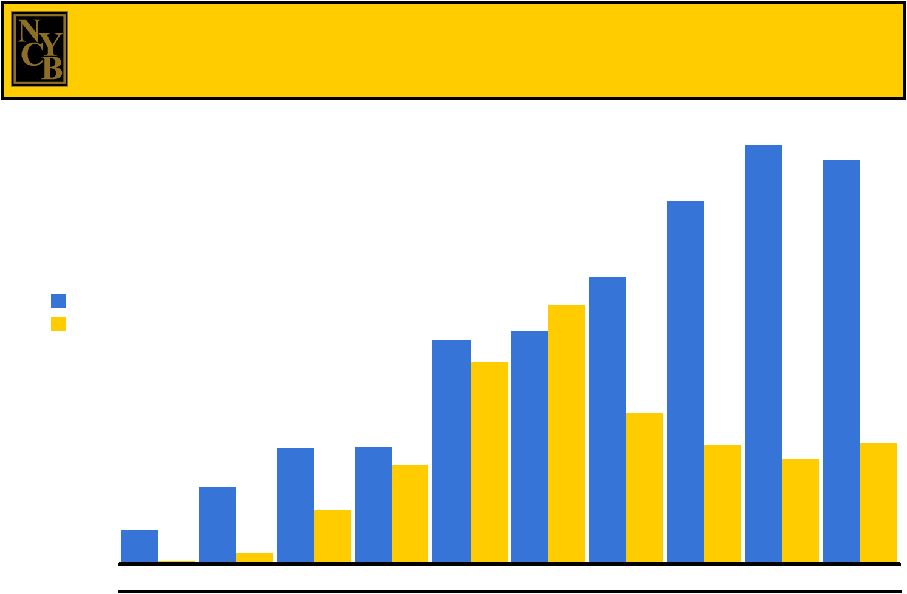
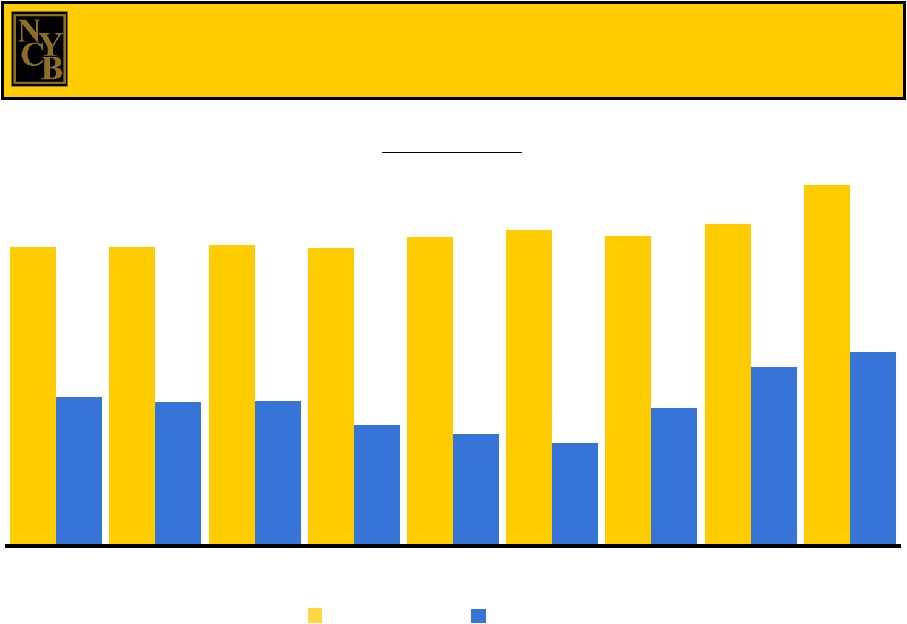
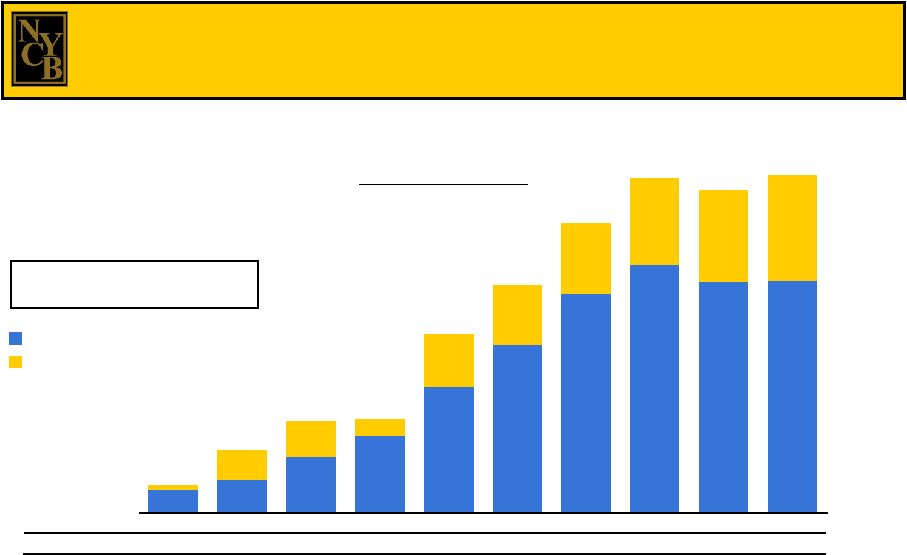 21 $1,348 $1,946 $3,255 $4,494 $7,368 $9,839 $12,854 $14,529 $13,539 $13,609 $1,690 $2,150 $995 $3,131 $3,557 $4,175 $5,124 $5,379 $6,245 $263 12/31/99 12/31/00 12/31/01 12/31/02 12/31/03 12/31/04 12/31/05 12/31/06 6/30/07 Pro Forma (in millions) Multi-family Loans Outstanding All Other Loans Outstanding (a) Includes loans of approximately $200 million (including multi-family loans of approximately $18 million) acquired from Doral. (b) Includes loans of approximately $736 million (including multi-family loans of approximately $52 million) expected to be acquired in connection with our pending acquisition of SYNF. (c) Reflects data at 6/30/07. $5,405 $5,489 $10,499 Loans Outstanding Multi-family loans: 36.1% CAGR Total loans: 39.8% CAGR $13,396 $17,029 $3,636 $1,611 $19,653 While acquisitions have contributed to the growth of our loan portfolio, the bulk of our loan growth has been organic. w/ HAVN w/ RCBK w/ RSLN w/ ABNY w/ LICB Total Loans: $18,918 $1,150 $2,560 $4,330 $6,041 $6,332 $616 $677 $4,971 Total Originations: Pro Forma w/ Doral & SYNF (a)(b)(c) w/ PFSB $19,854 $2,203 |
 22 Portfolio statistics at 6/30/07: - % of total loans = 71.6% - Average principal balance = $3.4 million - Average loan-to-value ratio = 63.2% - Expected weighted average life = 3.2 years Term: - Years 1-5: Fixed at 150 bp above the 5-year CMT - Years 6-10: Annually adjustable rate 250 bp above prime, or fixed rate 275 bp above the 5- year CMT plus 1 point Prepayment penalties: Range from 5 points to 1 point in years 1 thru 5; recorded as interest income Quality: No losses in our niche for more than 25 years Multi-family Loan Portfolio (in millions) Notwithstanding the Y-T-D shrinkage of our portfolio, multi- family loans have grown at a CAGR of 36.0% since 12/31/99. $1,348 $1,946 $3,255 $4,494 $7,368 $9,839 $12,854 $14,529 $13,539 12/31/99 12/31/00 12/31/01 12/31/02 12/31/03 12/31/04 12/31/05 12/31/06 6/30/07 |
 23 Our multi-family lending niche is profitable, efficient, and resilient. Niche: Primarily rent-controlled and -stabilized buildings in NYC Borrowers: Long-term property owners with a history of building cash flows, often on buildings that have been in their families for multiple generations Term: Years 1 – 5: Fixed at 150 bp above the 5-year CMT Years 6 – 10: Annually adjustable rate 250 bp above prime, or fixed rate 275 bp above the 5-year CMT plus 1 point Prepayment Range from 5 points to 1 point in years 1 through 5; recorded penalties: as interest income Efficiency: Less costly to originate and service than one-to-four family loans Quality: No losses in our niche for more than 25 years |
 24 We have maintained a record of solid asset quality. (a) SNL DataSource U.S. Thrifts (a) NYB Non-performing Assets / Total Assets 0.78% 0.49% 0.60% 0.62% 0.52% 0.44% 0.43% 0.47% 0.62% 0.17% 0.19% 0.19% 0.15% 0.15% 0.12% 0.11% 0.08% 0.05% 12/31/99 12/31/00 12/31/01 12/31/02 12/31/03 12/31/04 12/31/05 12/31/06 6/30/07 |
 25 The quality of our assets reflects our strong credit and underwriting standards. Conservative loan-to-value (“LTV”) ratios Minimum debt coverage ratio: 120% All loans approved by the Mortgage and Real Estate Committee or the Credit Committee (a majority of the Board of Directors) Director and executive officer inspect all properties over $3 million Board of Directors approves all loans over $10 million All properties appraised by independent appraisers All independent appraisals reviewed by in-house appraisal officers Multi-family and commercial real estate loans based on the lower of economic or market value Construction loans disbursed upon receipt of signed contract of sale |
 26 We continue to rank among the most efficient bank holding companies in the nation. (a) SNL DataSource (b) Operating efficiency ratio. Please see pages 32 and 33 for reconciliations of our GAAP and operating efficiency ratios. Efficiency Ratio U.S. Thrifts (a) NYB (b) 62.44% 62.54% 63.07% 62.40% 64.53% 66.03% 64.81% 67.45% 75.34% 31.16% 30.20% 30.50% 25.32% 23.59% 21.46% 28.86% 37.59% 40.60% 1999 2000 2001 2002 2003 2004 2005 2006 1H 2007 |
 27 Our efficiency has been driven by our approach to lending, product development, and branch expansion. Multi-family and commercial real estate lending are both broker-driven, without cost to the Company. One-to-four family loans are originated on a pass-through basis and sold shortly after closing, servicing-released, generating income for the Company. Products and services are frequently developed by third-party providers and the sale of these products generates additional revenues. 46 of our branches are located in-store. Franchise expansion has largely stemmed from mergers and acquisitions. |
 |
 29 Log onto our web site: www.myNYCB.com E-mail requests to: ir@myNYCB.com Call Investor Relations at: (516) 683-4420 Write to: New York Community Bancorp, Inc. 615 Merrick Avenue Westbury, NY 11590 8/9/2007 For More Information |
 30 Footnotes Page 4 (a) Includes assets of approximately $485 million that were acquired on 7/26/07 in our branch transaction with Doral Bank, FSB (“Doral”) and assets of approximately $932 million that are expected to be acquired in our pending acquisition of Synergy Financial Group, Inc. (“SYNF”). (b) Reflects data at 6/30/07. (c) SNL DataSource (d) Includes approximately $18 million of multi-family loans that were acquired on 7/26/07 in our branch transaction with Doral and approximately $52 million expected to be acquired in our pending acquisition of SYNF. (e) Includes deposits of approximately $370 million that were acquired on 7/26/07 in our branch transaction with Doral and approximately $599 million expected to be acquired in our pending acquisition of SYNF. Page 12 (a) Please see pages 34 and 35 for reconciliations of our GAAP and non-GAAP capital measures. (b) We acquired assets of approximately $485 million, total loans of approximately $200 million, multi-family loans of approximately $18 million, deposits of approximately $370 million, and core deposits of approximately $126 million in connection with our acquisition of 11 branches from Doral on 7/26/07. (c) Reflects data at 6/30/07. (d) We expect to acquire assets of approximately $932 million, total loans of approximately $736 million, multi-family loans of approximately $52 million, deposits of approximately $599 million, and core deposits of approximately $259 million in connection with our pending acquisition of SYNF. |
 31 Reconciliation of GAAP and Non-GAAP Measures The following table presents a reconciliation of the Company’s GAAP and operating earnings for the three months ended June 30 and March 31, 2007. For the Three Months Ended $0.22 $ 0.12 Diluted GAAP Earnings per Share Adjustments to diluted GAAP earnings per share: -- (0.02) Net securities gains -- 0.12 Loss on other-than-temporary impairment of securities -- -- Loss on debt redemption -- 0.01 Prepayment of borrowings $0.22 $ 0.23 Diluted operating earnings per share -- (9,195) Net securities gains -- 56,958 Loss on other-than-temporary impairment of securities $64,819 -- -- -- $64,819 March 31, 2007 $ 71,820 (16,955) 3,190 1,848 $ 35,974 June 30, 2007 Adjustments to GAAP earnings: Operating earnings Prepayment of borrowings Income tax effect on adjustments Loss on debt redemption GAAP Earnings (in thousands, except per share data) |
 32 Reconciliation of GAAP and Non-GAAP Measures The following table presents reconciliations of the Company’s GAAP and operating efficiency ratios for the years ended December 31, 1999, 2000, 2001, 2003, 2004, 2005, and 2006. For the year ended December 31, 2002, the Company’s GAAP and operating efficiency ratios were the same. -- -- (24,800) -- (22,800) -- (20,423) -- -- -- (36,588) -- (5,744) -- Merger-related charge (735) -- -- -- -- -- -- -- -- -- -- -- (3,072) -- Retirement charge -- -- -- -- -- -- -- -- -- -- -- -- 6,071 -- swaps Loss on mark-to-market of interest rate -- -- -- -- -- -- -- -- -- -- -- -- 1,859 -- Loss on debt redemption For the Years Ended December 31, 1999 2000 2001 2003 2004 2005 2006 -- -- -- -- -- -- -- -- 157,215 -- -- -- -- -- Balance sheet repositioning charge 37.59% $247,546 -- $256,362 $658,486 -- -- $650,556 Operating 39.41% $256,362 -- $256,362 $650,556 -- -- $650,556 GAAP Adjustment: Adjustments: 38.04% $112,757 -- $112,757 $296,431 -- -- $296,431 GAAP 30.50% $ 89,957 -- $112,757 $294,931 (1,500) -- $296,431 Operating 30.20% $ 24,530 -- $ 49,330 $ 81,226 (13,500) -- $ 94,726 Operating 52.08% $49,330 -- $49,330 $94,726 -- -- $94,726 GAAP 21.46% $193,632 -- $193,632 $902,464 -- 8,209 $737,040 Operating 31.16% 29.95% 23.59% 25.32% 26.27% 28.86% 34.14% Efficiency ratio $22,255 $21,390 $148,950 $169,373 $193,632 $200,033 $236,621 Adjusted operating expenses 1,600 -- -- -- -- -- -- Curtailment gain $21,390 $21,390 $169,373 $169,373 $193,632 $236,621 $236,621 Operating expenses $71,426 $71,426 $631,349 $668,962 $737,040 $693,068 $693,068 non-interest income -- -- (37,613) -- -- -- -- Gain on sale of branches Adjusted total net interest income and -- -- -- -- -- -- -- impairment Loss on other-than-temporary $71,426 $71,426 $668,962 $668,962 $737,040 $693,068 $693,068 Total net interest income and non-interest income Operating GAAP Operating GAAP GAAP Operating GAAP (dollars in thousands) |
 33 Reconciliation of GAAP and Non-GAAP Measures The following table presents a reconciliation of the Company’s GAAP and operating efficiency ratios for the three and six months ended June 30, 2007. For the Six Months Ended June 30, 2007 For the Three Months Ended June 30, 2007 40.48% $75,595 $186,764 (9,195) 1,848 56,958 $137,153 Operating 55.12% $75,595 $137,153 -- -- -- $137,153 GAAP $144,940 $144,940 Operating expenses 56,958 -- Loss on other-than-temporary impairment of securities 1,848 -- Loss on debt redemption Adjustments: 40.60% 47.15% Efficiency ratio $357,033 $307,422 Adjusted total net interest income and non-interest income (9,195) -- Net securities gains $307,422 $307,422 Total net interest income and non-interest income Operating GAAP (dollars in thousands) |
 34 Reconciliation of GAAP and Non-GAAP Capital Measures The following table presents reconciliations of the Company’s stockholders’ equity, tangible stockholders’ equity, and adjusted tangible stockholders’ equity; total assets, tangible assets, and adjusted tangible assets; and the related capital measures at December 31, 1999, 2000, 2001, 2002, 2003, 2004, 2005, and 2006: December 31, 1999 2000 2001 2002 2003 2004 2005 2006 (dollars in thousands) -- -- (57,500) (51,500) (98,993) (87,553) (86,533) (106,381) Core deposit intangibles 7.19% 4.11% 3.60% 5.78% 4.13% 5.39% 5.41% 5.66% Adjusted tangible stockholders’ equity to adjusted tangible assets $1,906,835 $4,591,895 $8,526,767 $10,602,222 $21,458,631 $22,039,532 $24,272,340 $26,280,006 Adjusted tangible assets -- (820) (3,715) (34,852) 34,640 40,697 55,857 52,125 Add back: Net unrealized losses (gains) on securities $1,906,835 $4,592,715 $8,530,482 $10,637,074 $21,423,991 $21,998,835 $24,216,483 $26,227,881 Tangible assets $137,141 $188,520 $307,266 $612,642 $885,951 $1,188,120 $1,313,512 $1,487,473 Adjusted tangible stockholders’ equity -- (820) (3,715) (34,852) 34,640 40,697 55,857 52,125 Add back: Net unrealized losses (gains) on securities $137,141 $189,340 $310,981 $647,494 $851,311 $1,147,423 $1,257,655 $1,435,348 Tangible stockholders’ equity 7.19% 4.12% 3.65% 6.09% 3.97% 5.22% 5.19% 5.47% Tangible stockholders’ equity to tangible assets 7.19% 6.53% 10.68% 11.70% 12.24% 13.26% 12.65% 12.95% Stockholders’ equity to total assets $1,906,835 $4,592,715 $8,530,482 $10,637,074 $21,423,991 $21,998,835 $24,216,483 $26,227,881 Tangible assets -- (118,070) (614,653) (624,518) (1,918,353) (1,951,438) (1,980,689) (2,148,108) Less: Goodwill $1,906,835 $4,710,785 $9,202,635 $11,313,092 $23,441,337 $24,037,826 $26,283,705 $28,482,370 Total assets $137,141 $ 189,340 $ 310,981 $ 647,494 $ 851,311 $ 1,147,423 $ 1,257,655 $ 1,435,348 Tangible stockholders’ equity -- -- (57,500) (51,500) (98,993) (87,553) (86,533) (106,381) Core deposit intangibles -- (118,070) (614,653) (624,518) (1,918,353) (1,951,438) (1,980,689) (2,148,108) Less: Goodwill $137,141 $ 307,410 $ 983,134 $1,323,512 $ 2,868,657 $ 3,186,414 $ 3,324,877 $ 3,689,837 Total stockholders’ equity |
 35 Reconciliation of GAAP and Non-GAAP Capital Measures The following table presents a reconciliation of the Company’s stockholders’ equity, tangible stockholders’ equity, and adjusted tangible stockholders’ equity; total assets, tangible assets, and adjusted tangible assets; and the related capital measures at June 30, 2006 and 2007: -- 38,668 Add back: Loss on other-than-temporary impairment of securities -- 38,668 Add back: Loss on other-than-temporary impairment of securities For the Six Months Ended 5.80% $27,241,429 25,872 $27,176,889 $1,579,150 25,872 $1,514,610 5.57% 13.37% $27,176,889 (116,157) (2,330,704) $29,623,750 $ 1,514,610 (116,157) (2,330,704) $ 3,961,471 June 30, 2007 June 30, 2006 (dollars in thousands) (116,478) Core deposit intangibles 5.69% Adjusted tangible stockholders’ equity to adjusted tangible assets $26,541,141 Adjusted tangible assets 78,619 Net unrealized losses on securities $26,462,522 Tangible assets $1,509,487 Adjusted tangible stockholders’ equity 78,619 Net unrealized losses on securities $1,430,868 Tangible stockholders’ equity 5.41% Tangible stockholders’ equity to tangible assets 12.87% Stockholders’ equity to total assets $26,462,522 Tangible assets (2,149,824) Less: Goodwill $28,728,824 Total assets $ 1,430,868 Tangible stockholders’ equity (116,478) Core deposit intangibles (2,149,824) Less: Goodwill $ 3,697,170 Total stockholders’ equity |