 Fourth Quarter 2009 Investor Presentation Exhibit 99.1 |
 New York Community Bancorp, Inc. Page 2 Forward-looking Statements and Associated Risk Factors This presentation, like many written and oral communications presented by New York Community Bancorp, Inc. and our authorized officers, may contain certain forward-looking statements regarding our prospective performance and strategies within the meaning of Section 27A of the Securities Act of 1933, as amended, and Section 21E of the Securities Exchange Act of 1934, as amended. We intend such forward-looking statements to be covered by the safe harbor provisions for forward-looking statements contained in the Private Securities Litigation Reform Act of 1995, and are including this statement for purposes of said safe harbor provisions. Forward-looking statements, which are based on certain assumptions and describe future plans, strategies, and expectations of the Company, are generally identified by use of the words “anticipate,” “believe,” “estimate,” “expect,” “intend,” “plan,” “project,” “seek,” “strive,” “try,” or future or conditional verbs such as “will,” “would,” “should,” “could,” “may,” or similar expressions. Our ability to predict results or the actual effects of our plans or strategies is inherently uncertain. Accordingly, actual results may differ materially from anticipated results. There are a number of factors, many of which are beyond our control, that could cause actual conditions, events, or results to differ significantly from those described in the forward- looking statements. These factors include, but are not limited to: general economic conditions, either nationally or in some or all of the areas in which we and our customers conduct our respective businesses; conditions in the securities markets and real estate markets or the banking industry; changes in interest rates, which may affect our net income, prepayment penalty income, and other future cash flows, or the market value of our assets, including our investment securities; changes in deposit flows and wholesale borrowing facilities; changes in the demand for deposit, loan, and investment products and other financial services in the markets we serve; changes in our credit ratings or in our ability to access the capital markets; changes in our customer base or in the financial or operating performances of our customers’ businesses; changes in real estate values, which could impact the quality of the assets securing the loans in our portfolio; changes in the quality or composition of our loan or securities portfolios; changes in competitive pressures among financial institutions or from non-financial institutions; the ability to successfully integrate any assets, liabilities, customers, systems and management personnel we may acquire, including those acquired in the AmTrust transaction, into our operations and our ability to realize related revenue synergies and cost savings within expected time frames; our ability to retain key members of management; our timely development of new lines of business and competitive products or services in a changing environment, and the acceptance of such products or services by our customers; any interruption or breach of security resulting in failures or disruptions in customer account management, general ledger, deposit, loan or other systems; any interruption in customer service due to circumstances beyond our control; potential exposure to unknown or contingent liabilities of companies we have acquired or target for acquisition, including those of AmTrust; the outcome of pending or threatened litigation, or of other matters before regulatory agencies, whether currently existing or commencing in the future; environmental conditions that exist or may exist on properties owned by, leased by, or mortgaged to the Company; operational issues stemming from, and/or capital spending necessitated by, the potential need to adapt to industry changes in information technology systems, on which we are highly dependent; changes in our estimates of future reserves based upon the periodic review thereof under relevant regulatory and accounting requirements; changes in our capital management policies, including those regarding business combinations, dividends, and share repurchases, among others; changes in legislation, regulation, policies, or administrative practices, whether by judicial, governmental, or legislative action, including, but not limited to, those pertaining to banking, securities, taxation, rent regulation and housing, environmental protection, and insurance, and the ability to comply with such changes in a timely manner; additional FDIC special assessments or required assessment prepayments; changes in accounting principles, policies, practices, or guidelines; the ability to keep pace with, and implement on a timely basis, technological changes; changes in the monetary and fiscal policies of the U.S. Government, including policies of the U.S. Department of the Treasury and the Board of Governors of the Federal Reserve System; war or terrorist activities; and other economic, competitive, governmental, regulatory and geopolitical factors affecting our operations, pricing, and services. For a discussion of these and other risks that may cause actual results to differ from expectations, please refer to our Annual Report on Form 10-K for the year ended December 31, 2008, including the section entitled “Risk Factors,” and our Quarterly Reports on Form 10-Q for the quarters ended September 30, 2009, June 30, 2009, and March 31, 2009, on file with the U.S. Securities and Exchange Commission (the “SEC”). In addition, it should be noted that we routinely evaluate opportunities to expand through acquisition and frequently conduct due diligence activities in connection with such opportunities. As a result, acquisition discussions and, in some cases, negotiations, may take place at any time, and acquisitions involving cash, debt, or equity securities may occur. Furthermore, the timing and occurrence or non-occurrence of events may be subject to circumstances beyond our control. Readers are cautioned not to place undue reliance on the forward-looking statements contained herein, which speak only as of the date of this presentation. Except as required by applicable law or regulation, we undertake no obligation to update these forward-looking statements to reflect events or circumstances that occur after the date on which such statements were made. Safe Harbor Provisions of the Private Securities Litigation Reform Act of 1995 |
 New York Community Bancorp, Inc. Page 3 We rank among the nation’s leading financial institutions. (a) SNL Financial as of 1/29/10. With assets of $42.2 billion at 12/31/09, we are the 22nd largest bank holding company in the nation. (a) With deposits of $22.3 billion at 12/31/09, we rank 24th among the nation’s largest depositories. (a) We rank among the top three thrift depositories in nine attractive markets. (a) With a portfolio of $16.7 billion at the end of December, we are a leading producer of multi-family loans in New York City. (a) With a market cap of $6.5 billion at January 29, 2010, we rank 17th among the nation’s publicly traded banks and thrifts. (a) |
 New York Community Bancorp, Inc. Page 4 We have a consistent business model that focuses on building value while building the Company. (a) SNL Financial as of 1/29/10 (b) Please see page 40 for a reconciliation of our GAAP and operating efficiency ratios. $25.9 billion of multi-family loans originated since 2000, including $1.9 billion in 2009. Strong Credit Standards/ Superior Asset Quality Net charge-offs represented 0.13% of average loans in 2009, as compared to 2.86% for the SNL Bank and Thrift Index. (a) Efficient Operation Our operating efficiency ratio has historically ranked in the top 5% of all banks and thrifts and was 36.16% in 2009. (a)(b) Growth through Acquisitions We completed nine acquisitions from 2000 to 2009, including our FDIC-assisted acquisition of $11.0 billion in assets and $8.2 billion in deposits of AmTrust Bank on December 4th. Multi -family Lending Our total return to shareholders increased at a CAGR of 33.5% from 11/23/93 to 1/29/10. |
 4th Quarter 2009 Performance Highlights |
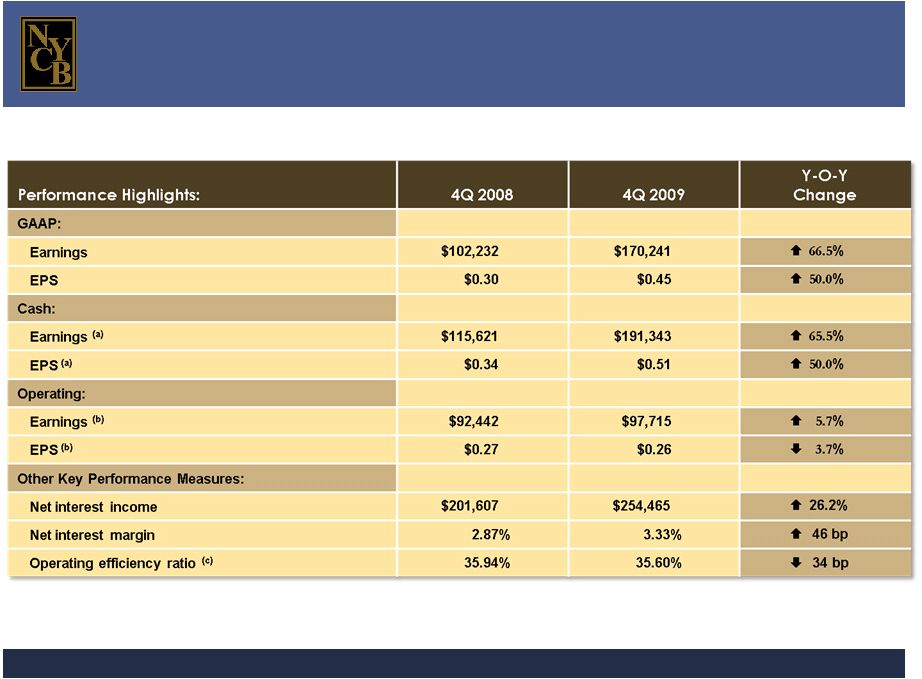 New York Community Bancorp, Inc. Page 6 Our 4Q 2009 performance reflects the benefit of the AmTrust transaction. (dollars in thousands, except per share data) (a) Please see page 45 for a reconciliation of our GAAP and cash earnings. (b) Please see page 44 for a reconciliation of our GAAP and operating earnings. (c) Please see page 40 for a reconciliation of our GAAP and operating efficiency ratios. |
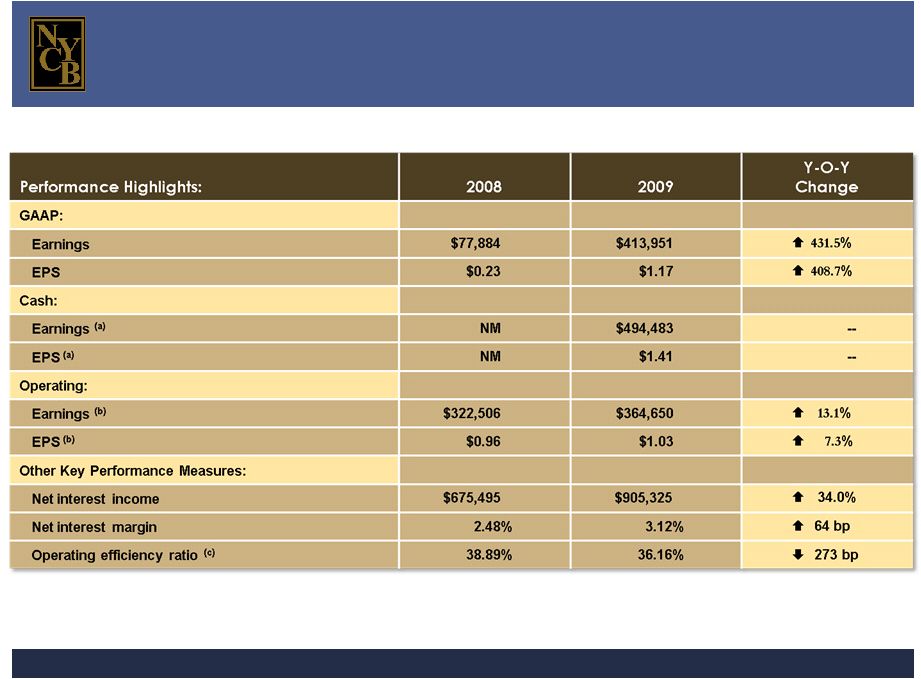 New York Community Bancorp, Inc. Page 7 (dollars in thousands, except per share data) (a) Please see page 45 for a reconciliation of our GAAP and cash earnings. (b) Please see page 44 for a reconciliation of our GAAP and operating earnings. (c) Please see pages 40 and 41 for a reconciliation of our GAAP and operating efficiency ratios. Our 2009 performance was highlighted by significant margin expansion, operating efficiency, and earnings growth. |
 New York Community Bancorp, Inc. Page 8 Our asset quality measures continued to compare favorably with those of our industry as a whole. (a) SNL Financial as of 1/29/10 (b) Non-performing loans are defined as non-accrual loans and loans 90 days or more past due but still accruing interest. |
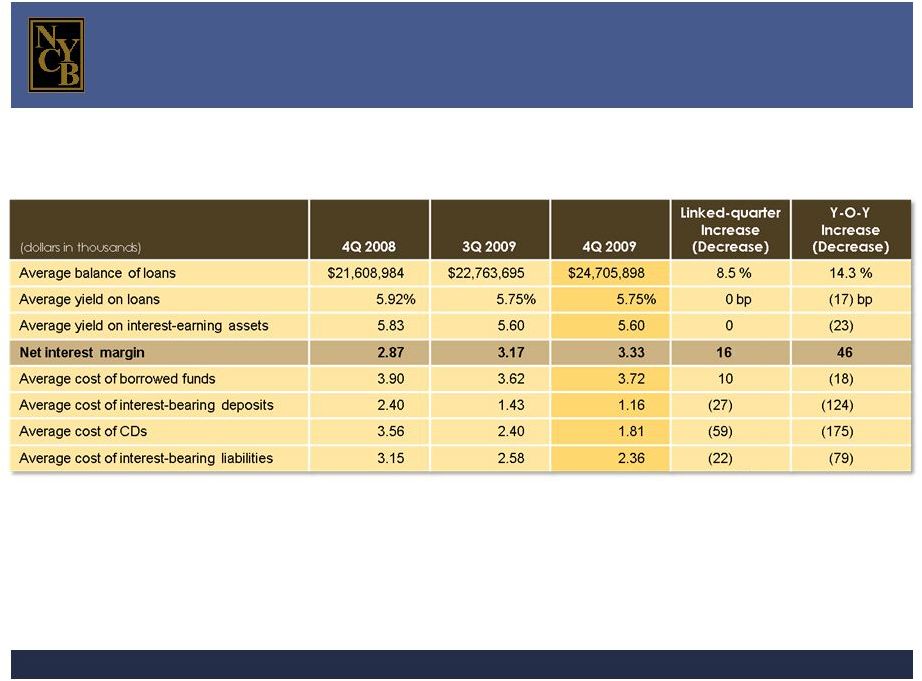 New York Community Bancorp, Inc. Page 9 The expansion of our net interest margin has been driven by a reduction in our funding costs. |
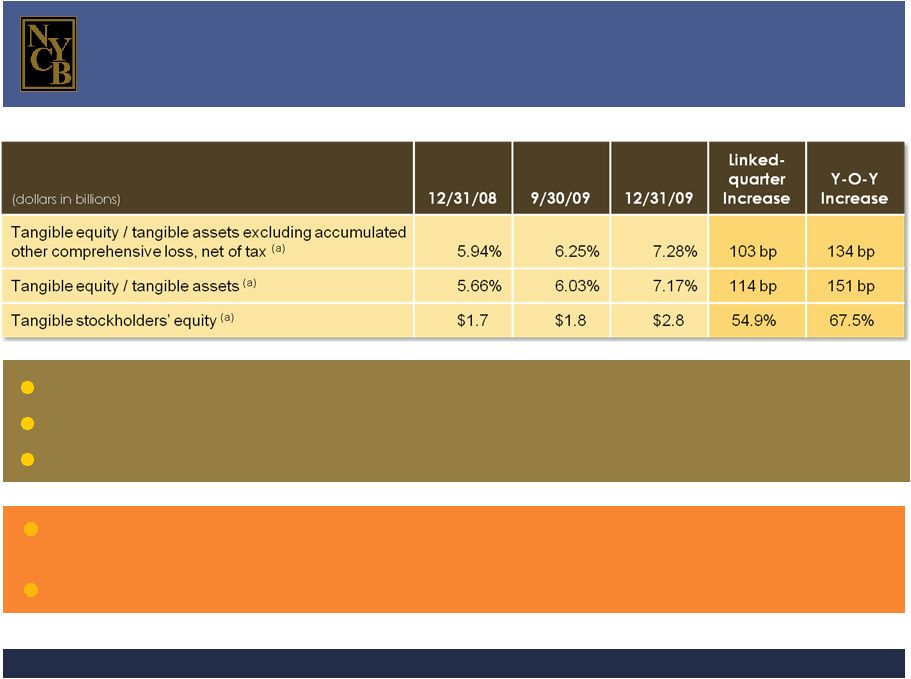 New York Community Bancorp, Inc. Page 10 In 2009, our capital measures were strengthened by our capital management strategies. $864.9 million generated through successful common stock offering in December. $147.3 million generated in 2009 through sale of shares through our DRP. $39.1 million generated in August through the exchange of BONUSES units for common shares. Our dividend has been a significant component of our total return to shareholders since our first year of public life. In January 2010, we declared our 24th consecutive quarterly cash dividend of $0.25 per share. (a) Please see page 42 for a reconciliation of our GAAP and non-GAAP capital measures. |
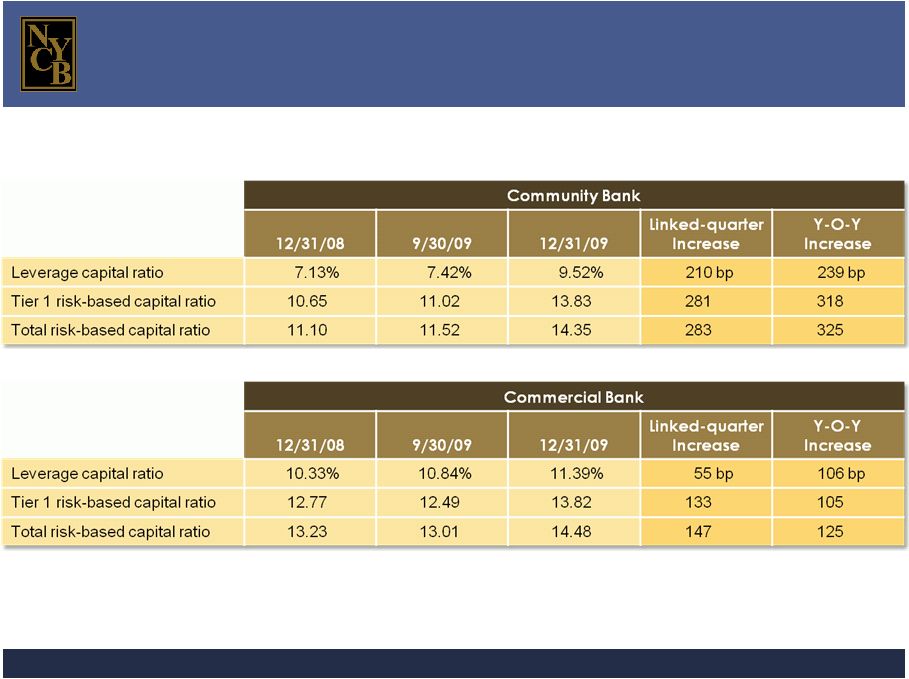 New York Community Bancorp, Inc. Page 11 Both of our bank subsidiaries are well capitalized institutions. |
 Our Business Model: Growth through Acquisitions |
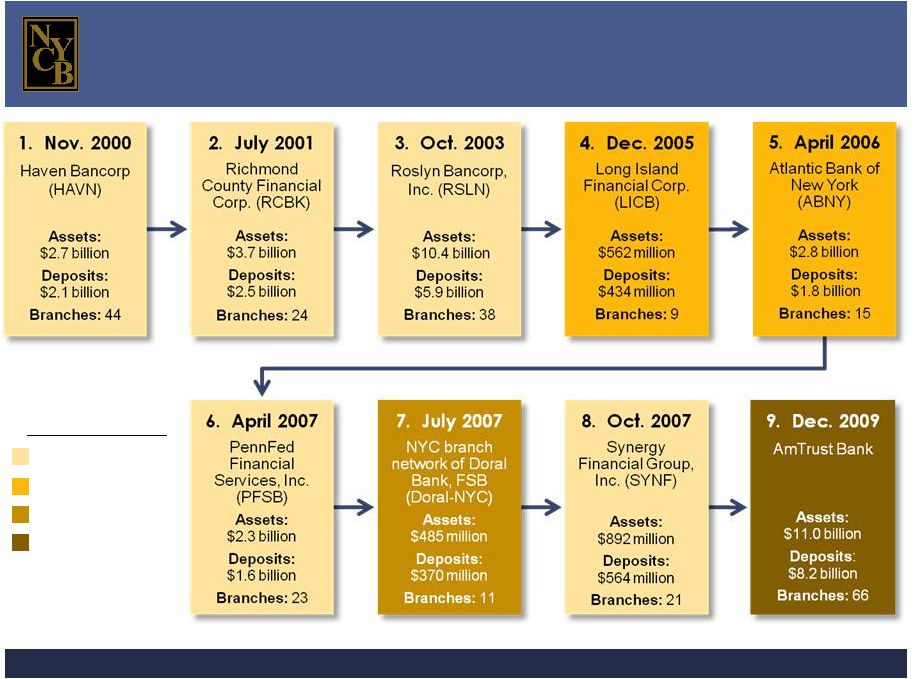 New York Community Bancorp, Inc. Page 13 We have completed nine acquisitions since 2000. Transaction Type Savings Bank Commercial Bank Branch FDIC-assisted Note: The number of branches shown reflects the number of branches in our franchise that stemmed from each transaction. |
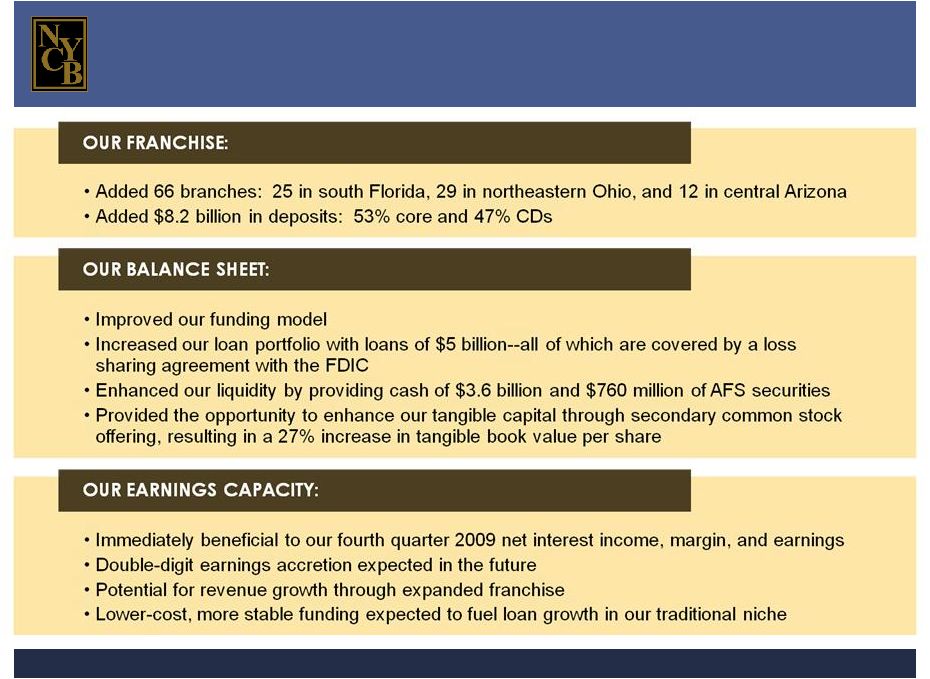 New York Community Bancorp, Inc. Page 14 The AmTrust transaction enhanced our franchise, our balance sheet, and our earnings capacity. |
 New York Community Bancorp, Inc. Page 15 The AmTrust transaction enhanced several balance sheet measures. (a) Please see page 42 for a reconciliation of our GAAP and non-GAAP capital measures. |
 New York Community Bancorp, Inc. Page 16 The AmTrust transaction reinforced our position as a leading financial institution. (in thousands) DEPOSITS Rank Company Total Deposits 1 Bank of America Corporation $991,611,000 2 JPMorgan Chase & Co. 938,367,000 3 Citigroup Inc. 835,903,000 4 Wells Fargo & Company 824,018,000 5 PNC Financial Services Group, Inc. 186,922,000 6 U.S. Bancorp 183,242,000 7 Bank of New York Mellon Corp. 135,050,000 8 SunTrust Banks, Inc. 121,863,566 9 Capital One Financial Corporation 115,809,096 10 BB&T Corporation 114,965,000 11 Regions Financial Corporation 98,680,000 12 State Street Corporation 90,062,000 13 Fifth Third Bancorp 84,305,000 14 KeyCorp 65,571,000 15 Northern Trust Corporation 58,281,300 16 M&T Bank Corporation 47,449,838 17 Zions Bancorporation 41,840,589 18 Marshall & Ilsley Corporation 41,638,000 19 Huntington Bancshares Inc. 40,493,927 20 Comerica Incorporated 39,665,000 21 Synovus Financial Corp. 27,433,534 22 Popular, Inc. 25,925,000 23 Hudson City Bancorp, Inc. 24,578,048 24 New York Community Bancorp, Inc. 22,316,411 25 First Horizon National Corporation 14,867,215 ASSETS Rank Company Total Assets 1 Bank of America Corporation $2,223,299,000 2 JPMorgan Chase & Co. 2,031,989,000 3 Citigroup Inc. 1,856,164,000 4 Wells Fargo & Company 1,243,646,000 5 U.S. Bancorp 281,176,000 6 PNC Financial Services Group, Inc. 269,863,000 7 Bank of New York Mellon Corp. 212,224,000 8 SunTrust Banks, Inc. 174,164,735 9 Capital One Financial Corporation 169,400,094 10 BB&T Corporation 165,764,000 11 State Street Corporation 157,946,000 12 Regions Financial Corporation 142,318,000 13 Fifth Third Bancorp 113,380,000 14 KeyCorp 93,287,000 15 Northern Trust Corporation 82,141,500 16 M&T Bank Corporation 68,880,399 17 Hudson City Bancorp, Inc. 60,267,760 18 Comerica Incorporated 59,263,000 19 Marshall & Ilsley Corporation 57,210,000 20 Huntington Bancshares Inc. 51,554,665 21 Zions Bancorporation 51,123,007 22 New York Community Bancorp, Inc. 42,169,174 23 Popular, Inc. 34,736,000 24 Synovus Financial Corp. 32,850,071 25 First Horizon National Corporation 26,068,678 Source: SNL Financial. Financial information as of 12/31/09. Market data as of 1/29/10. MARKET CAPITALIZATION Rank Company Market Cap 1 JPMorgan Chase & Co. 153,501.5 2 Wells Fargo & Company 147,228.3 3 Bank of America Corporation 131,449.2 4 Citigroup Inc. 94,564.6 5 U.S. Bancorp 47,978.0 6 Bank of New York Mellon Corporation 35,135.9 7 PNC Financial Services Group, Inc. 25,608.7 8 State Street Corporation 21,222.8 9 BB&T Corporation 19,223.3 10 Capital One Financial Corporation 16,601.7 11 Northern Trust Corporation 12,209.7 12 SunTrust Banks, Inc. 12,144.5 13 Fifth Third Bancorp 9,890.7 14 M&T Bank Corporation 8,724.5 15 Regions Financial Corporation 7,575.6 16 Hudson City Bancorp, Inc. 6,986.6 17 New York Community Bancorp, Inc. 6,511.0 18 KeyCorp 6,307.9 19 People's United Financial, Inc. 5,631.2 20 Comerica Incorporated 5,217.2 21 TFS Financial Corporation (MHC) 3,964.9 22 Marshall & Ilsley Corporation 3,630.5 23 Huntington Bancshares Incorporated 3,428.5 24 Commerce Bancshares, Inc. 3,285.5 25 BOK Financial Corporation 3,214.5 |
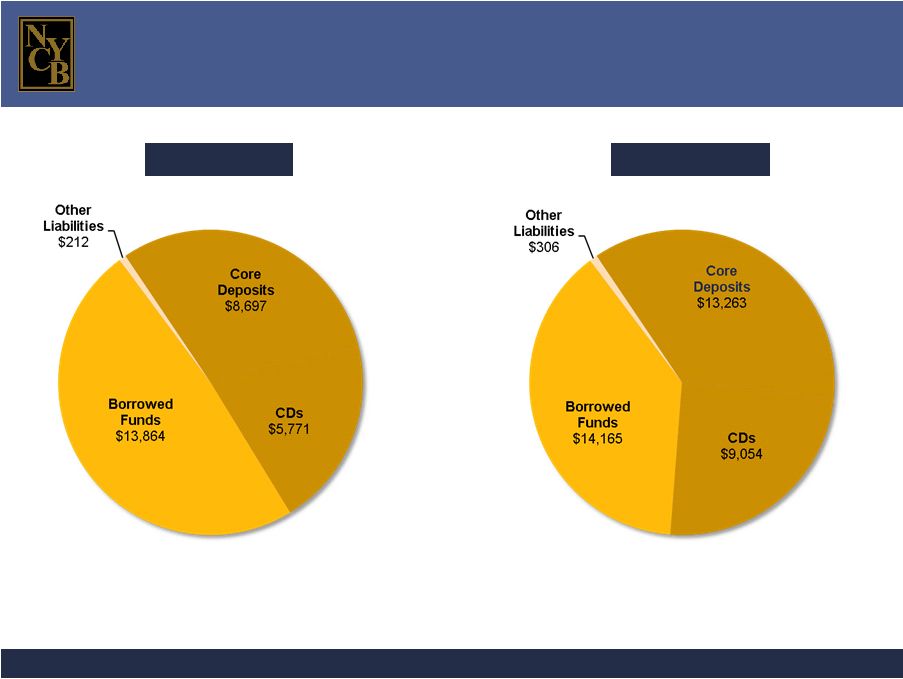 New York Community Bancorp, Inc. Page 17 The transaction has improved our funding model. Total liabilities: $28.5 billion Total liabilities: $36.8 billion 9/30/09 12/31/09 (in millions) Total Deposits $14,468 Total Deposits $22,316 Deposits / Assets: 44.0% Deposits / Assets: 52.9% |
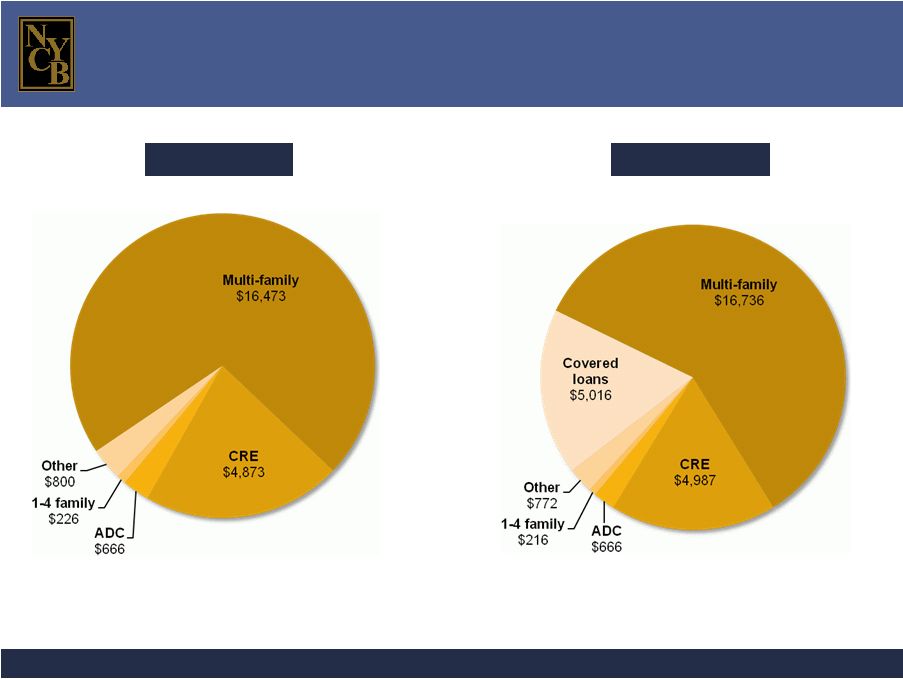 New York Community Bancorp, Inc. Page 18 Multi-family loans continue to be our principal asset. Total loans: $23.0 billion 9/30/09 12/31/09 Total loans: $28.3 billion (in millions) Covered loans/Total loans: 17.7% Covered loans/Total loans: NA |
 New York Community Bancorp, Inc. Page 19 The expansion of our franchise has enabled us to compete very effectively in the Metro New York market. (dollars in thousands) Source: SNL Financial SUFFOLK COUNTY, NY Rank Institution Deposits Market Share 1 JPMorgan Chase & Co $ 7,809,664 22.13% 2 Capital One Financial Corp. 5,600,937 15.87 3 Astoria Financial Corp. 3,139,029 8.89 4 Citigroup Inc. 2,976,427 8.43 5 HSBC Holdings plc 2,537,513 7.19 6 Bank of America Corp. 2,335,201 6.62 7 NYB 1,654,648 4.69 8 Toronto-Dominion Bank 1,570,122 4.45 9 Smithtown Bancorp 1,504,430 4.26 10 Suffolk Bancorp 1,432,327 4.06 Total for Institutions in Market $35,293,215 100.00% ESSEX COUNTY, NJ Rank Institution Deposits Market Share 1 Wells Fargo & Co. $ 2,486,983 12.50% 2 NYB 2,356,215 11.84 3 Citigroup Inc. 1,842,398 9.26 4 Bank of America Corp. 1,394,025 7.00 5 Hudson City Bancorp Inc. 1,387,794 6.97 6 JPMorgan Chase & Co 1,342,918 6.75 7 PNC Financial 1,333,746 6.70 8 Investors Bancorp Inc. 1,306,328 6.56 9 Valley National Bancorp 1,300,911 6.54 10 Banco Santander S.A. 1,260,423 6.33 Total for Institutions in Market $19,900,587 100.00% NASSAU COUNTY, NY Rank Institution Deposits Market Share 1 JPMorgan Chase & Co. $11,207,747 20.64% 2 Citigroup Inc. 7,846,371 14.45 3 Capital One Financial Corp. 6,381,757 11.75 4 Astoria Financial Corp. 5,395,561 9.94 5 NYB 4,355,408 8.02 6 Bank of America Corp. 3,452,847 6.36 7 Toronto-Dominion Bank 3,202,765 5.90 8 HSBC Holdings plc 2,029,364 3.74 9 Flushing Financial Corp. 1,476,584 2.72 10 Signature Bank 1,302,498 2.40 Total for Institutions in Market $54,303,098 100.00% QUEENS COUNTY, NY Rank Institution Deposits Market Share 1 JPMorgan Chase & Co. $ 8,087,934 19.56% 2 Citigroup Inc. 5,962,280 14.42 3 Capital One Financial Corp. 4,695,834 11.36 4 Astoria Financial Corp. 3,102,693 7.51 5 HSBC Holdings plc 2,816,995 6.81 6 NYB 2,610,122 6.31 7 Ridgewood Savings Bank 1,636,138 3.96 8 Toronto-Dominion Bank 1,447,927 3.50 9 Flushing Financial Corp. 1,228,225 2.97 10 Banco Santander S.A. 989,322 2.39 Total for Institutions in Market $41,339,284 100.00% RICHMOND COUNTY, NY Rank Institution Deposits Market Share 1 Banco Santander S.A. $2,283,684 24.29% 2 JPMorgan Chase & Co. 1,610,747 17.13 3 NYB 1,468,053 15.61 4 Citigroup Inc. 1,096,514 11.66 5 Northfield Bancorp Inc. 831,606 8.84 6 Toronto-Dominion Bank 608,588 6.47 7 Hudson City Bancorp Inc. 543,868 5.78 8 HSBC Holdings plc 273,126 2.90 9 VSB Bancorp Inc. 200,832 2.14 10 Capital One Financial Corp. 178,904 1.90 Total for Institutions in Market $9,403,629 100.00% |
 New York Community Bancorp, Inc. Page 20 BROWARD, FL Rank Institution Deposits Market Share 1 Bank of America Corp. $ 9,235,515 24.93% 2 Wells Fargo & Co. 6,975,220 18.83 3 SunTrust Banks Inc. 2,598,653 7.02 4 BU Financial Corp. 2,029,268 5.48 5 NYB 1,922,124 5.19 6 JPMorgan Chase & Co. 1,770,043 4.78 7 BankAtlantic Bancorp Inc. 1,759,729 4.75 8 Citigroup Inc. 1,423,041 3.84 9 BB&T Corp. 1,160,341 3.13 10 Regions Financial Corp. 978,090 2.64 Total for Institutions in Market $37,039,343 100.00% MARICOPA COUNTY, AZ Rank Institution Deposits Market Share 1 JPMorgan Chase & Co. $14,124,871 24.22% 2 Wells Fargo & Co. 13,323,033 22.85 3 Bank of America Corp. 12,180,933 20.89 4 Marshall & Ilsley Corp. 2,230,749 3.83 5 Omaha Financial Holdings 1,741,487 2.99 6 Banco Bilbao Vizcaya Arg. 1,473,952 2.53 7 Marquette Financial Cos. 1,452,131 2.49 8 Zions Bancorp 1,435,625 2.46 9 NYB 1,317,025 2.26 10 Northern Trust Corp. 803,700 1.38 Total for Institutions in Market $58,312,638 100.00% The AmTrust transaction provided us with a strong presence in Florida, Ohio, and Arizona. CUYAHOGA, OH Rank Institution Deposits Market Share 1 PNC Financial Services $18,962,110 35.31% 2 KeyCorp 11,434,189 21.29 3 TFS Financial Corp. 4,974,609 9.26 4 Royal Bank of Scotland 4,361,698 8.12 5 Huntington Bancshares 2,686,757 5.00 6 NYB 2,665,503 4.96 7 Fifth Third Bancorp 2,342,482 4.36 8 US Bancorp 1,302,922 2.43 9 Dollar Bank FSB 1,195,648 2.23 10 JPMorgan Chase & Co. 1,037,233 1.93 Total for Institutions in Market $53,700,926 100.00% PALM BEACH, FL Rank Institution Deposits Market Share 1 Wells Fargo & Co. $ 8,992,265 23.10% 2 Bank of America Corp. 5,838,329 15.00 3 PNC Financial 3,039,897 7.81 4 JPMorgan Chase & Co. 2,395,518 6.15 5 NYB 2,214,806 5.69 6 SunTrust Banks Inc. 2,014,685 5.18 7 BU Financial Corp. 1,890,436 4.86 8 Lydian Trust Company 1,237,347 3.18 9 Citigroup Inc. 1,177,343 3.02 10 BB&T Corp. 993,852 2.55 Total for Institutions in Market $38,922,697 100.00% (dollars in thousands) Source: SNL Financial |
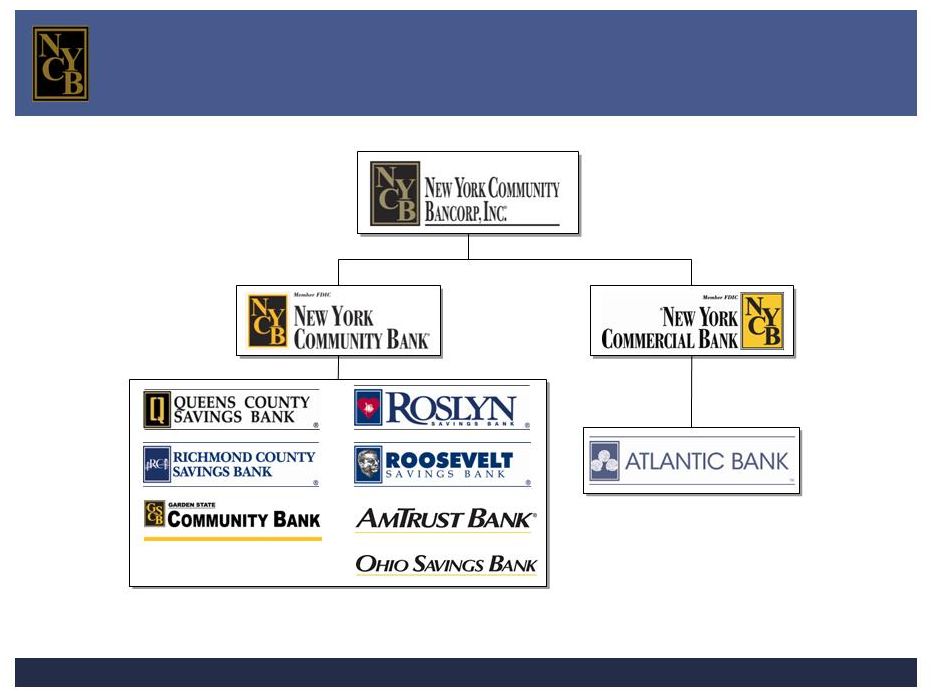 New York Community Bancorp, Inc. Page 21 We now operate our branches through two subsidiary banks and eight local divisions. Community Bank Divisions Commercial Bank Division |
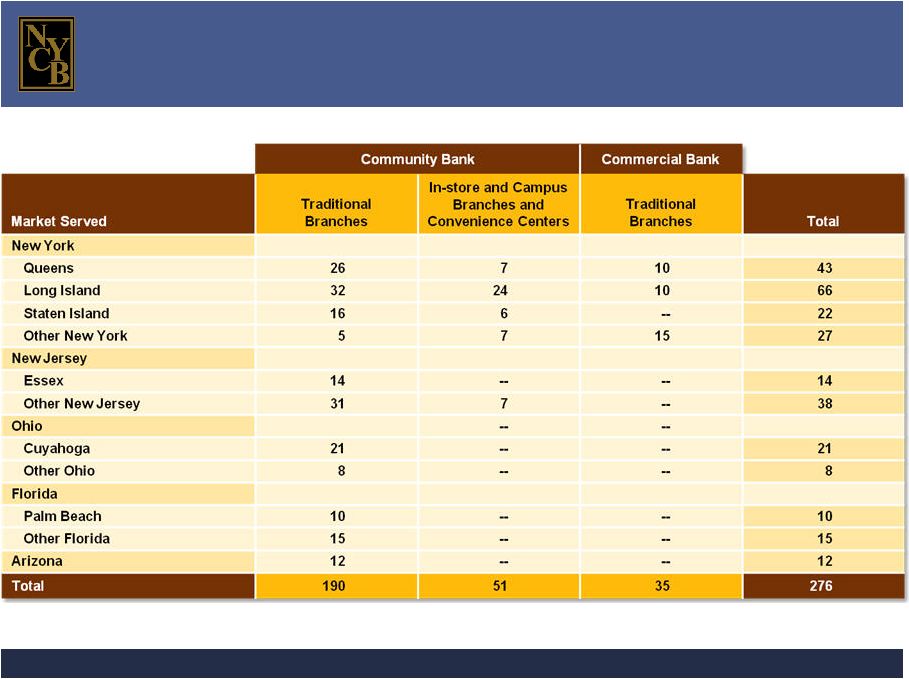 New York Community Bancorp, Inc. Page 22 Largely reflecting our acquisition strategy, we currently have 276 locations in five states. |
 New York Community Bancorp, Inc. Page 23 The AmTrust acquisition has been progressing very smoothly. Experienced integration team has been on location in Cleveland since December 4th Management has met with AmTrust officers and employees in all three states and visited all 66 branches We retained 1,458 of AmTrust’s employees and have augmented the branch office staff Recommenced the origination of agency-conforming one- to four-family loans on a held-for-sale basis only to Fannie Mae and Freddie Mac Applied for, and received, regulatory approval to rebrand AmTrust’s Ohio-based branches as Ohio Savings Bank; rebranding process to be completed by early April Currently analyzing workflow, policies and procedures, and internal controls Currently reviewing and renegotiating all contracts and leases |
 Our Business Model: Multi-family Loan Production |
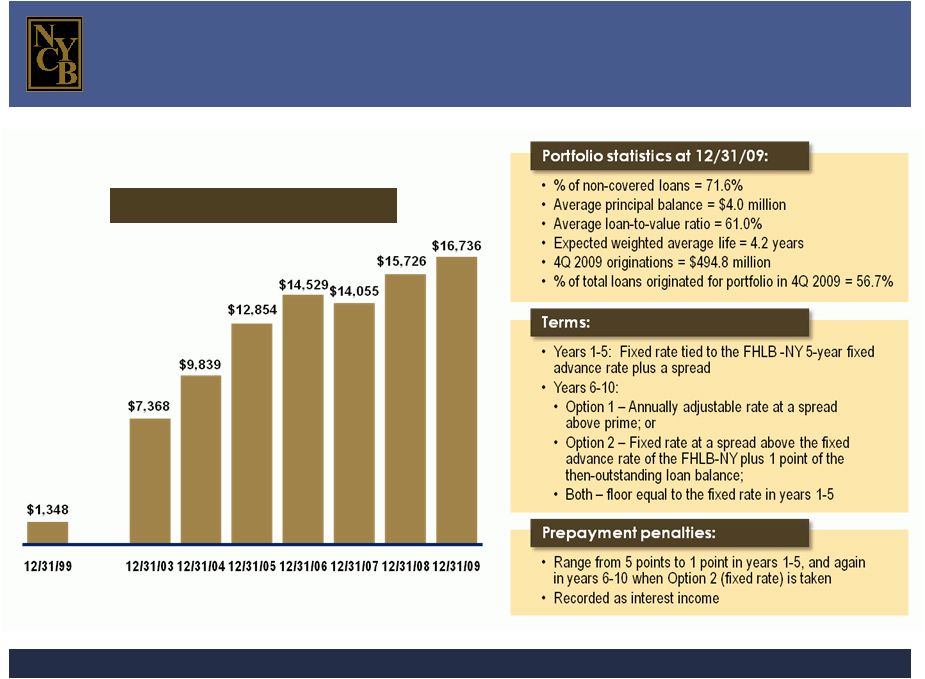 New York Community Bancorp, Inc. Page 25 (in millions) Multi-family Loan Portfolio Multi-family loans have grown at a CAGR of 28.6% since 12/31/99. |
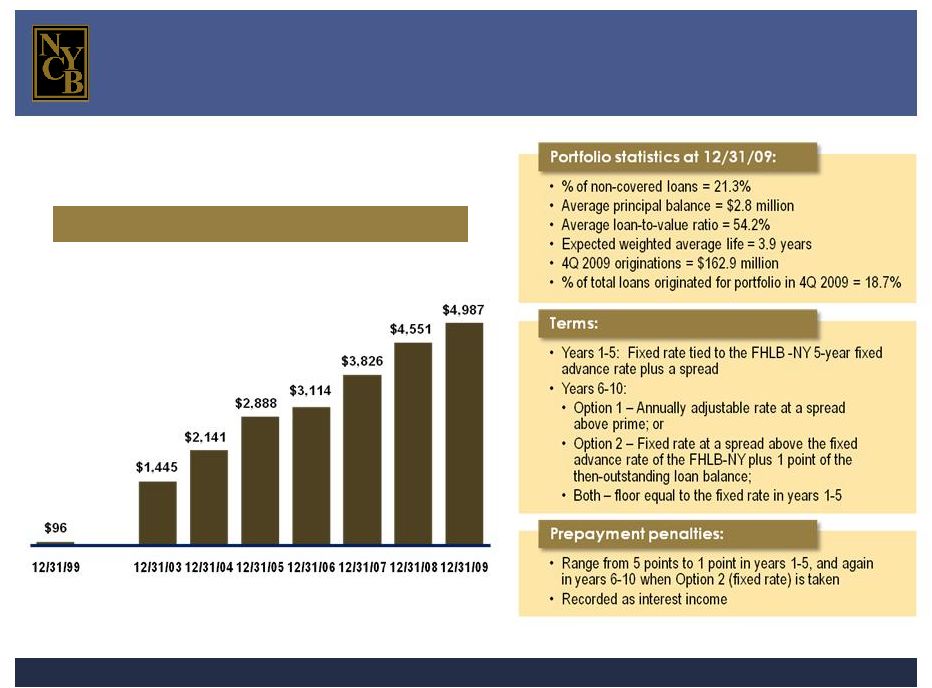 New York Community Bancorp, Inc. Page 26 (in millions) Commercial Real Estate Loan Portfolio Our commercial real estate loans feature the same structure as our multi-family loans. |
 Our Business Model: Asset Quality |
 New York Community Bancorp, Inc. Page 28 Net Charge-offs / Average Loans NYB Net Charge-offs: $22,000 $222,000 $458,000 $6.1 million $431,000 Both historically and currently, we have been distinguished by our low level of net charge-offs. $29.9 million NYB SNL Bank and Thrift Index (a) (a) SNL Financial as of 1/29/10 Last Credit Cycle Current Credit Cycle |
 New York Community Bancorp, Inc. Page 29 The quality of our loan portfolio continues to exceed that of our industry as it has in the past. (a) Non-performing loans are defined as non-accrual loans and loans 90 days or more past due but still accruing interest. (b) SNL Financial as of 1/29/10 NYB SNL Bank and Thrift Index (b) Non-performing Loans / Total Loans (a) Last Credit Cycle Current Credit Cycle |
 New York Community Bancorp, Inc. Page 30 (a) SNL Financial as of 1/29/10 Net Charge-offs / Average Loan Loss Allowance Historically and currently, our charge-offs have represented a smaller percentage of our loan loss allowance compared to our industry peers. Last Credit Cycle Current Credit Cycle NYB SNL Bank and Thrift Index (a) |
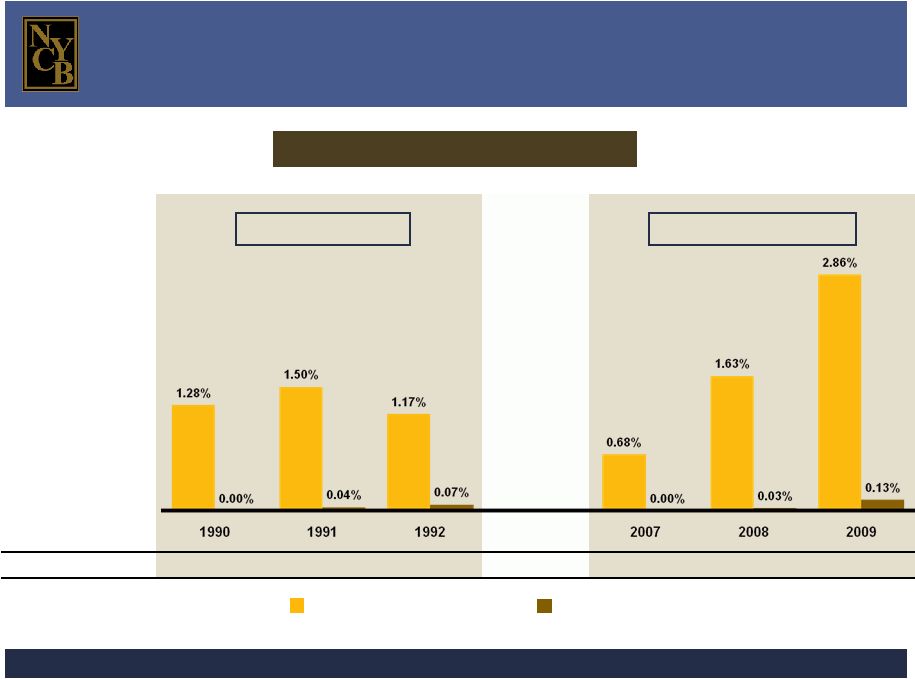
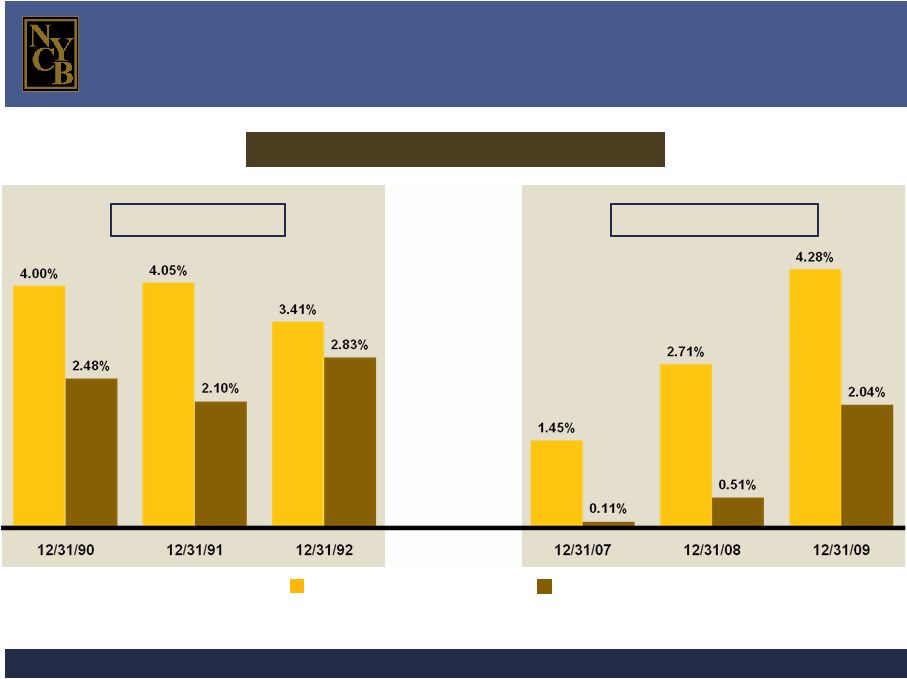
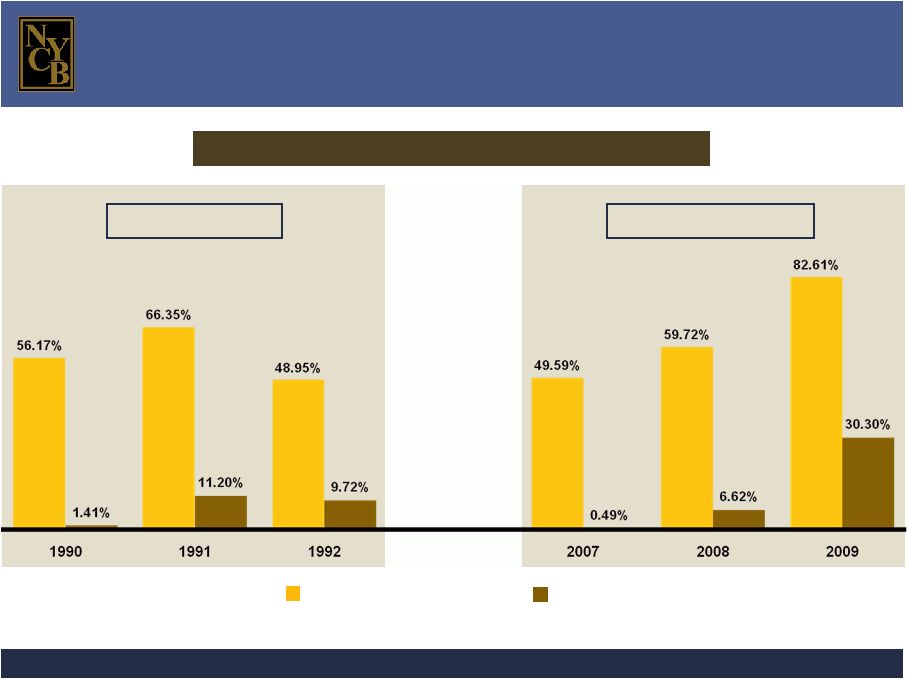
 New York Community Bancorp, Inc. Page 31 Historically and currently, few of our non-performing loans have resulted in charge-offs. NYB At or for the Twelve Months Ended December 31, Last Credit Cycle Current Credit Cycle 1990 1991 1992 2007 2008 2009 NPLs / Total Loans (a) 2.48% 2.10% 2.83% 0.11% 0.51% 2.04% NCOs / Average Loans 0.00% 0.04% 0.07% 0.00% 0.03% 0.13% Difference 248 bp 206 bp 276 bp 11 bp 48 bp 191 bp (a) Non-performing loans are defined as non-accrual loans and loans 90 days or more past due but still accruing interest. (b) SNL Financial as of 1/29/10 SNL BANK & THRIFT INDEX (b) NPLs / Total Loans (a) 4.00% 4.05% 3.41% 1.45% 2.71% 4.28% NCOs / Average Loans 1.28% 1.50% 1.17% 0.68% 1.63% 2.86% Difference 272 bp 255 bp 224 bp 77 bp 108 bp 142 bp |
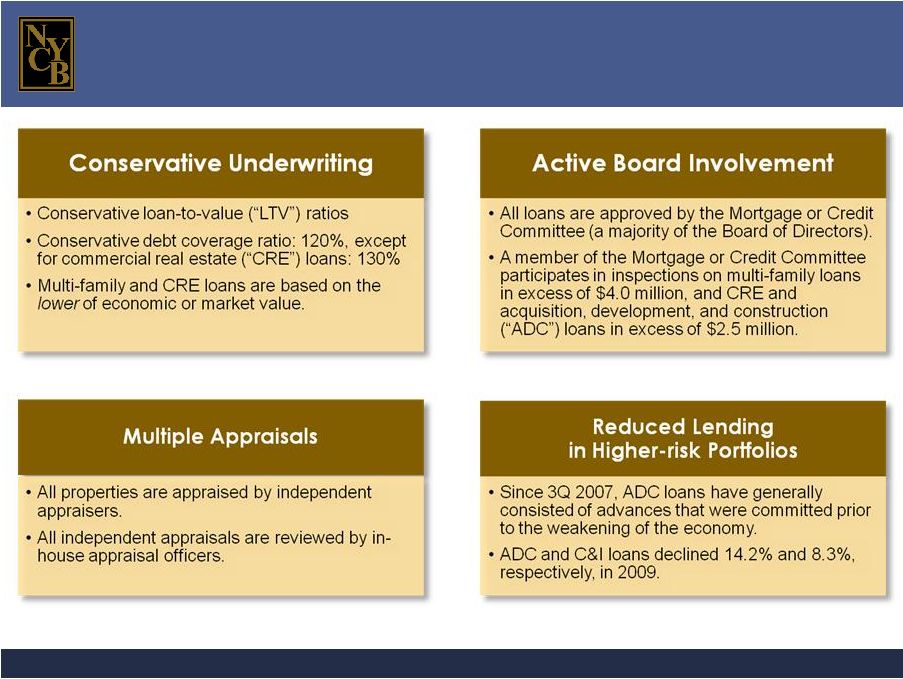 New York Community Bancorp, Inc. Page 32 The quality of our assets reflects the nature of our multi-family lending niche and our strong underwriting standards. |
 New York Community Bancorp, Inc. Page 33 While NPLs have increased in the wake of the economic crisis, they represent a small percentage of our loan portfolio. Loan Type Non-Performing Loans as a Percent of Total Loans at December 31, 2009 Multi-family 1.38% Commercial real estate 0.25 Acquisition, development, and construction 0.28 Commercial and industrial 0.07 One- to four-family 0.05 Other 0.01 Total loan portfolio 2.04% |
 Our Business Model: Efficiency |
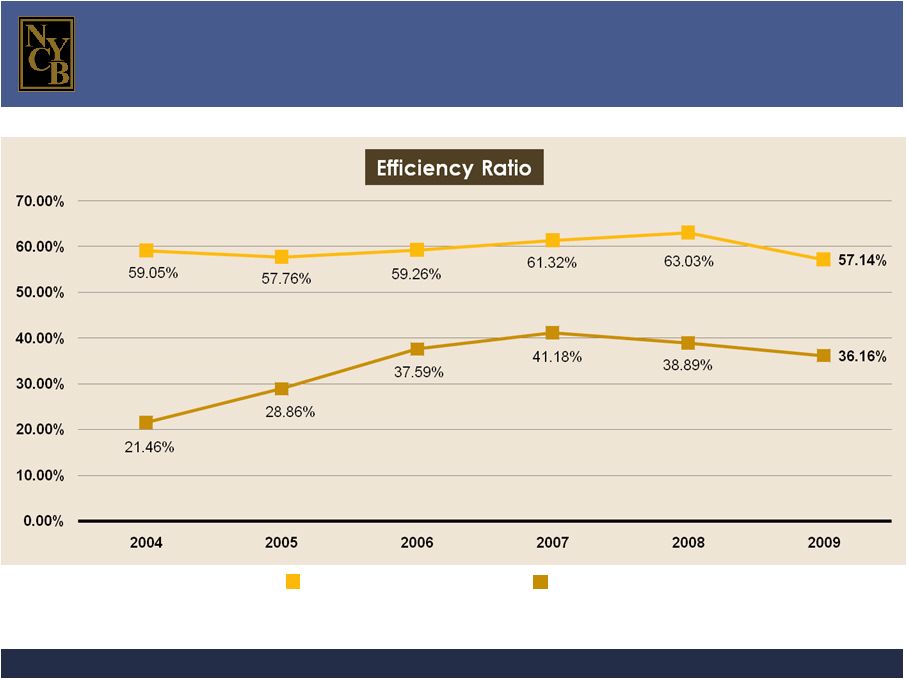 New York Community Bancorp, Inc. Page 35 Our operating efficiency ratio was 36.16% (a) in 2009, well below the SNL Bank and Thrift Index efficiency ratio of 57.14%. (b) (a) Please see pages 40 and 41 for a reconciliation of our GAAP and operating efficiency ratios. (b) SNL Financial as of 1/29/10 NYB (a) SNL Bank and Thrift Index (b) |
 Total Return on Investment |
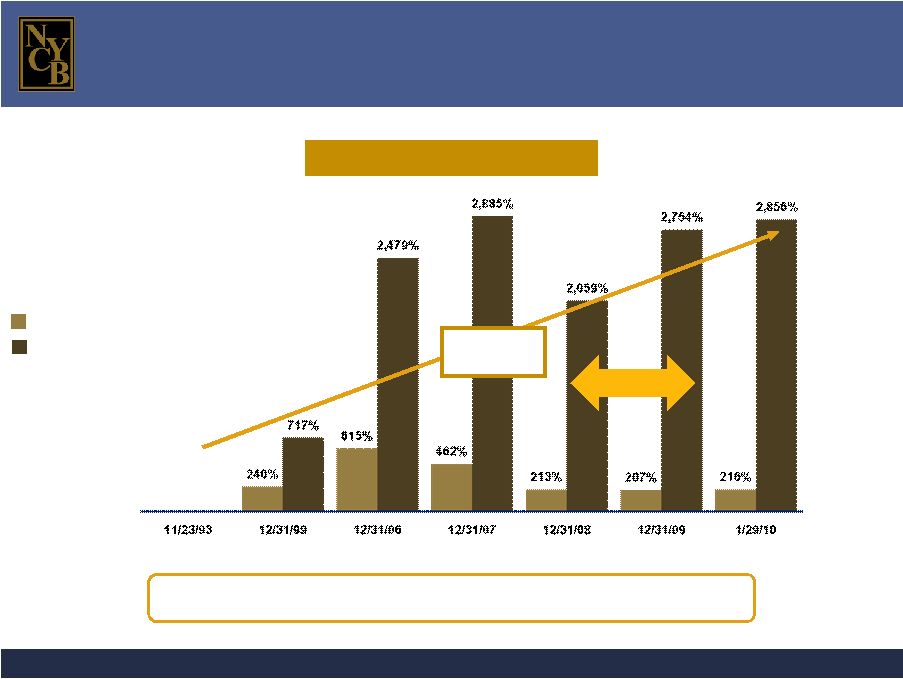 New York Community Bancorp, Inc. Page 37 Total Return on Investment NYB (b) (a) SNL Financial (b) Bloomberg As a result of nine stock splits in a span of 10 years, our charter shareholders have 2,700 shares of NYB stock for each 100 shares originally purchased. Notwithstanding the decline in the capital markets, our business model has created significant value for our shareholders over time. SNL Bank & Thrift Index (a) CAGR since IPO = 33.5% Total Return: 32.52% |
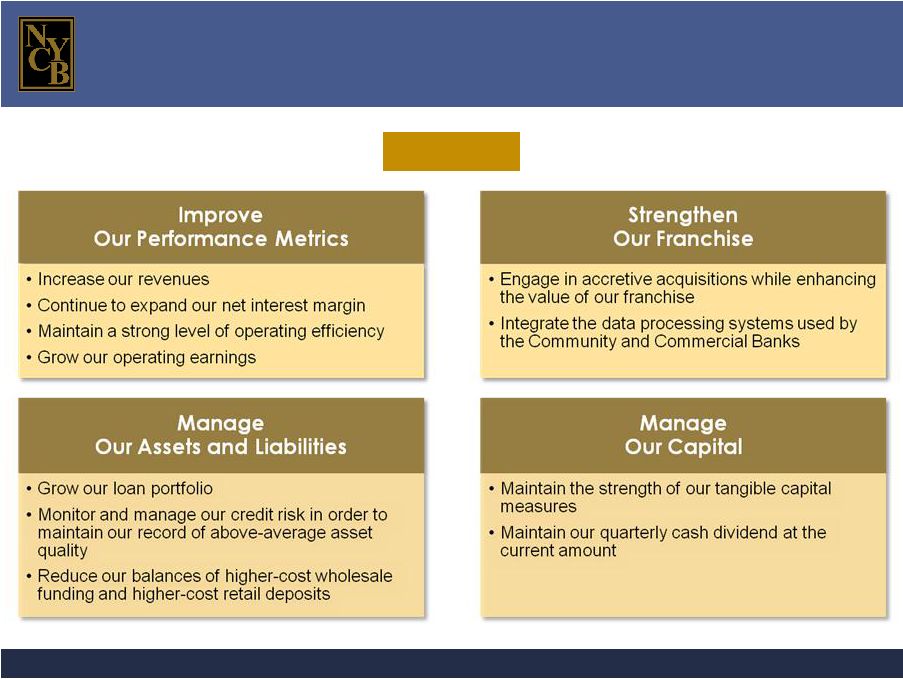 New York Community Bancorp, Inc. Page 38 We are committed to building value for our investors. Our Goals |
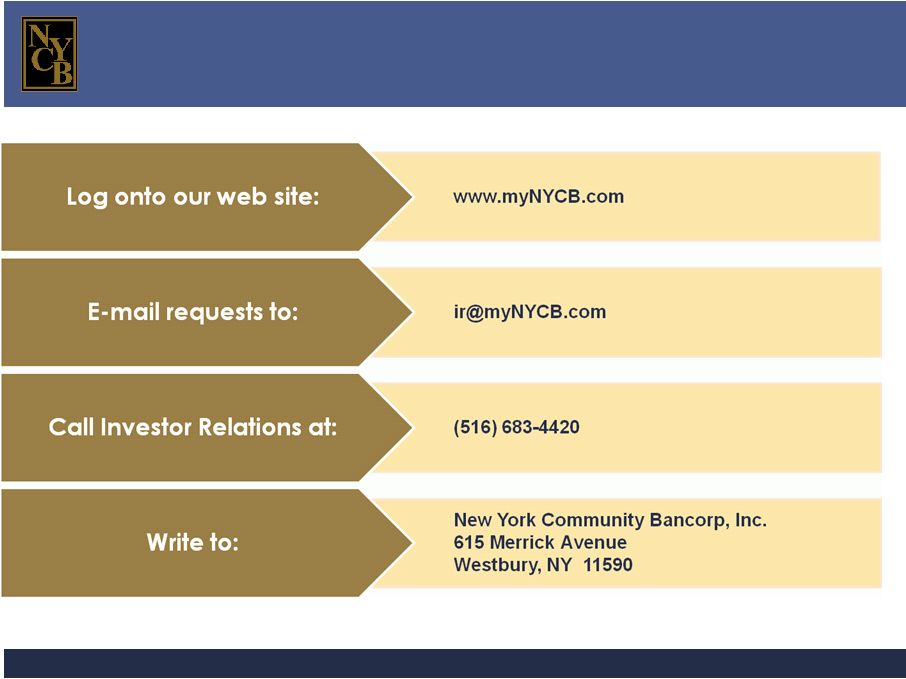 New York Community Bancorp, Inc. Page 39 2/3/2010 For More Information |
 New York Community Bancorp, Inc. Page 40 For the Three Months Ended For the Twelve Months Ended December 31, 2009 December 31, 2008 December 31, 2009 (dollars in thousands) GAAP Operating GAAP Operating GAAP Operating Total net interest income and non-interest income $417,633 $417,633 $230,630 $230,630 $1,088,030 $1,088,030 Adjustments: Gain on debt repurchases and exchange -- (4,337) -- (16,036) -- (10,054) Loss on other-than-temporary impairment of securities 18,464 -- 10,562 -- 71,467 Gain on AmTrust transaction -- (139,607) -- -- -- (139,607) Gain on termination of servicing hedge -- (3,078) -- -- -- (3,078) Adjusted total net interest income and non-interest income $417,633 $289,075 $230,630 $225,156 $1,088,030 $1,006,758 Operating expenses $108,098 $108,098 $80,922 $80,922 $384,003 $384,003 Adjustments: FDIC special assessment -- -- -- -- -- (14,753) Acquisition-related costs -- (5,185) -- -- -- (5,185) Adjusted operating expenses $102,913 $80,922 $80,922 $384,003 $364,065 Efficiency ratio 25.88% 35.60% 35.09% 35.94% 35.29% 36.16% Reconciliation of GAAP and Operating Efficiency Ratios The following table presents a reconciliation of the Company’s GAAP and operating efficiency ratios for the three months ended December 31, 2008 and 2009 and the twelve months ended December 31, 2009: |
 New York Community Bancorp, Inc. Page 41 Reconciliation of GAAP and Operating Efficiency Ratios The following table presents reconciliations of the Company’s GAAP and operating efficiency ratios for the years ended December 31, 1999, 2000, 2001, 2003, 2004, 2005, 2006, 2007, and 2008. For the year ended December 31, 2002, the Company’s GAAP and operating efficiency ratios were the same. For the Years Ended December 31, 2008 2007 2006 2005 2004 2003 2001 2000 1999 (dollars in thousands) GAAP Operating GAAP Operating GAAP Operating GAAP Operating GAAP Operating GAAP Operating GAAP Operating GAAP Operating GAAP Operating Total net interest income and non-interest income $691,024 $691,024 $727,622 $727,622 $650,556 $650,556 $693,068 $693,068 $737,040 $737,040 $668,962 $668,962 $296,431 $296,431 $94,726 $ 94,726 $71,426 $71,426 Adjustments: Visa-related gain -- (1,647) Net gain on sale of securities -- -- (1,888) -- -- -- -- -- -- -- -- -- -- -- -- -- -- Loss on mark-to-market of interest rate swaps -- -- -- -- -- 6,071 -- -- -- -- -- -- -- -- -- -- -- -- Loss on debt redemption -- (16,962) -- 1,848 -- 1,859 -- -- -- -- -- -- -- -- -- -- -- -- Loss on other-than-temporary impairment -- 104,317 -- 56,958 -- -- -- -- -- 8,209 -- -- -- -- -- -- -- -- Balance sheet repositioning charge -- 39,647 -- -- -- -- -- -- -- 157,215 -- -- -- -- -- -- -- -- Gain on sale of bank-owned property / branches -- -- -- (64,879) -- -- -- -- -- -- -- (37,613) -- (1,500) -- (13,500) -- -- Adjusted total net interest income and non-interest income $691,024 $816,379 $727,622 $719,661 $650,556 $658,486 $693,068 $693,068 $737,040 $902,464 $668,962 $631,349 $296,431 $294,931 $94,726 $ 81,226 $71,426 $71,426 Operating expenses $320,818 $320,818 $299,575 $299,575 $256,362 $256,362 $236,621 $236,621 $193,632 $193,632 $169,373 $169,373 $112,757 $112,757 $49,330 $ 49,330 $21,390 $21,390 Adjustments: FDIC special assessment -- -- Merger-related charge -- -- -- (2,245) -- (5,744) -- (36,588) -- -- -- (20,423) -- (22,800) -- (24,800) -- -- VISA litigation charge -- (3,365) -- (1,000) -- -- -- -- -- -- -- -- -- -- -- -- -- -- Retirement charge -- -- -- -- -- (3,072) -- -- -- -- -- -- -- -- -- -- -- (735) Curtailment gain -- -- -- -- -- -- -- -- -- -- -- -- -- -- -- -- -- 1,600 Adjusted operating expenses $320,818 $317,453 $299,575 $296,330 $256,362 $247,546 $236,621 $200,033 $193,632 $193,632 $169,373 $148,950 $112,757 $ 89,957 $49,330 $ 24,530 $21,390 $22,255 Efficiency ratio 46.43% 38.89% 41.17% 41.18% 39.41% 37.59% 34.14% 28.86% 26.27% 21.46% 25.32% 23.59% 38.04% 30.50% 52.08% 30.20% 29.95% 31.16% |
 New York Community Bancorp, Inc. Page 42 Reconciliation of GAAP and Non-GAAP Capital Measures The following table presents reconciliations of the Company’s stockholders’ equity, tangible stockholders’ equity, and adjusted tangible stockholders’ equity; total assets, tangible assets, and adjusted tangible assets; and the related capital measures at December 31, 2004, 2005, 2006, 2007, and 2008 and September 30 and December 31, 2009: Please see the following page for reconciliations at December 31, 1999, 2000, 2001, 2002, and 2003. Dec. 31, Sept. 30, December 31, (dollars in thousands) 2009 2009 2008 2007 2006 2005 2004 Total stockholders’ equity $ 5,382,207 $ 4,340,539 $ 4,219,246 $ 4,182,313 $ 3,689,837 $ 3,324,877 $ 3,186,414 Less: Goodwill (2,436,401) (2,436,401) (2,436,401) (2,437,404) (2,148,108) (1,980,689) (1,951,438) Core deposit intangibles (105,764) (71,205) (87,780) (111,123) (106,381) (86,533) (87,553) Tangible stockholders’ equity $ 2,840,042 $ 1,832,933 $ 1,695,065 $ 1,633,786 $ 1,435,348 $ 1,257,655 $ 1,147,423 Total assets $42,169,174 $32,884,468 $32,466,906 $30,579,822 $28,482,370 $26,283,705 $24,037,826 Less: Goodwill (2,436,401) (2,436,401) (2,436,401) (2,437,404) (2,148,108) (1,980,689) (1,951,438) Core deposit intangibles (105,764) (71,205) (87,780) (111,123) (106,381) (86,533) (87,553) Tangible assets $39,627,009 $30,376,862 $29,942,725 $28,031,295 $26,227,881 $24,216,483 $21,998,835 Stockholders’ equity to total assets 12.76% 13.20% 13.00% 13.68% 12.95% 12.65% 13.26% Tangible stockholders’ equity to tangible assets 7.17% 6.03% 5.66% 5.83% 5.47% 5.19% 5.22% Tangible stockholders’ equity $2,840,042 $1,832,933 $1,695,065 $1,633,786 $1,435,348 $1,257,655 $1,147,423 Accumulated other comprehensive loss, net of tax 49,903 68,394 87,319 21,315 68,053 55,857 40,697 Adjusted tangible stockholders’ equity $2,889,945 $1,901,327 $1,782,384 $1,655,101 $1,503,401 $1,313,512 $1,188,120 Tangible assets $39,627,009 $30,376,862 $29,942,725 $28,031,295 $26,227,881 $24,216,483 $21,998,835 Accumulated other comprehensive loss, net of tax 49,903 68,394 87,319 21,315 68,053 55,857 40,697 Adjusted tangible assets $39,676,912 $30,445,256 $30,030,044 $28,052,610 $26,295,394 $24,272,340 $22,039,532 Adjusted tangible stockholders’ equity to adjusted tangible assets 7.28% 6.25% 5.94% 5.90% 5.72% 5.41% 5.39% |
 New York Community Bancorp, Inc. Page 43 The following table presents reconciliations of the Company’s stockholders’ equity, tangible stockholders’ equity, and adjusted tangible stockholders’ equity; total assets, tangible assets, and adjusted tangible assets; and the related capital measures at December 31, 1999, 2000, 2001, 2002, and 2003: December 31, (dollars in thousands) 2003 2002 2001 2000 1999 Total stockholders’ equity $ 2,868,657 $1,323,512 $ 983,134 $ 307,410 $137,141 Less: Goodwill (1,918,353) (624,518) (614,653) (118,070) -- Core deposit intangibles (98,993) (51,500) (57,500) -- -- Tangible stockholders’ equity $ 851,311 $ 647,494 $ 310,981 $ 189,340 $137,141 Total assets $23,441,337 $11,313,092 $9,202,635 $4,710,785 $1,906,835 Less: Goodwill (1,918,353) (624,518) (614,653) (118,070) -- Core deposit intangibles (98,993) (51,500) (57,500) -- -- Tangible assets $21,423,991 $10,637,074 $8,530,482 $4,592,715 $1,906,835 Stockholders’ equity to total assets 12.24% 11.70% 10.68% 6.53% 7.19% Tangible stockholders’ equity to tangible assets 3.97% 6.09% 3.65% 4.12% 7.19% Tangible stockholders’ equity $851,311 $647,494 $310,981 $189,340 $137,141 Accumulated other comprehensive loss (gain), net of tax 34,640 (34,852) (3,715) (820) -- Adjusted tangible stockholders’ equity $885,951 $612,642 $307,266 $188,520 $137,141 Tangible assets $21,423,991 $10,637,074 $8,530,482 $4,592,715 $1,906,835 Accumulated other comprehensive loss (gain), net of tax 34,640 (34,852) (3,715) (820) -- Adjusted tangible assets $21,458,631 $10,602,222 $8,526,767 $4,591,895 $1,906,835 Adjusted tangible stockholders’ equity to adjusted tangible assets 4.13% 5.78% 3.60% 4.11% 7.19% Reconciliation of GAAP and Non-GAAP Capital Measures |
 New York Community Bancorp, Inc. Page 44 The following table presents a reconciliation of the Company’s GAAP and operating earnings for the three and twelve months ended December 31, 2008 and 2009: Reconciliation of GAAP and Operating Earnings For the Three Months Ended For the Twelve Months Ended Dec. 31, Dec. 31, Dec. 31, Dec. 31, (in thousands, except per share data) 2009 2008 2009 2008 GAAP Earnings $ 170,241 $102,232 $ 413,951 $ 77,884 Adjustments to GAAP earnings: Gain on AmTrust transaction (139,607) -- (139,607) -- Loss on OTTI of securities 18,464 10,562 71,467 104,317 Gain on debt repurchases/exchange (4,337) (16,036) (10,054) (16,962) Acquisition-related costs 7,530 -- 7,530 -- Gain on termination of servicing hedge (3,078) -- (3,078) -- FDIC special assessment -- -- 14,753 -- Resolution of tax audits -- -- (14,337) -- Debt repositioning charge -- -- -- 325,016 Litigation settlement charge -- -- -- 3,365 Visa-related gain -- -- -- (1,647) Income tax effect 48,502 (4,316) 24,025 (169,467) Operating earnings $ 97,715 $ 92,442 $ 364,650 $ 322,506 Diluted GAAP Earnings per Share $ 0.45 $ 0.30 $ 1.17 $ 0.23 Adjustments to diluted GAAP earnings per share: Gain on AmTrust transaction (0.22) -- (0.24) -- Loss on OTTI of securities 0.03 0.02 0.12 0.19 Gain on debt repurchases/exchange (0.01) (0.05) (0.02) (0.06) Acquisition-related costs 0.01 -- 0.01 -- Gain on termination of servicing hedge -- -- -- -- FDIC special assessment -- -- 0.03 -- Resolution of tax audits -- -- (0.04) -- Debt repositioning charge -- -- -- 0.60 Litigation settlement charge -- -- -- 0.01 Visa-related gain -- -- -- (0.01) Diluted operating earnings per share $ 0.26 $ 0.27 $ 1.03 $ 0.96 |
 New York Community Bancorp, Inc. Page 45 The following table presents a reconciliation of the Company’s GAAP and cash earnings for the three months ended December 31, 2008 and 2009 and the twelve months ended December 31, 2009: Reconciliation of GAAP and Cash Earnings (in thousands, except per share data) For the Three Months Ended For the Twelve Months Ended Dec. 31, 2009 Dec. 31, 2009 Dec. 31, 2008 GAAP Earnings $170,241 $102,232 $413,951 Amortization and appreciation of shares held in stock-related benefit plans 3,355 3,236 13,252 Associated tax effects 216 (2,071) 4,010 Dividends on unallocated ESOP shares 158 245 631 Amortization of core deposit intangibles 6,237 5,733 22,812 Gain on debt exchange -- -- (3,381) Loss on OTTI of securities 11,136 6,246 43,208 21,102 13,389 80,532 Cash earnings $191,343 $115,621 $494,483 Diluted GAAP Earnings per Share $0.45 $ 0.30 $ 1.17 Additional contributions to diluted GAAP earnings per share: Amortization and appreciation of shares held in stock-related benefit plans 0.01 0.01 0.04 Associated tax effects -- (0.01) 0.02 Dividends on unallocated ESOP shares -- -- -- Amortization of core deposit intangibles 0.02 0.02 0.07 Gain on debt exchange -- -- (0.01) Loss on OTTI of securities 0.03 0.02 0.12 Total additional contributions to diluted GAAP earnings per share 0.06 0.04 0.24 Diluted cash earnings per share $0.51 $ 0.34 $ 1.41 Additional contributions to tangible stockholders’ equity: Total additional contributions to tangible stockholders’ equity |
 Appendix |
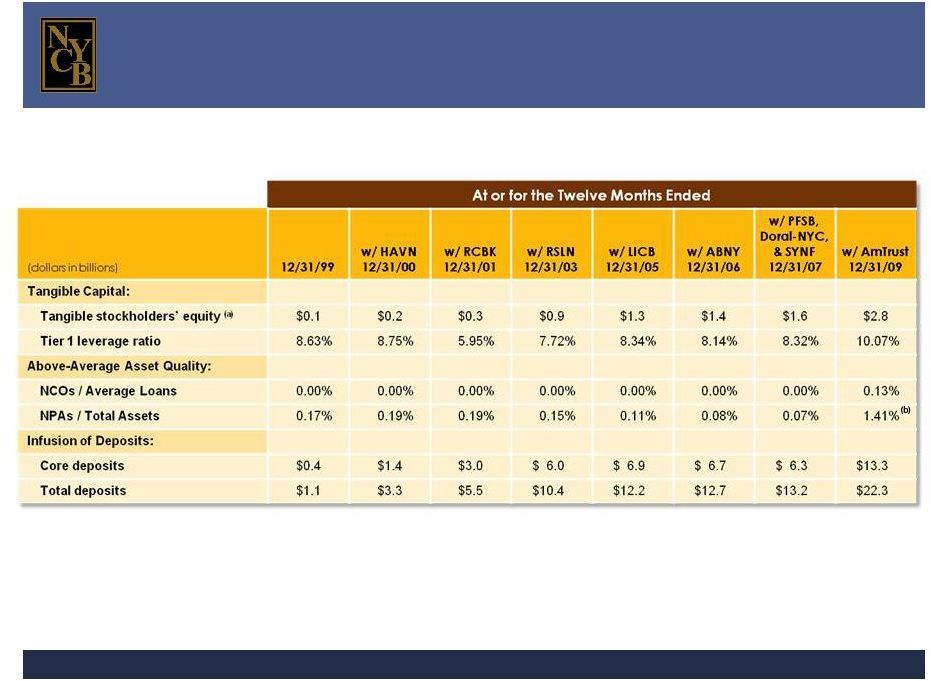 New York Community Bancorp, Inc. Page 47 (a) Please see pages 42 and 43 for reconciliations of our GAAP and non-GAAP capital. (b) Loans acquired in the AmTrust transaction are covered by a loss sharing agreement with the FDIC. The increase in this ratio is unrelated to the AmTrust transaction. Our financial performance reflects the merits of our growth-through-acquisition strategy. |
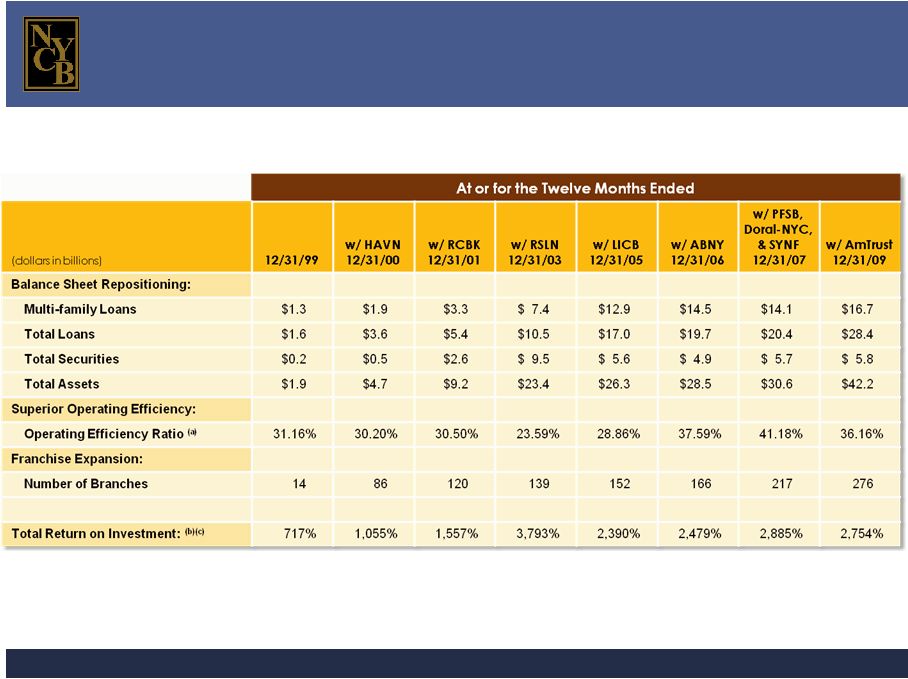 New York Community Bancorp, Inc. Page 48 (a) Please see pages 40 and 41 for reconciliations of our GAAP and operating efficiency ratios. (b) From 11/23/93 to the date indicated (c) Bloomberg Our financial performance reflects the merits of our growth-through-acquisition strategy (cont’d). |
 New York Community Bancorp, Inc. Page 49 Total deposits: 35.3% CAGR Core deposits: 41.0% CAGR Demand deposits: 46.1% CAGR (in millions) CDs NOW, MMAs, and Savings Demand deposits Deposits Total Deposits: $10,457 $12,168 $12,694 $13,236 $14,376 Our deposit growth has been largely acquisition- driven. $22,316 $1,086 $10,329 |
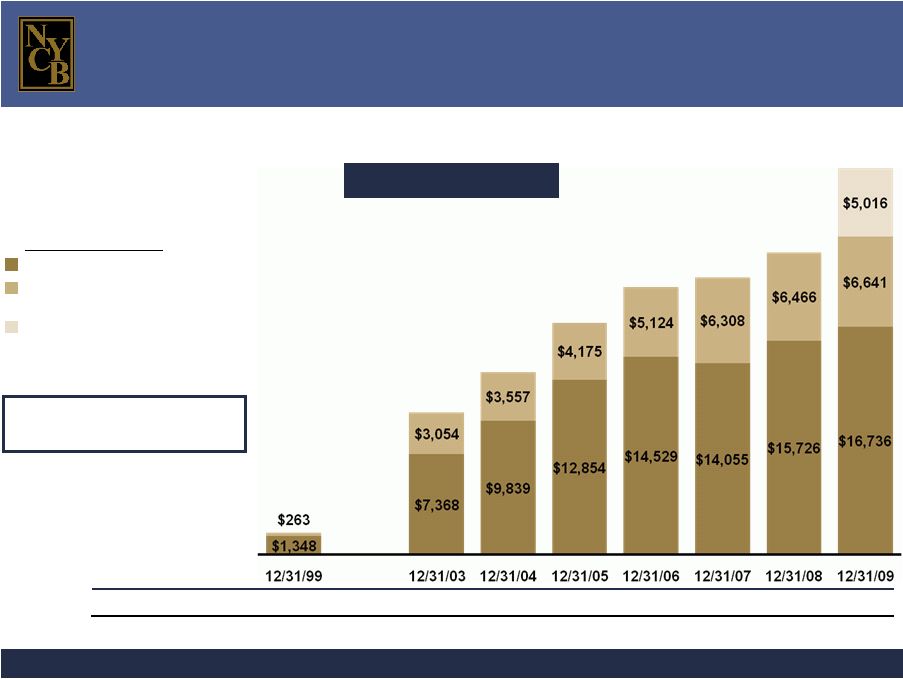 New York Community Bancorp, Inc. Page 50 (in millions) Non-covered Loans Multi-family Loans Outstanding All Other Loans Outstanding Covered Loans Loans Outstanding Multi-family loans: 28.6% CAGR Total loans: 33.2% CAGR $1,611 $17,029 $19,653 Total Loans: $677 $6,332 $4,971 Total Originations: $28,393 $4,280 $20,363 $4,853 While acquisitions have contributed to the growth of our loan portfolio, the bulk of our loan growth has been organic. $22,192 $5,881 $13,396 $6,041 $10,500 $4,330 |