 Fourth Quarter 2010 Investor Presentation Exhibit 99.1 |
 New York Community Bancorp, Inc. Page 2 Forward-looking Statements and Associated Risk Factors Safe Harbor Provisions of the Private Securities Litigation Reform Act of 1995 This presentation, like many written and oral communications presented by New York Community Bancorp, Inc. and our authorized officers, may contain certain forward-looking statements regarding our prospective performance and strategies within the meaning of Section 27A of the Securities Act of 1933, as amended, and Section 21E of the Securities Exchange Act of 1934, as amended. We intend such forward-looking statements to be covered by the safe harbor provisions for forward-looking statements contained in the Private Securities Litigation Reform Act of 1995, and are including this statement for purposes of said safe harbor provisions. Forward-looking statements, which are based on certain assumptions and describe future plans, strategies, and expectations of the Company, are generally identified by use of the words “anticipate,” “believe,” “estimate,” “expect,” “intend,” “plan,” “project,” “seek,” “strive,” “try,” or future or conditional verbs such as “will,” “would,” “should,” “could,” “may,” or similar expressions. Our ability to predict results or the actual effects of our plans or strategies is inherently uncertain. Accordingly, actual results may differ materially from anticipated results. There are a number of factors, many of which are beyond our control, that could cause actual conditions, events, or results to differ significantly from those described in the forward-looking statements. These factors include, but are not limited to: general economic conditions, either nationally or in some or all of the areas in which we and our customers conduct our respective businesses; conditions in the securities markets and real estate markets or the banking industry; changes in interest rates, which may affect our net income, prepayment penalty income, and other future cash flows, or the market value of our assets, including our investment securities; changes in deposit flows and wholesale borrowing facilities; changes in the demand for deposit, loan, and investment products and other financial services in the markets we serve; changes in our credit ratings or in our ability to access the capital markets; changes in our customer base or in the financial or operating performances of our customers’ businesses; changes in real estate values, which could impact the quality of the assets securing the loans in our portfolio; changes in the quality or composition of our loan or securities portfolios; changes in competitive pressures among financial institutions or from non- institutions; the ability to successfully integrate any assets, liabilities, customers, systems, and management personnel we may acquire into our operations, and our ability to realize related revenue synergies and cost savings within expected time frames; our use of derivatives to mitigate our interest rate exposure; our ability to retain key members of management; our timely development of new lines of business and competitive products or services in a changing environment, and the acceptance of such products or services by our customers; any breach in performance by the Community Bank under our loss sharing agreements with the FDIC; any interruption or breach of security resulting in failures or disruptions in customer account management, general ledger, deposit, loan, or other systems; any interruption in customer service due to circumstances beyond our control; potential exposure to unknown or contingent liabilities of companies we have acquired or target for acquisition, including those of AmTrust Bank and Desert Hills Bank; the outcome of pending or threatened litigation, or of other matters before regulatory agencies, whether currently existing or commencing in the future; changes in our estimates of future reserves based upon the periodic review thereof under relevant regulatory and accounting requirements; changes in our capital management policies, including those regarding business combinations, dividends, and share repurchases, among others; changes in legislation, regulation, policies, or administrative practices, whether by judicial, governmental, or legislative action, including, but not limited to, the impact of the Dodd-Frank Wall Street Reform and Consumer Protection Act, and other changes pertaining to banking, securities, taxation, rent regulation and housing, environmental protection, and insurance, and the ability to comply with such changes in a timely manner; additional FDIC special assessments or required assessment prepayments; changes in accounting principles, policies, practices, or guidelines; environmental conditions that exist or may exist on properties owned by, leased by, or mortgaged to the Company; operational issues stemming from, and/or capital spending necessitated by, the potential need to adapt to industry changes in information technology systems, on which we are highly dependent; the ability to keep pace with, and implement on a timely basis, technological changes; changes in the monetary and fiscal policies of the U.S. Government, including policies of the U.S. Department of the Treasury and the Board of Governors of the Federal Reserve System; war or terrorist activities; and other economic, competitive, governmental, regulatory, and geopolitical factors affecting our operations, pricing, and services. For a discussion of these and other risks that may cause actual results to differ from expectations, please refer to our Annual Report on Form 10-K for the year ended December 31, 2009, including the section entitled “Risk Factors,” and our Forms 10-Q for the three months ended March 31, 2010, June 30, 2010, and September 30, 2010, on file with the U.S. Securities and Exchange Commission (the “SEC”). In addition, it should be noted that we routinely evaluate opportunities to expand through acquisition and frequently conduct due diligence activities in connection with such opportunities. As a result, acquisition discussions and, in some cases, negotiations, may take place at any time, and acquisitions involving cash, debt, or equity securities may occur. Furthermore, the timing and occurrence or non-occurrence of events may be subject to circumstances beyond our control. Readers are cautioned not to place undue reliance on the forward-looking statements contained herein, which speak only as of the date of this presentation. Except as required by applicable law or regulation, we undertake no obligation to update these forward-looking statements to reflect events or circumstances that occur after the date on which such statements were made. |
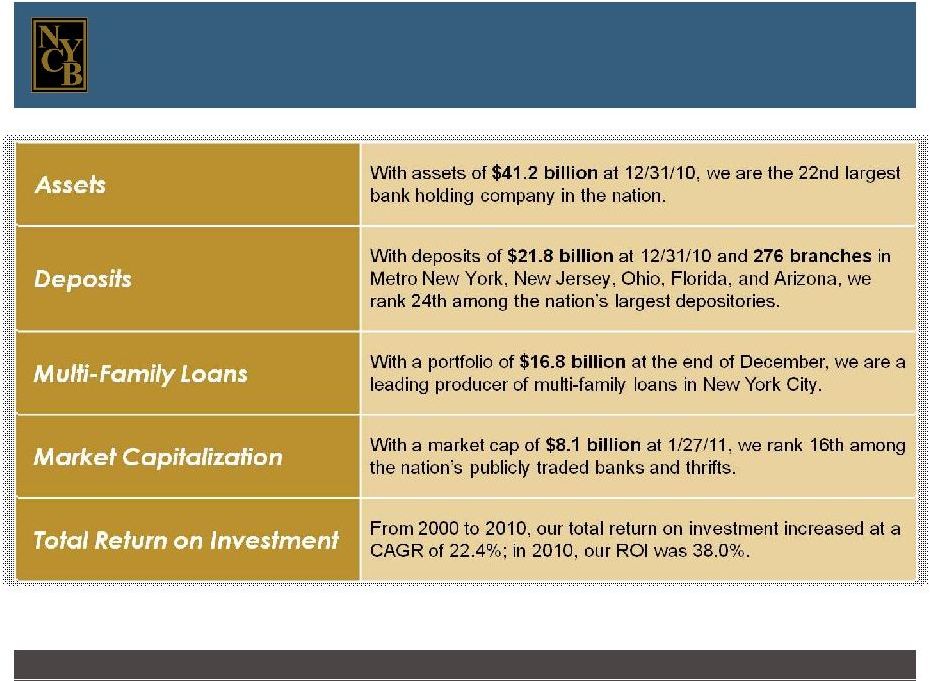 New York Community Bancorp ranks among the top 25 bank holding companies in the United States. Note: Except as otherwise indicated, all industry data was provided by SNL Financial as of 1/26/11. New York Community Bancorp, Inc. Page 3 |
 New York Community Bancorp, Inc. Page 4 Largely reflecting our acquisition strategy, we currently have 276 locations in five states. Metro New York 157 Branches Ohio 28 Branches New Jersey 52 Branches Florida 25 Branches Arizona 14 Branches |
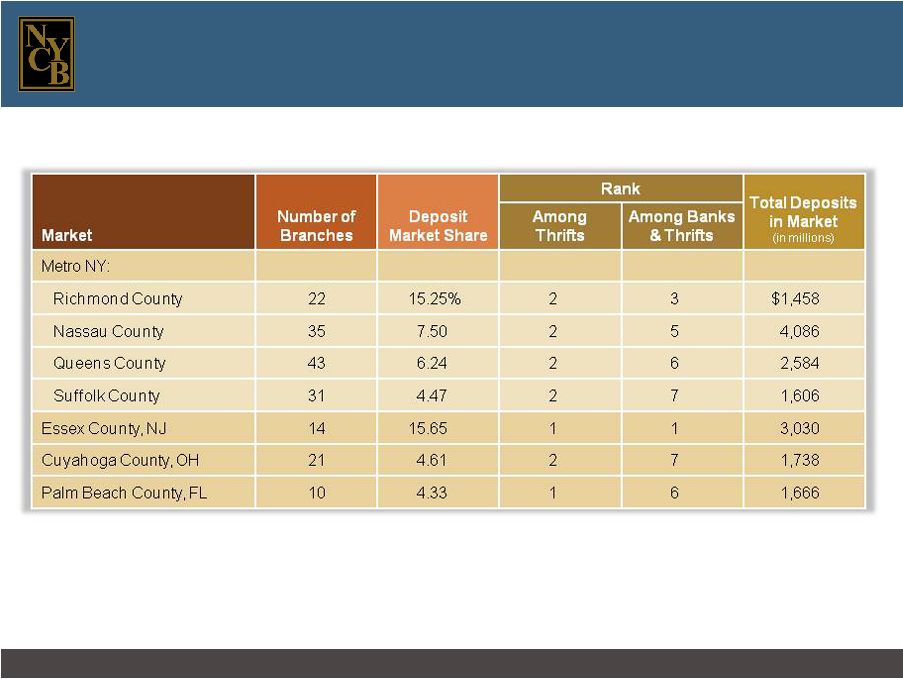 New York Community Bancorp, Inc. Page 5 We have a meaningful share of deposits in several of the markets we serve. |
   4th Quarter 2010 Performance Highlights * * * * * * * * * * * * * * * * * * |
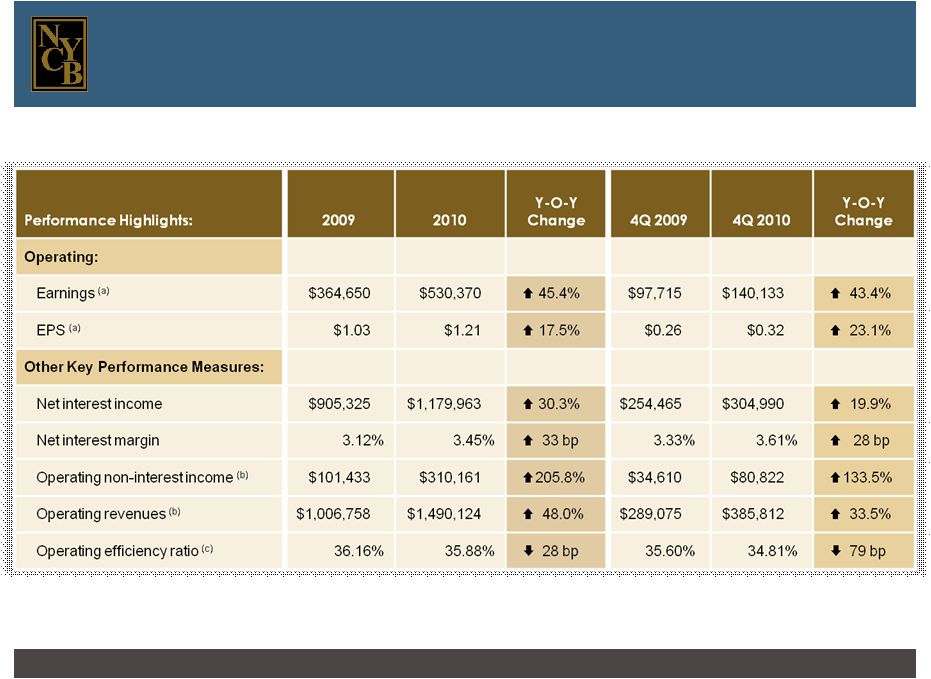 New York Community Bancorp, Inc. Page 7 Our 4Q 2010 performance reflects the merits of our business model. (a) Please see page 38 for a reconciliation of our GAAP and operating earnings. (b) Please see page 39 for a reconciliation of our GAAP and operating non-interest income and our GAAP and operating revenues. (c) Please see pages 36 and 37 for a reconciliation of our GAAP and operating efficiency ratios. (dollars in thousands, except per share data) |
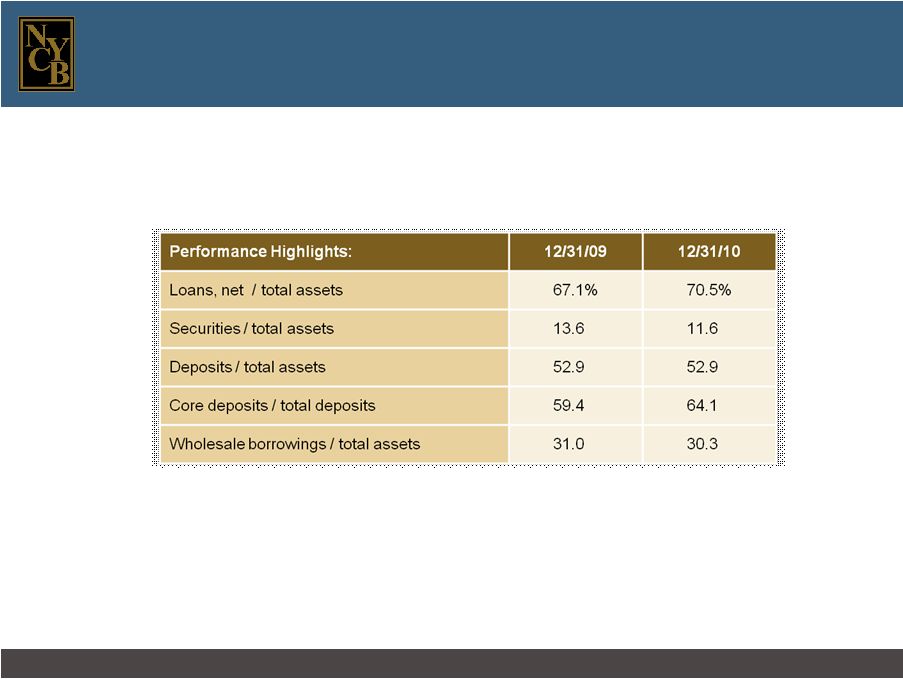 New York Community Bancorp, Inc. Page 8 Our balance sheet has been strengthened over the past year. |
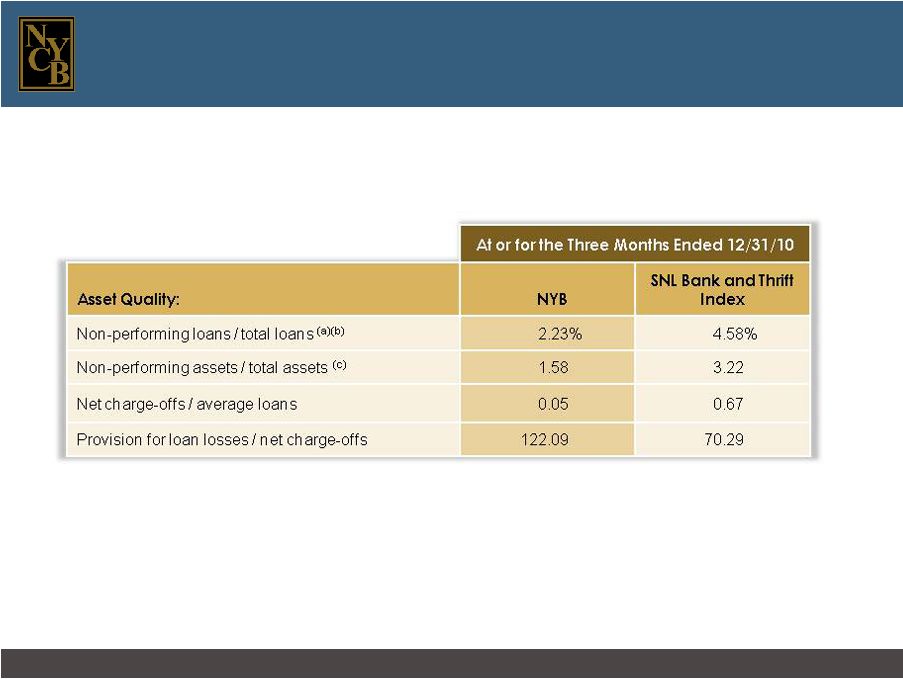 New York Community Bancorp, Inc. Page 9 Our asset quality measures continue to compare favorably with those of our industry as a whole. (a) Non-performing loans are defined as non-accrual loans and loans 90 days or more past due but still accruing interest. (b) Non-performing loans exclude covered loans. (c) Non-performing assets exclude covered assets. |
 New York Community Bancorp, Inc. Page 10 (a) Please see page 40 for a reconciliation of our GAAP and non-GAAP capital measures. Our capital strength reflects the growth of our earnings and our ability to access the capital markets. Our dividend has been a significant component of our total return to shareholders since our first year of public life. In January 2011, we declared our 28th consecutive quarterly cash dividend of $0.25 per share. |
   A Consistent Business Model * * * * * * * * * * * * * * * * * * |
 New York Community Bancorp, Inc. Page 12 Our business model has consistently focused on building value while building the Company. (a) Please see page 36 for a reconciliation of our GAAP and operating efficiency ratios. |
   Growth through Acquisitions * * * * * * * * * * * * * * * * * * |
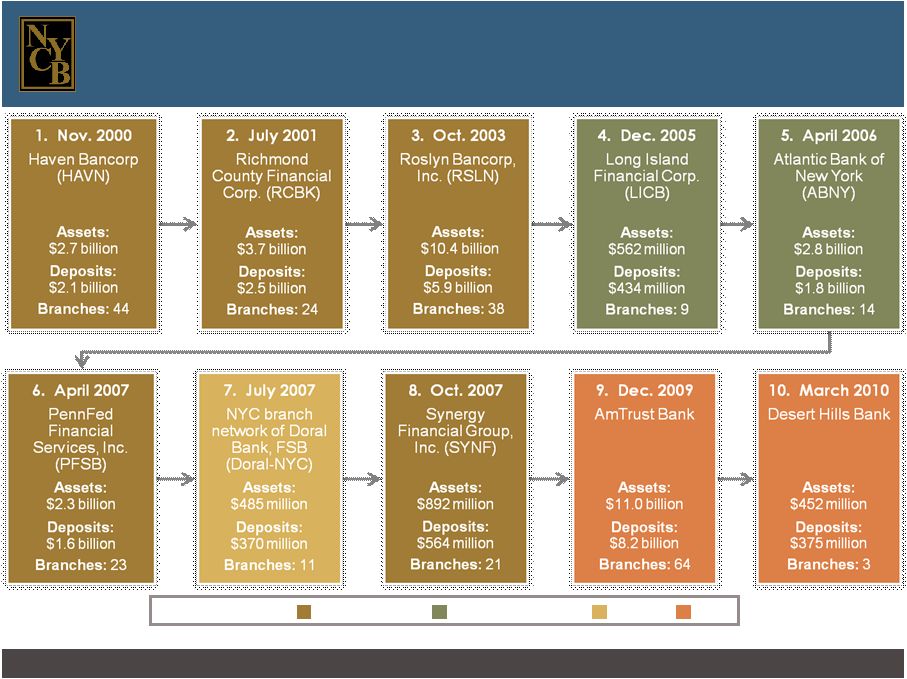 New York Community Bancorp, Inc. Page 14 We have completed 10 acquisitions since 2000. Note: The number of branches indicated reflects the number of branches in our current franchise that stemmed from each transaction. Transaction Type: Savings Bank Commercial Bank Branch FDIC |
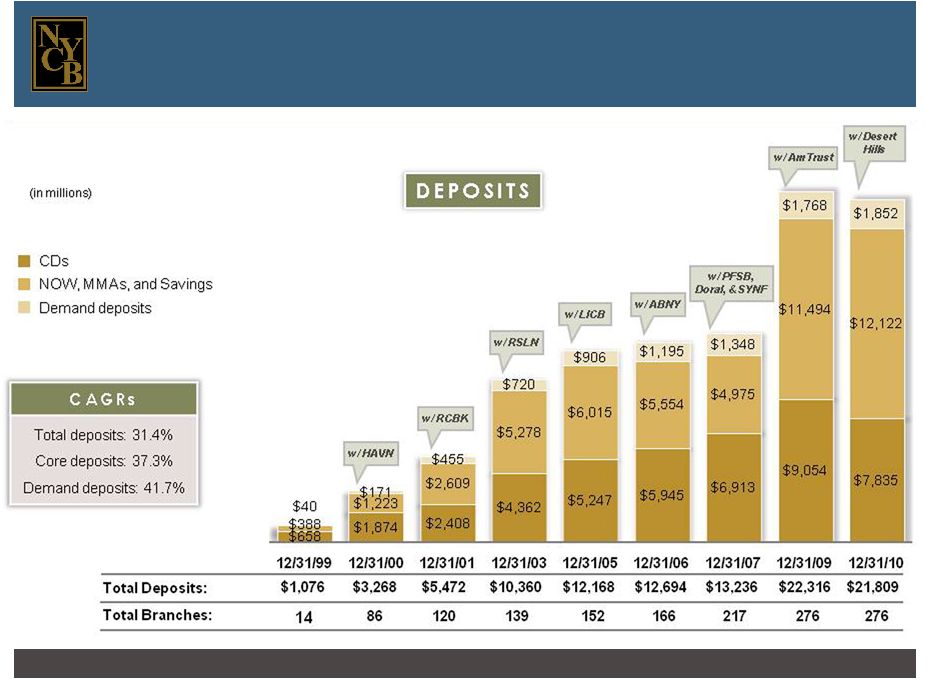 New York Community Bancorp, Inc. Page 15 Our deposit growth has been largely acquisition- driven. |
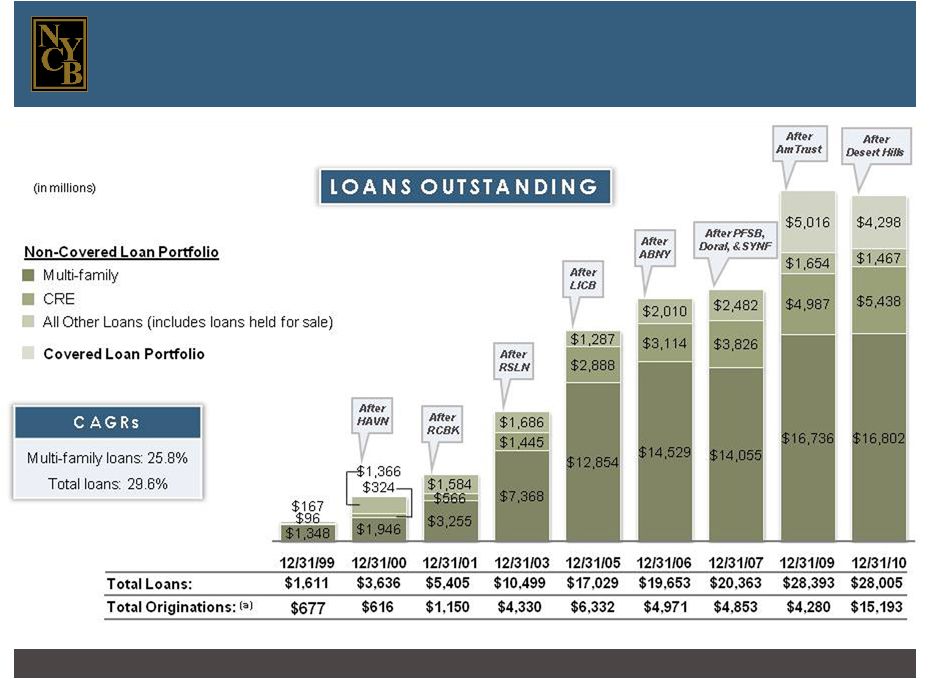 New York Community Bancorp, Inc. Page 16 (a) Originations of loans held for sale totaled $888.5 million in 2009 and $10.8 billion in 2010. Acquisitions have provided much of the funding for the organic growth of our loan portfolio. |
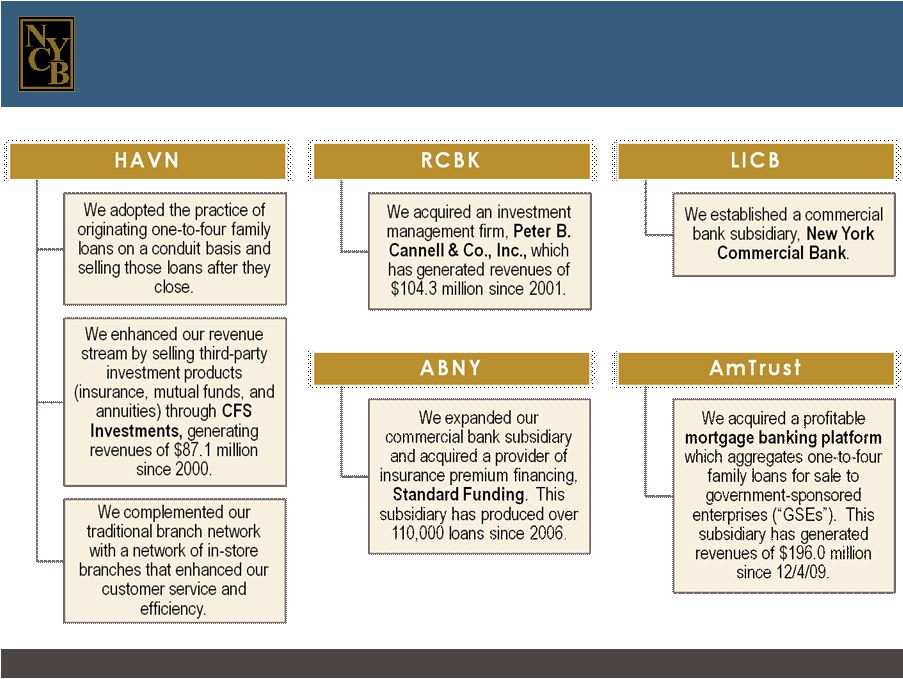 New York Community Bancorp, Inc. Page 17 We have capitalized on opportunities for revenue growth stemming from our acquisitions. |
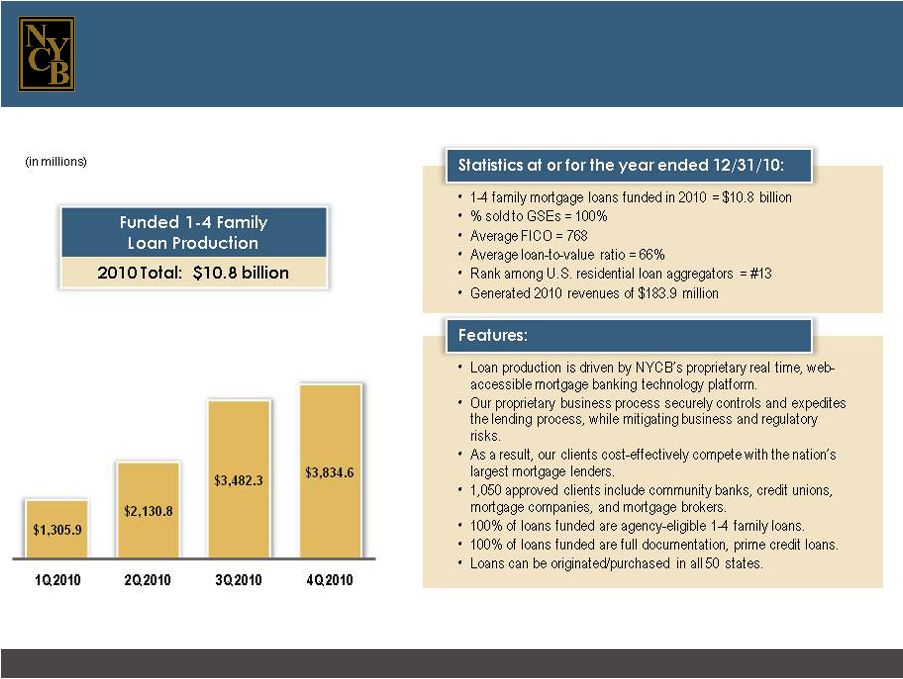 New York Community Bancorp, Inc. Page 18 Our mortgage banking platform is a leading aggregator of agency-conforming one-to-four family residential loans. |
   Multi-Family Loan Production * * * * * * * * * * * * * * * * * * |
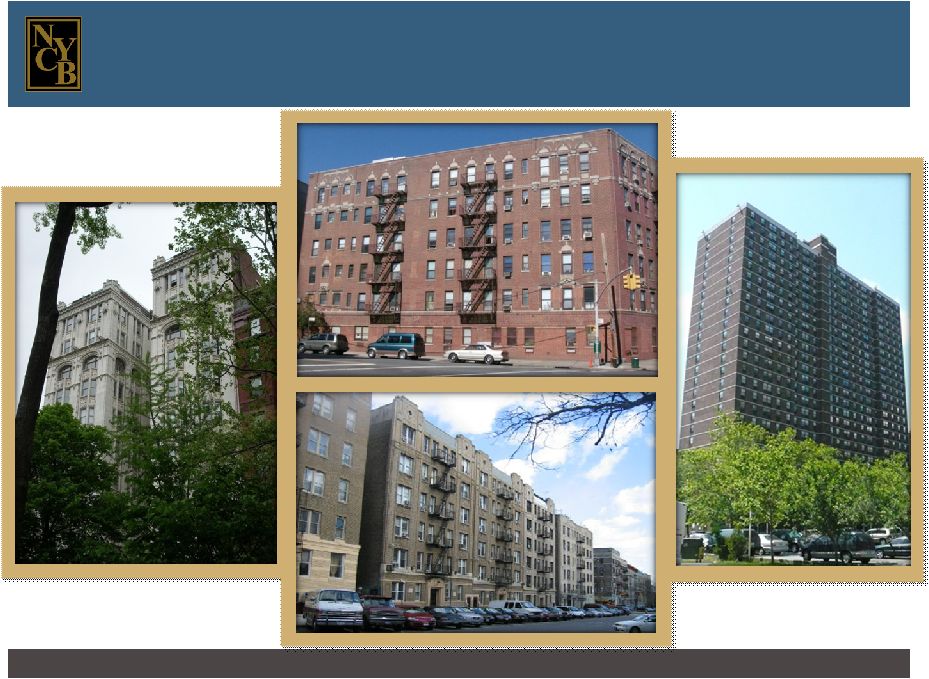 New York Community Bancorp, Inc. Page 20 For more than 40 years, we have been a leading producer of multi-family loans on apartment buildings in New York City, most of which feature below-market rents. |
 New York Community Bancorp, Inc. Page 21 Our focus on multi-family lending on rent-regulated buildings has enabled us to distinguish ourselves from our industry peers. 64.0% of the rental housing units in New York City are subject to rent regulation and therefore feature below-market rents. (a) Rent-regulated buildings are more likely to retain their tenants and therefore their revenue stream in a downward credit cycle. Our focus on multi-family lending in this niche market has contributed to our record of asset quality. Multi-family loans are less costly to produce and service than other types of loans, and therefore contribute to our superior efficiency. (a) Source: New York City Rent Guidelines Board 2010 Housing Supply Report |
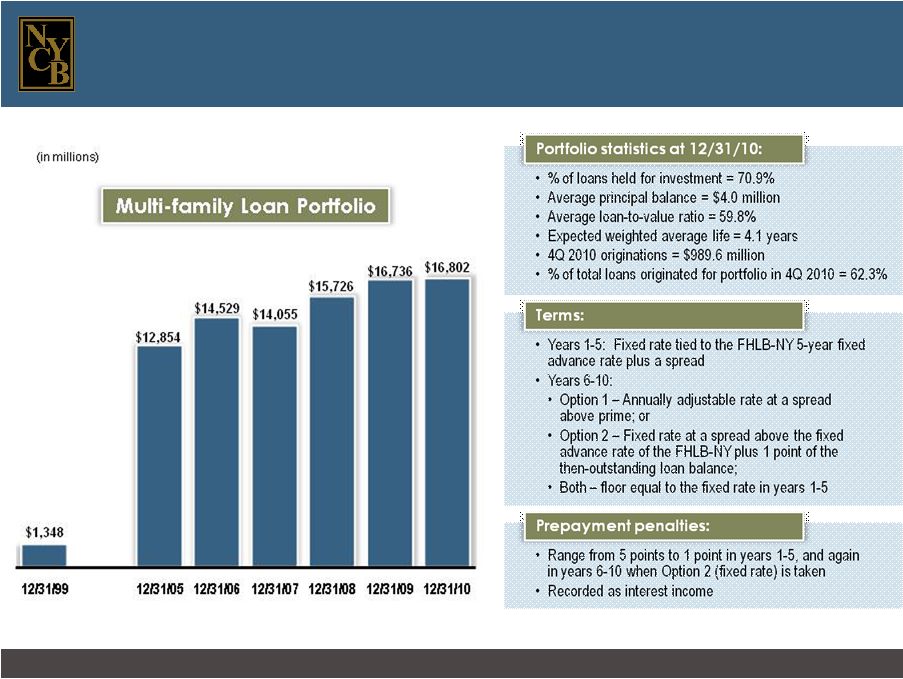 New York Community Bancorp, Inc. Page 22 Multi-family loans have grown at a CAGR of 25.8% since 12/31/99. |
 New York Community Bancorp, Inc. Page 23 Our commercial real estate loans feature the same structure as our multi-family loans. |
   Asset Quality * * * * * * * * * * * * * * * * * * |
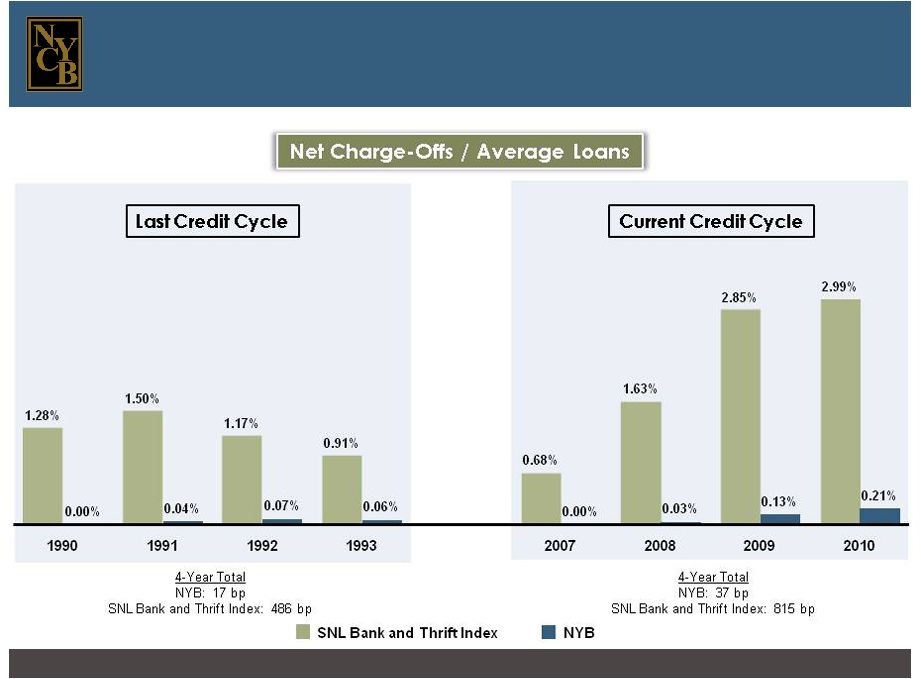 New York Community Bancorp, Inc. Page 25 Both historically and currently, we have been distinguished by our low level of net charge-offs. |
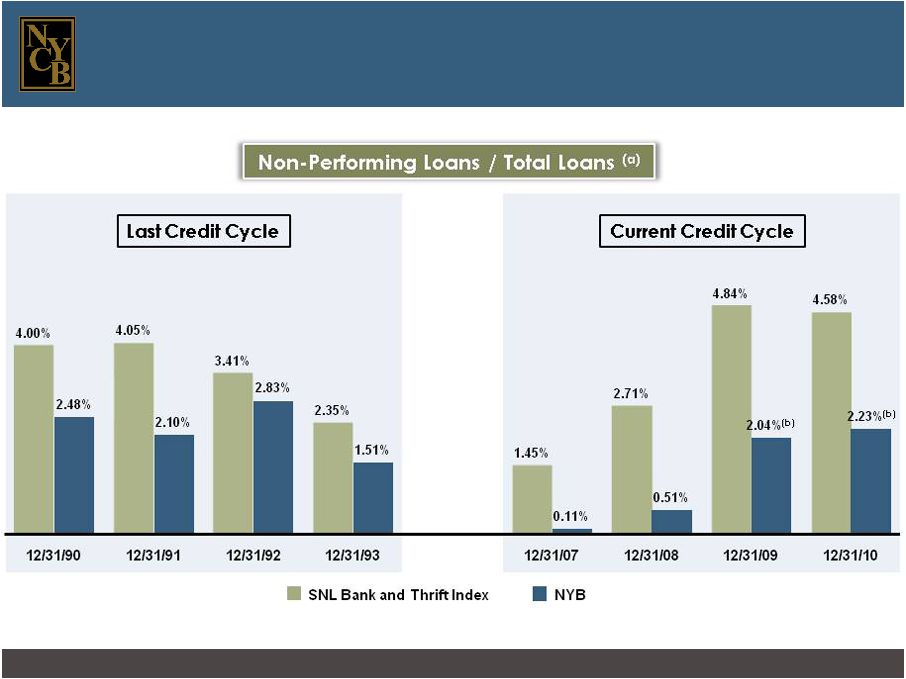 New York Community Bancorp, Inc. Page 26 The quality of our loan portfolio continues to exceed that of our industry, as it has in the past. (a) Non-performing loans are defined as non-accrual loans and loans 90 days or more past due but still accruing interest. (b) Non-performing loans exclude covered loans. |
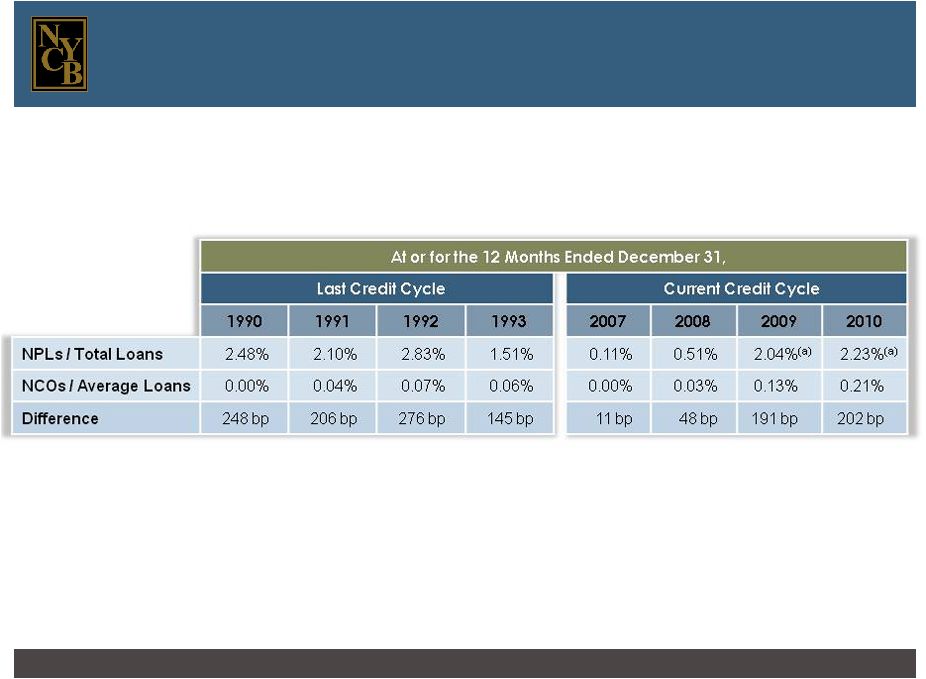 New York Community Bancorp, Inc. Page 27 Historically and currently, few of our non-performing loans have resulted in charge-offs. (a) Non-performing loans exclude covered loans. |
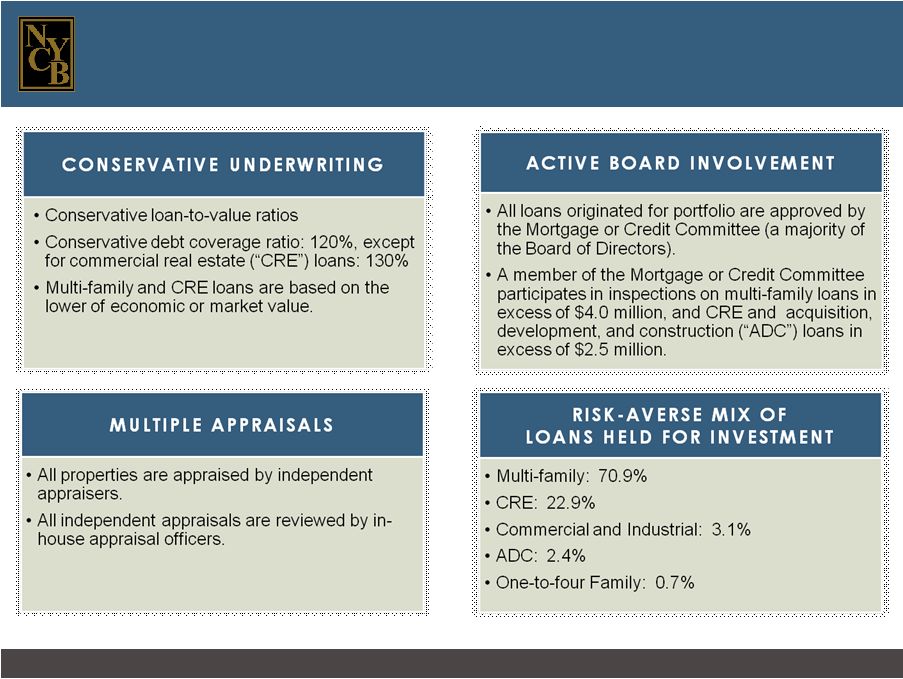 New York Community Bancorp, Inc. Page 28 The quality of our assets reflects the nature of our multi-family lending niche and our strong underwriting standards. |
  New York Community Bancorp, Inc. Page 29 All the loans acquired in the AmTrust and Desert Hills transactions are covered by FDIC loss sharing agreements, thus mitigating credit risk. (in millions) Total covered assets: $4.3 billion Covered Assets 12/31/10 1-4 Family $3,880.2 Other Loans $417.7 Percent of total assets: 10.4% OREO $62.4 |
   Efficiency * * * * * * * * * * * * * * * * * * |
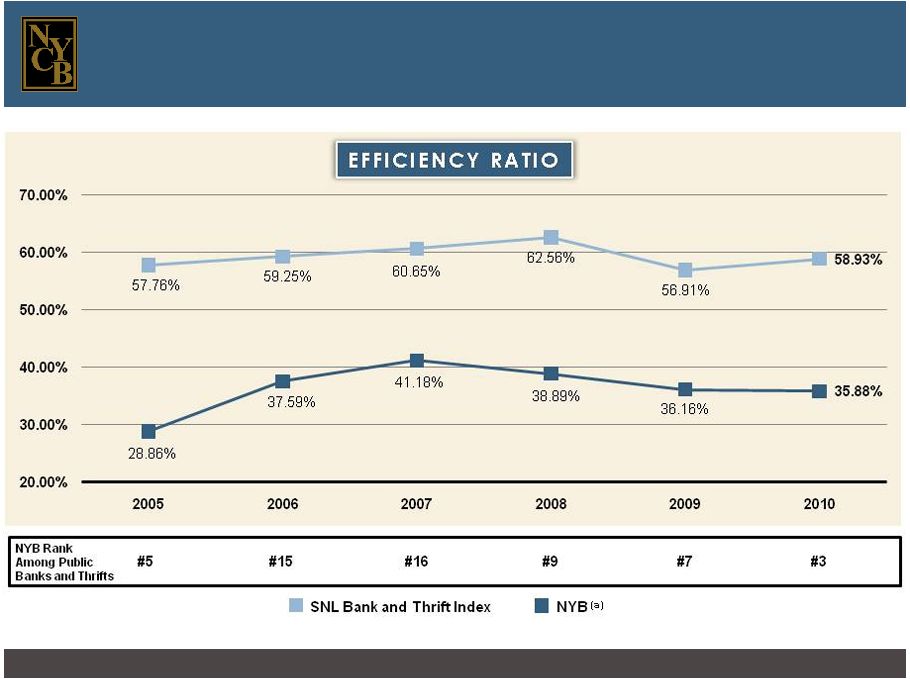 New York Community Bancorp, Inc. Page 31 Our operating efficiency ratio was 35.88% in 2010, well below the SNL Bank and Thrift Index efficiency ratio of 58.93%. (a) Please see page 37 for a reconciliation of our GAAP and operating efficiency ratios. |
 New York Community Bancorp, Inc. Page 32 Our efficiency is driven by several factors. Franchise expansion has largely stemmed from mergers and acquisitions; we generally do not engage in de novo branch development. Multi-family and commercial real estate lending are both broker-driven, with the borrower paying fees to the mortgage brokerage firm, rather than the bank. One-to-four family loans are originated in our branches on a pass-through basis, and sold shortly after closing, servicing-released. Products and services are typically developed by third-party providers and the sale of these products generates additional revenues. 43 of our branches are located in-store, where rental space is less costly, enabling us to supplement the service provided by our traditional branches more efficiently. We acquire our deposits primarily through earnings-accretive acquisitions rather than by paying above-market rates. |
   Total Return on Investment * * * * * * * * * * * * * * * * * * |
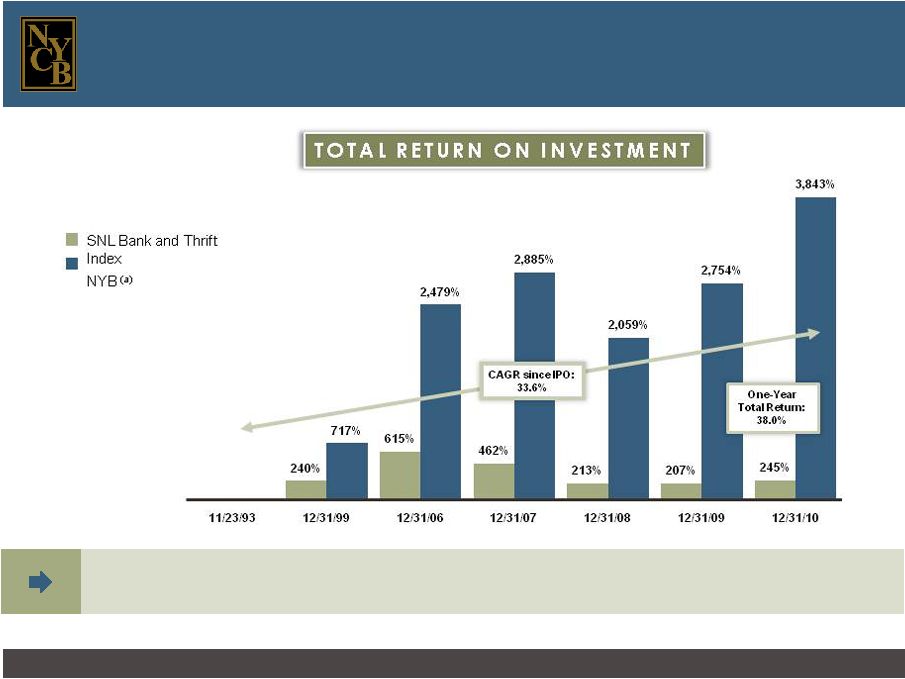 New York Community Bancorp, Inc. Page 34 We are committed to building value for our investors. (a) Bloomberg As a result of nine stock splits in a span of 10 years, our charter shareholders have 2,700 shares of NYB stock for each 100 shares originally purchased. |
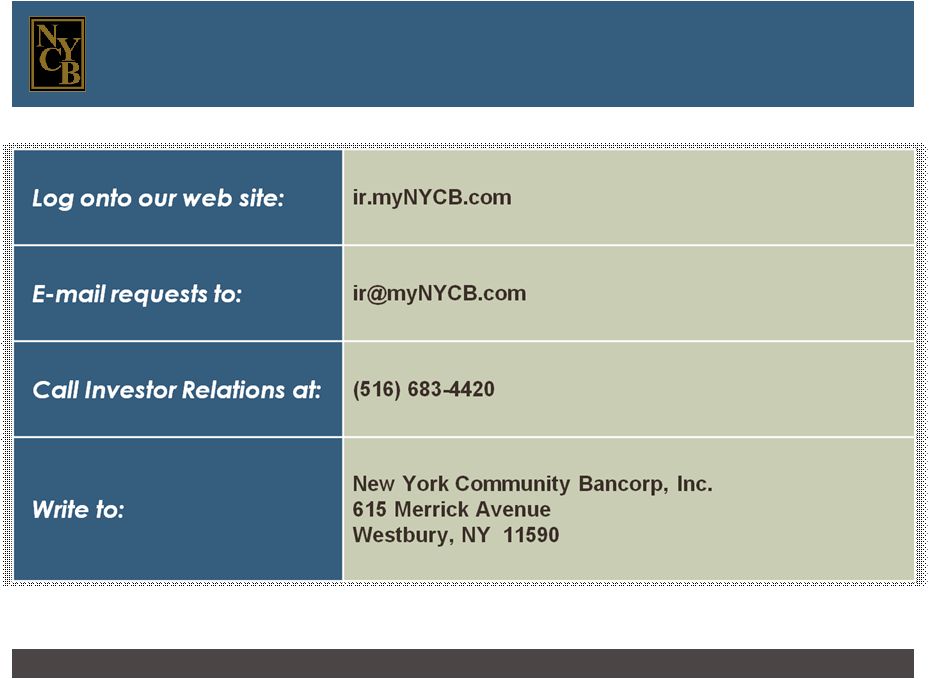 New York Community Bancorp, Inc. Page 35 1/28/2011 For More Information |
 New York Community Bancorp, Inc. Page 36 For the Three Months Ended December 31, 2010 2009 (dollars in thousands) GAAP Operating GAAP Operating Total non-interest income and net interest income $408,250 $408,250 $392,567 $392,567 Adjustments: Gain on sales of securities -- (22,438) -- -- Gain on debt repurchase -- -- -- (4,337) Loss on other-than-temporary impairment of securities -- -- -- 43,530 Gain on business acquisition -- -- -- (139,607) Gain on termination of servicing hedge -- -- -- (3,078) Adjusted total non-interest income and net interest income $408,250 $385,812 $392,567 $289,075 Operating expenses $140,632 $140,632 $108,098 $108,098 Adjustments: FDIC special assessment -- -- -- -- Acquisition-related costs -- (6,317) -- (5,185) Adjusted operating expenses $140,632 $134,315 $108,098 $102,913 Efficiency ratio 34.45% 34.81% 27.54% 35.60% Reconciliation of GAAP and Operating Efficiency Ratios The following table presents reconciliations of the Company’s GAAP and operating efficiency ratios for the three months ended December 31, 2010 and 2009. |
 New York Community Bancorp, Inc. Page 37 Reconciliation of GAAP and Operating Efficiency Ratios The following table presents reconciliations of the Company’s GAAP and operating efficiency ratios for the years ended December 31, 2005, 2006, 2007, 2008, 2009, and 2010. For the Years Ended December 31, 2010 2009 2008 2007 2006 2005 (dollars in thousands) GAAP Operating GAAP Operating GAAP Operating GAAP Operating GAAP Operating GAAP Operating Total net interest income and non-interest income $1,517,886 $1,517,886 $1,062,964 $1,062,964 $691,024 $691,024 $727,622 $727,622 $650,556 $650,556 $693,068 $693,068 Adjustments: Gain on debt repurchases/exchange -- (2,441) -- (10,054) -- -- -- -- -- -- -- -- Gain on business acquisitions -- (2,883) -- (139,607) -- -- -- -- -- -- -- -- Gain on termination of servicing hedge -- -- -- (3,078) -- -- -- -- -- -- -- -- Visa-related gain -- -- -- -- -- (1,647) -- -- -- -- -- -- Net gain on sales of securities -- (22,438) -- -- -- -- -- (1,888) -- -- -- -- Loss on mark-to-market of interest rate swaps -- -- -- -- -- -- -- -- -- 6,071 -- -- (Gain) loss on debt redemption -- -- -- -- -- (16,962) -- 1,848 -- 1,859 -- -- Loss on other-than-temporary impairment of securities -- -- -- 96,533 -- 104,317 -- 56,958 -- -- -- -- Balance sheet repositioning charge -- -- -- -- -- 39,647 -- -- -- -- -- -- Gain on sale of bank-owned property / branches -- -- -- -- -- -- -- (64,879) -- -- -- -- Adjusted total net interest income and non-interest income $1,517,886 $1,490,124 $1,062,964 $1,006,758 $691,024 $816,379 $727,622 $719,661 $650,556 $658,486 $693,068 $693,068 Operating expenses $546,246 $546,246 $384,003 $384,003 $320,818 $320,818 $299,575 $299,575 $256,362 $256,362 $236,621 $236,621 Adjustments: FDIC special assessment -- -- -- (14,753) -- -- -- -- -- -- -- -- Acquisition-related costs -- (11,545) -- (5,185) -- -- -- -- -- -- -- -- Merger-related charge -- -- -- -- -- -- -- (2,245) -- (5,744) -- (36,588) VISA litigation charge -- -- -- -- -- (3,365) -- (1,000) -- -- -- -- Retirement charge -- -- -- -- -- -- -- -- -- (3,072) -- -- Adjusted operating expenses $546,246 $534,701 $384,003 $364,065 $320,818 $317,453 $299,575 $296,330 $256,362 $247,546 $236,621 $200,033 Efficiency ratio 35.99% 35.88% 36.13% 36.16% 46.43% 38.89% 41.17% 41.18% 39.41% 37.59% 34.14% 28.86% |
 New York Community Bancorp, Inc. Page 38 The following table presents reconciliations of the Company’s GAAP and operating earnings for the three and twelve months ended December 31, 2010 and 2009. Reconciliation of GAAP and Operating Earnings For the Three Months Ended December 31, For the Twelve Months Ended December 31, (in thousands, except per share data) 2010 2009 2010 2009 GAAP Earnings $149,832 $ 154,936 $541,017 $ 398,646 Adjustments to GAAP earnings: Gain on sales of securities (22,438) -- (22,438) -- Gain on debt repurchases/exchange -- (4,337) (2,441) (10,054) Acquisition-related costs 6,317 7,530 11,545 7,530 Gain on business acquisitions -- (139,607) (2,883) (139,607) Loss on OTTI of securities -- 43,530 -- 96,533 FDIC special assessment -- -- -- 14,753 Gain on termination of servicing hedge -- (3,078) -- (3,078) Resolution of tax audits -- -- -- (14,337) Income tax effect 6,422 38,741 5,570 14,264 Operating earnings $140,133 $ 97,715 $530,370 $ 364,650 Diluted GAAP Earnings per Share $ 0.34 $ 0.41 $ 1.24 $ 1.13 Adjustments to diluted GAAP earnings per share: Gain on sales of securities (0.03) -- (0.03) -- Gain on debt repurchases/exchange -- (0.01) (0.01) (0.02) Acquisition-related costs 0.01 0.01 0.02 0.01 Gain on business acquisitions -- (0.22) (0.01) (0.24) Loss on OTTI of securities -- 0.07 -- 0.16 FDIC special assessment -- -- -- 0.03 Gain on termination of servicing hedge -- -- -- -- Resolution of tax audits -- -- -- (0.04) Diluted operating earnings per share $ 0.32 $ 0.26 $ 1.21 $ 1.03 |
 New York Community Bancorp, Inc. Page 39 The following table presents reconciliations of the Company’s GAAP and operating non-interest income and its GAAP and operating revenues for the three and twelve months ended December 31, 2010 and 2009. Reconciliation of GAAP and Operating Non-Interest Income and GAAP and Operating Revenues For the Three Months Ended December 31, For the Twelve Months Ended December 31, 2010 2009 2010 2009 (in thousands) GAAP Operating GAAP Operating GAAP Operating GAAP Operating Non-interest income $103,260 $103,260 $138,102 $ 138,102 $ 337,923 $ 337,923 $ 157,639 $ 157,639 Exclude: Gain on sales of securities -- (22,438) -- -- -- (22,438) -- -- Gain on debt repurchases/exchange -- -- -- (4,337) -- (2,441) -- (10,054) Gain on business acquisitions -- -- -- (139,607) -- (2,883) -- (139,607) Gain on termination of servicing hedge -- -- -- (3,078) -- -- -- (3,078) Add back: Loss on OTTI of securities -- -- -- 43,530 -- -- -- 96,533 Adjusted non-interest income $103,260 $ 80,822 $138,102 $ 34,610 $ 337,923 $ 310,161 $ 157,639 $ 101,433 Net interest income $304,990 $304,990 $254,465 $ 254,465 $1,179,963 $1,179,963 $ 905,325 $ 905,325 Revenues $408,250 $385,812 $392,567 $ 289,075 $1,517,886 $1,490,124 $1,062,964 $1,006,758 |
 New York Community Bancorp, Inc. Page 40 Reconciliation of GAAP and Non-GAAP Capital Measures December 31, December 31, (dollars in thousands) 2010 2009 Total stockholders’ equity $ 5,526,220 $ 5,366,902 Less: Goodwill (2,436,159) (2,436,401) Core deposit intangibles (77,734) (105,764) Tangible stockholders’ equity $ 3,012,327 $ 2,824,737 Total assets $41,190,689 $42,153,869 Less: Goodwill (2,436,159) (2,436,401) Core deposit intangibles (77,734) (105,764) Tangible assets $38,676,796 $39,611,704 Stockholders’ equity to total assets 13.42% 12.73% Tangible stockholders’ equity to tangible assets 7.79% 7.13% Tangible stockholders’ equity $3,012,327 $2,824,737 Accumulated other comprehensive loss, net of tax 45,695 49,903 Adjusted tangible stockholders’ equity $3,058,022 $2,874,640 Tangible assets $38,676,796 $39,611,704 Accumulated other comprehensive loss, net of tax 45,695 49,903 Adjusted tangible assets $38,722,491 $39,661,607 Adjusted tangible stockholders’ equity to adjusted tangible assets 7.90% 7.25% The following table presents reconciliations of the Company’s stockholders’ equity, tangible stockholders’ equity, and adjusted tangible stockholders’ equity; total assets, tangible assets, and adjusted tangible assets; and the related capital measures at December 31, 2010 and 2009. |