Second Quarter 2011 Investor Presentation
Forward-looking Statements and Associated Risk Factors
Safe Harbor Provisions of the Private Securities Litigation Reform Act of 1995
This presentation, like many written and oral communications presented by New York Community Bancorp, Inc. and our authorized officers, may contain certain forward-looking statements regarding our prospective performance and strategies within the meaning of Section 27A of the Securities Act of 1933, as amended, and Section 21E of the Securities Exchange Act of 1934, as amended. We intend such forward-looking statements to be covered by the safe harbor provisions for forward-looking statements contained in the Private Securities Litigation Reform Act of 1995, and are including this statement for purposes of said safe harbor provisions.
Forward-looking statements, which are based on certain assumptions and describe future plans, strategies, and expectations of the Company, are generally identified by use of the words “anticipate,” “believe,” “estimate,” “expect,” “intend,” “plan,” “project,” “seek,” “strive,” “try,” or future or conditional verbs such as “will,” “would,” “should,” “could,” “may,” or similar expressions. Our ability to predict results or the actual effects of our plans or strategies is inherently uncertain. Accordingly, actual results may differ materially from anticipated results.
There are a number of factors, many of which are beyond our control, that could cause actual conditions, events, or results to differ significantly from those described in the forward-looking statements. These factors include, but are not limited to: general economic conditions, either nationally or in some or all of the areas in which we and our customers conduct our respective businesses; conditions in the securities markets and real estate markets or the banking industry; changes in interest rates, which may affect our net income, prepayment penalty income, and other future cash flows, or the market value of our assets, including our investment securities; changes in deposit flows and wholesale borrowing facilities; changes in the demand for deposit, loan, and investment products and other financial services in the markets we serve; changes in our credit ratings or in our ability to access the capital markets; changes in our customer base or in the financial or operating performances of our customers’ businesses; changes in real estate values, which could impact the quality of the assets securing the loans in our portfolio; changes in the quality or composition of our loan or securities portfolios; changes in competitive pressures among financial institutions or from non-financial institutions; the ability to successfully integrate any assets, liabilities, customers, systems, and management personnel we may acquire into our operations, and our ability to realize related revenue synergies and cost savings within expected time frames; our use of derivatives to mitigate our interest rate exposure; our ability to retain key members of management; our timely development of new lines of business and competitive products or services in a changing environment, and the acceptance of such products or services by our customers; any breach in performance by the Community Bank under our loss sharing agreements with the FDIC; any interruption or breach of security resulting in failures or disruptions in customer account management, general ledger, deposit, loan, or other systems; any interruption in customer service due to circumstances beyond our control; potential exposure to unknown or contingent liabilities of companies we have acquired or target for acquisition; the outcome of pending or threatened litigation, or of other matters before regulatory agencies, whether currently existing or commencing in the future; changes in our estimates of future reserves based upon the periodic review thereof under relevant regulatory and accounting requirements; changes in our capital management policies, including those regarding business combinations, dividends, and share repurchases, among others; changes in legislation, regulation, policies, or administrative practices, whether by judicial, governmental, or legislative action, including, but not limited to, the impact of the Dodd-Frank Wall Street Reform and Consumer Protection Act, and other changes pertaining to banking, securities, taxation, rent regulation and housing, environmental protection, and insurance, and the ability to comply with such changes in a timely manner; additional FDIC special assessments or required assessment prepayments; changes in accounting principles, policies, practices, or guidelines; environmental conditions that exist or may exist on properties owned by, leased by, or mortgaged to the Company; operational issues stemming from, and/or capital spending necessitated by, the potential need to adapt to industry changes in information technology systems, on which we are highly dependent; the ability to keep pace with, and implement on a timely basis, technological changes; changes in the monetary and fiscal policies of the U.S. Government, including policies of the U.S. Department of the Treasury and the Board of Governors of the Federal Reserve System; war or terrorist activities; and other economic, competitive, governmental, regulatory, and geopolitical factors affecting our operations, pricing, and services.
For a discussion of these and other risks that may cause actual results to differ from expectations, please refer to our Annual Report on Form 10-K for the year ended December 31, 2010, including the section entitled “Risk Factors,” and our Quarterly Report on Form 10-Q for the quarter ended March 31, 2011, on file with the U.S. Securities and Exchange Commission (the “SEC”).
In addition, it should be noted that we routinely evaluate opportunities to expand through acquisition and frequently conduct due diligence activities in connection with such opportunities. As a result, acquisition discussions and, in some cases, negotiations, may take place at any time, and acquisitions involving cash, debt, or equity securities may occur.
Furthermore, the timing and occurrence or non-occurrence of events may be subject to circumstances beyond our control.
Readers are cautioned not to place undue reliance on the forward-looking statements contained herein, which speak only as of the date of this presentation. Except as required by applicable law or regulation, we undertake no obligation to update these forward-looking statements to reflect events or circumstances that occur after the date on which such statements were made.
Page 2 New York Community Bancorp, Inc.
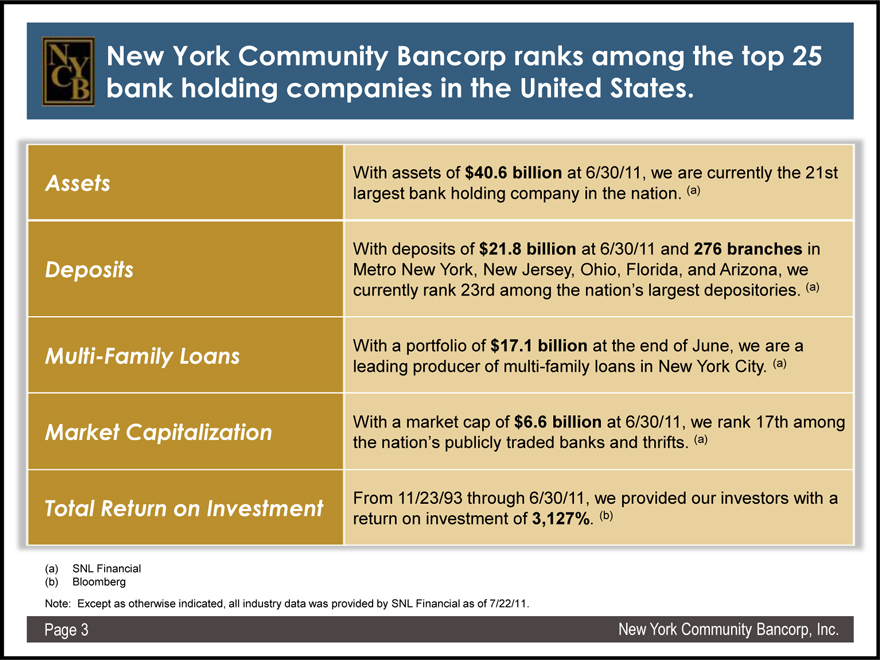
New York Community Bancorp ranks among the top 25 bank holding companies in the United States.
Assets With assets of $40.6 billion at 6/30/11, we are currently the 21st largest bank holding company in the nation. (a)
With deposits of $21.8 billion at 6/30/11 and 276 branches in Deposits Metro New York, New Jersey, Ohio, Florida, and Arizona, we currently rank 23rd among the nation’s largest depositories. (a)
Multi-Family Loans With a portfolio of $17.1 billion at the end of June, we are a leading producer of multi-family loans in New York City. (a)
Market Capitalization With a market cap of $6.6 billion at 6/30/11, we rank 17th among the nation’s publicly traded banks and thrifts. (a)
Total Return on Investment From 11/23/93 through 6/30/11, we provided our investors with a return on investment of 3,127%. (b)
(a) | | SNL Financial (b) Bloomberg |
Note: Except as otherwise indicated, all industry data was provided by SNL Financial as of 7/22/11.
Page 3 New York Community Bancorp, Inc.
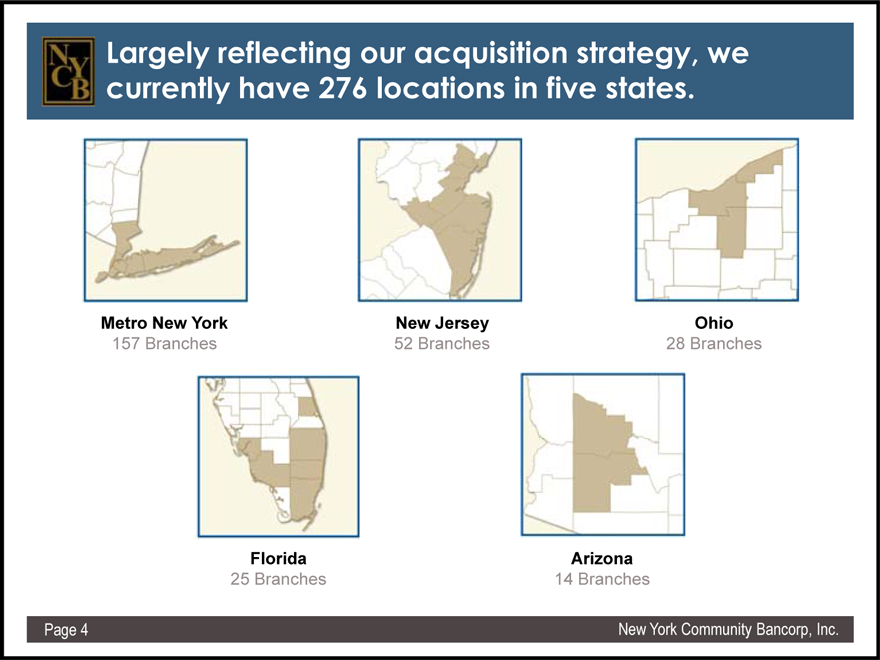
Largely reflecting our acquisition strategy, we currently have 276 locations in five states.
Metro New York New Jersey Ohio
157 Branches 52 Branches 28 Branches
Florida Arizona
25 Branches 14 Branches
Page 4 New York Community Bancorp, Inc.
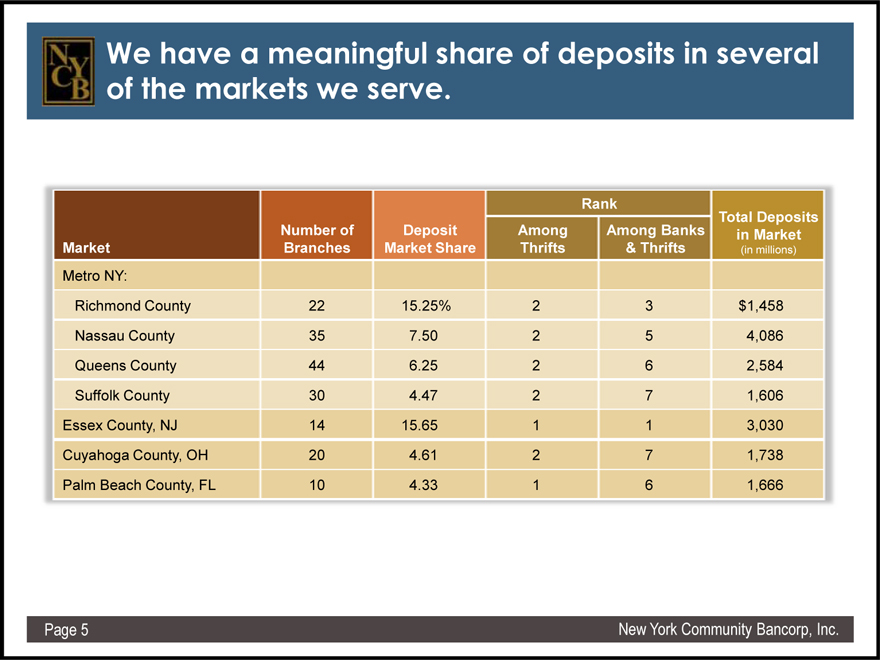
We have a meaningful share of deposits in several of the markets we serve.
Rank
Market Number of Branches Deposit Market Share Total Deposits in Market (in millions) Among Thrifts Among Banks & Thrifts Metro NY:
Richmond County 22 15.25% 2 3 $1,458
Nassau County 35 7.50 2 5 4,086
Queens County 44 6.25 2 6 2,584
Suffolk County 30 4.47 2 7 1,606
Essex County, NJ 14 15.65 1 1 3,030
Cuyahoga County, OH 20 4.61 2 7 1,738
Palm Beach County, FL 10 4.33 1 6 1,666
Page 5 New York Community Bancorp, Inc.
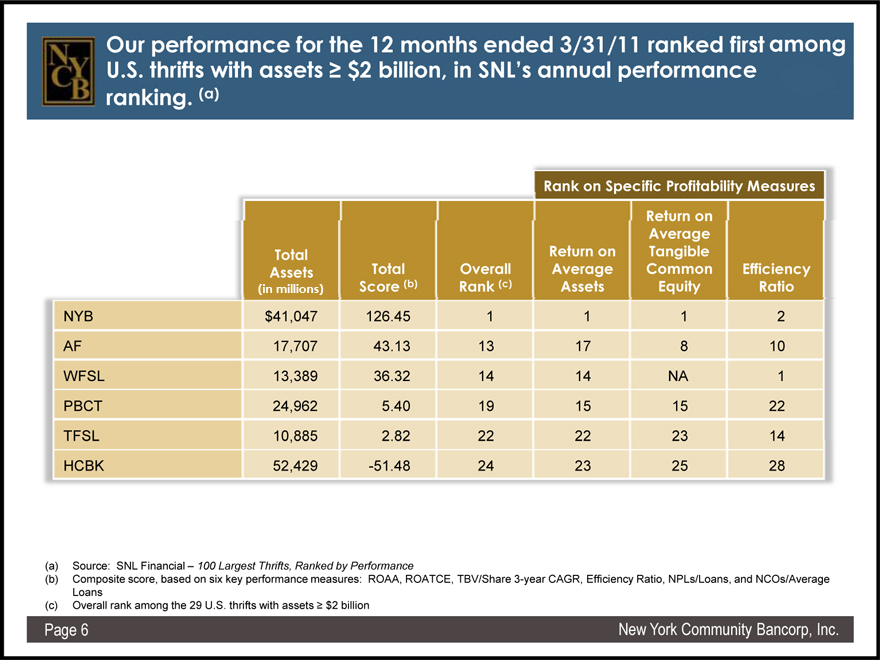
Our performance for the 12 months ended 3/31/11 ranked first among U.S. thrifts with assets³ $2 billion, in SNL’s annual performance ranking. (a)
Rank on Specific Profitability Measures Return on Average Return on Tangible Total (in millions) Total Overall Average Common Efficiency Assets Score (b) Rank (c) Assets Equity Ratio
NYB $41,047 126.45 1 1 1 2
AF 17,707 43.13 13 17 8 10
WFSL 13,389 36.32 14 14 NA 1
PBCT 24,962 5.40 19 15 15 22
TFSL 10,885 2.82 22 22 23 14
HCBK 52,429 -51.48 24 23 25 28
(a) | | Source: SNL Financial – 100 Largest Thrifts, Ranked by Performance |
(b) Composite score, based on six key performance measures: ROAA, ROATCE, TBV/Share 3-year CAGR, Efficiency Ratio, NPLs/Loans, and NCOs/Average Loans (c) Overall rank among the 29 U.S. thrifts with assets³ $2 billion
Page 6 New York Community Bancorp, Inc.
2nd Quarter 2011 Performance Highlights
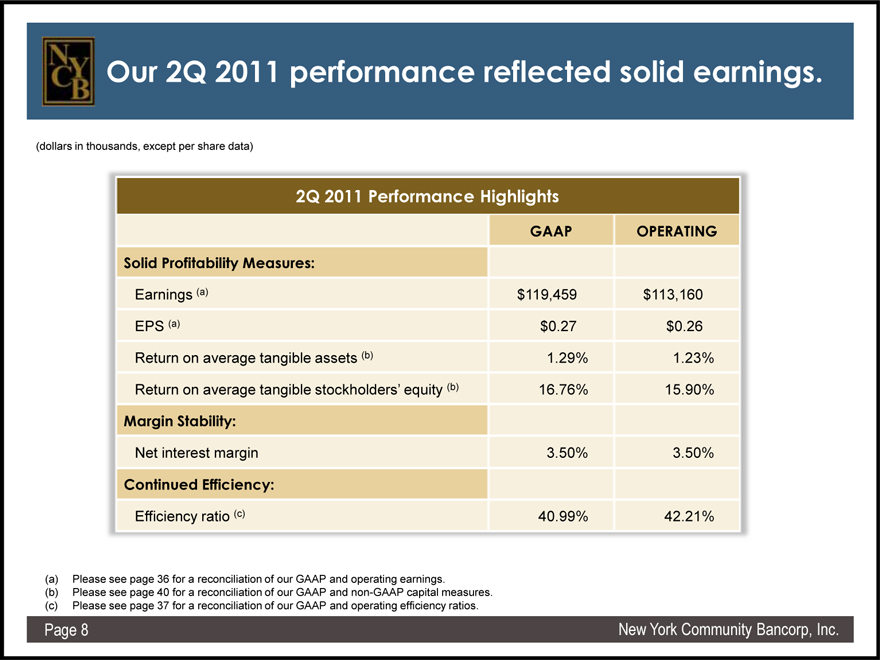
Our 2Q 2011 performance reflected solid earnings.
(dollars in thousands, except per share data)
2Q 2011 Performance Highlights
GAAP OPERATING Solid Profitability Measures:
Earnings (a) $119,459 $113,160
EPS (a) $0.27 $0.26
Return on average tangible assets (b) 1.29% 1.23%
Return on average tangible stockholders’ equity (b) 16.76% 15.90%
Margin Stability:
Net interest margin 3.50% 3.50%
Continued Efficiency:
Efficiency ratio (c) 40.99% 42.21%
(a) | | Please see page 36 for a reconciliation of our GAAP and operating earnings. |
(b) Please see page 40 for a reconciliation of our GAAP and non-GAAP capital measures. (c) Please see page 37 for a reconciliation of our GAAP and operating efficiency ratios.
Page 8 New York Community Bancorp, Inc.
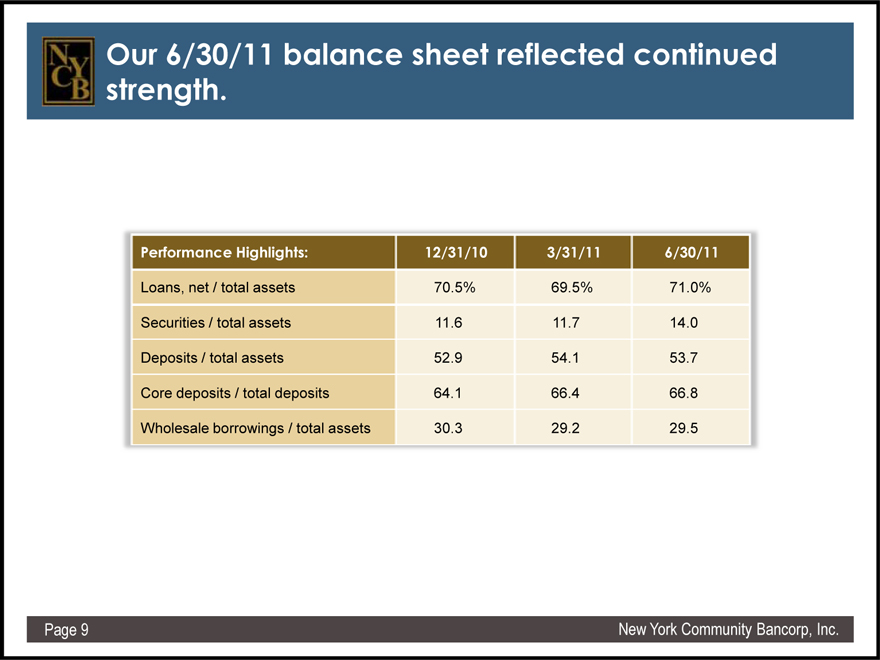
Our 6/30/11 balance sheet reflected continued strength.
Performance Highlights: 12/31/10 3/31/11 6/30/11
Loans, net / total assets 70.5% 69.5% 71.0%
Securities / total assets 11.6 11.7 14.0
Deposits / total assets 52.9 54.1 53.7
Core deposits / total deposits 64.1 66.4 66.8
Wholesale borrowings / total assets 30.3 29.2 29.5
Page 9 New York Community Bancorp, Inc.
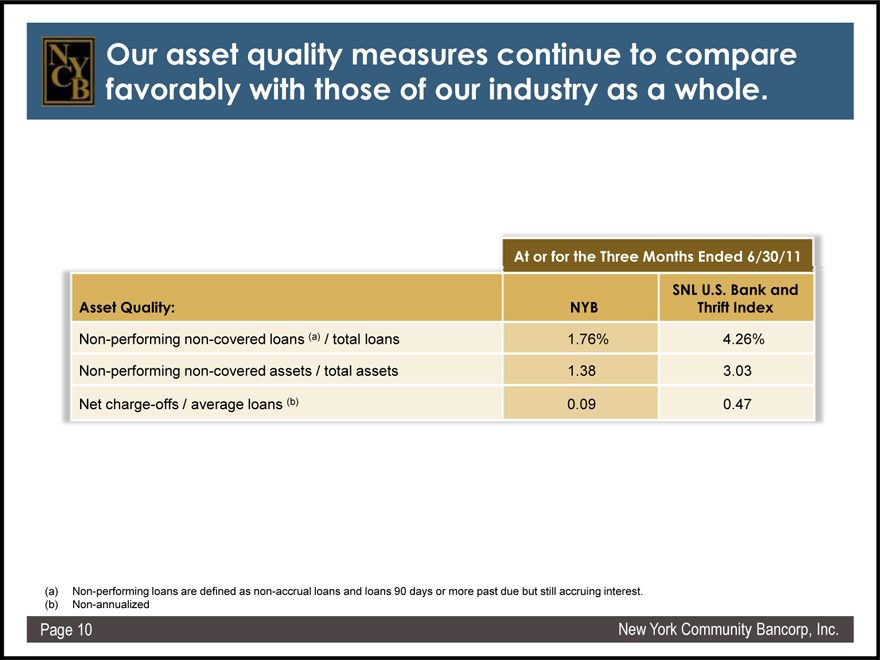
Our asset quality measures continue to compare favorably with those of our industry as a whole.
At or for the Three Months Ended 6/30/11
SNL U.S. Bank and Asset Quality: NYB Thrift Index
Non-performing non-covered loans (a) / total loans 1.76% 4.26% Non-performing non-covered assets / total assets 1.38 3.03
Net charge-offs / average loans (b) 0.09 0.47
(a) Non-performing loans are defined as non-accrual loans and loans 90 days or more past due but still accruing interest. (b) Non-annualized
Page 10 New York Community Bancorp, Inc.
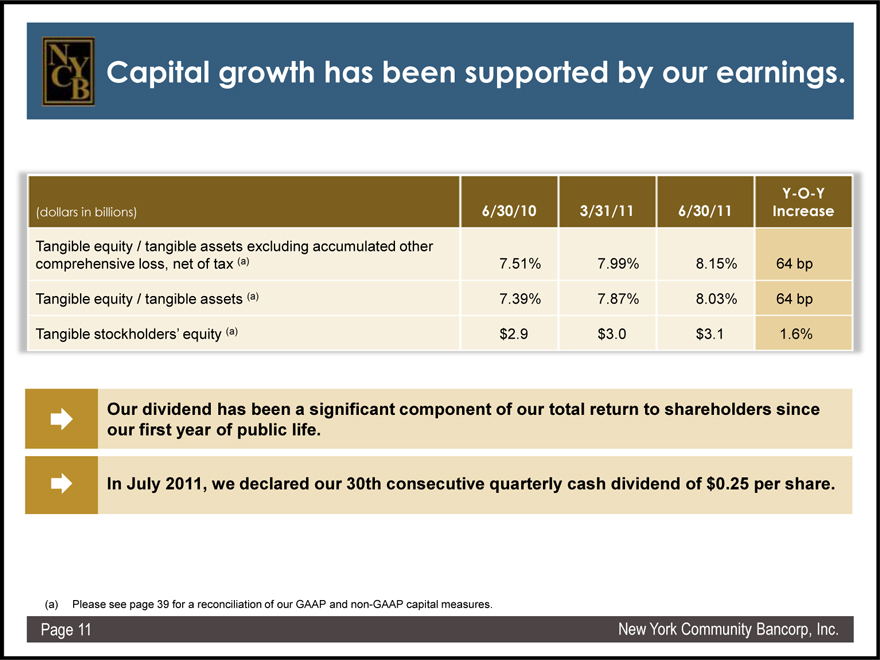
Capital growth has been supported by our earnings.
Y-O-Y (dollars in billions) 6/30/10 3/31/11 6/30/11 Increase
Tangible equity / tangible assets excluding accumulated other comprehensive loss, net of tax (a) 7.51% 7.99% 8.15% 64 bp
Tangible equity / tangible assets (a) 7.39% 7.87% 8.03% 64 bp
Tangible stockholders’ equity (a) $2.9 $3.0 $3.1 1.6%
Our dividend has been a significant component of our total return to shareholders since our first year of public life.
In July 2011, we declared our 30th consecutive quarterly cash dividend of $0.25 per share.
(a) | | Please see page 39 for a reconciliation of our GAAP and non-GAAP capital measures. |
Page 11 New York Community Bancorp, Inc.
A Successful Business Model
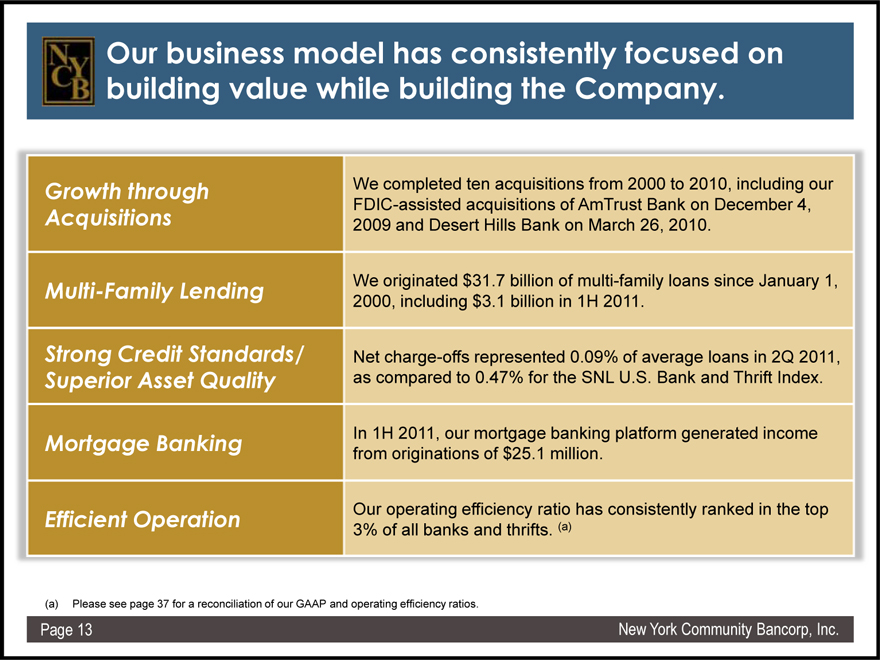
Our business model has consistently focused on building value while building the Company.
Growth through We completed ten acquisitions from 2000 to 2010, including our FDIC-assisted acquisitions of AmTrust Bank on December 4, Acquisitions 2009 and Desert Hills Bank on March 26, 2010.
Multi-Family Lending We originated $31.7 billion of multi-family loans since January 1, 2000, including $3.1 billion in 1H 2011.
Strong Credit Standards/ Net charge-offs represented 0.09% of average loans in 2Q 2011, Superior Asset Quality as compared to 0.47% for the SNL U.S. Bank and Thrift Index.
Mortgage Banking In 1H 2011, our mortgage banking platform generated income from originations of $25.1 million.
Efficient Operation Our operating efficiency ratio has consistently ranked in the top 3% of all banks and thrifts. (a)
(a) | | Please see page 37 for a reconciliation of our GAAP and operating efficiency ratios. |
Page 13 New York Community Bancorp, Inc.
Growth through Acquisitions
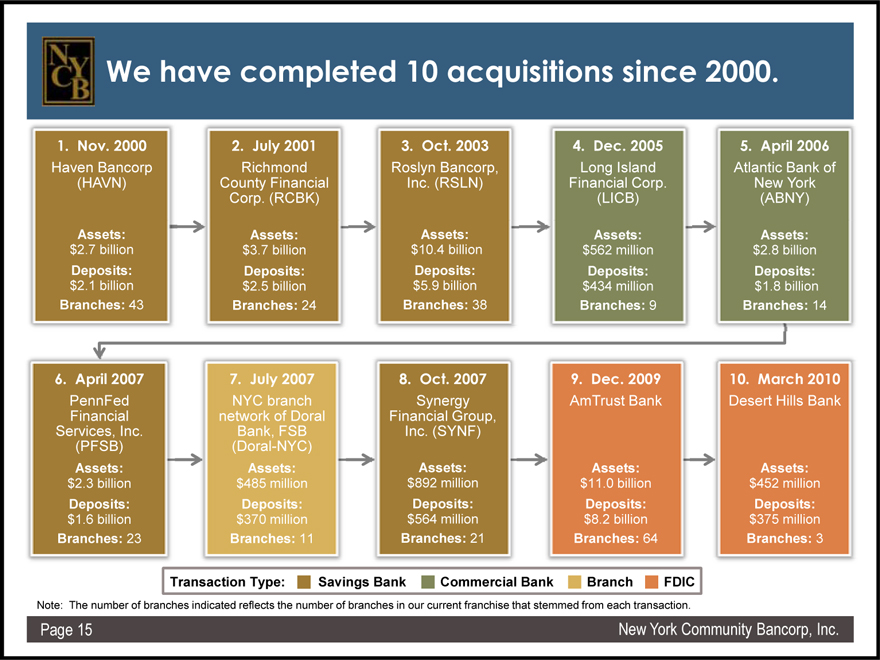
We have completed 10 acquisitions since 2000.
1. Nov. 2000 2. July 2001 3. Oct. 2003 4. Dec. 2005 5. April 2006
Haven (HAVN) Bancorp County Richmond Financial Roslyn Inc. (RSLN) Bancorp, Financial Long Island Corp. Atlantic New Bank York of Corp. (RCBK) (LICB) (ABNY)
Assets: Assets: Assets: Assets: Assets:
$2.7 billion $3.7 billion $10.4 billion $562 million $2.8 billion
Deposits: Deposits: Deposits: Deposits: Deposits:
$2.1 billion $2.5 billion $5.9 billion $434 million $1.8 billion
Branches: 43 Branches: 24 Branches: 38 Branches: 9 Branches: 14
6. April 2007 7. July 2007 8. Oct. 2007 9. Dec. 2009 10. March 2010
PennFed Financial network NYC branch of Doral Financial Synergy Group, AmTrust Bank Desert Hills Bank Services, (PFSB) Inc. (Doral Bank,- NYC) FSB Inc. (SYNF)
Assets: Assets: Assets: Assets: Assets:
$2.3 billion $485 million $892 million $11.0 billion $452 million
Deposits: Deposits: Deposits: Deposits: Deposits:
$1.6 billion $370 million $564 million $8.2 billion $375 million
Branches: 23 Branches: 11 Branches: 21 Branches: 64 Branches: 3
Transaction Type: Savings Bank Commercial Bank Branch FDIC
Note: The number of branches indicated reflects the number of branches in our current franchise that stemmed from each transaction.
Page 15 New York Community Bancorp, Inc.
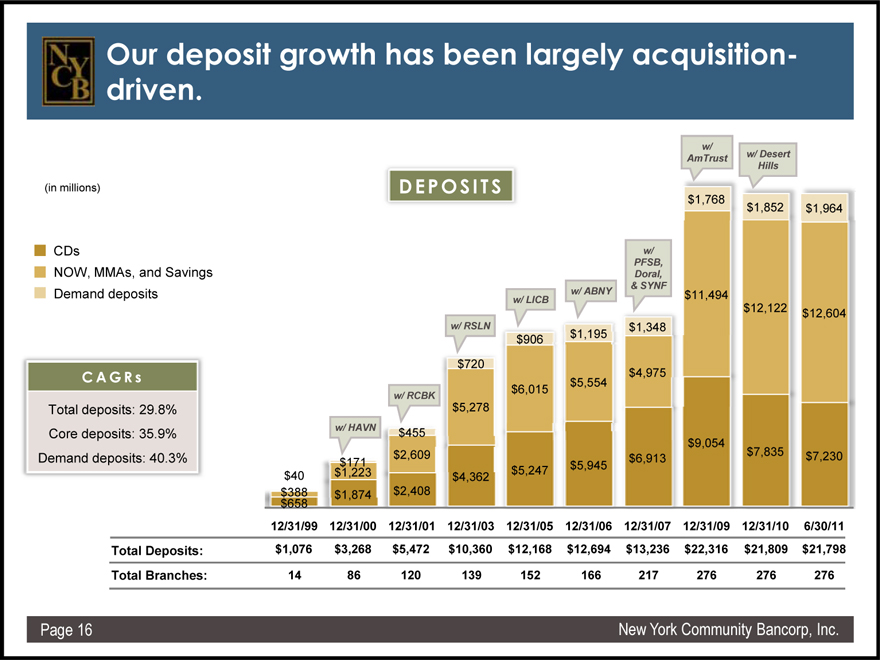
Our deposit growth has been largely acquisition-driven.
(in millions)
CDs
NOW, MMAs, and Savings Demand deposits
C A G R s
Total deposits: 29.8% Core deposits: 35.9% Demand deposits: 40.3%
w/
AmTrust w/ Desert Hills
DEPOSITS
$1,768 $1,852 $1,964
w/ PFSB, Doral,
& SYNF w/ ABNY $11,494 w/ LICB $12,122 $12,604 w/ RSLN $1,348 $906 $1,195 $720 $4,975 $5,554 $6,015 w/ RCBK $5,278 w/ HAVN $455
$9,054 $2,609 $7,835 $7,230 $171 $6,913 $5,247 $5,945
$40 $1,223 $4,362 $ $388 658 $1,874 $2,408
12/31/99 12/31/00 12/31/01 12/31/03 12/31/05 12/31/06 12/31/07 12/31/09 12/31/10 6/30/11
Total Deposits: $1,076 $3,268 $5,472 $10,360 $12,168 $12,694 $13,236 $22,316 $21,809 $21,798
Total Branches: 14 86 120 139 152 166 217 276 276 276
Page 16 New York Community Bancorp, Inc.
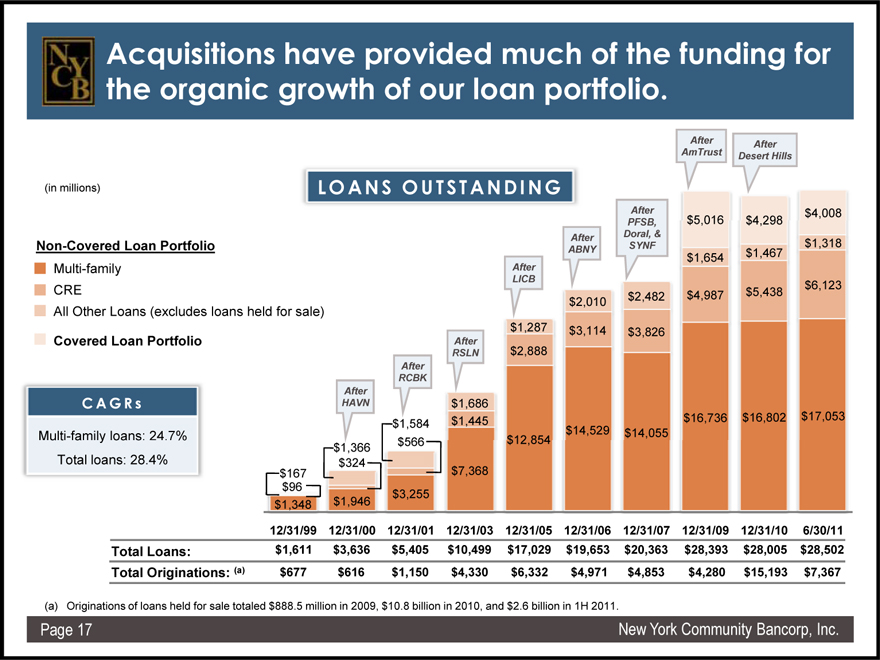
Acquisitions have provided much of the funding for the organic growth of our loan portfolio.
After After AmTrust Desert Hills
(in millions) LOANS OUTSTANDING
After $4,008
PFSB, $5,016 $4,298
After Doral, &
Non-Covered Loan Portfolio SYNF $1,318
ABNY $1,467 After $1,654 Multi-family LICB
CRE $6,123 $2,482 $4,987 $5,438 $2,010 All Other Loans (excludes loans held for sale) $1,287 $3,114 $3,826
Covered Loan Portfolio After
RSLN $2,888
After RCBK
After
C A G R s HAVN $1,686 $1,445 $16,736 $16,802 $17,053 $1,584 Multi -family loans: 24.7% $14,529 $14,055 $566 $12,854
Total loans: 28.4% $1,366 $324 $167 $7,368 $96 $3,255 $1,348 $1,946
12/31/99 12/31/00 12/31/01 12/31/03 12/31/05 12/31/06 12/31/07 12/31/09 12/31/10 6/30/11
Total Loans: $1,611 $3,636 $5,405 $10,499 $17,029 $19,653 $20,363 $28,393 $28,005 $28,502
Total Originations: (a) $677 $616 $1,150 $4,330 $6,332 $4,971 $4,853 $4,280 $15,193 $7,367
(a) Originations of loans held for sale totaled $888.5 million in 2009, $10.8 billion in 2010, and $2.6 billion in 1H 2011.
Page 17 New York Community Bancorp, Inc.
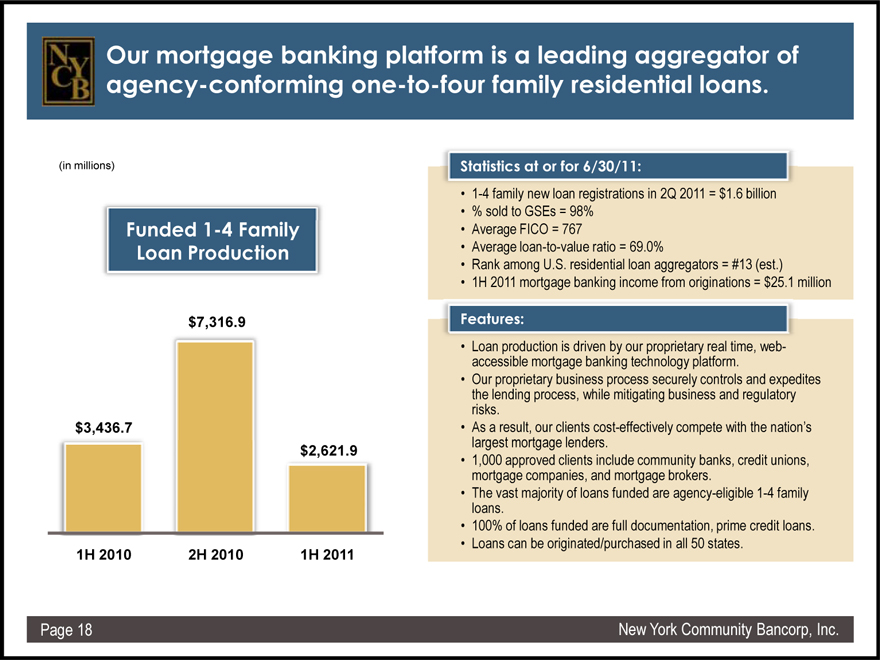
Our mortgage banking platform is a leading aggregator of agency-conforming one-to-four family residential loans.
(in millions)
Funded 1-4 Family Loan Production
$7,316.9
$3,436.7 $2,621.9
1H 2010 2H 2010 1H 2011
Statistics at or for 6/30/11:
• 1-4 family new loan registrations in 2Q 2011 = $1.6 billion
• % sold to GSEs = 98%
• Average FICO = 767
• Average loan-to-value ratio = 69.0%
• Rank among U.S. residential loan aggregators = #13 (est.)
• 1H 2011 mortgage banking income from originations = $25.1 million
Features:
• Loan accessible production mortgage is driven banking by our technology proprietary platform real time, . web-
• Our the lending proprietary process, business while process mitigating securely business controls and regulatory and expedites risks.
• As largest a result, mortgage our clients lenders cost . -effectively compete with the nation’s
• 1,000 mortgage approved companies, clients and include mortgage community brokers banks, . credit unions,
• The loans vast . majority of loans funded are agency-eligible 1-4 family
• 100% of loans funded are full documentation, prime credit loans.
• Loans can be originated/purchased in all 50 states.
Page 18 New York Community Bancorp, Inc.
Multi-Family Loan Production
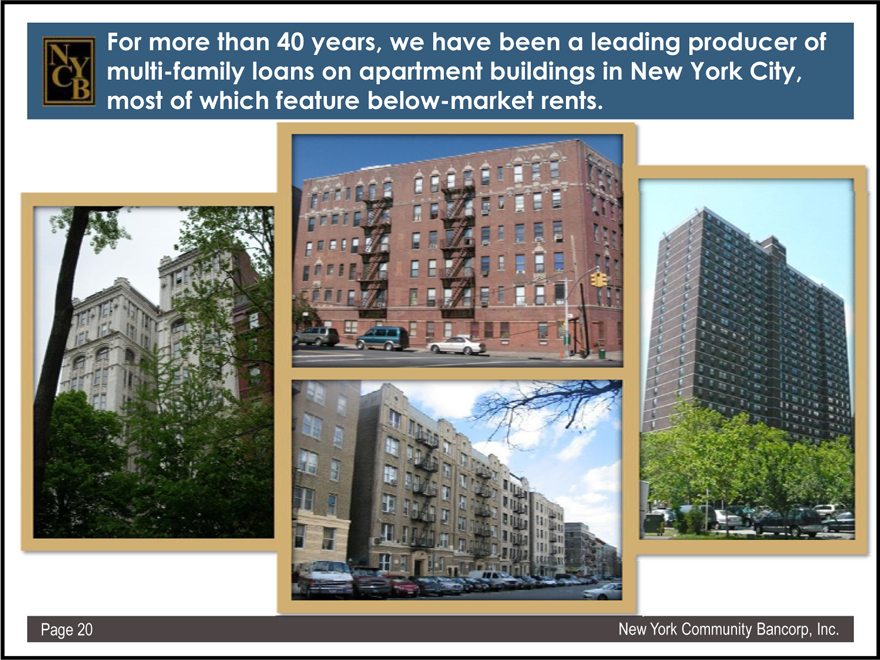
For more than 40 years, we have been a leading producer of multi-family loans on apartment buildings in New York City, most of which feature below-market rents.
Page 20 New York Community Bancorp, Inc.
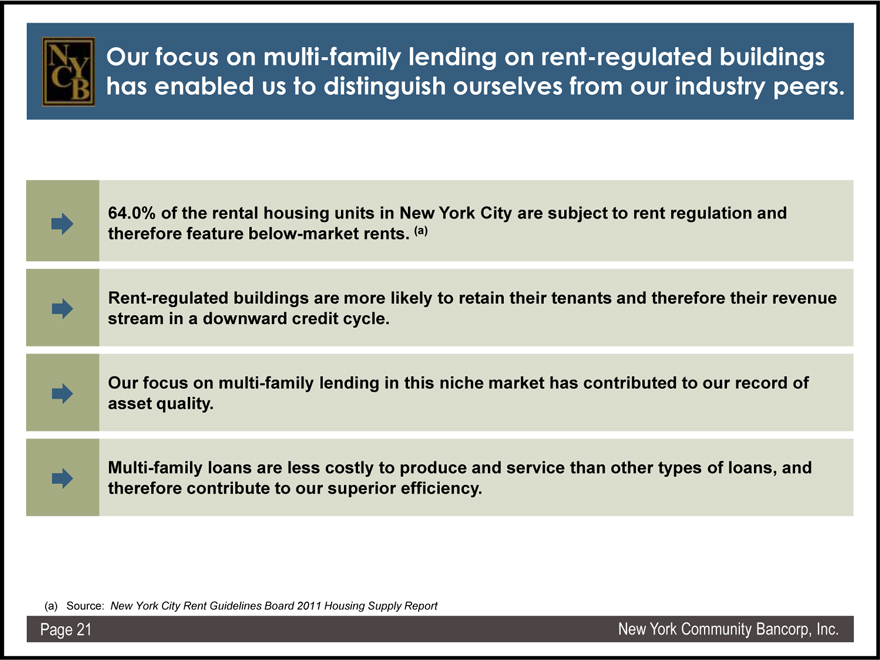
Our focus on multi-family lending on rent-regulated buildings has enabled us to distinguish ourselves from our industry peers.
64.0% of the rental housing units in New York City are subject to rent regulation and therefore feature below-market rents. (a)
Rent-regulated buildings are more likely to retain their tenants and therefore their revenue stream in a downward credit cycle.
Our focus on multi-family lending in this niche market has contributed to our record of asset quality.
Multi-family loans are less costly to produce and service than other types of loans, and therefore contribute to our superior efficiency.
(a) | | Source: New York City Rent Guidelines Board 2011 Housing Supply Report |
Page 21 New York Community Bancorp, Inc.
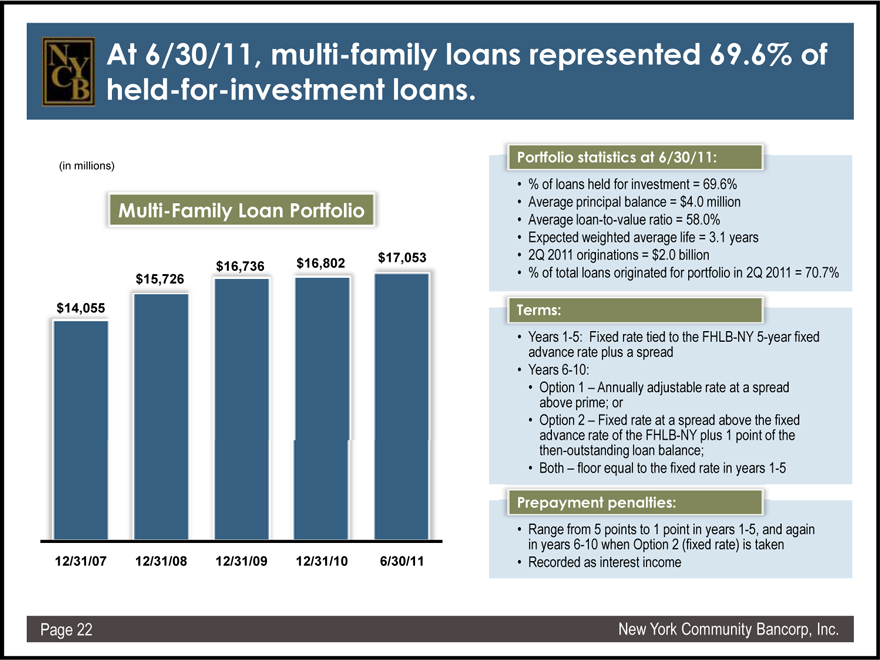
At 6/30/11, multi-family loans represented 69.6% of held-for-investment loans.
Portfolio statistics at 6/30/11:
(in millions)
• % of loans held for investment = 69.6% Multi-Family Loan Portfolio • Average principal balance = $4.0 million
• Average loan-to-value ratio = 58.0%
• Expected weighted average life = 3.1 years $17,053 • 2Q 2011 originations = $2.0 billion $16,736 $16,802 $15,726 • % of total loans originated for portfolio in 2Q 2011 = 70.7% $14,055 Terms:
• Years advance 1-5: rate Fixed plus rate a spread tied to the FHLB-NY 5-year fixed
• Years 6-10:
• Option above prime; 1 – Annually or adjustable rate at a spread
• Option advance 2 – Fixed rate of the rate FHLB at a -spread NY plus above 1 point the of fixed the then-outstanding loan balance;
• Both – floor equal to the fixed rate in years 1-5
Prepayment penalties:
• Range in years from 6-10 5 when points Option to 1 point 2 (fixed in years rate) 1 is -5, taken and again
12/31/07 12/31/08 12/31/09 12/31/10 6/30/11 • Recorded as interest income
Page 22 New York Community Bancorp, Inc.
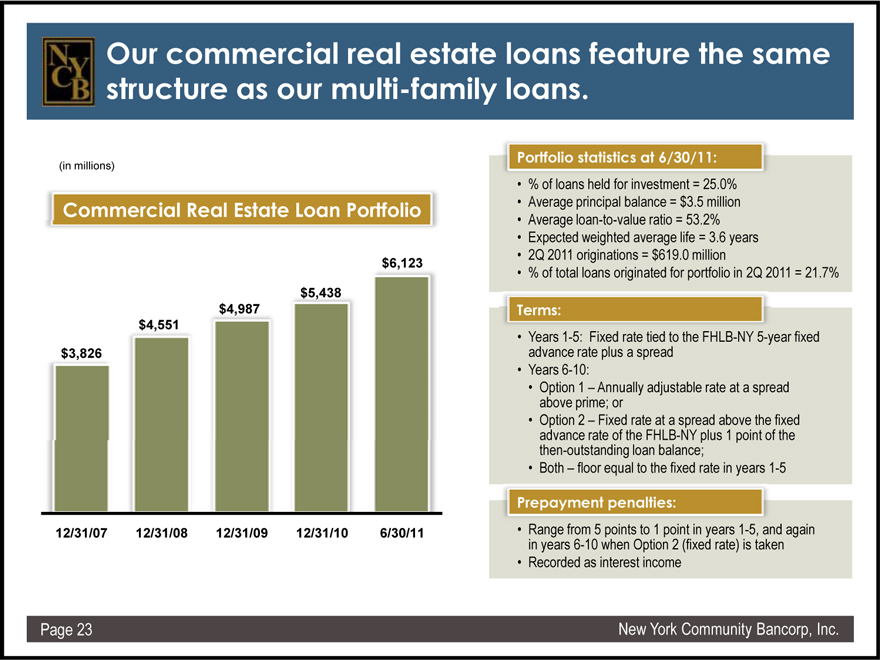
Our commercial real estate loans feature the same structure as our multi-family loans.
(in millions)
Commercial Real Estate Loan Portfolio
$6,123 $5,438 $4,987 $4,551 $3,826
12/31/07 12/31/08 12/31/09 12/31/10 6/30/11
Portfolio statistics at 6/30/11:
• % of loans held for investment = 25.0%
• Average principal balance = $3.5 million
• Average loan-to-value ratio = 53.2%
• Expected weighted average life = 3.6 years
• 2Q 2011 originations = $619.0 million
• % of total loans originated for portfolio in 2Q 2011 = 21.7%
Terms:
• Years advance 1-5: rate Fixed plus rate a spread tied to the FHLB-NY 5-year fixed
• Years 6-10:
• Option above prime; 1 – Annually or adjustable rate at a spread
• Option advance 2 – rate Fixed of the rate FHLB at a -spread NY plus above 1 point the of fixed the then-outstanding loan balance;
• Both – floor equal to the fixed rate in years 1-5
Prepayment penalties:
• Range in years from 6-10 5 when points Option to 1 point 2 (fixed in years rate) 1 is -5, taken and again
• Recorded as interest income
Page 23 New York Community Bancorp, Inc.
Asset Quality
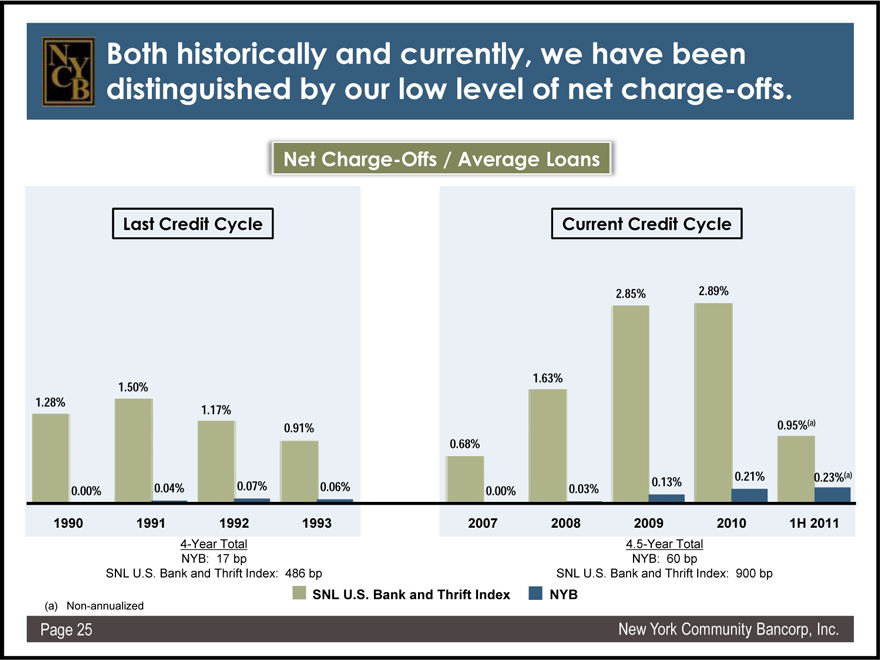
Both historically and currently, we have been distinguished by our low level of net charge-offs.
Net Charge-Offs / Average Loans
Last Credit Cycle
1.50%
1.28%
1.17%
0.91%
0.00% 0.04% 0.07% 0.06%
1990 1991 1992 1993
4-Year Total NYB: 17 bp
SNL U.S. Bank and Thrift Index: 486 bp
Current Credit Cycle
2.85% 2.89%
1.63%
0.95%(a)
0.68%
0.13% 0.21% 0.23%(a)
0.00% 0.03%
2007 2008 2009 2010 1H 2011
4.5-Year Total NYB: 60 bp
SNL U.S. Bank and Thrift Index: 900 bp
(a) | | Non-annualized SNL U.S. Bank and Thrift Index NYB |
Page 25 New York Community Bancorp, Inc.
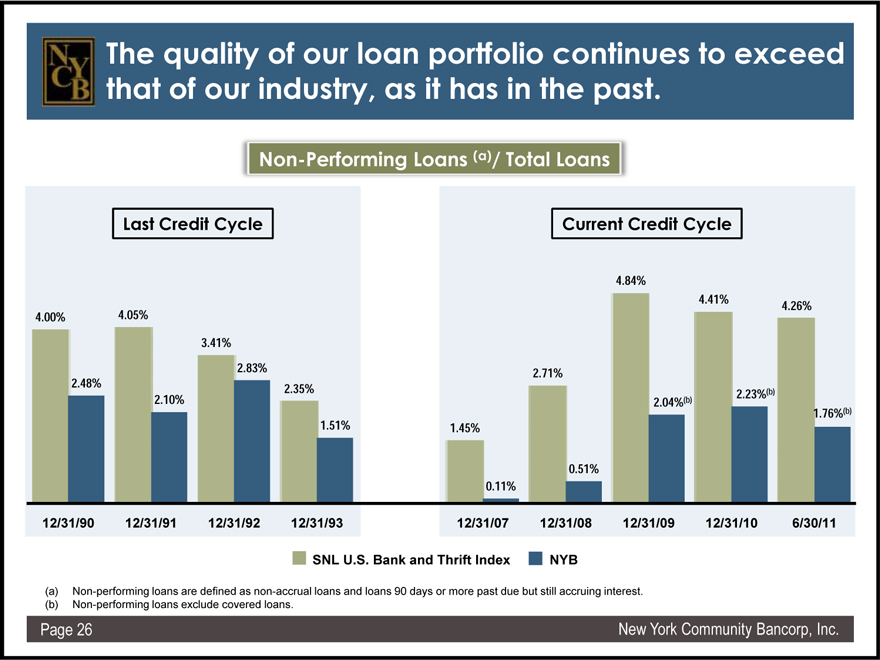
The quality of our loan portfolio continues to exceed that of our industry, as it has in the past.
Non-Performing Loans (a)/ Total Loans
Last Credit Cycle
4.00% 4.05%
3.41%
2.83%
2.48% 2.35%
2.10%
1.51%
12/31/90 12/31/91 12/31/92 12/31/93
Current Credit Cycle
4.84%
4.41%
4.26%
2.71%
2.04%(b) 2.23%(b)
1.76%(b)
1.45%
0.51%
0.11%
12/31/07 12/31/08 12/31/09 12/31/10 6/30/11
SNL U.S. Bank and Thrift Index NYB
(a) Non-performing loans are defined as non-accrual loans and loans 90 days or more past due but still accruing interest. (b) Non-performing loans exclude covered loans.
Page 26 New York Community Bancorp, Inc.
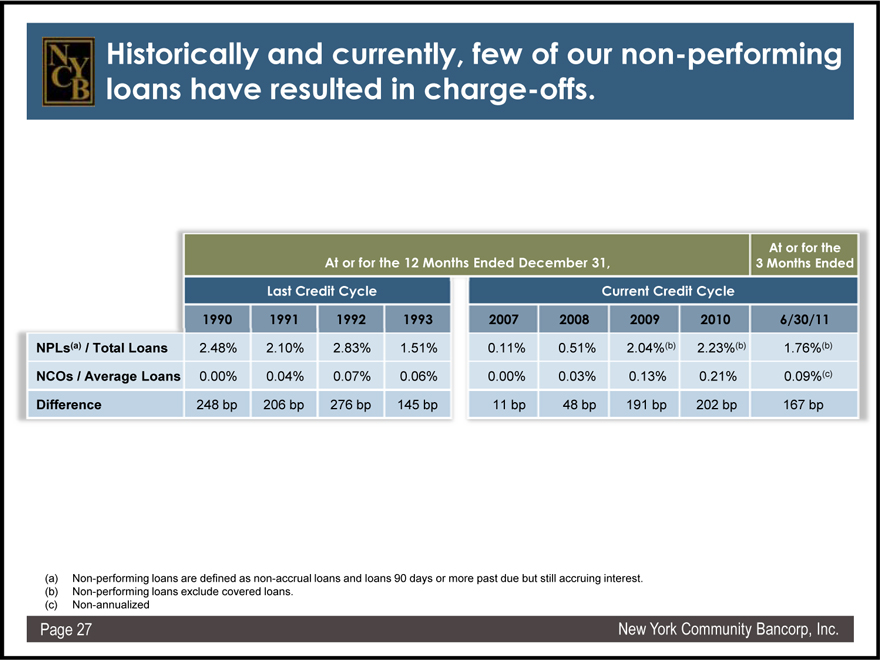
Historically and currently, few of our non-performing loans have resulted in charge-offs.
At or for the At or for the 12 Months Ended December 31, 3 Months Ended Last Credit Cycle Current Credit Cycle 1990 1991 1992 1993 2007 2008 2009 2010 6/30/11
NPLs(a) / Total Loans 2.48% 2.10% 2.83% 1.51% 0.11% 0.51% 2.04%(b) 2.23%(b) 1.76%(b) NCOs / Average Loans 0.00% 0.04% 0.07% 0.06% 0.00% 0.03% 0.13% 0.21% 0.09%(c) Difference 248 bp 206 bp 276 bp 145 bp 11 bp 48 bp 191 bp 202 bp 167 bp
(a) Non-performing loans are defined as non-accrual loans and loans 90 days or more past due but still accruing interest. (b) Non-performing loans exclude covered loans.
Page 27 New York Community Bancorp, Inc.
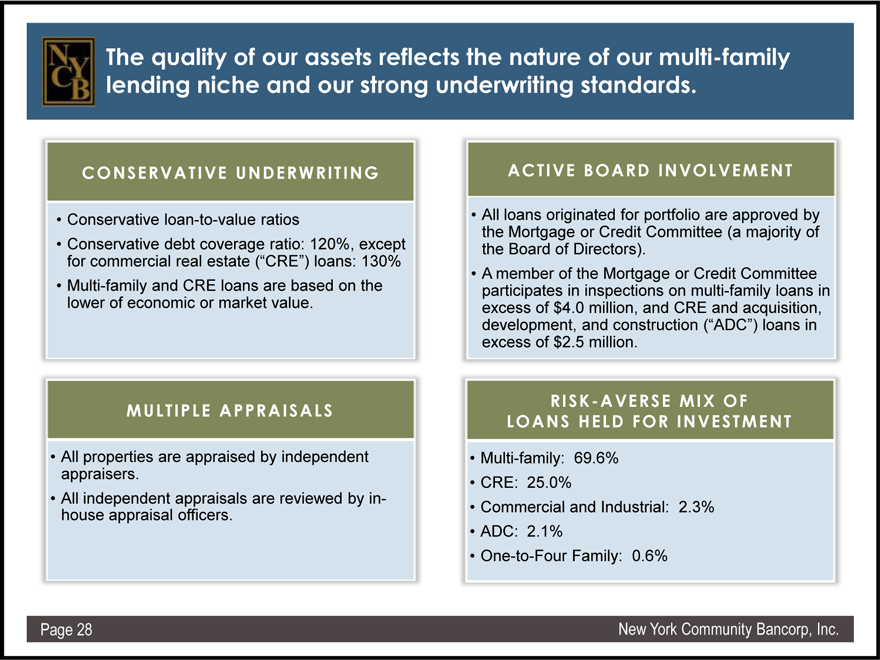
The quality of our assets reflects the nature of our multi-family lending niche and our strong underwriting standards.
CONSERVATIVE UNDERWRITING
• Conservative loan-to-value ratios
• Conservative debt coverage ratio: 120%, except for commercial real estate (“CRE”) loans: 130%
• Multi-family and CRE loans are based on the lower of economic or market value.
ACTIVE BOARD INVOLVEMENT
• All loans originated for portfolio are approved by the Mortgage or Credit Committee (a majority of the Board of Directors).
• A participates member of in the inspections Mortgage on or multi Credit -family Committee loans in excess of $4.0 million, and CRE and acquisition, development, and construction (“ADC”) loans in excess of $2.5 million.
MULTIPLE APPRAISALS
• All properties are appraised by independent appraisers.
• All house independent appraisal appraisals officers. are reviewed by in-
RISK-AVERSE MIX OF LOANS HELD FOR INVESTMENT
• Multi-family: 69.6%
• CRE: 25.0%
• Commercial and Industrial: 2.3%
• ADC: 2.1%
• One-to-Four Family: 0.6%
Page 28 New York Community Bancorp, Inc.
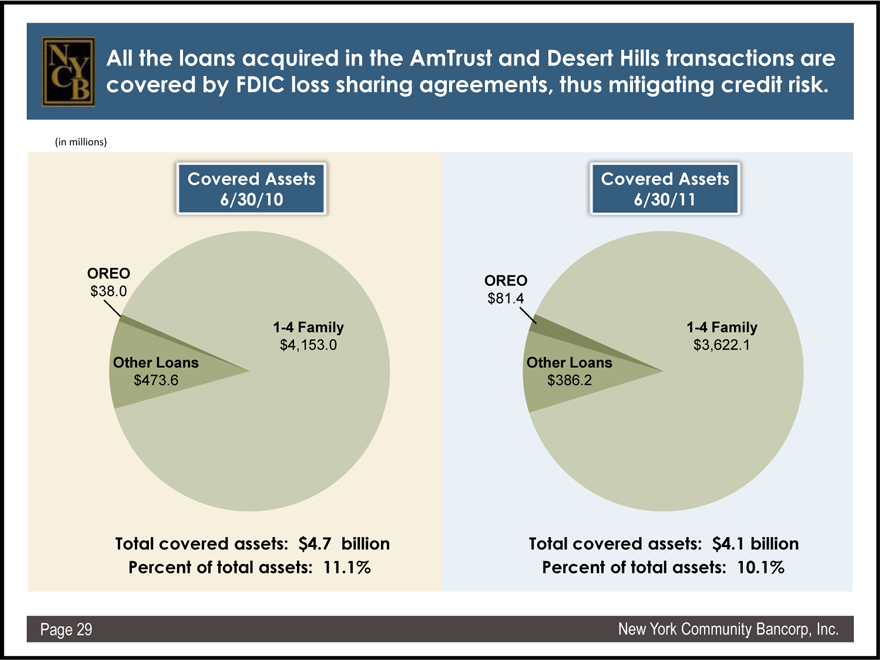
All the loans acquired in the AmTrust and Desert Hills transactions are covered by FDIC loss sharing agreements, thus mitigating credit risk.
(in millions)
Covered Assets 6/30/10
OREO
$38.0
1-4 Family $4,153.0
Other Loans $473.6
Total covered assets: $4.7 billion Percent of total assets: 11.1%
Covered Assets 6/30/11
OREO
$81.4
1-4 Family $3,622.1
Other Loans $386.2
Total covered assets: $4.1 billion Percent of total assets: 10.1%
Page 29 New York Community Bancorp, Inc.
Efficiency
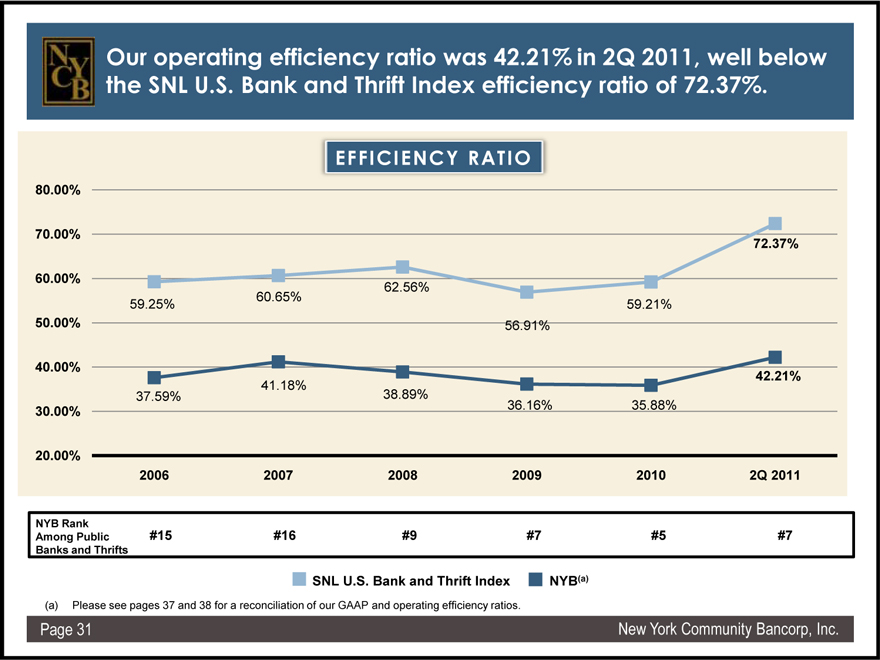
Our operating efficiency ratio was 42.21% in 2Q 2011, well below the SNL U.S. Bank and Thrift Index efficiency ratio of 72.37%.
EFFICIENCY RATIO
80.00%
70.00%
72.37%
60.00%
62.56%
60.65%
59.25% 59.21%
50.00% 56.91%
40.00%
42.21%
41.18%
37.59% 38.89%
30.00% 36.16% 35.88%
20.00%
2006 2007 2008 2009 2010 2Q 2011
NYB Rank #15 #16 #9 #7 #5 #7 Among Public Banks and Thrifts
SNL U.S. Bank and Thrift Index NYB(a)
(a) | | Please see pages 37 and 38 for a reconciliation of our GAAP and operating efficiency ratios. |
Page 31 New York Community Bancorp, Inc.
Our efficiency is driven by several factors.
Franchise expansion has largely stemmed from mergers and acquisitions; we generally do not engage in de novo branch development.
Multi-family and commercial real estate lending are both broker-driven, with the borrower paying fees to the mortgage brokerage firm, rather than the bank.
Products and services are typically developed by third-party providers and the sale of these products generates additional revenues.
42 of our branches are located in-store, where rental space is less costly, enabling us to supplement the service provided by our traditional branches more efficiently.
We acquire our deposits primarily through earnings-accretive acquisitions rather than by paying above-market rates.
Page 32 New York Community Bancorp, Inc.
Total Return on Investment
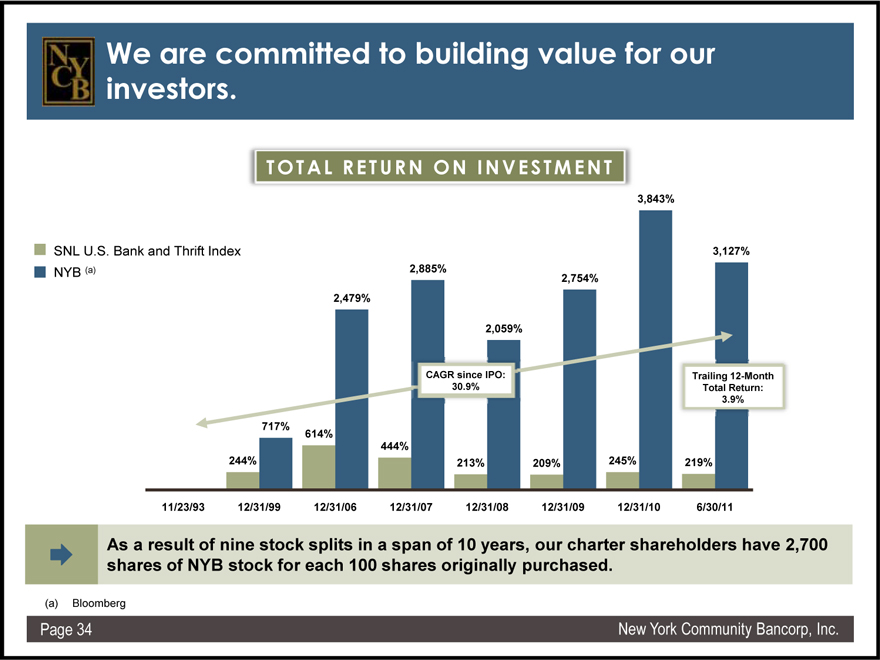
We are committed to building value for our investors.
TOTAL RETURN ON INVESTMENT
3,843%
SNL U.S. Bank and Thrift Index 3,127%
NYB (a) 2,885%
2,754% 2,479%
2,059%
CAGR since IPO: Trailing 12-Month
30.9% Total Return: 3.9%
717% 614%
444%
244% 213% 209% 245% 219%
11/23/93 12/31/99 12/31/06 12/31/07 12/31/08 12/31/09 12/31/10 6/30/11
As a result of nine stock splits in a span of 10 years, our charter shareholders have 2,700 shares of NYB stock for each 100 shares originally purchased.
Page 34 New York Community Bancorp, Inc.
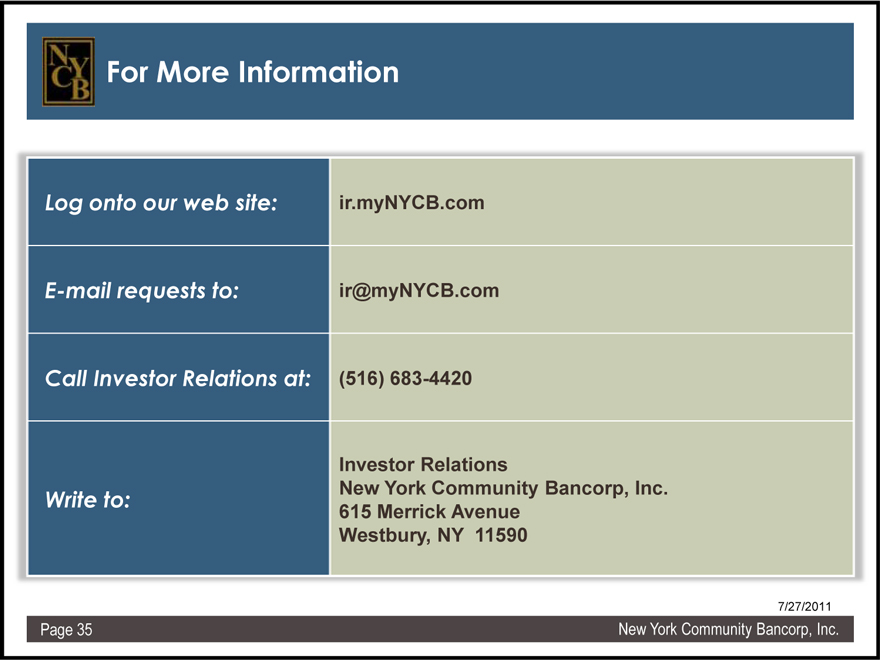
For More Information
Log onto our web site: E-mail requests to: Call Investor Relations at:
Write to:
ir.myNYCB.com
ir@myNYCB.com
(516) 683-4420
Investor Relations
New York Community Bancorp, Inc. 615 Merrick Avenue Westbury, NY 11590
7/27/2011
Page 35 New York Community Bancorp, Inc.
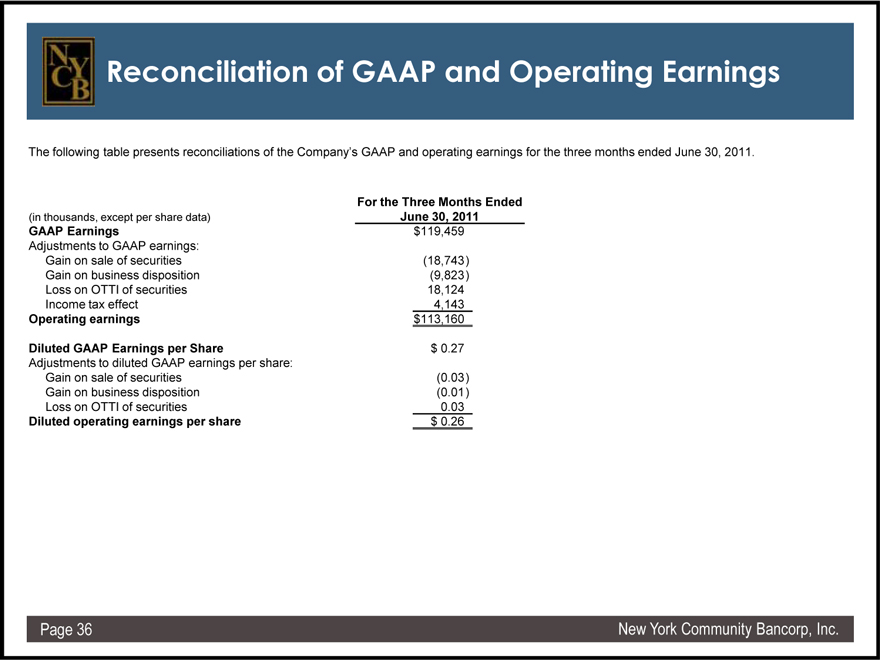
Reconciliation of GAAP and Operating Earnings
The following table presents reconciliations of the Company’s GAAP and operating earnings for the three months ended June 30, 2011.
For the Three Months Ended
(in thousands, except per share data) June 30, 2011 GAAP Earnings $119,459 Adjustments to GAAP earnings: Gain on sale of securities (18,743) Gain on business disposition (9,823) Loss on OTTI of securities 18,124 Income tax effect 4,143
Operating earnings $113,160
Diluted GAAP Earnings per Share $ 0.27 Adjustments to diluted GAAP earnings per share: Gain on sale of securities (0.03) Gain on business disposition (0.01) Loss on OTTI of securities 0.03
Diluted operating earnings per share $ 0.26
Page 36 New York Community Bancorp, Inc.
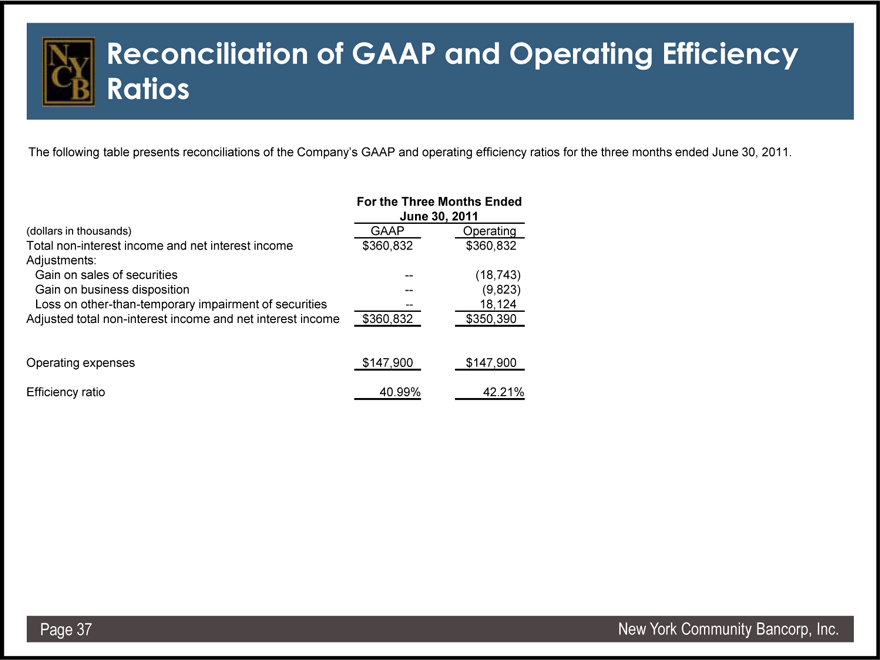
Reconciliation of GAAP and Operating Efficiency Ratios
The following table presents reconciliations of the Company’s GAAP and operating efficiency ratios for the three months ended June 30, 2011.
For the Three Months Ended June 30, 2011
(dollars in thousands) GAAP Operating
Total non-interest income and net interest income $360,832 $360,832
Adjustments: Gain on sales of securities — (18,743)
Gain on business disposition — (9,823)
Loss on other-than-temporary impairment of securities — 18,124
Adjusted total non-interest income and net interest income $360,832 $350,390
Operating expenses $147,900 $147,900
Efficiency ratio 40.99% 42.21%
Page 37 New York Community Bancorp, Inc.
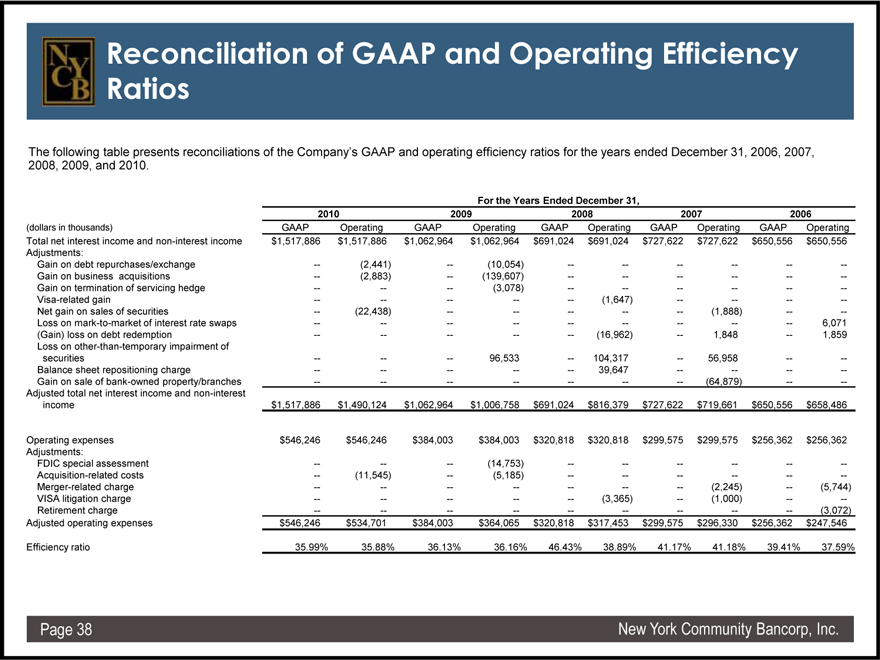
Reconciliation of GAAP and Operating Efficiency Ratios
2008, The following 2009, and table 2010 presents . reconciliations of the Company’s GAAP and operating efficiency ratios for the years ended December 31, 2006, 2007,
For the Years Ended December 31,
2010 2009 2008 2007 2006
(dollars in thousands) GAAP Operating GAAP Operating GAAP Operating GAAP Operating GAAP Operating
Total net interest income and non-interest income $1,517,886 $1,517,886 $1,062,964 $1,062,964 $691,024 $691,024 $727,622 $727,622 $650,556 $650,556
Adjustments: Gain on debt repurchases/exchange — (2,441) — (10,054) — — — — — —
Gain on business acquisitions — (2,883) — (139,607) — — — — — —
Gain on termination of servicing hedge — — — (3,078) — — — — — —
Visa-related gain — — — — — (1,647) — — — —
Net gain on sales of securities — (22,438) — — — — — (1,888) — —
Loss on mark-to-market of interest rate swaps — — — — — — — — — 6,071
(Gain) loss on debt redemption — — — — — (16,962) — 1,848 — 1,859
Loss on other-than-temporary impairment of securities — — — 96,533 — 104,317 — 56,958 — —
Balance sheet repositioning charge — — — — — 39,647 — — — —
Gain on sale of bank-owned property/branches — — — — — — — (64,879) — —
Adjusted total net interest income and non-interest income $1,517,886 $1,490,124 $1,062,964 $1,006,758 $691,024 $816,379 $727,622 $719,661 $650,556 $658,486
Operating expenses $546,246 $546,246 $384,003 $384,003 $320,818 $320,818 $299,575 $299,575 $256,362 $256,362
Adjustments: FDIC special assessment — — — (14,753) — — — — — —
Acquisition-related costs — (11,545) — (5,185) — — — — — —
Merger-related charge — — — — — — — (2,245) — (5,744)
VISA litigation charge — — — — — (3,365) — (1,000) — —
Retirement charge — — — — — — — — — (3,072)
Adjusted operating expenses $546,246 $534,701 $384,003 $364,065 $320,818 $317,453 $299,575 $296,330 $256,362 $247,546
Efficiency ratio 35.99% 35.88% 36.13% 36.16% 46.43% 38.89% 41.17% 41.18% 39.41% 37.59%
Page 38 New York Community Bancorp, Inc.
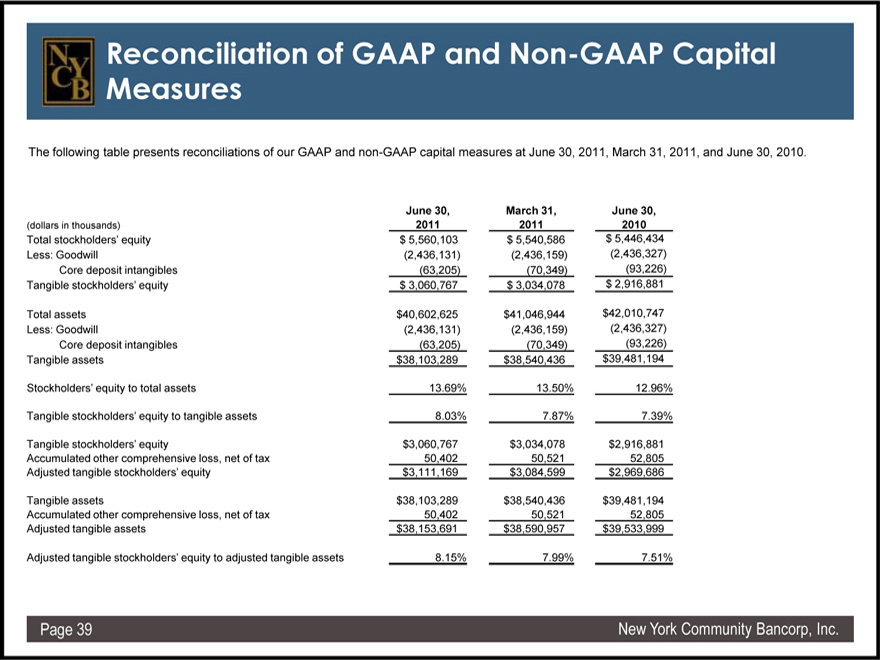
Reconciliation of GAAP and Non-GAAP Capital Measures
The following table presents reconciliations of our GAAP and non-GAAP capital measures at June 30, 2011, March 31, 2011, and June 30, 2010.
June 30, March 31, June 30,
(dollars in thousands) 2011 2011 2010
Total stockholders’ equity $ 5,560,103 $ 5,540,586 $ 5,446,434
Less: Goodwill (2,436,131) (2,436,159) (2,436,327)
Core deposit intangibles (63,205) (70,349) (93,226)
Tangible stockholders’ equity $ 3,060,767 $ 3,034,078 $ 2,916,881
Total assets $40,602,625 $41,046,944 $42,010,747
Less: Goodwill (2,436,131) (2,436,159) (2,436,327)
Core deposit intangibles (63,205) (70,349) (93,226)
Tangible assets $38,103,289 $38,540,436 $39,481,194
Stockholders’ equity to total assets 13.69% 13.50% 12.96%
Tangible stockholders’ equity to tangible assets 8.03% 7.87% 7.39%
Tangible stockholders’ equity $ 3,060,767 $3,034,078 $2,916,881
Accumulated other comprehensive loss, net of tax 50,402 50,521 52,805
Adjusted tangible stockholders’ equity $3,111,169 $3,084,599 $2,969,686
Tangible assets $38,103,289 $38,540,436 $39,481,194
Accumulated other comprehensive loss, net of tax 50,402 50,521 52,805
Adjusted tangible assets $38,153,691 $38,590,957 $39,533,999
Adjusted tangible stockholders’ equity to adjusted tangible assets 8.15% 7.99% 7.51%
Page 39 New York Community Bancorp, Inc.
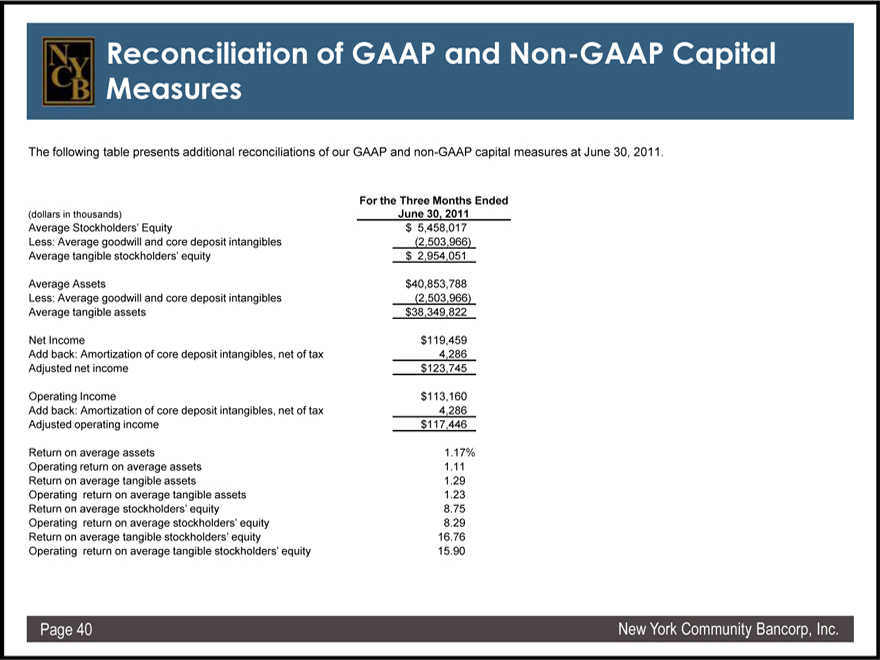
Reconciliation of GAAP and Non-GAAP Capital Measures
The following table presents additional reconciliations of our GAAP and non-GAAP capital measures at June 30, 2011.
For the Three Months Ended
(dollars in thousands) June 30, 2011
Average Stockholders’ Equity $ 5,458,017
Less: Average goodwill and core deposit intangibles (2,503,966)
Average tangible stockholders’ equity $ 2,954,051
Average Assets $40,853,788
Less: Average goodwill and core deposit intangibles (2,503,966)
Average tangible assets $38,349,822
Net Income $119,459
Add back: Amortization of core deposit intangibles, net of tax 4,286
Adjusted net income $123,745
Operating Income $113,160
Add back: Amortization of core deposit intangibles, net of tax 4,286
Adjusted operating income $117,446
Return on average assets 1.17%
Operating return on average assets 1.11
Return on average tangible assets 1.29
Operating return on average tangible assets 1.23
Return on average stockholders’ equity 8.75
Operating return on average stockholders’ equity 8.29
Return on average tangible stockholders’ equity 16.76
Operating return on average tangible stockholders’ equity 15.90
Page 40 New York Community Bancorp, Inc.