 Third Quarter 2014 Investor Presentation * * * * * * * EXHIBIT 99.1 |
 New York Community Bancorp, Inc. Page 2 Cautionary Statements Forward-Looking Statements and Associated Risk Factors Certain statements in this presentation, like those made in our other written and oral communications, are “forward-looking statements” within the meaning of the U.S. Private Securities Litigation Reform Act of 1995. Such forward-looking statements generally pertain to management’s goals, intentions, and expectations regarding such matters as revenues, earnings, funding, loan production, asset quality, capital, regulations, and acquisitions of other banks or thrifts. In addition, such forward-looking statements may also address the estimated costs and benefits of our actions; our assessments of interest rates and other market factors that may influence our performance; and our ability to achieve our financial and other strategic goals. It is important to note that forward-looking statements are subject to numerous assumptions, risks, and uncertainties, which may change over time. Accordingly, our actual results and events could differ materially from those anticipated in our forward-looking statements, and our future performance could differ materially from our historical results. You will find more detailed information regarding these factors in our filings with the U.S. Securities and Exchange Commission, including in the “Risk Factors” section of our 2013 Annual Report on Form 10-K and our Quarterly Reports on Form 10-Q for the three months ended March 31, and June 30, 2014. In addition, it should be noted that our forward-looking statements speak only as of the date of this presentation. We do not undertake to update our forward-looking statements to reflect the impact of events or circumstances that may arise after the date on which such statements are made. Our Use of Non-GAAP Financial Measures This presentation may contain certain non-GAAP financial measures which management believes to be useful to investors in understanding the Company’s performance and financial condition and in comparing our performance and financial condition to those of other banks. Such non-GAAP financial measures are not to be considered in isolation or as a substitute for measures calculated in accordance with GAAP. Reconciliations of our GAAP and non-GAAP financial measures are included in the Appendix and may also be found in our earnings releases and under “Strategies and Results” at ir.myNYCB.com. |
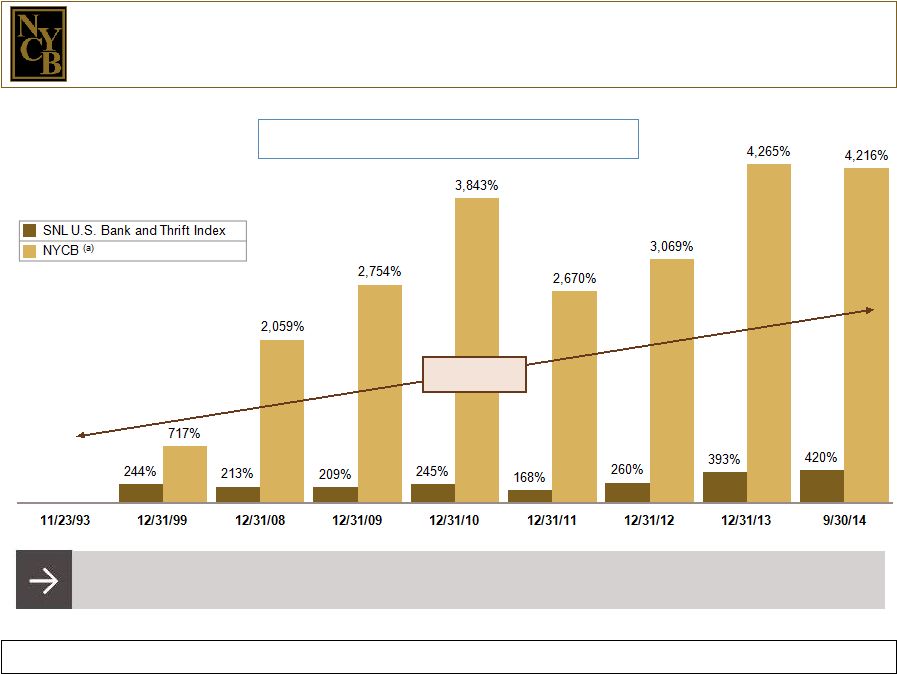
 New York Community Bancorp, Inc. Page 3 We are one of the top 25 U.S. bank holding companies. Note: Except as otherwise indicated, all industry data was provided by SNL Financial as of 10/31/14. (a) Bloomberg Assets Deposits Multi-Family Loans Market Cap Total Return on Investment $48.7 billion $28.3 billion $22.9 billion $7.0 billion 4,216% With assets of $48.7 billion at 9/30/14, we are the 21st largest U.S. bank holding company. With deposits of $28.3 billion and over 270 branches in Metro New York, New Jersey, Ohio, Florida, and Arizona, we currently rank 22nd among the nation’s largest depositories. With a portfolio of $22.9 billion at the end of September, we are a leading producer of multi- family loans in New York City. With a market cap of $7.0 billion at 9/30/14, we rank 20th among the nation’s publicly traded banks and thrifts. From 11/23/93 through 9/30/14, we provided our charter investors with a total return on investment of 4,216%. (a) |
 3rd Quarter 2014 Performance Highlights * * * * * * * **************** |
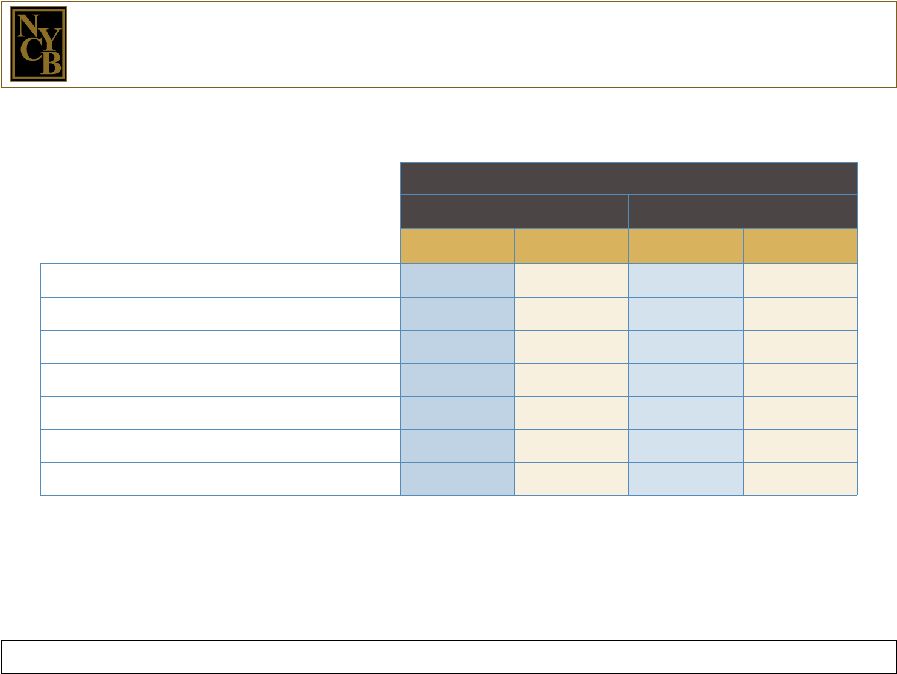 New York Community Bancorp, Inc. Page 5 (dollars in thousands, except per share data) (a) Cash earnings is a non-GAAP financial measure. Please see page 29 for a reconciliation of our GAAP and cash earnings. (b) ROTA and ROTE are non-GAAP financial measures. Please see page 30 for additional information. (c) Please see page 31 for a reconciliation of our efficiency and cash efficiency ratios. We generated solid earnings in 3Q 2014. PERFORMANCE HIGHLIGHTS GAAP Earnings Cash Earnings (a) 3Q 2014 2Q 2014 3Q 2014 2Q 2014 Strong Profitability Measures: Earnings $120,258 $118,688 $129,605 $128,571 EPS $0.27 $0.27 $0.29 $0.29 Return on average tangible assets (b) 1.06% 1.06% 1.13% 1.13% Return on average tangible stockholders’ equity (b) 14.59 14.46 15.57 15.50 Net interest margin 2.69 2.66 2.69 2.66 Efficiency ratio (c) 43.35 43.37 41.29 41.20 |
 New York Community Bancorp, Inc. Page 6 Our balance sheet measures reflect stability and strength. Balance Sheet Asset Quality Company Capital Bank Capital Ratios to Total Assets at 9/30/14 At or for the 3 Months Ended 9/30/14 9/30/14 9/30/14 • Total loans = 72.8% • Securities = 15.4% • Deposits = 58.2% • Wholesale borrowings = 28.8% • Non-performing loans (a) / total loans (a) = 0.25% • Non-performing assets (b) / total assets (b) = 0.31% • Net charge-offs / average loans = (0.00)% (non- annualized) • Stockholders’ equity / total assets = 11.87% • Tangible stockholders’ equity / tangible assets excluding accumulated other comprehensive loss, net of tax = 7.21% (c) • Leverage capital ratio = 8.05% • Tier 1 capital ratio = 12.10% The Community Bank: • Leverage capital ratio = 7.65% • Tier 1 capital ratio = 11.63% The Commercial Bank: • Leverage capital ratio = 10.06% • Tier 1 capital ratio = 13.25% (a) Non-performing loans and total loans exclude covered loans. (b) Non-performing assets and total assets exclude covered loans and covered OREO. (c) Tangible stockholders’ equity and tangible assets are non-GAAP financial measures. Please see page 32 for additional information. |
 A Successful Business Model * * * * * * * **************** |
 New York Community Bancorp, Inc. Page 8 Our business model has consistently focused on building value for our investors. Multi-Family Lending Strong Credit Standards/ Superior Asset Quality Residential Mortgage Banking Efficient Operation Growth through Acquisitions We have originated $55.4 billion of multi-family loans over the course of our public life. Net charge-offs have averaged a mere 0.04% since 1993. Since January 2010, our residential mortgage banking operation has originated $37.1 billion of 1-4 family loans for sale and generated mortgage banking income of $568.0 million. Our efficiency ratio has consistently ranked in the top 3% of all banks and thrifts. Our assets have grown from $1.9 billion to $48.7 billion since our first acquisition in November 2000. |
 Multi-Family Loan Production * * * * * * * **************** |
 New York Community Bancorp, Inc. Page 10 60.9% of the rental housing units in New York City are subject to rent regulation and therefore feature below-market rents. (a) Rent-regulated buildings are more likely to retain their tenants and, therefore, their revenue stream in a downward credit cycle. Our focus on multi-family lending in this niche market has contributed to our record of asset quality. Multi-family loans are less costly to produce and service than other types of loans, and therefore contribute to our superior efficiency. Our focus on multi-family lending on rent-regulated buildings has enabled us to distinguish ourselves from our industry peers. (a) Source: New York City Rent Guidelines Board 2014 Housing Supply Report |
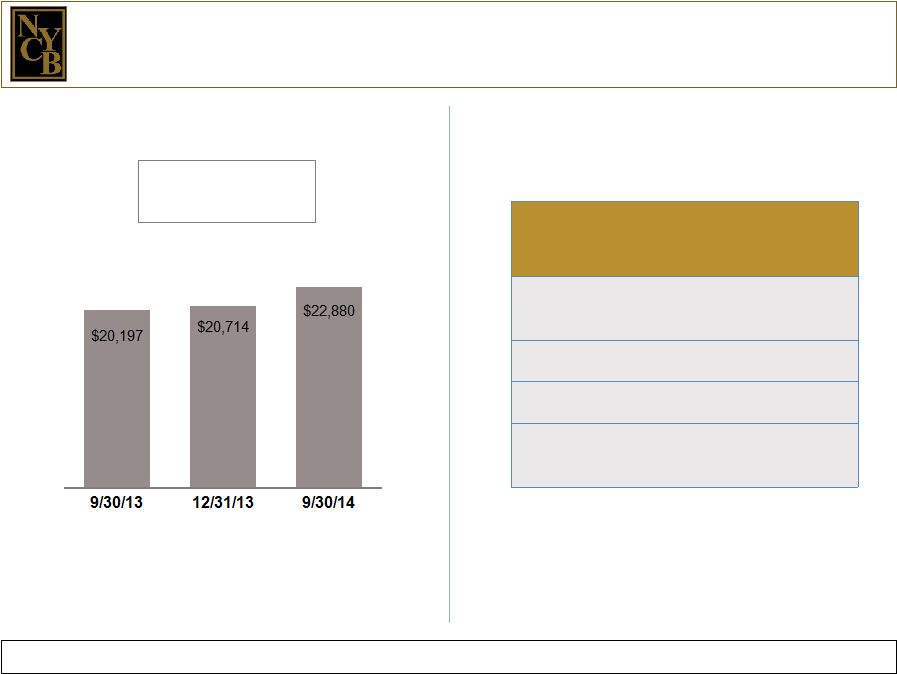 New York Community Bancorp, Inc. Page 11 We are the leading producer of multi-family loans for portfolio in New York City. PORTFOLIO STATISTICS AT 9/30/2014 MULTI-FAMILY LOAN PORTFOLIO (in millions) • • • • % of non-covered loans held for investment = 70.9% Average principal balance = $4.8 million Expected weighted average life = 2.8 years % of our multi-family loans located in Metro New York = 84.6% |
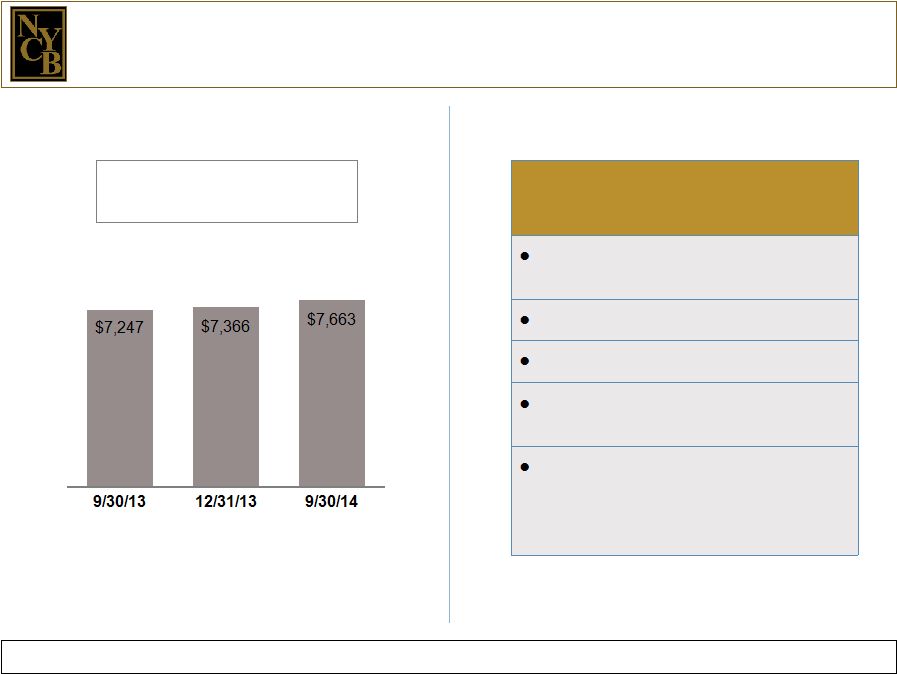 New York Community Bancorp, Inc. Page 12 Our commercial real estate loans feature the same structure as our multi-family loans. PORTFOLIO STATISTICS AT 9/30/2014 % of non-covered loans held for investment = 23.8% Average principal balance = $4.9 million Expected weighted average life = 3.4 years % of our CRE loans located in Metro New York = 92.0% Our CRE loans are typically collateralized by office buildings, retail centers, mixed-use buildings, and multi-tenanted light industrial properties. (in millions) COMMERCIAL REAL ESTATE LOAN PORTFOLIO |
 Asset Quality * * * * * * * **************** * * * * * * * * ***************** ***************** ***************** ***************** ***************** ***************** ***************** ***************** ***************** ***************** |
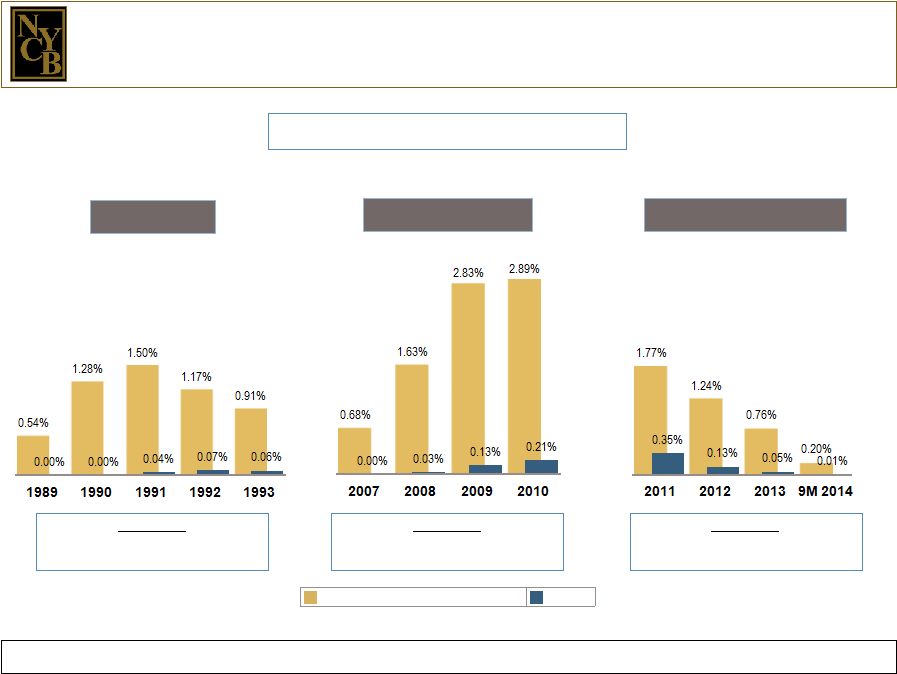 New York Community Bancorp, Inc. Page 14 S & L Crisis We have been distinguished by our low level of net charge- offs in downward credit cycles. NET CHARGE-OFFS / AVERAGE LOANS 5-Year Total NYCB: 17 bp SNL U.S. Bank and Thrift Index: 540 bp 4-Year Total NYCB: 37 bp SNL U.S. Bank and Thrift Index: 803 bp SNL U.S. Bank and Thrift Index NYCB Great Recession Current Credit Cycle 4-Year Total NYCB: 54 bp SNL U.S. Bank and Thrift Index: 397 bp * Annualized * |
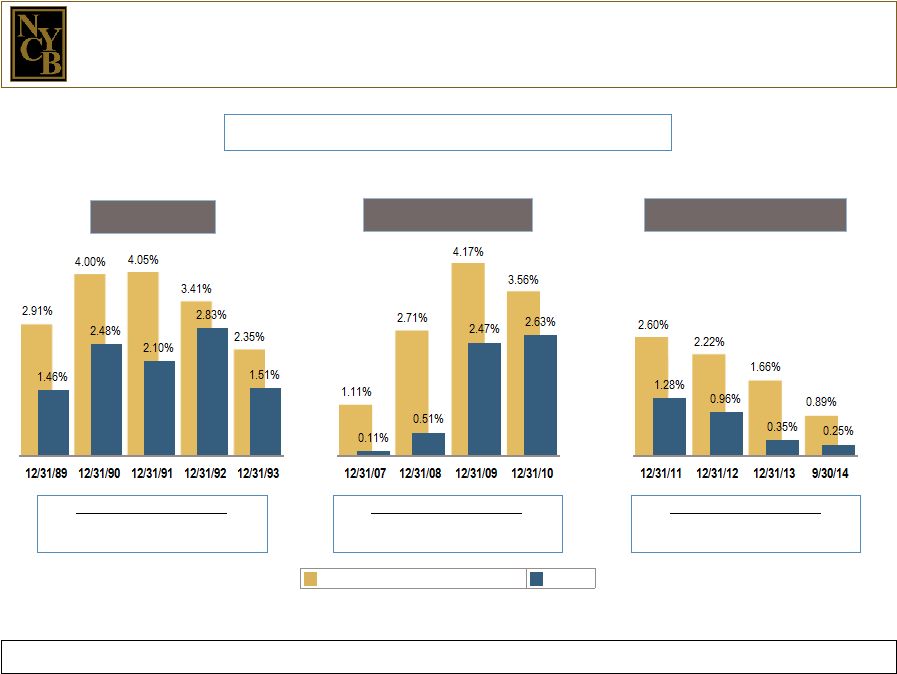 New York Community Bancorp, Inc. Page 15 S & L Crisis The quality of our loan portfolio continues to exceed that of our industry. Great Recession Current Credit Cycle NON-PERFORMING LOANS (a)(b) / TOTAL LOANS (a) (a) Non-performing loans and total loans exclude covered loans. (b) Non-performing loans are defined as non-accrual loans and loans 90 days or more past due but still accruing interest. Average NPLs/Total Loans NYCB: 2.08% SNL U.S. Bank and Thrift Index: 3.34% Average NPLs/Total Loans NYCB: 1.43% SNL U.S. Bank and Thrift Index: 2.89% SNL U.S. Bank and Thrift Index NYCB Average NPLs/Total Loans NYCB: 0.71% SNL U.S. Bank and Thrift Index: 1.84% |
 New York Community Bancorp, Inc. Page 16 The quality of our assets reflects the nature of our lending niche and our strong underwriting standards. Conservative Underwriting Active Board Involvement Multiple Appraisals Risk-Averse Mix of Non-Covered Loans Held for Investment (at 9/30/14) • Conservative loan-to- value ratios • Conservative debt coverage ratios: 120% for multi-family loans, and 130% for commercial real estate (“CRE”) loans • Multi-family and CRE loans are based on the lower of economic or market value. • All loans originated for portfolio are reviewed by the Mortgage or Credit Committee (a majority of the Board of Directors). • A member of the Mortgage or Credit Committee participates in inspections on multi- family loans in excess of $7.5 million, and CRE and acquisition, development, and construction (“ADC”) loans in excess of $4.0 million. • All properties are appraised by independent appraisers. • All independent appraisals are reviewed by in-house appraisal officers. • A second independent appraisal review is performed on loans that are large and complex. • Multi-family: 70.9% • CRE: 23.8% • One-to- Four Family: 1.3% • ADC: 1.0% • Commercial and Industrial: 3.0% |
 Residential Mortgage Banking * * * * * * * **************** * * * * * * * * ***************** ***************** ***************** ***************** ***************** ***************** ***************** ***************** ***************** ***************** |
 New York Community Bancorp, Inc. Page 18 Our revenue mix has been enhanced since the establishment of our mortgage banking operation in January 2010. Features Loans can be originated/purchased in all 50 states and the District of Columbia. Loan production is driven by our proprietary real time, web-accessible mortgage banking technology platform, which securely controls the lending process while mitigating business and regulatory risks. Our 900 approved clients include community banks, credit unions, mortgage companies, and mortgage brokers. 100% of loans funded are full documentation, prime credit loans. Credit Quality As of September 30, 2014, 99.8% of all funded loans were current. Limited Repurchase Risk Of the 12 loans we repurchased in the first nine months of 2014, six were loans acquired in merger transactions prior to 2009. Benefits Since January 2010, our mortgage banking business has originated 1-4 family loans of $37.1 billion and generated mortgage banking income of $568.0 million. Our proprietary mortgage banking platform has enabled us to expand our revenues, market share, and product line. Over time, mortgage banking income has supported the stability of our return on average tangible assets, even in times of interest rate volatility. |
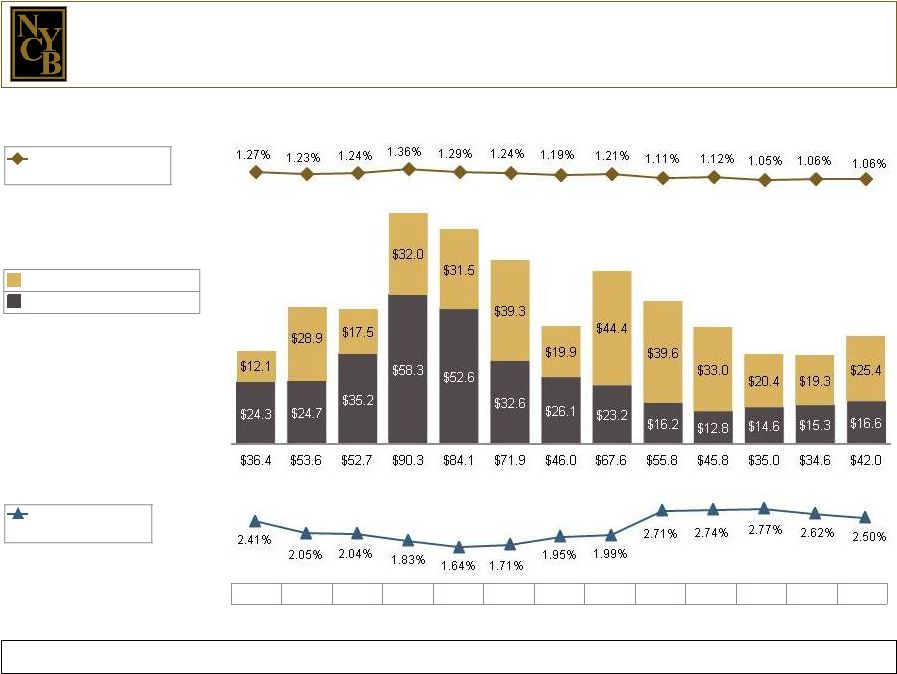 New York Community Bancorp, Inc. Page 19 Average 10-Year Treasury Rate Return on Average Tangible Assets (a) Prepayment penalty income and mortgage banking income have contributed to the stability of our ROTA. Total: Prepayment Penalty Income Mortgage Banking Income 3Q 2011 4Q 2011 1Q 2012 2Q 2012 3Q 2012 4Q 2012 1Q 2013 2Q 2013 3Q 2013 4Q 2013 1Q 2014 2Q 2014 3Q 2014 (a) ROTA is a non-GAAP financial measure. Please see page 33 for additional information. (dollars in millions) |
 Efficiency * * * * * * * * ***************** ***************** ***************** ***************** ***************** ***************** ***************** ***************** ***************** ***************** |
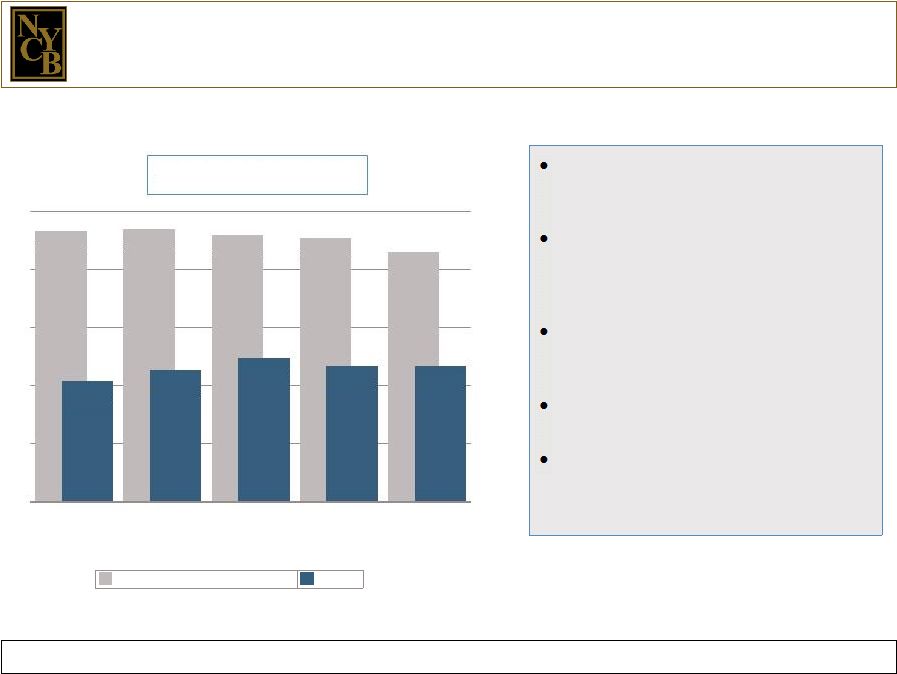 New York Community Bancorp, Inc. Page 21 Our efficiency is driven by several factors. Multi-family and CRE lending are both broker-driven, with the borrower paying fees to the mortgage brokerage firm. Products and services are typically developed by third-party providers and the sale of these products generates additional revenues. Franchise expansion has largely stemmed from mergers and acquisitions; we rarely engage in de novo branch development. Most of our deposits have been acquired through earnings-accretive acquisitions. 38 of our branches are located in-store, where rental space is less costly, enabling us to supplement the service provided by our traditional branches more efficiently. SNL U.S. Bank and Thrift Index NYCB 66.61% 66.96% 65.91% 65.38% 62.98% 40.75% 42.71% 44.81% 43.37% 43.35% 2012 2013 1Q 2014 2Q 2014 3Q 2014 EFFICIENCY RATIO |
 Growth Through Acquisitions * * * * * * * * ***************** ***************** ***************** ***************** ***************** ***************** ***************** ***************** ***************** ***************** |
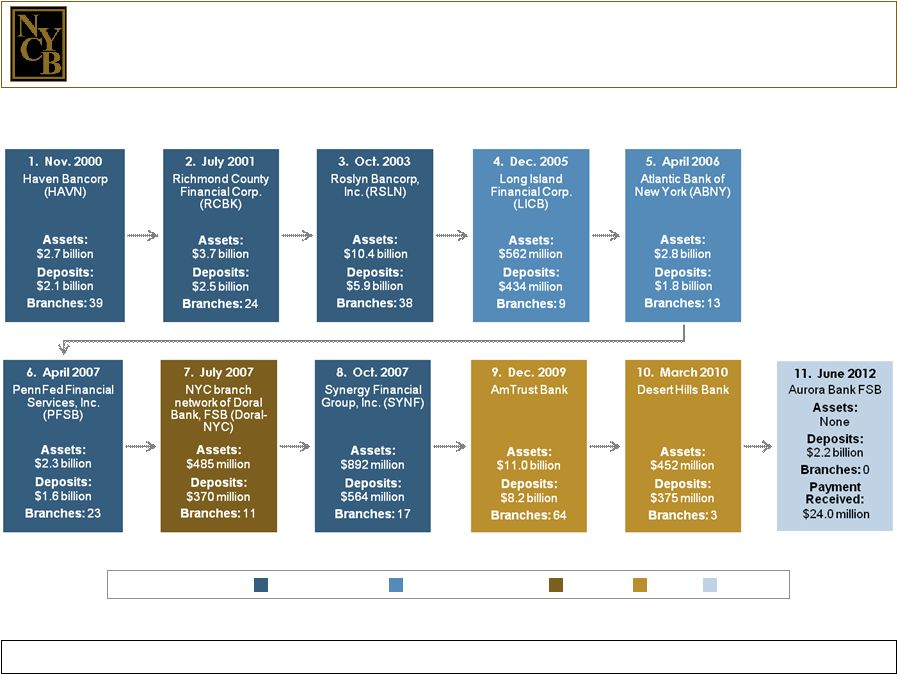 New York Community Bancorp, Inc. Page 23 Since our first acquisition, we have grown from $1.9 billion in assets to $48.7 billion. Note: The number of branches indicated reflects the number of branches in our current franchise that stemmed from each transaction. Transaction Type: Savings Bank Commercial Bank Branch FDIC Deposit |
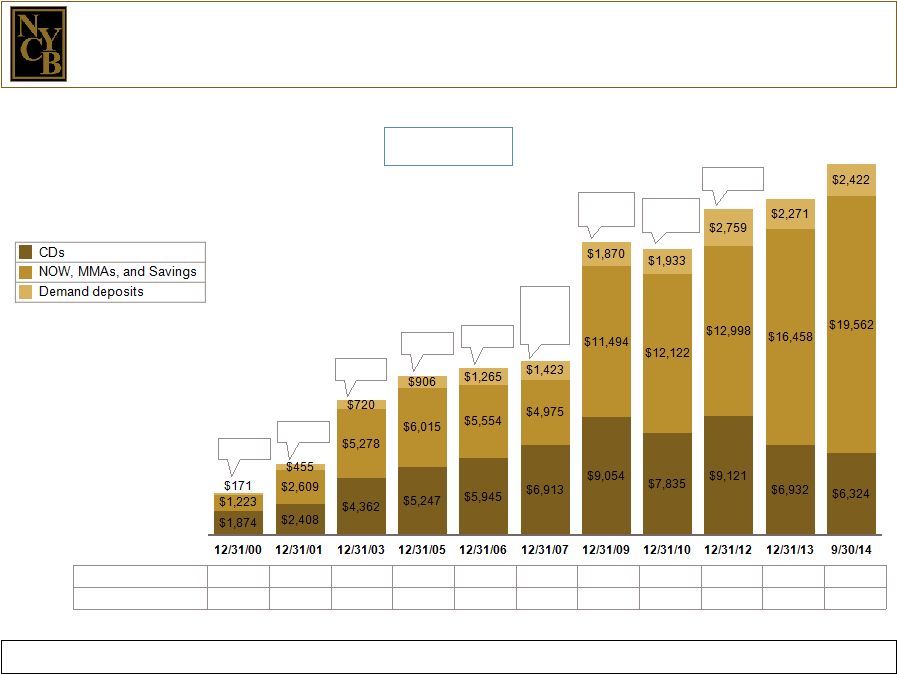 New York Community Bancorp, Inc. Page 24 From 2000 to 2012, our deposit growth was largely acquisition-driven. (in millions) DEPOSITS w/ HAVN w/ RCBK w/ RSLN w/ LICB w/ ABNY w/ PFSB, Doral, & SYNF w/ AmTrust w/ Desert Hills w/ Aurora Total Deposits: $3,268 $5,472 $10,360 $12,168 $12,764 $13,311 $22,418 $21,890 $24,878 $25,661 $28,308 Total Branches: 86 120 139 152 166 217 276 276 275 273 272 |
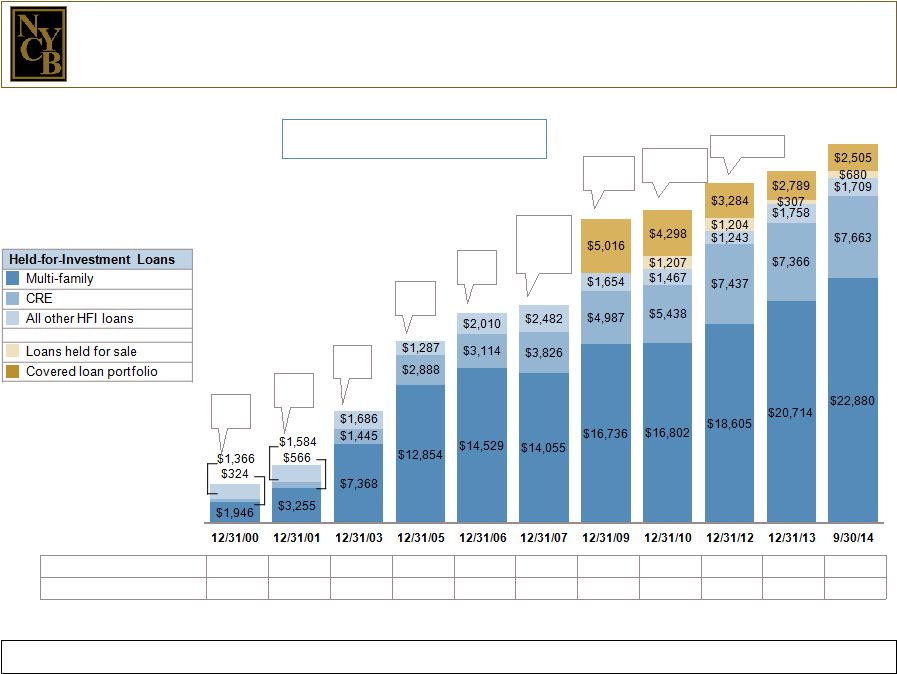 New York Community Bancorp, Inc. Page 25 (a) Includes originations of loans held for sale of $888.5 million in 2009, $10.8 billion in 2010, $7.2 billion in 2011, $10.9 billion in 2012, $6.2 billion in 2013, and $2.2 billion in the first nine months of 2014. From 2000 to 2012, acquisitions provided much of the funding for the organic growth of our loan portfolio. LOANS OUTSTANDING After HAVN After RCBK After RSLN After LICB After ABNY After PFSB, Doral, & SYNF After AmTrust After Desert Hills Total Loans Outstanding: $3,636 $5,405 $10,499 $17,029 $19,653 $20,363 $28,393 $29,212 $31,773 $32,934 $35,437 Total Originations: (a) $616 $1,150 $4,330 $6,332 $4,971 $4,853 $4,280 $15,193 $19,894 $17,403 $10,503 After Aurora (in millions) |
 Total Return on Investment * * * * * * * * ***************** ***************** ***************** ***************** ***************** ***************** ***************** ***************** ***************** ***************** |
 New York Community Bancorp, Inc. Page 27 Our quarterly cash dividends are a significant component of our commitment to building value for our investors. CAGR since IPO: 27.3% (a) Bloomberg TOTAL RETURN ON INVESTMENT As a result of nine stock splits between 1994 and 2004, our charter shareholders have 2,700 shares of NYCB stock for each 100 shares originally purchased. |
 Appendix * * * * * * * * ***************** ***************** ***************** ***************** ***************** ***************** ***************** ***************** ***************** ***************** |
 New York Community Bancorp, Inc. Page 29 Reconciliations of GAAP and Non-GAAP Financial Measures Cash earnings is a non-GAAP financial measure. The following table presents a reconciliation of the Company’s GAAP and cash earnings for the three months ended September 30, and June 30, 2014. For the Three Months Ended (in thousands, except per share data) September 30, 2014 June 30, 2014 GAAP Earnings $120,258 $118,688 Additional contributions to tangible stockholders’ equity: Amortization and appreciation of shares held in stock- related benefit plans 6,778 7,278 Associated tax effects 550 523 Amortization of core deposit intangibles 2,019 2,082 Total additional contributions to tangible stockholders’ equity 9,347 9,883 Cash earnings $129,605 $128,571 Diluted GAAP Earnings per Share $0.27 $0.27 Add back: Amortization and appreciation of shares held in stock- related benefit plans 0.02 0.02 Associated tax effects -- -- Amortization of core deposit intangibles -- -- Total additions 0.02 0.02 Diluted cash earnings per share $0.29 $0.29 |
 New York Community Bancorp, Inc. Page 30 Cash earnings is a non-GAAP financial measure. The following table presents a reconciliation of the Company’s GAAP and cash profitability measures for the three months ended September 30, and June 30, 2014. Reconciliations of GAAP and Non-GAAP Financial Measures For the Three Months Ended (in thousands) September 30, 2014 June 30, 2014 Average stockholders’ equity $ 5,776,440 $ 5,767,564 Less: Average goodwill and core deposit intangibles (2,447,277) (2,449,260) Average tangible stockholders’ equity $ 3,329,163 $ 3,318,304 Average assets $48,484,853 $47,897,289 Less: Average goodwill and core deposit intangibles (2,447,277) (2,449,260) Average tangible assets $46,037,576 $45,448,029 Net income $120,258 $118,688 Add back: Amortization of core deposit intangibles, net of tax 1,211 1,249 Adjusted net income $121,469 $119,937 Cash earnings $129,605 $128,571 Return on average assets 0.99% 0.99% Cash return on average assets 1.07 1.07 Return on average tangible assets 1.06 1.06 Cash return on average tangible assets 1.13 1.13 Return on average stockholders’ equity 8.33 8.23 Cash return on average stockholders’ equity 8.97 8.92 Return on average tangible stockholders’ equity 14.59 14.46 Cash return on average tangible stockholders’ equity 15.57 15.50 |
 New York Community Bancorp, Inc. Page 31 Reconciliations of Efficiency and Cash Efficiency Ratios The following table presents a reconciliation of the Company’s efficiency and cash efficiency ratios for the three months ended September 30, and June 30, 2014. For the Three Months Ended September 30, 2014 June 30, 2014 (dollars in thousands) Cash Cash Total net interest income and non-interest income $330,315 $330,315 $336,085 $336,085 Operating expenses $143,176 $143,176 $145,754 $145,754 Adjustments: Amortization and appreciation of shares held in stock-related benefit plans -- (6,778) -- (7,278) Adjusted operating expenses $143,176 $136,398 $145,754 $138,476 Efficiency ratio 43.35% 41.29% 43.37% 41.20% |
 New York Community Bancorp, Inc. Page 32 (dollars in thousands) September 30, 2014 June 30, 2014 Total stockholders’ equity $ 5,777,998 $ 5,761,018 Less: Goodwill (2,436,131) (2,436,131) Core deposit intangibles (9,816) (11,835) Tangible stockholders’ equity $ 3,332,051 $ 3,313,052 Total assets $48,679,772 $48,604,772 Less: Goodwill (2,436,131) (2,436,131) Core deposit intangibles (9,816) (11,835) Tangible assets $46,233,825 $46,156,806 Stockholders’ equity to total assets 11.87% 11.85% Tangible stockholders’ equity to tangible assets 7.21% 7.18% Tangible stockholders’ equity $3,332,051 $3,313,052 Accumulated other comprehensive loss, net of tax 32,433 32,584 Adjusted tangible stockholders’ equity $3,364,484 $3,345,636 Tangible assets $46,233,825 $46,156,806 Accumulated other comprehensive loss, net of tax 32,433 32,584 Adjusted tangible assets $46,266,258 $46,189,390 Adjusted tangible stockholders’ equity to adjusted tangible assets 7.27% 7.24% Tangible and adjusted tangible stockholders’ equity and tangible and adjusted tangible assets are non-GAAP capital measures. The following table presents reconciliations of these non-GAAP measures with the related GAAP measures at September 30, and June 30, 2014. Reconciliations of GAAP and Non-GAAP Capital Measures |
 New York Community Bancorp, Inc. Page 33 For the Three Months Ended (dollars in thousands) September 30, 2014 June 30, 2014 March 31, 2014 December 31, 2013 September 30, 2013 June 30, 2013 March 31, 2013 December 31, 2012 September 30, 2012 June 30, 2012 March 31, 2012 December 31, 2011 September 30, 2011 Average Assets $48,484,853 $47,897,289 $46,872,770 $46,107,450 $44,343,284 $43,860,167 $43,243,259 $43,087,846 $43,205,076 $41,916,854 $41,775,013 $41,683,129 $41,261,984 Less: Average goodwill and core deposit intangibles (2,447,277) (2,449,260) (2,451,571) (2,454,191) (2,458,145) (2,462,265) (2,466,622) (2,471,204) (2,476,056) (2,480,921) (2,486,018) (2,491,327) (2,497,076) Average tangible assets $46,037,576 $45,448,029 $44,421,199 $43,653,259 $41,885,139 $41,397,902 $40,776,637 $40,616,642 $40,729,020 $39,435,933 $39,288,995 $39,191,802 $38,764,908 Net Income $120,258 $118,688 $115,254 $120,155 $114,200 $122,517 $118,675 $122,843 $128,798 $131,212 $118,253 $117,652 $119,750 Add back: Amortization of core deposit intangibles, net of tax 1,211 1,249 1,394 1,839 2,470 2,509 2,653 2,826 2,913 2,952 3,095 3,269 3,653 Adjusted net income $121,469 $119,937 $116,648 $121,994 $116,670 $125,026 $121,328 $125,669 $131,711 $134,164 $121,348 $120,921 $123,403 Return on average assets 0.99% 0.99% 0.98% 1.04% 1.03% 1.12% 1.10% 1.14% 1.19% 1.25% 1.13% 1.13% 1.16% Return on average tangible assets 1.06 1.06 1.05 1.12 1.11 1.21 1.19 1.24 1.29 1.36 1.24 1.23 1.27 Average tangible assets is a non-GAAP financial measure. The following table presents a reconciliation of this non-GAAP measure with the related GAAP measure for the three months ended September 30, June 30, and March 31, 2014; December 31, September 30, June 30, and March 31, 2013; December 31, September 30, June 30, and March 31, 2012; and December 31, and September 30, 2011. Reconciliations of GAAP and Non-GAAP Financial Measures |
 New York Community Bancorp, Inc. Page 34 11/3/14 For More Information Visit our website: ir.myNYCB.com E-mail requests to: ir@myNYCB.com Call Investor Relations at: (516) 683-4420 Write to: Investor Relations New York Community Bancorp, Inc. 615 Merrick Avenue Westbury, NY 11590 |