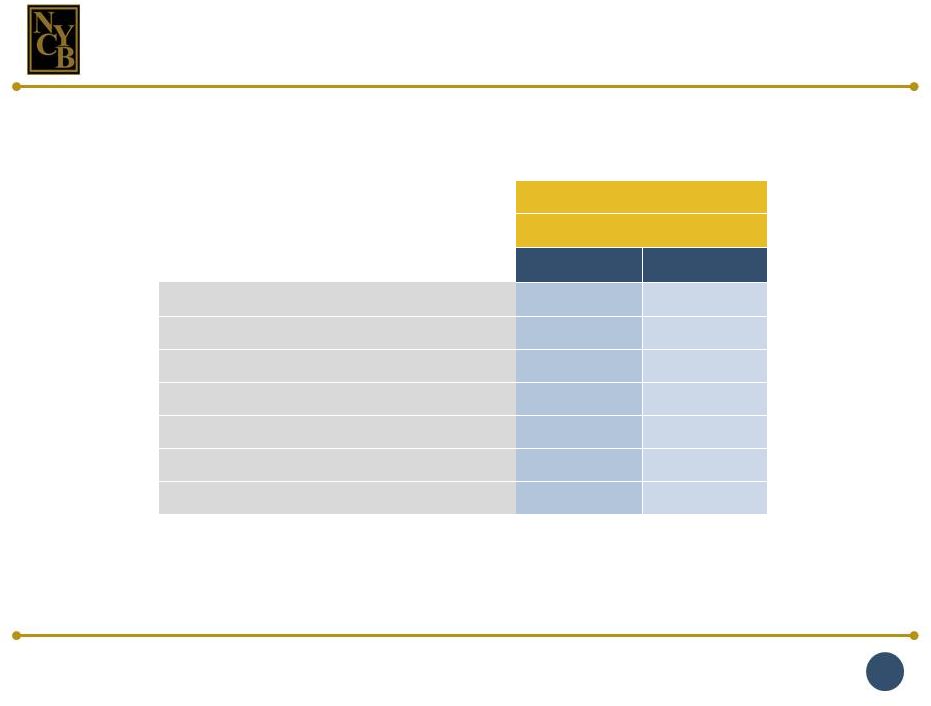
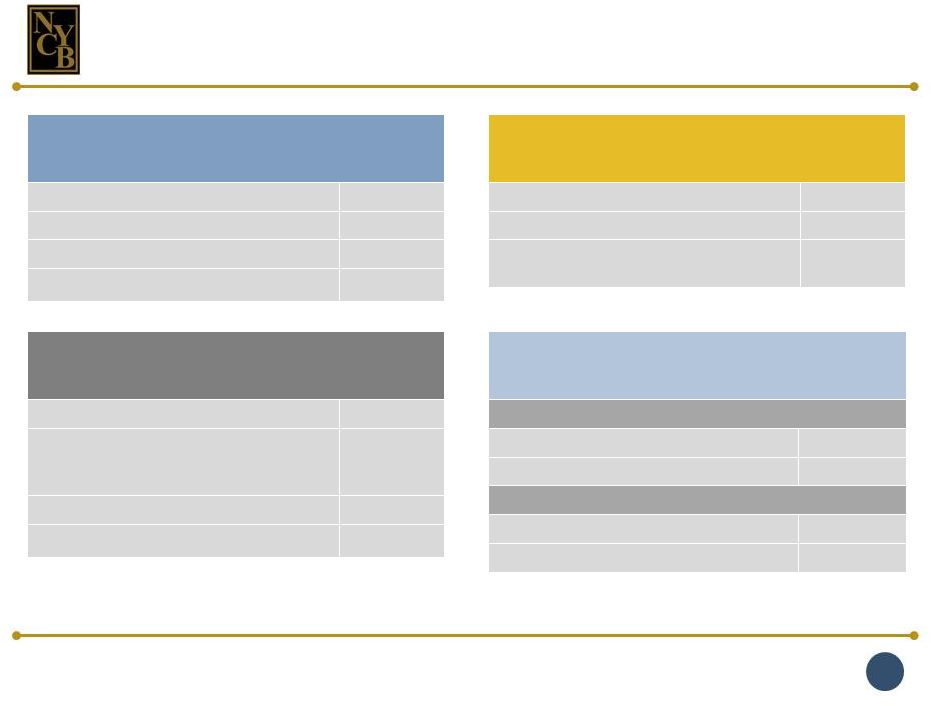
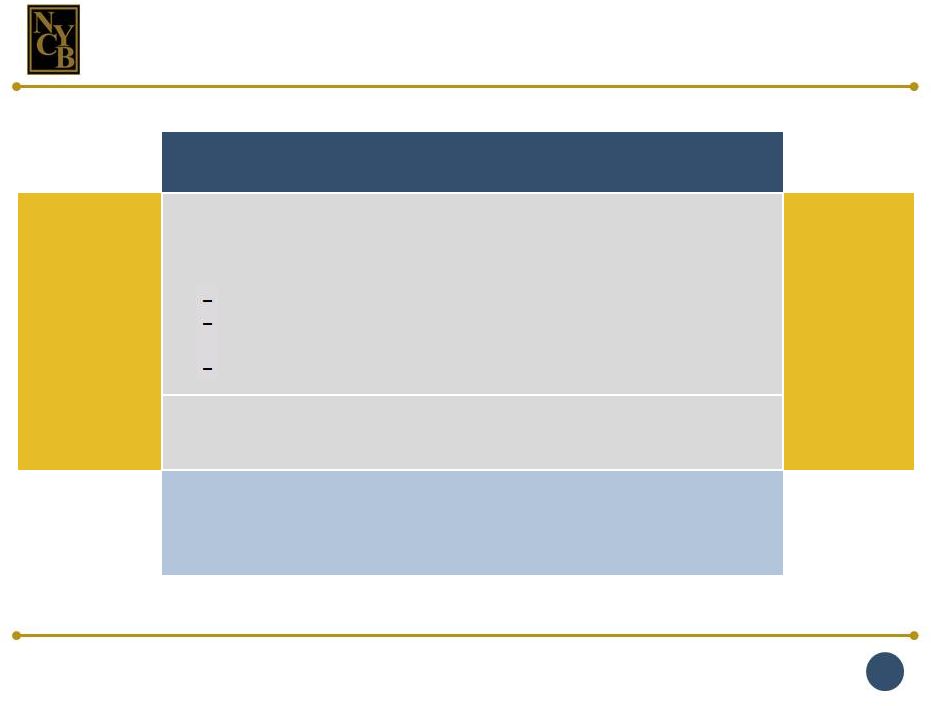
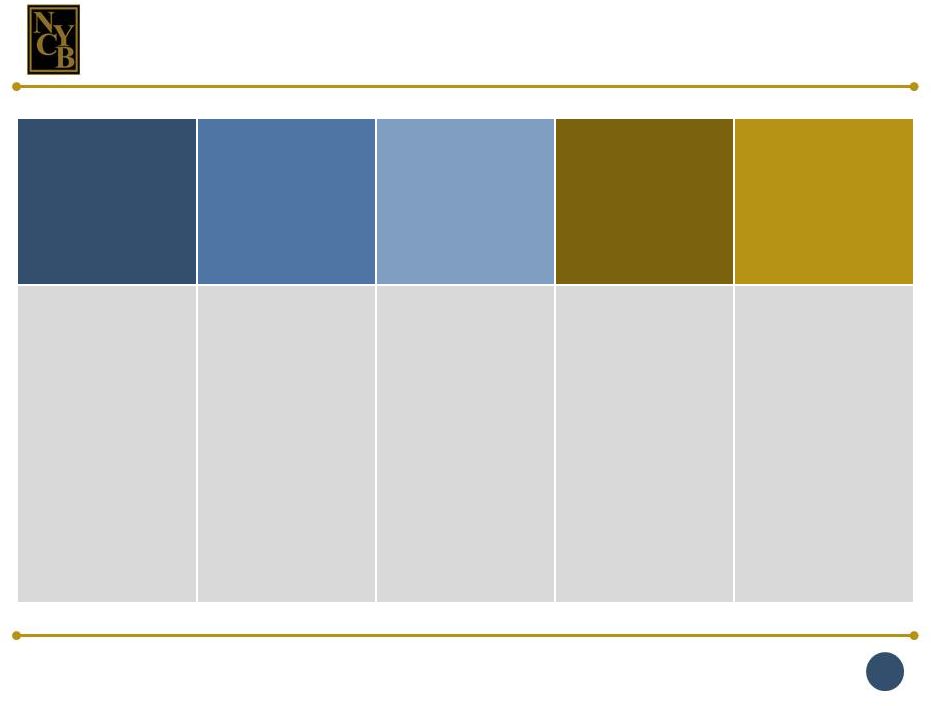
New York Community Bancorp, Inc. 1Q 2015 34 For the Three Months Ended (dollars in thousands) March 31, 2015 December 31, 2014 September 30, 2014 June 30, 2014 March 31, 2014 December 31, 2013 September 30, 2013 June 30, 2013 March 31, 2013 December 31, 2012 September 30, 2012 June 30, 2012 March 31, 2012 Average Assets $48,769,552 $48,870,512 $48,484,853 $47,897,289 $46,872,770 $46,107,450 $44,343,284 $43,860,167 $43,243,259 $43,087,846 $43,205,076 $41,916,854 $41,775,013 Less: Average goodwill and core deposit intangibles (2,443,528) (2,445,262) (2,447,277) (2,449,260) (2,451,571) (2,454,191) (2,458,145) (2,462,265) (2,466,622) (2,471,204) (2,476,056) (2,480,921) (2,486,018) Average tangible assets $46,326,024 $46,425,250 $46,037,576 $45,448,029 $44,421,199 $43,653,259 $41,885,139 $41,397,902 $40,776,637 $40,616,642 $40,729,020 $39,435,933 $39,288,995 Net Income $119,259 $131,197 $120,258 $118,688 $115,254 $120,155 $114,200 $122,517 $118,675 $122,843 $128,798 $131,212 $118,253 Add back: Amortization of core deposit intangibles, net of tax 1,124 1,211 1,249 1,394 1,839 2,470 2,509 2,653 2,826 2,913 2,952 3,095 Adjusted net income $120,209 $132,321 $121,469 $119,937 $116,648 $121,994 $116,670 $125,026 $121,328 $125,669 $131,711 $134,164 $121,348 Return on average assets 0.98% 1.07% 0.99% 0.99% 0.98% 1.04% 1.03% 1.12% 1.10% 1.14% 1.19% 1.25% 1.13% Return on average tangible assets 1.04 1.14 1.06 1.06 1.05 1.12 1.11 1.21 1.19 1.24 1.29 1.36 1.24 Average tangible assets is a non-GAAP financial measure. The following table presents a reconciliation of this non-GAAP measure with the related GAAP measure for the three months ended March 31, 2015; December 31, September 30, June 30, and March 31, 2014; December 31, September 30, June 30, and March 31, 2013; and December 31, September 30, June 30, and March 31, 2012. Reconciliations of GAAP and Non-GAAP Financial Measures 950 |