 First Quarter 2017 Investor Presentation Exhibit 99.1 |
 Cautionary Statements Forward-Looking Information This presentation may include forward-looking statements by the Company and our authorized officers pertaining to such matters as our goals, intentions, and expectations regarding revenues, earnings, loan production, asset quality, capital levels, and acquisitions, among other matters; our estimates of future costs and benefits of the actions we may take; our assessments of probable losses on loans; our assessments of interest rate and other market risks; and our ability to achieve our financial and other strategic goals. Forward-looking statements are typically indentified by such words as “believe,” “expect,” “anticipate,” “intend,” “outlook,” “estimate,” “forecast,” “project,” and other similar words and expressions, and are subject to numerous assumptions, risks, and uncertainties, which change over time. Additionally, forward-looking statements speak only as of the date they are made; the Company does not assume any duty, and does not undertake, to update our forward-looking statements. Furthermore, because forward-looking statements are subject to assumptions and uncertainties, actual results or future events could differ, possibly materially, from those anticipated in our statements, and our future performance could differ materially from our historical results. Our forward-looking statements are subject to the following principal risks and uncertainties: general economic conditions and trends, either nationally or locally; conditions in the securities markets; changes in interest rates; changes in deposit flows, and in the demand for deposit, loan, and investment products and other financial services; changes in real estate values; changes in the quality or composition of our loan or investment portfolios; changes in competitive pressures among financial institutions or from non-financial institutions; our ability to obtain the necessary shareholder and regulatory approvals of any acquisitions we may propose, our ability to successfully integrate any assets, liabilities, customers, systems, and management personnel we may acquire into our operations, and our ability to realize related revenue synergies and cost savings within expected time frames; changes in legislation, regulations, and policies; and a variety of other matters which, by their nature, are subject to significant uncertainties and/or are beyond our control. More information regarding some of these factors is provided in the Risk Factors section of our Form 10-K for the year ended December 31, 2016 and in other SEC reports we file. Our forward-looking statements may also be subject to other risks and uncertainties, including those we may discuss in this presentation, or in our SEC filings, which are accessible on our website and at the SEC’s website, www.sec.gov. Our Supplemental Use of Non-GAAP Financial Measures This presentation may contain certain non-GAAP financial measures which management believes to be useful to investors in understanding the Company’s performance and financial condition, and in comparing our performance and financial condition with those of other banks. Such non-GAAP financial measures are supplemental to, and are not to be considered in isolation or as a substitute for, measures calculated in accordance with GAAP. Page 2 |
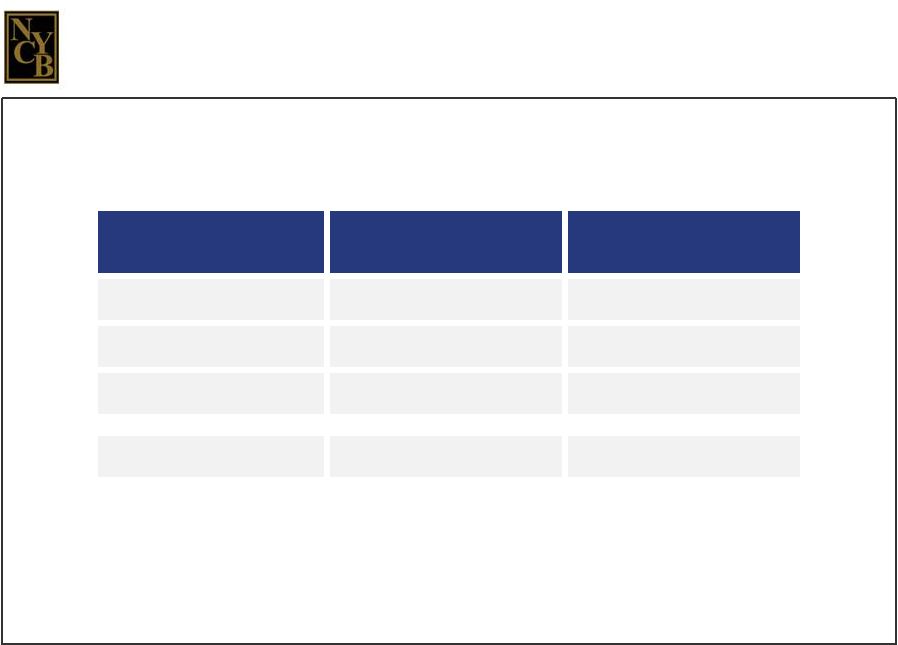
 Page 3 ASSETS DEPOSITS MULTI-FAMILY LOANS MARKET CAP TOTAL RETURN ON INVESTMENT $48.8 billion $28.7 billion $27.1 billion $6.8 billion 4,237% With assets of $48.8 billion at 3/31/17, we are the 22nd largest U.S. bank holding company. With deposits of $28.7 billion and 255 branches in Metro New York, New Jersey, Ohio, Florida, and Arizona at 3/31/17, we rank 28th among the nation’s largest depositories. With a portfolio of $27.1 billion at the end of March, we are a leading producer of multi- family loans in New York City. With a market cap of $6.8 billion at 3/31/17, we rank 25th among the nation’s publicly traded banks and thrifts. From 11/23/93 through 3/31/17, we provided our charter investors with a total return on investment of 4,237%. (a) We rank among the largest U.S. bank holding companies. (a) Bloomberg Note: Except as otherwise indicated, all industry data was provided by S&P Global Market Intelligence as of 6/1/17. Page 3 |
 OUR BUSINESS MODEL |
 STRATEGIC LOAN PRODUCTION |
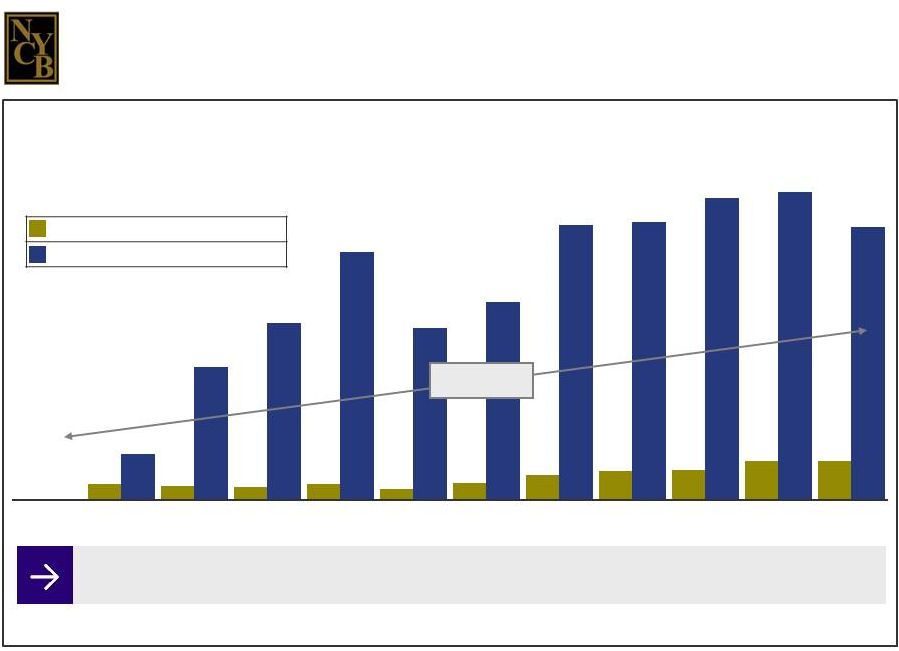
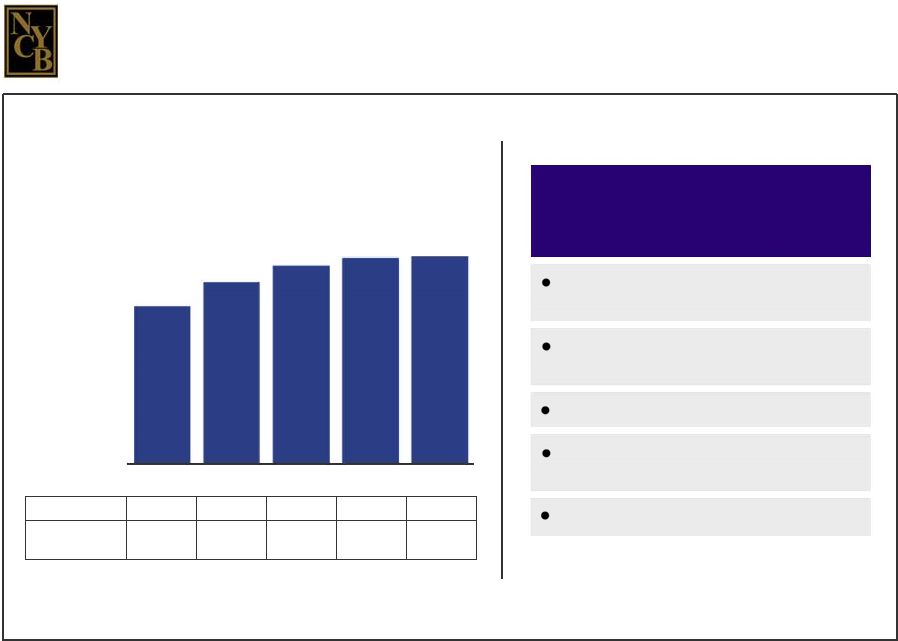 $20,714 $23,849 $25,989 $26,961 $27,054 12/31/13 12/31/14 12/31/15 12/31/16 3/31/17 PORTFOLIO STATISTICS AT OR FOR THE 3 MONTHS ENDED 3/31/17 MULTI-FAMILY LOAN PORTFOLIO (in millions) Originations: $7,417 $7,584 $9,214 $5,685 $955 Net Charge-Offs (Recoveries): $11 $(0) $(4) $(0) $(0) We are a leading producer of multi-family loans on non-luxury buildings in NYC with rent-regulated units. Page 6 % of non-covered loans held for investment = 72.5% Average principal balance = $5.5 million Weighted average life = 3.3 years % of our multi-family loans located in Metro New York = 77.5% % of HFI loan originations = 57.7% |
 The way we lend in this market niche has distinguished our performance from that of other multi-family lenders. Of the loans in our portfolio that are collateralized by multi-family buildings in the five boroughs of New York City, 88% are collateralized by buildings with rent- regulated units featuring below-market rents. Rent-regulated buildings are more likely to retain their tenants – and, therefore, their revenue stream – in downward credit cycles. Together with our conservative underwriting standards, our focus on multi-family lending in this niche market has resulted in our record of superior asset quality. Over the course of our public life, losses on multi-family loans have amounted to a mere $145.5 million, representing 0.20% of the $73.1 billion of multi-family loans we have originated since 1993. Multi-family loans are less costly to produce and service than other types of loans, and therefore contribute to our superior efficiency. Page 7 |
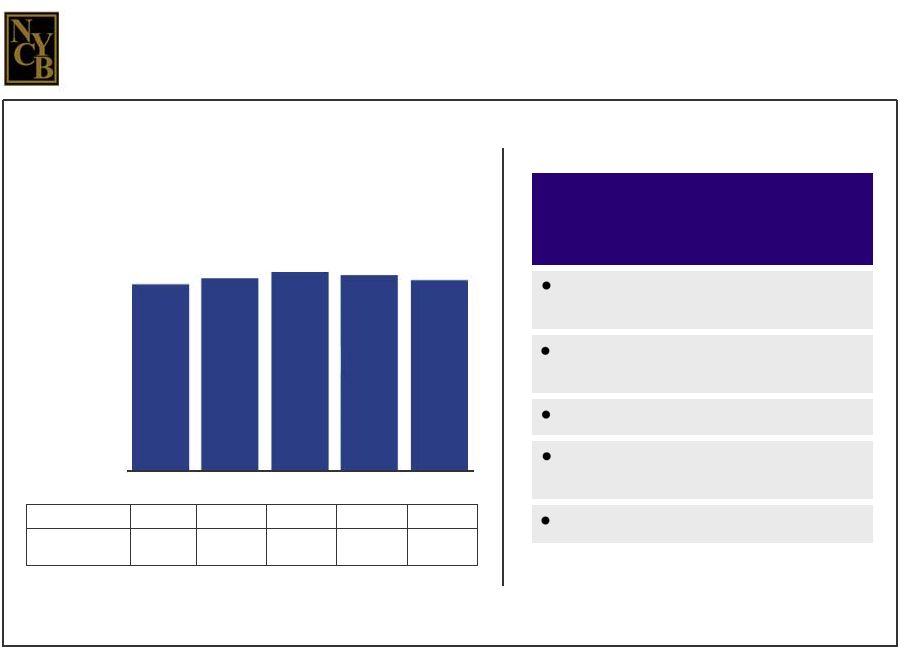 $7,366 $7,637 $7,860 $7,727 $7,536 12/31/13 12/31/14 12/31/15 12/31/16 3/31/17 (in millions) Originations: $2,168 $1,661 $1,842 $1,180 $250 Net Charge-Offs (Recoveries): $0 $1 $(1) $(1) $(0) Commercial real estate lending has been a logical extension of our emphasis on multi-family loans. PORTFOLIO STATISTICS AT OR FOR THE 3 MONTHS ENDED 3/31/17 % of non-covered loans held for investment = 20.2% Average principal balance = $5.6 million Weighted average life = 3.1 years % of our CRE loans located in Metro New York = 89.9% % of HFI loan originations = 15.1% COMMERCIAL REAL ESTATE L OAN PORTFOLIO Page 8 |
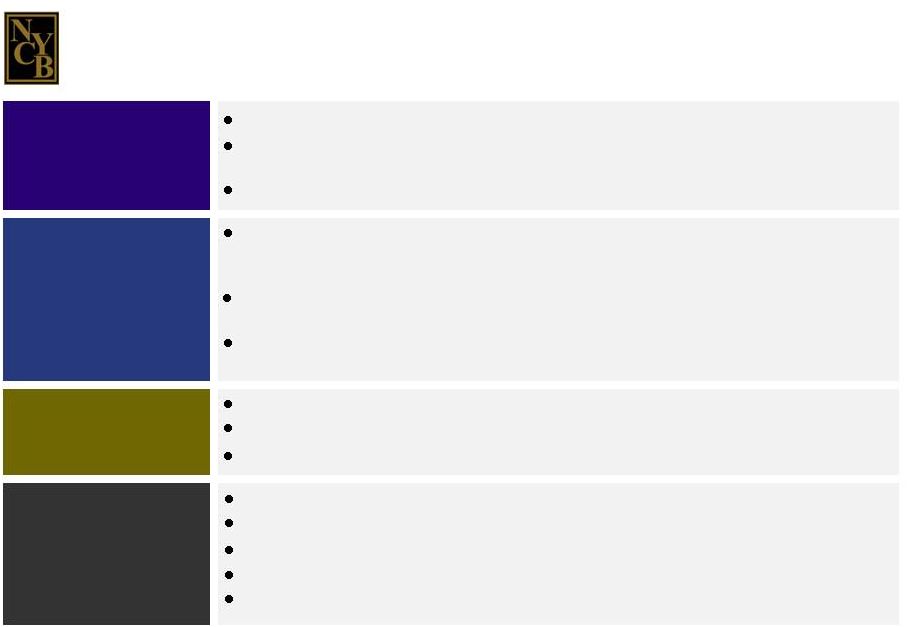
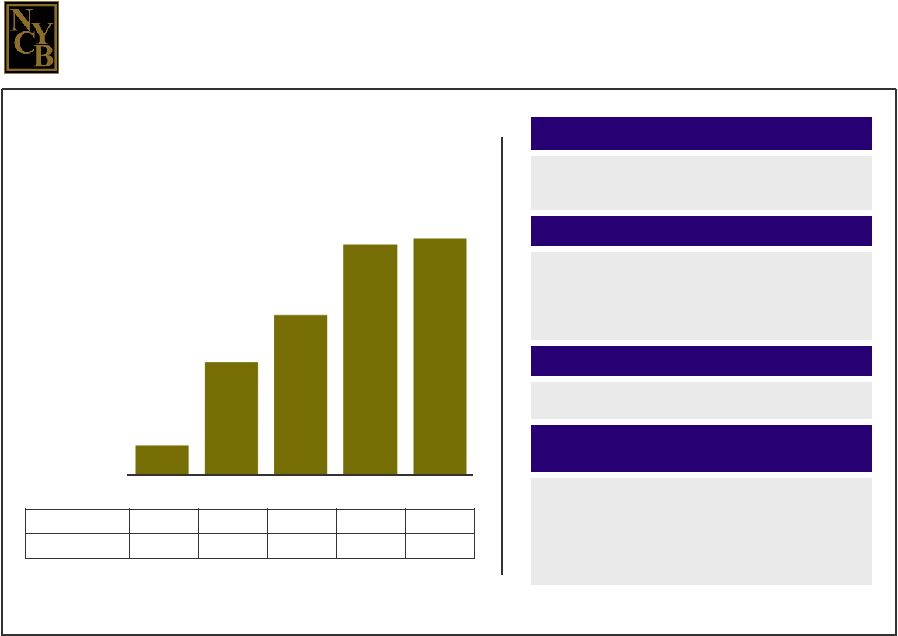 Page 9 $172 $635 $895 $1,286 $1,318 12/31/13 12/31/14 12/31/15 12/31/16 3/31/17 SPECIALTY FINANCE LOAN AND LEASE PORTFOLIO (in millions) Originations: $258 $848 $1,068 $1,266 $269 Net charge-Offs: $0 $0 $0 $0 $0 The launch of our specialty finance business provided us with another lending niche of high quality. • Syndicated asset-based (ABLs) and dealer floor- plan (DFPLs) loans • Equipment loan and lease financing (EF) • Large corporate obligors • Investment grade or near-investment grade ratings • Mostly publicly traded • Participants in stable, nationwide industries • Floating rates tied to LIBOR (ABLs and DFPLs) • Fixed rates at a spread over treasuries (EF) • We require a perfected first-security interest in or outright ownership of the underlying collateral • Loans are structured as senior debt or as non- cancellable leases • Transactions are re-underwritten in-house • Underlying documentation reviewed by counsel LOAN TYPES PRICING CLIENT CHARACTERISTICS RISK-AVERSE CREDIT & UNDERWRITING STANDARDS |
 ASSET QUALITY |
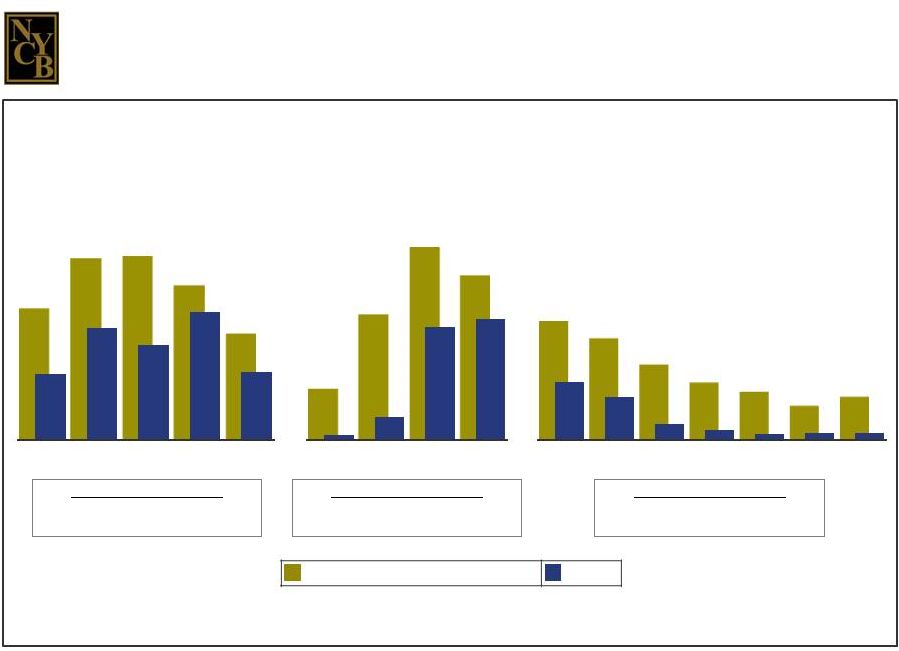 Page 11 (a) Non-performing loans and total loans exclude covered loans and non-covered purchased credit-impaired (“PCI”) loans. (b) Non-performing loans are defined as non-accrual loans and loans 90 days or more past due but still accruing interest. Our record of asset quality in downward credit cycles has consistently distinguished us from our industry peers. S & L CRISIS GREAT RECESSION CURRENT CREDIT CYCLE Average NPLs/Total Loans NYCB: 2.08% SNL U.S. Bank and Thrift Index: 3.34% Average NPLs/Total Loans NYCB: 1.43% SNL U.S. Bank and Thrift Index: 2.89% Average NPLs/Total Loans NYCB: 0.47% SNL U.S. Bank and Thrift Index: 1.50% NON-PERFORMING LOANS (a)(b) / TOTAL LOANS (a) 2.91% 4.00% 4.05% 3.41% 2.35% 1.46% 2.48% 2.10% 2.83% 1.51% 12/31/89 12/31/90 12/31/91 12/31/92 12/31/93 1.11% 2.71% 4.17% 3.56% 0.11% 0.51% 2.47% 2.63% 12/31/07 12/31/08 12/31/09 12/31/10 2.60% 2.22% 1.66% 1.26% 1.07% 0.76% 0.94% 1.28% 0.96% 0.35% 0.23% 0.13% 0.15% 0.16% 12/31/11 12/31/12 12/31/13 12/31/14 12/31/15 12/31/16 3/31/17 SNL U.S Bank and Thrift Index NYCB Page 11 |
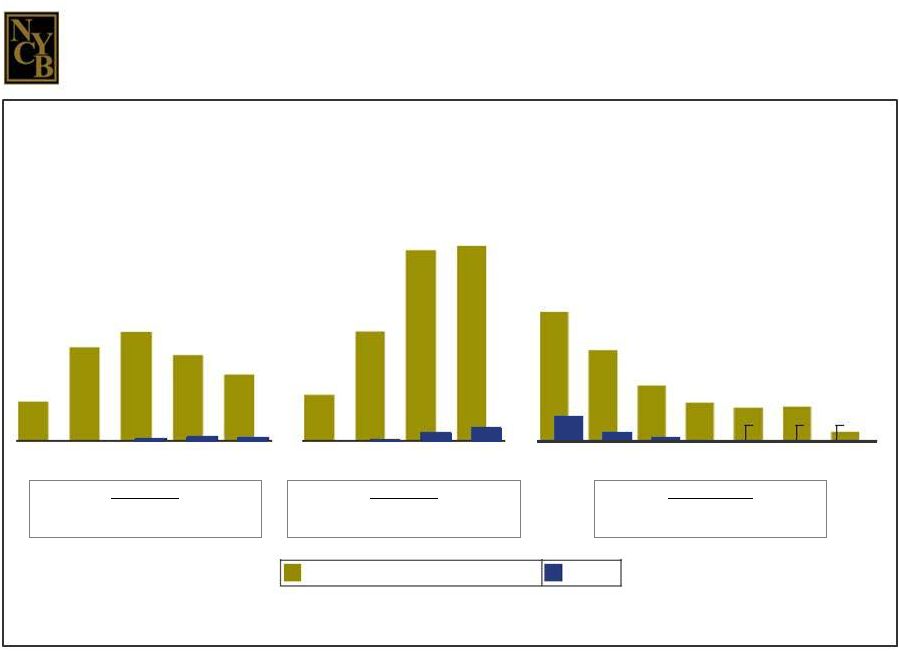 S & L CRISIS Few of our non-performing loans have resulted in actual losses. GREAT RECESSION CURRENT CREDIT CYCLE NET CHARGE-OFFS / AVERAGE LOANS 5-Year Total NYCB: 17 bp SNL U.S. Bank and Thrift Index: 540 bp 4-Year Total NYCB: 37 bp SNL U.S. Bank and Thrift Index: 803 bp 6.25-Year Total NYCB: 53 bp SNL U.S. Bank and Thrift Index: 536 bp * * Non-annualized Page 12 SNL U.S. Bank and Thrift Index NYCB 0.54% 1.28% 1.50% 1.17% 0.91% 0.00% 0.00% 0.04% 0.07% 0.06% 1989 1990 1991 1992 1993 0.68% 1.63% 2.83% 2.89% 0.00% 0.03% 0.13% 0.21% 2007 2008 2009 2010 1.77% 1.24% 0.76% 0.53% 0.46% 0.47% 0.13% 0.35% 0.13% 0.05% 0.01% 0.01% 2011 2012 2013 2014 2015 2016 1Q 2017 (0.02)% 0.00% |
 Page 13 The quality of our assets reflects the nature of our lending niche and our strong underwriting standards. C ONSERVATIVE UNDERWRITING Conservative loan-to-value ratios Conservative debt service coverage ratios: 120% for multi-family loans and 130% for CRE loans Multi-family and CRE loans are based on the lower of economic or market value. A CTIVE BOARD I NVOLVEMENT The Mortgage Committee and the Credit Committee approve all mortgage loans >$50 million and all ��other C&I” loans >$5 million; the Credit Committee also approves all specialty finance loans >$15 million. A member of the Mortgage or Credit Committee participates in inspections on multi-family loans in excess of $7.5 million, and CRE and ADC loans in excess of $4.0 million. All loans of $20 million or more originated by the Community Bank and all loans of $10 million or more originated by the Commercial Bank are reported to the Board. MULTIPLE A PPRAISALS All properties are appraised by independent appraisers. All independent appraisals are reviewed by in-house appraisal officers. A second independent appraisal review is performed on loans that are large and complex. R ISK -A VERSE M IX OF N ON -C OVERED L OANS H ELD FOR I NVESTMENT ( AT 3/31/17) Multi-family: 72.5% CRE: 20.2% One-to-Four Family: 1.1% ADC: 1.0% Commercial & Industrial: 5.1% Page 13 |
 EFFICIENCY |
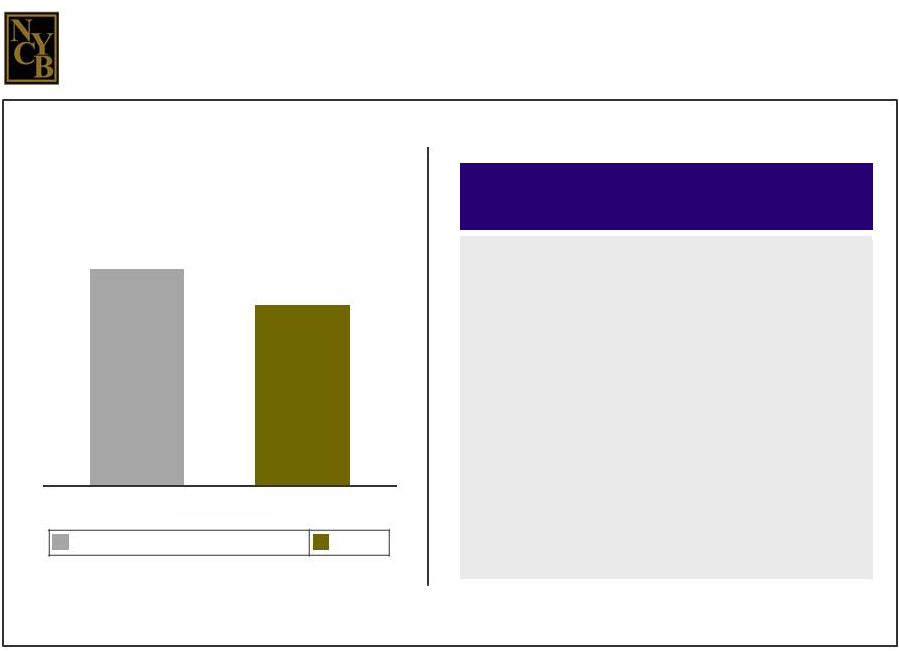 Page 15 Efficiency has been another Company hallmark. EFFICIENCY RATIO (a) (a) We calculate our efficiency ratio by dividing our operating expenses by the sum of our net interest income and our non-interest income. 61.27% 50.99% 1Q 2017 SNL U.S. Bank and Thrift Index NYCB HISTORICAL DRIVERS OF OUR EFFICIENCY • Multi-family and CRE lending are both broker-driven, with the borrower paying fees to the mortgage brokerage firm. • Products and services are typically developed by third-party providers; their sales are a complementary source of revenues. • Franchise expansion has largely stemmed from mergers and acquisitions; we rarely engage in de novo branch development. • Most of our deposits have been acquired through earnings-accretive acquisitions. Multi-family and CRE lending are both broker - driven, with the borrower paying fees to the mortgage brokerage firm. Products and services are typically developed by third-party providers; their sales are a complementary source of revenues. Franchise expansion has largely stemmed from mergers and acquisitions; we rarely engage in de novo branch development. Most of our deposits have been acquired through earnings - accretive acquisitions. |
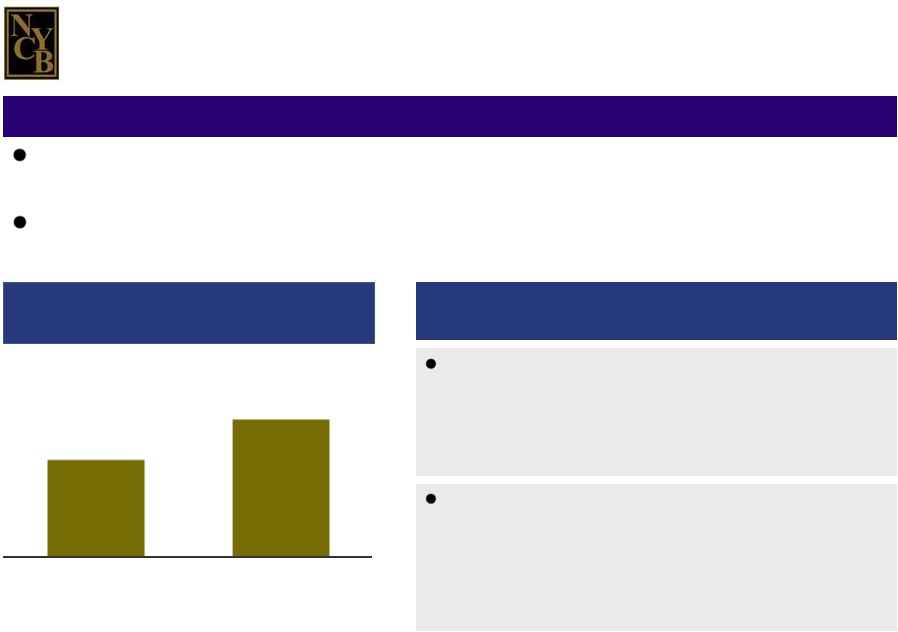 Page 16 36% 51% 2010 1Q 2017 Key infrastructure investments to date include: — Enhanced ERM and corporate governance frameworks — Bottom-up capital planning and stress testing capabilities — Substantial expansion of regulatory compliance staff Depending on when we cross the SIFI threshold, the cost of SIFI compliance may reflect: — Further investment in our IT infrastructure and personnel — Preparations for CCAR reporting in 2020 — Development of a living will for 2019 Following the enactment of the Dodd-Frank Act, we began allocating significant resources towards SIFI preparedness. The degree to which we have already leveraged the cost of SIFI compliance is reflected in the ~ 1,500-basis point increase in our efficiency ratio since the enactment of Dodd-Frank. Our efficiency ratio has increased significantly since the enactment of Dodd-Frank. NYCB EFFICIENCY R ATIO PRIOR TO AND SINCE DODD-FRANK PREPARING FOR SIFI STATUS SIFI COMPLIANCE |
 RESIDENTIAL MORTGAGE BANKING |
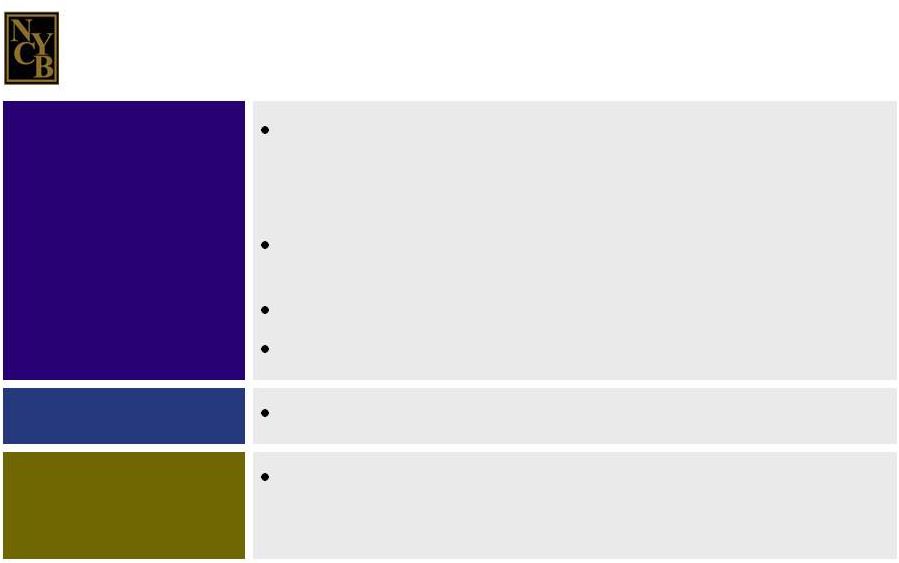 Page 18 We are a nationwide producer of 1-4 family loans. F EATURES Loan production is driven by our proprietary real time, web- accessible mortgage banking technology platform, which securely controls the lending process while mitigating business and regulatory risks. Approximately 900 approved clients include community banks, credit unions, mortgage companies, and mortgage brokers. 100% of loans funded are full documentation, prime credit loans. At 3/31/2017, loans serviced for GSEs totaled $21.2 billion. CREDIT QUALITY As of 3/31/2017, 99.7% of all funded loans were current. LIMITED R EPURCHASE R ISK Of the $49.3 billion of 1-4 family loans sold to GSEs since 2010 – when we launched our mortgage banking business – only 29 loans totaling $8.3 million (0.017%) have been repurchased. Page 18 |
 GROWTH THROUGH ACQUISITIONS |
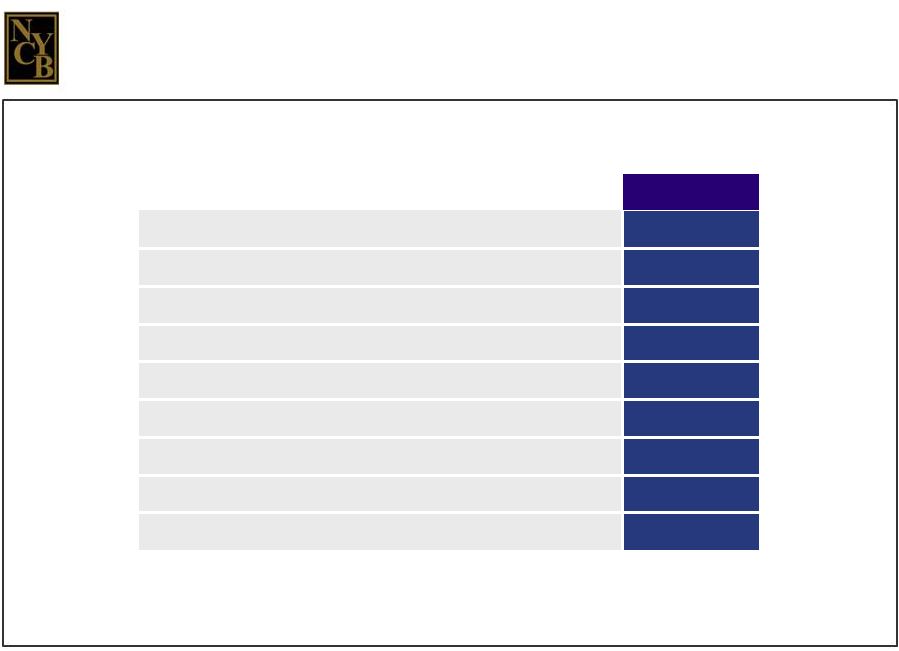
 Page 20 We have a long history of earnings-accretive transactions. The number of branches indicated for our transactions is the number of branches in our current franchise that stemmed from each. 1. Nov. 2000 Haven Bancorp (HAVN) Assets: $2.7 billion Deposits: $2.1 billion Branches: 25 2. July 2001 Richmond County Financial Corp. (RCBK) Assets: $3.7 billion Deposits: $2.5 billion Branches: 24 3. Oct. 2003 Roslyn Bancorp, Inc. (RSLN) Assets: $10.4 billion Deposits: $5.9 billion Branches: 38 4. Dec. 2005 Long Island Financial Corp. (LICB) Assets: $562 million Deposits: $434 million Branches: 9 5. April 2006 Atlantic Bank of New York (ABNY) Assets: $2.8 billion Deposits: $1.8 billion Branches: 14 6. April 2007 PennFed Financial Services, Inc. (PFSB) Assets: $2.3 billion Deposits: $1.6 billion Branches: 21 7. July 2007 NYC branch network of Doral Bank, FSB (Doral- NYC) Assets: $485 million Deposits: $370 million Branches: 11 8. Oct. 2007 Synergy Financial Group, Inc. (SYNF) Assets: $892 million Deposits: $564 million Branches: 16 9. Dec. 2009 AmTrust Bank Assets: $11.0 billion Deposits: $8.2 billion Branches: 64 10. March 2010 Desert Hills Bank Assets: $452 million Deposits: $375 million Branches: 3 11. June 2012 Aurora Bank FSB Assets: None Deposits: $2.2 billion Branches: 0 Payment Received: $24.0 million Transaction Type: Savings Bank Commercial Bank Branch FDIC Deposit |
 Page 21 The termination of the Astoria merger was due to external factors, and continues to impact the value of our shares. Financially and strategically, the Astoria merger was a well-conceived transaction. Both our shareholders and Astoria’s overwhelmingly approved the merger. The regulatory approval process was significantly lengthened by virtue of the fact that in approving the merger, our regulators would also be approving the creation of a new SIFI bank. As a result, the merger agreement expired before the regulatory approval process was completed. While extending the agreement was an option, the decision to terminate the agreement was also impacted by external factors faced by Astoria’s board. While our performance continues to reflect the impact of the merger’s termination, we remain optimistic about our prospects, given the consistent strength of our business model, our historical capacity for value creation, and our anticipation of regulatory change. |
 1Q 2017 PERFORMANCE HIGHLIGHTS |
 Page 23 (dollars in thousands, except per share data) 1Q 2017 Strong Profitability Measures: Earnings $103,957 Earnings per common share $0.21 Return on average assets 0.85% Return on average common stockholders’ equity 6.76 Return on average tangible assets 0.90 Return on average tangible stockholders’ equity 11.20 Net interest margin 2.71 Efficiency ratio 50.99 Income Statement Highlights (a) ROTA and ROTCE are non-GAAP financial measures. Please see page 34 for a discussion and reconciliation of these measures to our ROA and ROCE. (a) (a) |
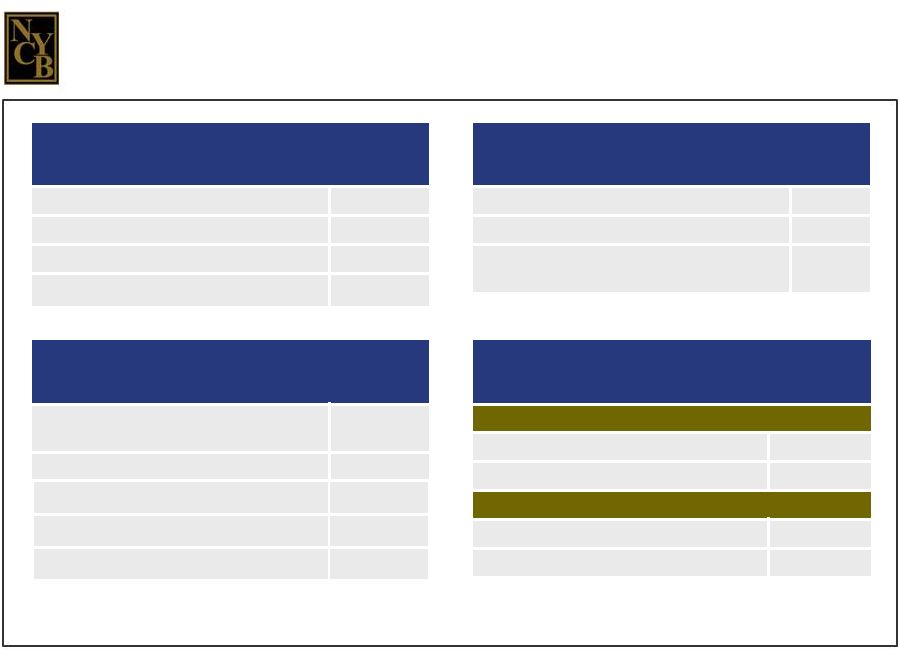 COMPANY CAPITAL 3/31/17 Common stockholders’ equity / total assets 12.58% Common equity tier 1 capital ratio 10.79 Tier 1 risk-based capital ratio 12.23 Total risk-based capital ratio 13.71 Leverage capital ratio 9.24 BANK CAPITAL 3/31/17 The Community Bank: Common equity tier 1 capital ratio 12.65% Leverage capital ratio 9.55 The Commercial Bank: Common equity tier 1 capital ratio 14.90% Leverage capital ratio 10.82 BALANCE SHEET 3/31/17 Loans, net / total assets 79.8% Securities / total assets 7.6 Deposits / total assets 58.8 Wholesale borrowings / total assets 26.3 ASSET QUALITY At or for the Three Months Ended 3/31/17 Non-performing loans (a) / total loans (a) 0.16% Non-performing assets (b) / total assets (b) 0.15 Net charge-offs / average loans (non- annualized) 0.01 Balance Sheet Highlights (a) Non-performing loans and total loans exclude covered loans and non-covered PCI loans. (b) Non-performing assets and total assets exclude covered loans, covered OREO, and non-covered PCI loans. Page 24 |
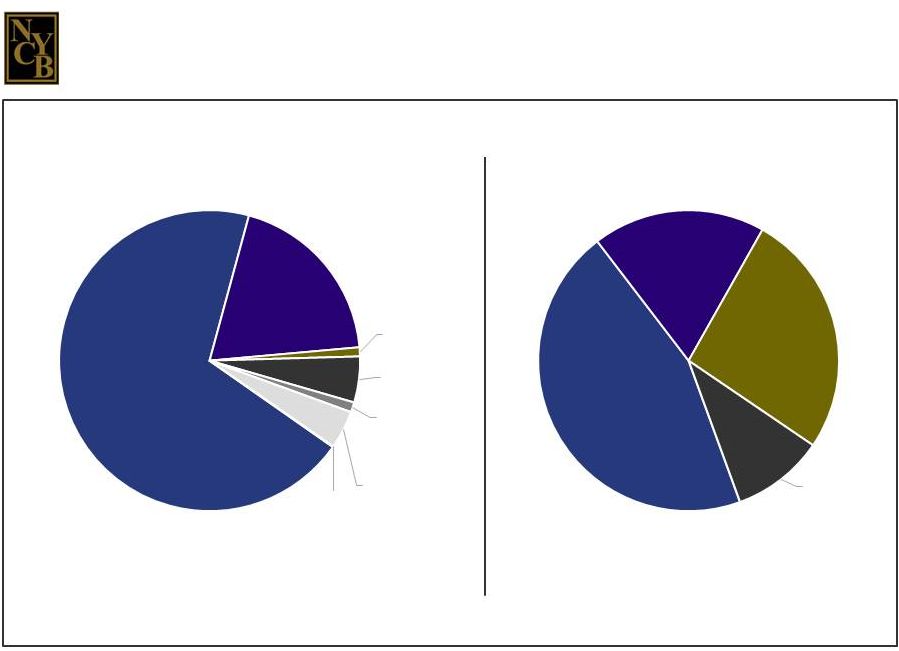 Page 25 TOTAL HFI LOANS: $38.9 BN AVERAGE YIELD ON LOANS: 3.67% TOTAL DEPOSITS: $28.7 BN AVERAGE COST OF INTEREST-BEARING DEPOSITS: 0.75% LOANS AT 3/31/17 DEPOSITS AT 3/31/17 Loans and Deposits ADC 1% C&I 5% 1-4 Family (Non- covered) 1% Covered Loans 4% Other 0% Non- Interest- Bearing 10% Page 25 Multi- Family 70% CRE 19% NOW and MMA 45% Savings 19% CDs 26% |
 Page 26 Reflecting the benefit of our recent preferred stock offering, our leverage and risk-based capital ratios exceed those of our regional peers. RATIO NYCB AT 3/31/17 REGIONAL PEERS (a) (MEDIAN AT 3/31/17) Tier 1 Risk-Based Capital 12.23% 11.58% Total Risk-Based Capital 13.71 13.26 Tier 1 Leverage 9.24 9.18 Common Equity Tier 1 10.79 11.11 (a) Regional peers include BKU, BOKF, CBSH, CMA, EWBC, FHN, FRC, HBAN, KEY, MTB, PBCT, SBNY, SIVB, SNV, WBS, and ZION. |
 Page 27 STRATEGIC ASSET MANAGEMENT Total Assets at 9/30/14: $48.7 Billion Reduced securities by $3.8 billion through a combination of repayments, sales, and calls Sold loans of $4.5 billion: – $2.8 billion of multi-family loans (largely through participations) – $1.1 billion of CRE loans (largely through participations) – $631.3 million of 1–4 family loans – $3.4 million of ADC loans Other net reductions of $13.0 billion (including loan satisfactions and refinancings) Total Assets at 3/31/17: $48.8 Billion Originated $17.7 billion of multi-family loans Originated $3.7 billion of CRE loans Result: A $145,000 increase in total assets from 9/30/14 – 3/31/17. Since 4Q 2014, we have been managing our assets below the current SIFI threshold. |
 Page 28 Our commitment to building value for our investors is reflected in our total return over the course of our public life. TOTAL RETURN ON INVESTMENT (a) Bloomberg 244% 213% 209% 245% 168% 260% 393% 450% 461% 609% 615% 717% 2,059% 2,754% 3,843% 2,670% 3,069% 4,265% 4,319% 4,682% 4,784% 4,237% 11/23/93 12/31/99 12/31/08 12/31/09 12/31/10 12/31/11 12/31/12 12/31/13 12/31/14 12/31/15 12/31/16 3/31/17 SNL U.S. Bank and Thrift Index NYCB (a) CAGR since IPO: 24.1% As a result of nine stock splits between 1994 and 2004, our charter shareholders have 2,700 shares of NYCB stock for each 100 shares originally purchased. |
 LOOKING FORWARD |
 Page 30 We continue to be encouraged by recent signs of regulatory easing. Qualitative stress testing for financial institutions with assets greater than $50 billion and less than $250 billion has been eliminated. The regulatory approval process for mergers resulting in the creation of a bank holding company with assets below $100 billion has been eased; the threshold was previously $25 billion. There is general consensus among regulators, congressional leadership, and the current administration that the current $50 billion SIFI threshold should be raised. Raising the SIFI threshold would: — facilitate our ability to engage in mergers with institutions, regardless of size; — enable us to grow our loan portfolio organically, as well as through acquisitions; — enable us to grow our deposits and our market share through acquisitions; and — reduce some of the costs we’ve incurred in our preparations for SIFI status, thereby improving our efficiency ratio. |
 Page 31 We also are encouraged by proposed changes to the federal tax laws for corporations. The proposed changes to the federal corporate tax laws would be expected to benefit our earnings in two important ways: Our current federal corporate tax rate is 35%. All other things being equal, a reduction in the federal tax rate to 20% would be approximately 22% accretive to our earnings. Our net deferred tax liabilities would be eliminated. |
 Page 32 6/6/17 For More Information VISIT OUR WEBSITE : ir.myNYCB.com E-MAIL REQUESTS TO : CALL INVESTOR RELATIONS AT : WRITE TO : ir@myNYCB.com (516) 683-4420 Investor Relations New York Community Bancorp, Inc. 615 Merrick Avenue Westbury, NY 11590 |
 APPENDIX |
 Page 34 While average stockholders’ equity, average assets, return on average assets, and return on average stockholders’ equity are financial measures that are recorded in accordance with U.S. generally accepted accounting principles ("GAAP"), average tangible stockholders’ equity, average tangible assets, return on average tangible assets, and return on average tangible stockholders’ equity are not. Nevertheless, it is management’s belief that these non-GAAP measures should be disclosed in our SEC filings, earnings releases, and other investor communications, for the following reasons: 1. Average tangible stockholders’ equity is an important indication of the Company’s ability to grow organically and through business combinations, as well as our ability to pay dividends and to engage in various capital management strategies. 2. Returns on average tangible assets and average tangible stockholders’ equity are among the profitability measures considered by current and prospective investors, both independent of, and in comparison with, our peers. We calculate average tangible stockholders’ equity by subtracting from average stockholders’ equity the sum of our average goodwill and core deposit intangibles (“CDI”), and calculate average tangible assets by subtracting the same sum from our average assets. Average tangible stockholders’ equity, average tangible assets, and the related non-GAAP profitability measures should not be considered in isolation or as a substitute for average stockholders’ equity, average assets, or any other profitability or capital measure calculated in accordance with GAAP. Moreover, the manner in which we calculate these non-GAAP measures may differ from that of other companies reporting non-GAAP measures with similar names. The following table presents reconciliations of our average common stockholders’ equity and average tangible common stockholders’ equity, our average assets and average tangible assets, and the related GAAP and non-GAAP profitability measures for the three months ended March 31, 2017: (dollars in thousands) For the Three Months Ended March 31, 2017 Average common stockholders’ equity $ 6,151,286 Less: Average goodwill and core deposit intangibles (2,436,286) Average tangible common stockholders’ equity $ 3,715,000 Average assets $48,736,309 Less: Average goodwill and core deposit intangibles (2,436,286) Average tangible assets $46,300,023 Net income available to common shareholders (1) $103,957 Add back: Amortization of core deposit intangibles, net of tax 92 Adjusted net income available to common shareholders (2) $104,049 GAAP: Return on average assets 0.85% Return on average common stockholders’ equity 6.76 Non-GAAP: Return on average tangible assets 0.90 Return on average tangible common stockholders’ equity 11.20 (1) To calculate our returns on average assets and average common stockholders’ equity for a period, we divide the net income available to common shareholders generated during that period by the average assets and the average common stockholders’ equity recorded during that time. (2) To calculate our returns on average tangible assets and average tangible common stockholders’ equity for a period, we adjust the net income available to common shareholders generated during that period by adding back the amortization of CDI, net of tax, and then divide that adjusted net income by the average tangible assets and the average tangible common stockholders’ equity recorded during that time. Reconciliations of GAAP and Non-GAAP Measures |