Exhibit 99.1 Third Quarter 2019 Investor PresentationExhibit 99.1 Third Quarter 2019 Investor Presentation
Cautionary Statements Forward-Looking Information This presentation may include forward‐looking statements by the Company and our authorized officers pertaining to such matters as our goals, intentions, and expectations regarding revenues, earnings, loan production, asset quality, capital levels, and acquisitions, among other matters; our estimates of future costs and benefits of the actions we may take; our assessments of probable losses on loans; our assessments of interest rate and other market risks; and our ability to achieve our financial and other strategic goals. Forward‐looking statements are typically identified by such words as “believe,” “expect,” “anticipate,” “intend,” “outlook,” “estimate,” “forecast,” “project,” and other similar words and expressions, and are subject to numerous assumptions, risks, and uncertainties, which change over time. Additionally, forward‐looking statements speak only as of the date they are made; the Company does not assume any duty, and does not undertake, to update our forward‐looking statements. Furthermore, because forward‐looking statements are subject to assumptions and uncertainties, actual results or future events could differ, possibly materially, from those anticipated in our statements, and our future performance could differ materially from our historical results. Our forward‐looking statements are subject to the following principal risks and uncertainties: general economic conditions and trends, either nationally or locally; conditions in the securities markets; changes in interest rates; changes in deposit flows, and in the demand for deposit, loan, and investment products and other financial services; changes in real estate values; changes in the quality or composition of our loan or investment portfolios; changes in competitive pressures among financial institutions or from non‐financial institutions; our ability to obtain the necessary shareholder and regulatory approvals of any acquisitions we may propose, our ability to successfully integrate any assets, liabilities, customers, systems, and management personnel we may acquire into our operations, and our ability to realize related revenue synergies and cost savings within expected time frames; changes in legislation, regulations, and policies; and a variety of other matters which, by their nature, are subject to significant uncertainties and/or are beyond our control. More information regarding some of these factors is provided in the Risk Factors section of our Form 10‐K for the year ended December 31, 2018 and in other SEC reports we file. Our forward‐looking statements may also be subject to other risks and uncertainties, including those we may discuss in this presentation, or in our SEC filings, which are accessible on our website and at the SEC’s website, www.sec.gov. Our Supplemental Use of Non-GAAP Financial Measures This presentation may contain certain non-GAAP financial measures which management believes to be useful to investors in understanding the Company’s performance and financial condition, and in comparing our performance and financial condition with those of other banks. Such non-GAAP financial measures are supplemental to, and are not to be considered in isolation or as a substitute for, measures calculated in accordance with GAAP. Page 2Cautionary Statements Forward-Looking Information This presentation may include forward‐looking statements by the Company and our authorized officers pertaining to such matters as our goals, intentions, and expectations regarding revenues, earnings, loan production, asset quality, capital levels, and acquisitions, among other matters; our estimates of future costs and benefits of the actions we may take; our assessments of probable losses on loans; our assessments of interest rate and other market risks; and our ability to achieve our financial and other strategic goals. Forward‐looking statements are typically identified by such words as “believe,” “expect,” “anticipate,” “intend,” “outlook,” “estimate,” “forecast,” “project,” and other similar words and expressions, and are subject to numerous assumptions, risks, and uncertainties, which change over time. Additionally, forward‐looking statements speak only as of the date they are made; the Company does not assume any duty, and does not undertake, to update our forward‐looking statements. Furthermore, because forward‐looking statements are subject to assumptions and uncertainties, actual results or future events could differ, possibly materially, from those anticipated in our statements, and our future performance could differ materially from our historical results. Our forward‐looking statements are subject to the following principal risks and uncertainties: general economic conditions and trends, either nationally or locally; conditions in the securities markets; changes in interest rates; changes in deposit flows, and in the demand for deposit, loan, and investment products and other financial services; changes in real estate values; changes in the quality or composition of our loan or investment portfolios; changes in competitive pressures among financial institutions or from non‐financial institutions; our ability to obtain the necessary shareholder and regulatory approvals of any acquisitions we may propose, our ability to successfully integrate any assets, liabilities, customers, systems, and management personnel we may acquire into our operations, and our ability to realize related revenue synergies and cost savings within expected time frames; changes in legislation, regulations, and policies; and a variety of other matters which, by their nature, are subject to significant uncertainties and/or are beyond our control. More information regarding some of these factors is provided in the Risk Factors section of our Form 10‐K for the year ended December 31, 2018 and in other SEC reports we file. Our forward‐looking statements may also be subject to other risks and uncertainties, including those we may discuss in this presentation, or in our SEC filings, which are accessible on our website and at the SEC’s website, www.sec.gov. Our Supplemental Use of Non-GAAP Financial Measures This presentation may contain certain non-GAAP financial measures which management believes to be useful to investors in understanding the Company’s performance and financial condition, and in comparing our performance and financial condition with those of other banks. Such non-GAAP financial measures are supplemental to, and are not to be considered in isolation or as a substitute for, measures calculated in accordance with GAAP. Page 2

Overview: Who we are We are a leading producer of multi-family loans in New York City. Our niche focuses on non-luxury apartment → buildings that are rent-regulated featuring below-market rents. Our expertise in this particular lending niche arises from: • A consistent presence in this market for 50 years over all business cycles → • Long standing relationships with our borrowers, who come to us for our service and execution capabilities • Decades long relationships with the top commercial mortgage brokers in the NYC market In addition, we originate commercial real estate loans, and to a much lesser extent, acquisition, development, → and construction loans. We also originate commercial and industrial loans, including specialty finance loans. We operate over 230 branches in five states with leading market share in many of the markets we operate in. → We are a conservative lender across all of our loan portfolios. → We maintain an efficient operation. → We complement our organic growth with accretive acquisitions. → Page 3Overview: Who we are We are a leading producer of multi-family loans in New York City. Our niche focuses on non-luxury apartment → buildings that are rent-regulated featuring below-market rents. Our expertise in this particular lending niche arises from: • A consistent presence in this market for 50 years over all business cycles → • Long standing relationships with our borrowers, who come to us for our service and execution capabilities • Decades long relationships with the top commercial mortgage brokers in the NYC market In addition, we originate commercial real estate loans, and to a much lesser extent, acquisition, development, → and construction loans. We also originate commercial and industrial loans, including specialty finance loans. We operate over 230 branches in five states with leading market share in many of the markets we operate in. → We are a conservative lender across all of our loan portfolios. → We maintain an efficient operation. → We complement our organic growth with accretive acquisitions. → Page 3
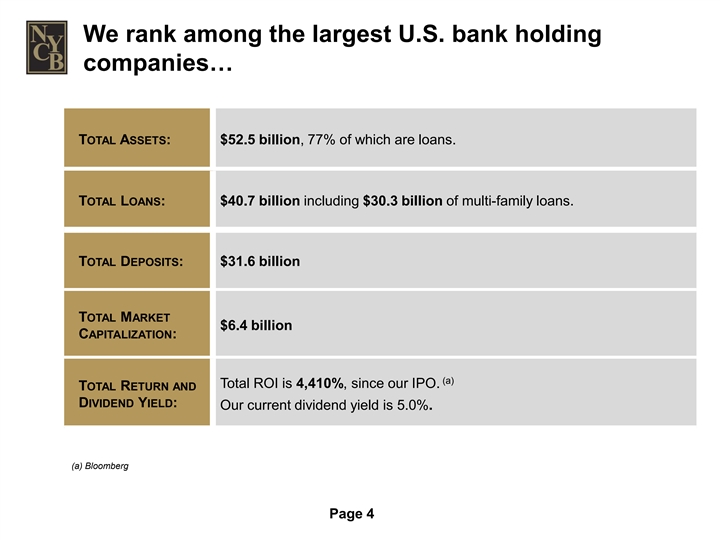
We rank among the largest U.S. bank holding companies… TOTAL ASSETS: $52.5 billion, 77% of which are loans. TOTAL LOANS: $40.7 billion including $30.3 billion of multi-family loans. TOTAL DEPOSITS: $31.6 billion TOTAL MARKET $6.4 billion CAPITALIZATION: (a) Total ROI is 4,410%, since our IPO. TOTAL RETURN AND DIVIDEND YIELD: Our current dividend yield is 5.0%. (a) Bloomberg Page 4We rank among the largest U.S. bank holding companies… TOTAL ASSETS: $52.5 billion, 77% of which are loans. TOTAL LOANS: $40.7 billion including $30.3 billion of multi-family loans. TOTAL DEPOSITS: $31.6 billion TOTAL MARKET $6.4 billion CAPITALIZATION: (a) Total ROI is 4,410%, since our IPO. TOTAL RETURN AND DIVIDEND YIELD: Our current dividend yield is 5.0%. (a) Bloomberg Page 4
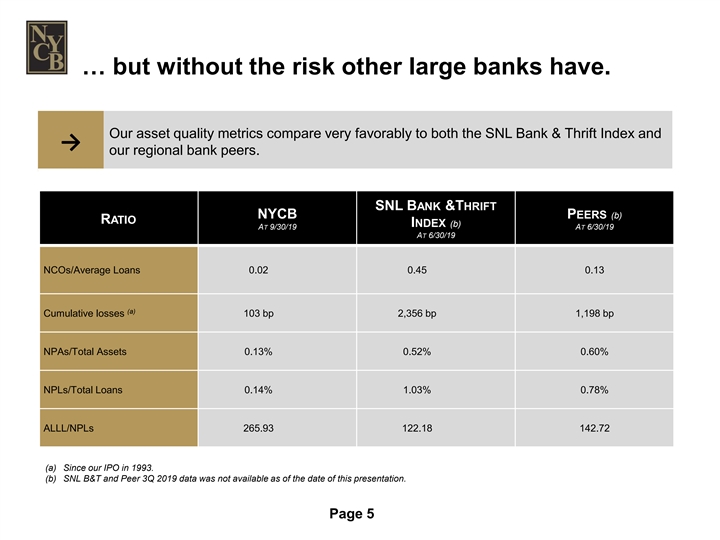
… but without the risk other large banks have. Our asset quality metrics compare very favorably to both the SNL Bank & Thrift Index and → our regional bank peers. SNL BANK &THRIFT NYCB PEERS (b) RATIO INDEX (b) AT 9/30/19 AT 6/30/19 AT 6/30/19 NCOs/Average Loans 0.02 0.45 0.13 (a) Cumulative losses 103 bp 2,356 bp 1,198 bp NPAs/Total Assets 0.13% 0.52% 0.60% NPLs/Total Loans 0.14% 1.03% 0.78% ALLL/NPLs 265.93 122.18 142.72 (a) Since our IPO in 1993. (b) SNL B&T and Peer 3Q 2019 data was not available as of the date of this presentation. Page 5… but without the risk other large banks have. Our asset quality metrics compare very favorably to both the SNL Bank & Thrift Index and → our regional bank peers. SNL BANK &THRIFT NYCB PEERS (b) RATIO INDEX (b) AT 9/30/19 AT 6/30/19 AT 6/30/19 NCOs/Average Loans 0.02 0.45 0.13 (a) Cumulative losses 103 bp 2,356 bp 1,198 bp NPAs/Total Assets 0.13% 0.52% 0.60% NPLs/Total Loans 0.14% 1.03% 0.78% ALLL/NPLs 265.93 122.18 142.72 (a) Since our IPO in 1993. (b) SNL B&T and Peer 3Q 2019 data was not available as of the date of this presentation. Page 5
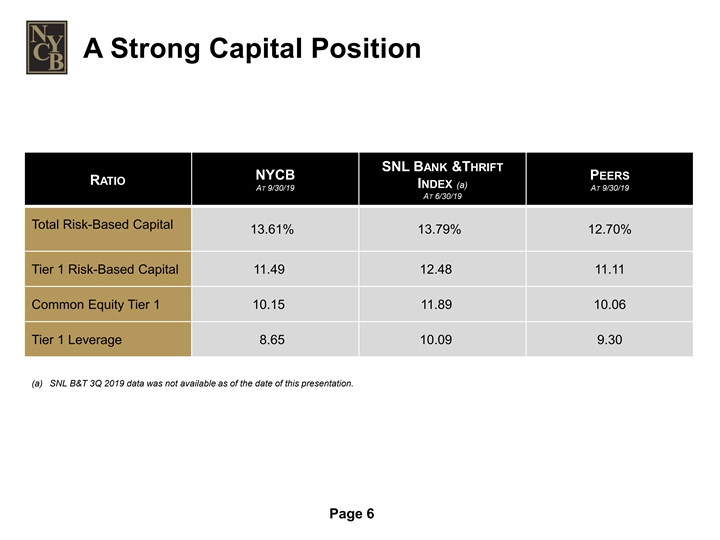
A Strong Capital Position SNL BANK &THRIFT NYCB PEERS RATIO INDEX (a) AT 9/30/19 AT 9/30/19 AT 6/30/19 Total Risk-Based Capital 13.61% 13.79% 12.70% Tier 1 Risk-Based Capital 11.49 12.48 11.11 Common Equity Tier 1 10.15 11.89 10.06 Tier 1 Leverage 8.65 10.09 9.30 (a) SNL B&T 3Q 2019 data was not available as of the date of this presentation. Page 6A Strong Capital Position SNL BANK &THRIFT NYCB PEERS RATIO INDEX (a) AT 9/30/19 AT 9/30/19 AT 6/30/19 Total Risk-Based Capital 13.61% 13.79% 12.70% Tier 1 Risk-Based Capital 11.49 12.48 11.11 Common Equity Tier 1 10.15 11.89 10.06 Tier 1 Leverage 8.65 10.09 9.30 (a) SNL B&T 3Q 2019 data was not available as of the date of this presentation. Page 6
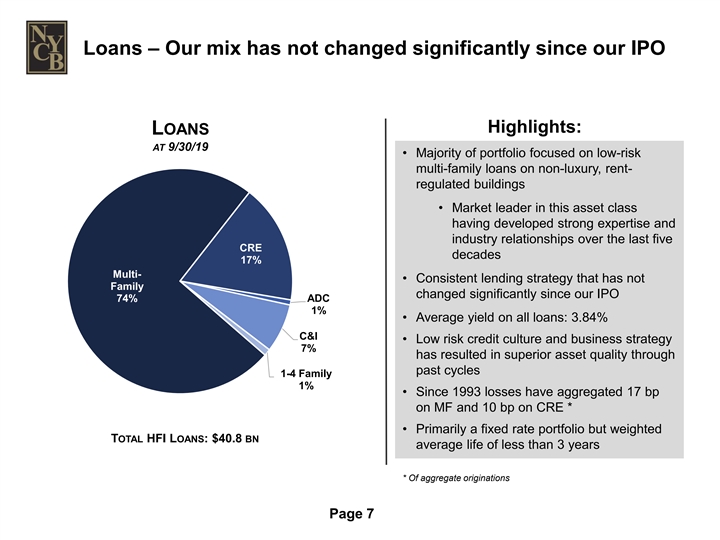
Loans – Our mix has not changed significantly since our IPO Highlights: LOANS AT 9/30/19 • Majority of portfolio focused on low-risk multi-family loans on non-luxury, rent- regulated buildings • Market leader in this asset class having developed strong expertise and industry relationships over the last five CRE decades 17% Multi- • Consistent lending strategy that has not Family changed significantly since our IPO 74% ADC 1% • Average yield on all loans: 3.84% C&I • Low risk credit culture and business strategy 7% has resulted in superior asset quality through past cycles 1-4 Family 1% • Since 1993 losses have aggregated 17 bp on MF and 10 bp on CRE * • Primarily a fixed rate portfolio but weighted TOTAL HFI LOANS: $40.8 BN average life of less than 3 years * Of aggregate originations Page 7Loans – Our mix has not changed significantly since our IPO Highlights: LOANS AT 9/30/19 • Majority of portfolio focused on low-risk multi-family loans on non-luxury, rent- regulated buildings • Market leader in this asset class having developed strong expertise and industry relationships over the last five CRE decades 17% Multi- • Consistent lending strategy that has not Family changed significantly since our IPO 74% ADC 1% • Average yield on all loans: 3.84% C&I • Low risk credit culture and business strategy 7% has resulted in superior asset quality through past cycles 1-4 Family 1% • Since 1993 losses have aggregated 17 bp on MF and 10 bp on CRE * • Primarily a fixed rate portfolio but weighted TOTAL HFI LOANS: $40.8 BN average life of less than 3 years * Of aggregate originations Page 7
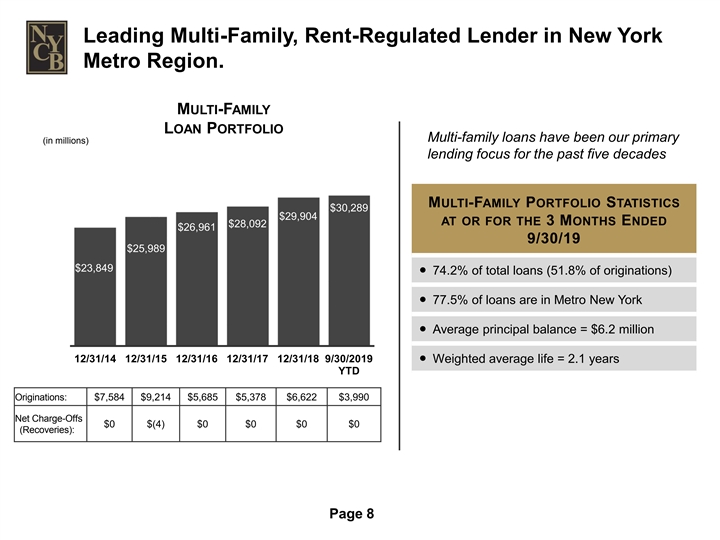
Leading Multi-Family, Rent-Regulated Lender in New York Metro Region. MULTI-FAMILY LOAN PORTFOLIO Multi-family loans have been our primary (in millions) lending focus for the past five decades MULTI-FAMILY PORTFOLIO STATISTICS $30,289 $29,904 AT OR FOR THE 3 MONTHS ENDED $28,092 $26,961 9/30/19 $25,989 $23,849 ● 74.2% of total loans (51.8% of originations) ● 77.5% of loans are in Metro New York ● Average principal balance = $6.2 million 12/31/14 12/31/15 12/31/16 12/31/17 12/31/18 9/30/2019 ● Weighted average life = 2.1 years YTD Originations: $7,584 $9,214 $5,685 $5,378 $6,622 $3,990 Net Charge-Offs $0 $(4) $0 $0 $0 $0 (Recoveries): Page 8Leading Multi-Family, Rent-Regulated Lender in New York Metro Region. MULTI-FAMILY LOAN PORTFOLIO Multi-family loans have been our primary (in millions) lending focus for the past five decades MULTI-FAMILY PORTFOLIO STATISTICS $30,289 $29,904 AT OR FOR THE 3 MONTHS ENDED $28,092 $26,961 9/30/19 $25,989 $23,849 ● 74.2% of total loans (51.8% of originations) ● 77.5% of loans are in Metro New York ● Average principal balance = $6.2 million 12/31/14 12/31/15 12/31/16 12/31/17 12/31/18 9/30/2019 ● Weighted average life = 2.1 years YTD Originations: $7,584 $9,214 $5,685 $5,378 $6,622 $3,990 Net Charge-Offs $0 $(4) $0 $0 $0 $0 (Recoveries): Page 8
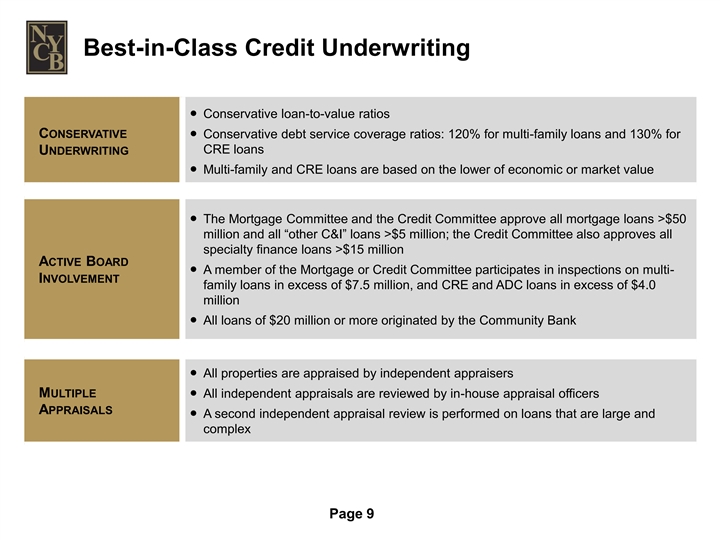
Best-in-Class Credit Underwriting ● Conservative loan-to-value ratios CONSERVATIVE● Conservative debt service coverage ratios: 120% for multi-family loans and 130% for CRE loans UNDERWRITING ● Multi-family and CRE loans are based on the lower of economic or market value ● The Mortgage Committee and the Credit Committee approve all mortgage loans >$50 million and all “other C&I” loans >$5 million; the Credit Committee also approves all specialty finance loans >$15 million ACTIVE BOARD ● A member of the Mortgage or Credit Committee participates in inspections on multi- INVOLVEMENT family loans in excess of $7.5 million, and CRE and ADC loans in excess of $4.0 million ● All loans of $20 million or more originated by the Community Bank ● All properties are appraised by independent appraisers MULTIPLE ● All independent appraisals are reviewed by in-house appraisal officers APPRAISALS ● A second independent appraisal review is performed on loans that are large and complex Page 9Best-in-Class Credit Underwriting ● Conservative loan-to-value ratios CONSERVATIVE● Conservative debt service coverage ratios: 120% for multi-family loans and 130% for CRE loans UNDERWRITING ● Multi-family and CRE loans are based on the lower of economic or market value ● The Mortgage Committee and the Credit Committee approve all mortgage loans >$50 million and all “other C&I” loans >$5 million; the Credit Committee also approves all specialty finance loans >$15 million ACTIVE BOARD ● A member of the Mortgage or Credit Committee participates in inspections on multi- INVOLVEMENT family loans in excess of $7.5 million, and CRE and ADC loans in excess of $4.0 million ● All loans of $20 million or more originated by the Community Bank ● All properties are appraised by independent appraisers MULTIPLE ● All independent appraisals are reviewed by in-house appraisal officers APPRAISALS ● A second independent appraisal review is performed on loans that are large and complex Page 9

Our Multi-Family Portfolio is Well Insulated Against Recent Changes in the Rent Regulation Laws (1) $18.3 billion or 61% of the MF portfolio is subject to NYS rent regulations; WA LTV on → this portion of the MF portfolio is 53.54% We lend on current, in-place cash flows and not on future or projected cash flows. → Total Multi-family % of Current (1) (as of 9/30/19) Market WA LTV New York City Manhattan $7,610,013 25.14% 47.94% Brooklyn 5,354,342 17.69% 52.05% . Bronx 3,900,616 12.89% 62.30% Queens 2,532,967 8.37% 47.50% Staten Island 81,168 0.27% 57.69% Sub-total New York City 19,479,106 64.35% 51.95% New Jersey 3,447,539 11.39% 66.94% Long Island 544,474 1.80% 60.58% Sub-total Metro New York 23,471,119 77.54% 54.35% Other New York State 1,089,788 3.60% 61.25% All Other States 5,708,502 18.86% 67.94% Total Multi-Family $30,269,409 100.00% 57.16% Multi-Family Vacancy Rate as of 9/30/19: 2.94% (1) Weighted Average LTV Page 10Our Multi-Family Portfolio is Well Insulated Against Recent Changes in the Rent Regulation Laws (1) $18.3 billion or 61% of the MF portfolio is subject to NYS rent regulations; WA LTV on → this portion of the MF portfolio is 53.54% We lend on current, in-place cash flows and not on future or projected cash flows. → Total Multi-family % of Current (1) (as of 9/30/19) Market WA LTV New York City Manhattan $7,610,013 25.14% 47.94% Brooklyn 5,354,342 17.69% 52.05% . Bronx 3,900,616 12.89% 62.30% Queens 2,532,967 8.37% 47.50% Staten Island 81,168 0.27% 57.69% Sub-total New York City 19,479,106 64.35% 51.95% New Jersey 3,447,539 11.39% 66.94% Long Island 544,474 1.80% 60.58% Sub-total Metro New York 23,471,119 77.54% 54.35% Other New York State 1,089,788 3.60% 61.25% All Other States 5,708,502 18.86% 67.94% Total Multi-Family $30,269,409 100.00% 57.16% Multi-Family Vacancy Rate as of 9/30/19: 2.94% (1) Weighted Average LTV Page 10

Commercial real estate is a logical extension of our multi-family niche. COMMERCIAL REAL ESTATE LOAN PORTFOLIO (in millions) CRE PORTFOLIO STATISTICS AT OR FOR THE 3 MONTHS ENDED 9/30/19 $7,727 $7,637 $7,860 $7,325 $7,001 $6,988 ● 17.1% of total loans (13.6% of originations) ● 86.4% of loans in Metro New York ● Average principal balance = $6.4million ● Weighted average life = 2.4 years 12/31/14 12/31/15 12/31/16 12/31/17 12/31/18 9/30/19 YTD Originations: $1,661 $1,842 $1,180 $1,039 $967 $899 Net Charge- Offs $1 $(1) $(1) $0 $3 $0 (Recoveries): Page 11Commercial real estate is a logical extension of our multi-family niche. COMMERCIAL REAL ESTATE LOAN PORTFOLIO (in millions) CRE PORTFOLIO STATISTICS AT OR FOR THE 3 MONTHS ENDED 9/30/19 $7,727 $7,637 $7,860 $7,325 $7,001 $6,988 ● 17.1% of total loans (13.6% of originations) ● 86.4% of loans in Metro New York ● Average principal balance = $6.4million ● Weighted average life = 2.4 years 12/31/14 12/31/15 12/31/16 12/31/17 12/31/18 9/30/19 YTD Originations: $1,661 $1,842 $1,180 $1,039 $967 $899 Net Charge- Offs $1 $(1) $(1) $0 $3 $0 (Recoveries): Page 11

Our specialty finance business is another high-quality lending niche. ● Six industry veterans with nearly 150 years of combined experience ● The team has been working together for over 25 years, mostly at larger regional banks in the Northeast ● Extensive experience in senior secured lending, transaction structuring, credit, capital markets, and risk mgmt. ● Excellent track record on credit losses over the past 25 years of originations LOAN TYPES SPECIALTY FINANCE ● Syndicated asset-based (ABLs) and dealer floor- LOAN AND LEASE PORTFOLIO plan (DFPLs) loans ● Equipment loan and lease financing (EF) (in millions) CLIENT CHARACTERISTICS $2,479 ● Large corporate obligors; mostly publicly traded CAGR (2014-3Q19) ● Investment grade or near-investment grade $1,989 33.2% ratings ● Participants in stable, nationwide industries $1,584 PRICING $1,286 ● Floating rates tied to LIBOR (ABLs and DFPLs) ● Fixed rates at a spread over treasuries (EF) $895 RISK-AVERSE $635 CREDIT & UNDERWRITING STANDARDS ● We require a perfected first-security interest in 12/31/14 12/31/15 12/31/16 12/31/17 12/31/18 9/30/19 or outright ownership of the underlying collateral YTD ● Loans are structured as senior debt or as non- Originations: $848 $1,068 $1,266 $1,784 $1,917 $2,001 cancellable leases Net charge- ● Transactions are re-underwritten in-house $0 $0 $0 $0 $0 $0 Offs: ● Underlying documentation reviewed by counsel Page 12Our specialty finance business is another high-quality lending niche. ● Six industry veterans with nearly 150 years of combined experience ● The team has been working together for over 25 years, mostly at larger regional banks in the Northeast ● Extensive experience in senior secured lending, transaction structuring, credit, capital markets, and risk mgmt. ● Excellent track record on credit losses over the past 25 years of originations LOAN TYPES SPECIALTY FINANCE ● Syndicated asset-based (ABLs) and dealer floor- LOAN AND LEASE PORTFOLIO plan (DFPLs) loans ● Equipment loan and lease financing (EF) (in millions) CLIENT CHARACTERISTICS $2,479 ● Large corporate obligors; mostly publicly traded CAGR (2014-3Q19) ● Investment grade or near-investment grade $1,989 33.2% ratings ● Participants in stable, nationwide industries $1,584 PRICING $1,286 ● Floating rates tied to LIBOR (ABLs and DFPLs) ● Fixed rates at a spread over treasuries (EF) $895 RISK-AVERSE $635 CREDIT & UNDERWRITING STANDARDS ● We require a perfected first-security interest in 12/31/14 12/31/15 12/31/16 12/31/17 12/31/18 9/30/19 or outright ownership of the underlying collateral YTD ● Loans are structured as senior debt or as non- Originations: $848 $1,068 $1,266 $1,784 $1,917 $2,001 cancellable leases Net charge- ● Transactions are re-underwritten in-house $0 $0 $0 $0 $0 $0 Offs: ● Underlying documentation reviewed by counsel Page 12

Our asset quality in any credit cycle has consistently been better than our industry peers… (a)(b) (a) NON-PERFORMING LOANS / TOTAL LOANS Average NPLs/Total Loans NYCB: 0.57 % SNL U.S. Bank and Thrift Index:1.68 % 4.79% 4.69% 4.14% 3.57% 2.90% 2.36% 2.26% 2.01% 1.80% 1.61% 1.36% 1.27% 1.23% 1.11% 1.06% 1.06% 1.03% 0.85% 0.85% 0.83% 0.80% 0.70% 0.63% 0.64% 0.60% 0.65% 0.43% 0.05% 2.63% 1.28% 1.51% 0.76% 0.78% 0.55% 0.19% 0.25% 0.33% 0.30% 0.33% 0.16% 0.11% 0.11% 0.51% 2.47% 0.96% 0.35% 0.23% 0.14% 0.84% 0.42% 0.13% 0.11% 0.07%0.11% (c) SNL U.S. Bank and Thrift Index NYCB (a) Non-performing loans and total loans exclude covered loans and non-covered purchased credit-impaired (“PCI”) loans. (b) Non-performing loans are defined as non-accrual loans and loans 90 days or more past due but still accruing interest. Our non-performing loans at 12/31/16 ,12/31/17, and 12/31/18 exclude taxi medallion-related loans. (c) SNL B&T 3Q 2019 data was not available as of the date of this presentation. Page 13Our asset quality in any credit cycle has consistently been better than our industry peers… (a)(b) (a) NON-PERFORMING LOANS / TOTAL LOANS Average NPLs/Total Loans NYCB: 0.57 % SNL U.S. Bank and Thrift Index:1.68 % 4.79% 4.69% 4.14% 3.57% 2.90% 2.36% 2.26% 2.01% 1.80% 1.61% 1.36% 1.27% 1.23% 1.11% 1.06% 1.06% 1.03% 0.85% 0.85% 0.83% 0.80% 0.70% 0.63% 0.64% 0.60% 0.65% 0.43% 0.05% 2.63% 1.28% 1.51% 0.76% 0.78% 0.55% 0.19% 0.25% 0.33% 0.30% 0.33% 0.16% 0.11% 0.11% 0.51% 2.47% 0.96% 0.35% 0.23% 0.14% 0.84% 0.42% 0.13% 0.11% 0.07%0.11% (c) SNL U.S. Bank and Thrift Index NYCB (a) Non-performing loans and total loans exclude covered loans and non-covered purchased credit-impaired (“PCI”) loans. (b) Non-performing loans are defined as non-accrual loans and loans 90 days or more past due but still accruing interest. Our non-performing loans at 12/31/16 ,12/31/17, and 12/31/18 exclude taxi medallion-related loans. (c) SNL B&T 3Q 2019 data was not available as of the date of this presentation. Page 13

… and very few of our non-performing loans have resulted in actual losses. NET CHARGE-OFFS / AVERAGE LOANS 2.89% 2.84% Cumulative Total NYCB: 103 bp SNL U.S. Bank and Thrift Index: 2,356 bp 1.77% 1.63% 1.24% 0.96% 0.91% 0.85% 0.77% 0.76% 0.68% 0.60% 0.58% 0.59% 0.65% 0.56% 0.57% 0.53% 0.51% 0.48% 0.50% 0.48% 0.48% 0.46% 0.47% 0.45% 0.35% (a) (b) 0.05% 0.01% 0.04% 0.21% 0.13% -0.02% 0.00% 0.00% 0.01% 0.03% 0.13% 0.35% 0.06% 0.03% 0.01% 0.00% -0.01% 0.00% 0.00% 0.00% 0.00% 0.00% 0.00% 0.00% 0.00% 0.00% 0.00% (c) SNL U.S. Bank and Thrift Index NYCB (a) The calculation of our net charge-offs to average loans for 2017 excludes charge-offs of $59.6 million on taxi medallion-related loans. (b) The calculation of our net charge-offs to average loans for 2018 excluded charge-offs of $12.8 million on taxi medallion-related loans. (c) SNL B&T 3Q 2019 data was not available as of the date of this presentation. Page 14… and very few of our non-performing loans have resulted in actual losses. NET CHARGE-OFFS / AVERAGE LOANS 2.89% 2.84% Cumulative Total NYCB: 103 bp SNL U.S. Bank and Thrift Index: 2,356 bp 1.77% 1.63% 1.24% 0.96% 0.91% 0.85% 0.77% 0.76% 0.68% 0.60% 0.58% 0.59% 0.65% 0.56% 0.57% 0.53% 0.51% 0.48% 0.50% 0.48% 0.48% 0.46% 0.47% 0.45% 0.35% (a) (b) 0.05% 0.01% 0.04% 0.21% 0.13% -0.02% 0.00% 0.00% 0.01% 0.03% 0.13% 0.35% 0.06% 0.03% 0.01% 0.00% -0.01% 0.00% 0.00% 0.00% 0.00% 0.00% 0.00% 0.00% 0.00% 0.00% 0.00% (c) SNL U.S. Bank and Thrift Index NYCB (a) The calculation of our net charge-offs to average loans for 2017 excludes charge-offs of $59.6 million on taxi medallion-related loans. (b) The calculation of our net charge-offs to average loans for 2018 excluded charge-offs of $12.8 million on taxi medallion-related loans. (c) SNL B&T 3Q 2019 data was not available as of the date of this presentation. Page 14
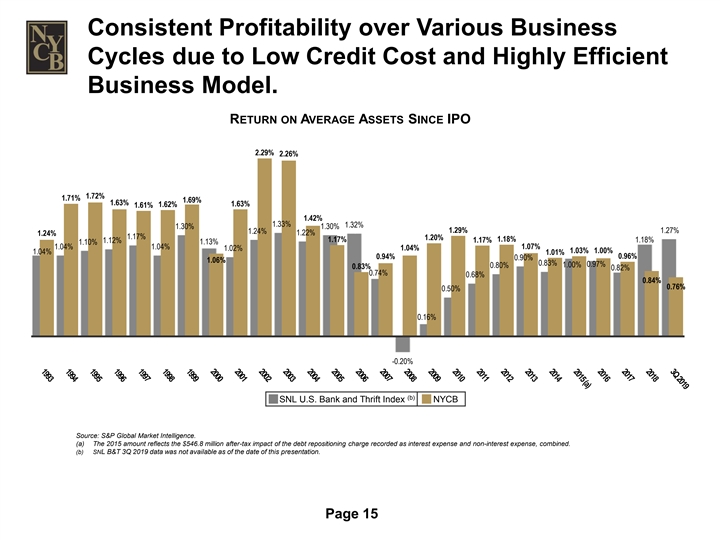
Consistent Profitability over Various Business Cycles due to Low Credit Cost and Highly Efficient Business Model. RETURN ON AVERAGE ASSETS SINCE IPO 2.29% 2.26% 1.72% 1.71% 1.69% 1.63% 1.63% 1.62% 1.61% 1.42% 1.33% 1.32% 1.30% 1.30% 1.29% 1.27% 1.24% 1.22% 1.24% 1.17% 1.20% 1.17% 1.18% 1.12% 1.17% 1.18% 1.13% 1.10% 1.04% 1.04% 1.07% 1.02% 1.04% 1.03% 1.00% 1.04% 1.01% 0.94% 0.96% 0.90% 1.06% 0.83% 0.97% 0.80% 1.00% 0.83% 0.82% 0.74% 0.68% 0.84% 0.76% 0.50% 0.16% -0.20% (b) SNL U.S. Bank and Thrift Index NYCB Source: S&P Global Market Intelligence. (a) The 2015 amount reflects the $546.8 million after-tax impact of the debt repositioning charge recorded as interest expense and non-interest expense, combined. (b) SNL B&T 3Q 2019 data was not available as of the date of this presentation. Page 15Consistent Profitability over Various Business Cycles due to Low Credit Cost and Highly Efficient Business Model. RETURN ON AVERAGE ASSETS SINCE IPO 2.29% 2.26% 1.72% 1.71% 1.69% 1.63% 1.63% 1.62% 1.61% 1.42% 1.33% 1.32% 1.30% 1.30% 1.29% 1.27% 1.24% 1.22% 1.24% 1.17% 1.20% 1.17% 1.18% 1.12% 1.17% 1.18% 1.13% 1.10% 1.04% 1.04% 1.07% 1.02% 1.04% 1.03% 1.00% 1.04% 1.01% 0.94% 0.96% 0.90% 1.06% 0.83% 0.97% 0.80% 1.00% 0.83% 0.82% 0.74% 0.68% 0.84% 0.76% 0.50% 0.16% -0.20% (b) SNL U.S. Bank and Thrift Index NYCB Source: S&P Global Market Intelligence. (a) The 2015 amount reflects the $546.8 million after-tax impact of the debt repositioning charge recorded as interest expense and non-interest expense, combined. (b) SNL B&T 3Q 2019 data was not available as of the date of this presentation. Page 15
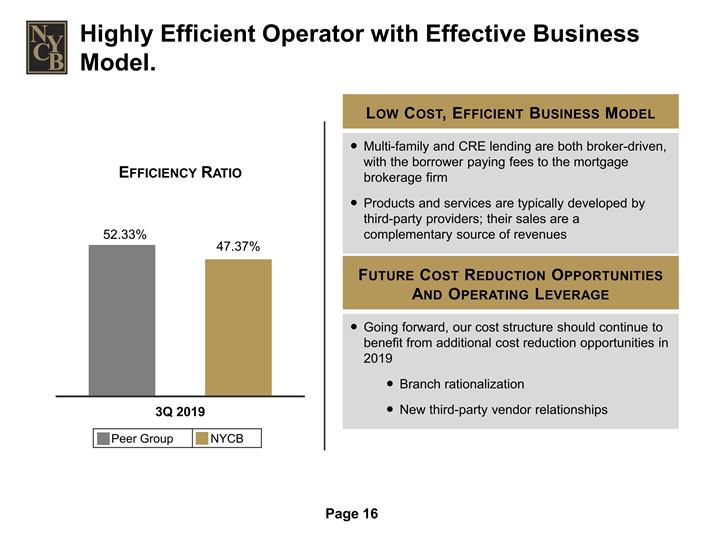
Highly Efficient Operator with Effective Business Model. LOW COST, EFFICIENT BUSINESS MODEL ● Multi-family and CRE lending are both broker-driven, with the borrower paying fees to the mortgage EFFICIENCY RATIO brokerage firm ● Products and services are typically developed by third-party providers; their sales are a 52.33% complementary source of revenues 47.37% FUTURE COST REDUCTION OPPORTUNITIES AND OPERATING LEVERAGE ● Going forward, our cost structure should continue to benefit from additional cost reduction opportunities in 2019 ● Branch rationalization ● New third-party vendor relationships 3Q 2019 Peer Group NYCB Page 16Highly Efficient Operator with Effective Business Model. LOW COST, EFFICIENT BUSINESS MODEL ● Multi-family and CRE lending are both broker-driven, with the borrower paying fees to the mortgage EFFICIENCY RATIO brokerage firm ● Products and services are typically developed by third-party providers; their sales are a 52.33% complementary source of revenues 47.37% FUTURE COST REDUCTION OPPORTUNITIES AND OPERATING LEVERAGE ● Going forward, our cost structure should continue to benefit from additional cost reduction opportunities in 2019 ● Branch rationalization ● New third-party vendor relationships 3Q 2019 Peer Group NYCB Page 16
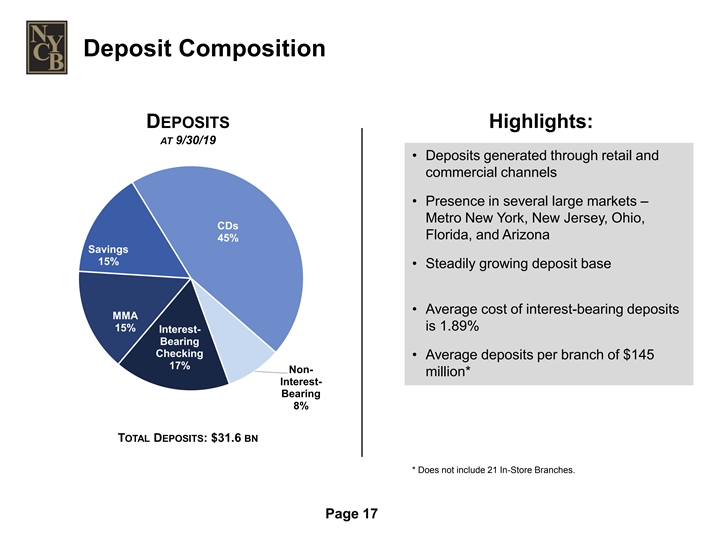
Deposit Composition DEPOSITS Highlights: AT 9/30/19 • Deposits generated through retail and commercial channels • Presence in several large markets – Metro New York, New Jersey, Ohio, CDs Florida, and Arizona 45% Savings 15% • Steadily growing deposit base • Average cost of interest-bearing deposits MMA 15% is 1.89% Interest- Bearing Checking • Average deposits per branch of $145 17% Non- million* Interest- Bearing 8% TOTAL DEPOSITS: $31.6 BN * Does not include 21 In-Store Branches. Page 17Deposit Composition DEPOSITS Highlights: AT 9/30/19 • Deposits generated through retail and commercial channels • Presence in several large markets – Metro New York, New Jersey, Ohio, CDs Florida, and Arizona 45% Savings 15% • Steadily growing deposit base • Average cost of interest-bearing deposits MMA 15% is 1.89% Interest- Bearing Checking • Average deposits per branch of $145 17% Non- million* Interest- Bearing 8% TOTAL DEPOSITS: $31.6 BN * Does not include 21 In-Store Branches. Page 17
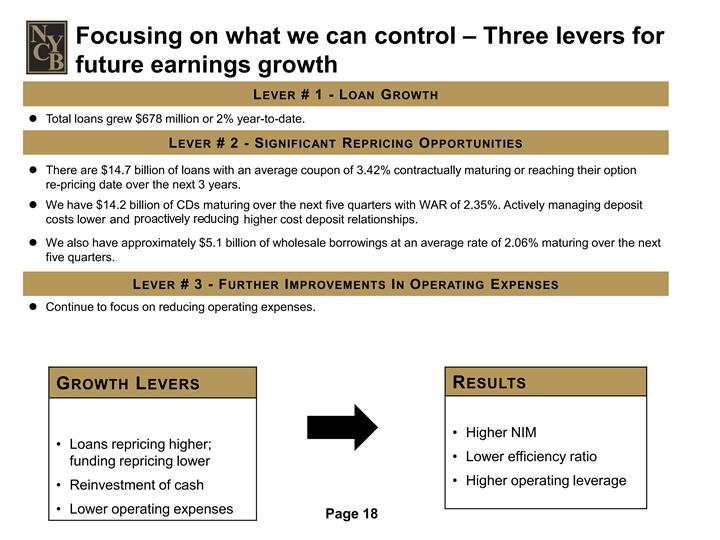
LEVER # 1 - LOAN GROWTH Total loans grew $678 million or 2% year-to-date. LEVER # 2 - SIGNIFICANT REPRICING OPPORTUNITIES There are $14.7 billion of loans with an average coupon of 3.42% contractually maturing or reaching their option re-pricing date over the next 3 years. We have $14.2 billion of CDs maturing over the next five quarters with WAR of 2.35%. Actively managing deposit costs lower and proactively reducing higher cost deposit relationships. We also have approximately $5.1 billion of wholesale borrowings at an average rate of 2.06% maturing over the next five quarters. LEVER # 3 - FURTHER IMPROVEMENTS IN OPERATING EXPENSES Continue to focus on reducing operating expenses. Focusing on what we can control – Three levers for future earnings growth GROWTH LEVERS • Loans repricing higher; funding repricing lower • Reinvestment of cash • Lower operating expenses RESULTS • Higher NIM • Lower efficiency ratio • Higher operating leverage Page 18
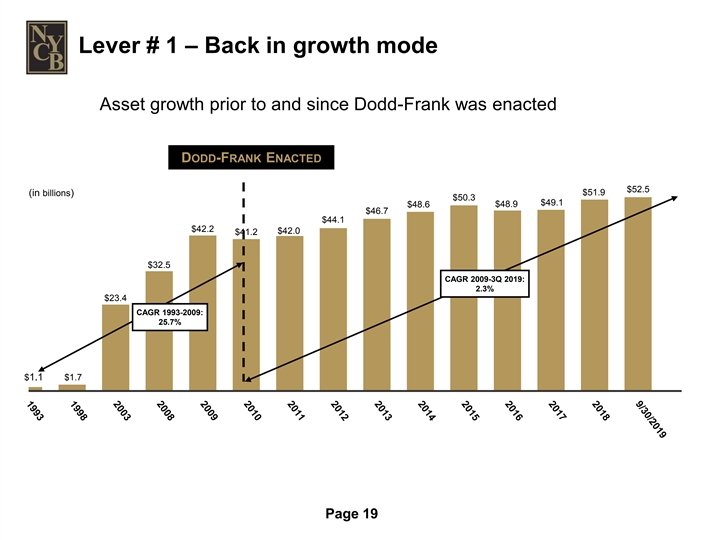
Lever # 1 – Back in growth mode Asset growth prior to and since Dodd-Frank was enacted DODD-FRANK ENACTED $52.5 $51.9 (in billions) $50.3 $49.1 $48.6 $48.9 $46.7 $44.1 $42.2 $42.0 $41.2 $32.5 CAGR 2009-3Q 2019: 2.3% $23.4 CAGR 1993-2009: 25.7% $1.1 $1.7 Page 19Lever # 1 – Back in growth mode Asset growth prior to and since Dodd-Frank was enacted DODD-FRANK ENACTED $52.5 $51.9 (in billions) $50.3 $49.1 $48.6 $48.9 $46.7 $44.1 $42.2 $42.0 $41.2 $32.5 CAGR 2009-3Q 2019: 2.3% $23.4 CAGR 1993-2009: 25.7% $1.1 $1.7 Page 19
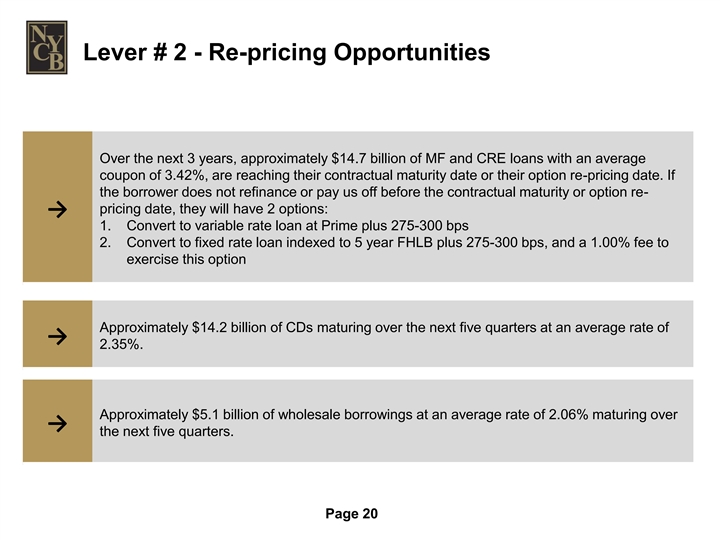
Lever # 2 - Re-pricing Opportunities Over the next 3 years, approximately $14.7 billion of MF and CRE loans with an average coupon of 3.42%, are reaching their contractual maturity date or their option re-pricing date. If the borrower does not refinance or pay us off before the contractual maturity or option re- pricing date, they will have 2 options: → 1. Convert to variable rate loan at Prime plus 275-300 bps 2. Convert to fixed rate loan indexed to 5 year FHLB plus 275-300 bps, and a 1.00% fee to exercise this option Approximately $14.2 billion of CDs maturing over the next five quarters at an average rate of → 2.35%. Approximately $5.1 billion of wholesale borrowings at an average rate of 2.06% maturing over → the next five quarters. Page 20Lever # 2 - Re-pricing Opportunities Over the next 3 years, approximately $14.7 billion of MF and CRE loans with an average coupon of 3.42%, are reaching their contractual maturity date or their option re-pricing date. If the borrower does not refinance or pay us off before the contractual maturity or option re- pricing date, they will have 2 options: → 1. Convert to variable rate loan at Prime plus 275-300 bps 2. Convert to fixed rate loan indexed to 5 year FHLB plus 275-300 bps, and a 1.00% fee to exercise this option Approximately $14.2 billion of CDs maturing over the next five quarters at an average rate of → 2.35%. Approximately $5.1 billion of wholesale borrowings at an average rate of 2.06% maturing over → the next five quarters. Page 20

Lever # 2 - Portfolio coupons may have bottomed HISTORICAL WEIGHTED AVERAGE PORTFOLIO COUPONS 6.25% Coupon Rate at 9/30/2019 6.00% Multi Family: 3.66% CRE: 4.00% 5.75% 5.50% 5.25% 5.00% 4.75% 4.50% 4.25% 4.00% 3.75% 3.50% 3.25% Multi Family CRE Page 21 6/30/2009 9/30/2009 12/31/2009 3/31/2010 6/30/2010 9/30/2010 12/31/2010 3/31/2011 6/30/2011 9/30/2011 12/31/2011 3/31/2012 6/30/2012 9/30/2012 12/31/2012 3/31/2013 6/30/2013 9/30/2013 12/31/2013 3/31/2014 6/30/2014 9/30/2014 12/31/2014 3/31/2015 6/30/2015 9/30/2015 12/31/2015 3/31/2016 6/30/2016 9/30/2016 12/31/2016 3/31/2017 6/30/2017 9/30/2017 12/31/2017 3/31/2018 6/30/2018 9/30/2018 12/31/2018 3/31/2019 6/30/2019 9/30/2019Lever # 2 - Portfolio coupons may have bottomed HISTORICAL WEIGHTED AVERAGE PORTFOLIO COUPONS 6.25% Coupon Rate at 9/30/2019 6.00% Multi Family: 3.66% CRE: 4.00% 5.75% 5.50% 5.25% 5.00% 4.75% 4.50% 4.25% 4.00% 3.75% 3.50% 3.25% Multi Family CRE Page 21 6/30/2009 9/30/2009 12/31/2009 3/31/2010 6/30/2010 9/30/2010 12/31/2010 3/31/2011 6/30/2011 9/30/2011 12/31/2011 3/31/2012 6/30/2012 9/30/2012 12/31/2012 3/31/2013 6/30/2013 9/30/2013 12/31/2013 3/31/2014 6/30/2014 9/30/2014 12/31/2014 3/31/2015 6/30/2015 9/30/2015 12/31/2015 3/31/2016 6/30/2016 9/30/2016 12/31/2016 3/31/2017 6/30/2017 9/30/2017 12/31/2017 3/31/2018 6/30/2018 9/30/2018 12/31/2018 3/31/2019 6/30/2019 9/30/2019
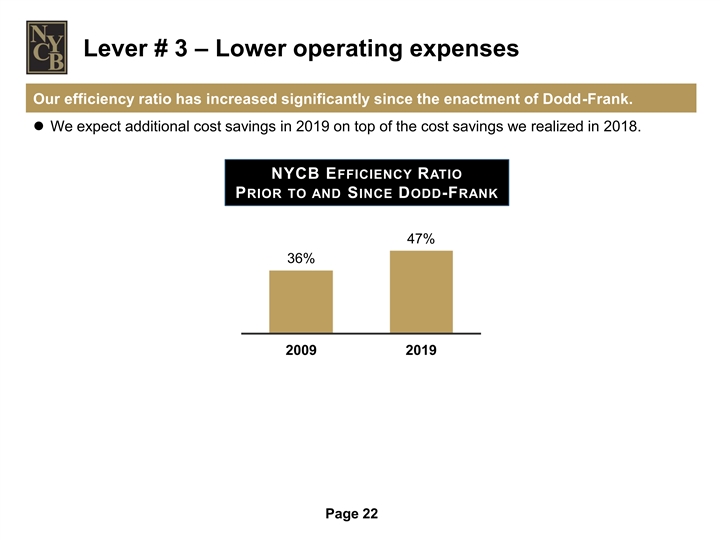
Lever # 3 – Lower operating expenses Our efficiency ratio has increased significantly since the enactment of Dodd-Frank. l We expect additional cost savings in 2019 on top of the cost savings we realized in 2018. NYCB EFFICIENCY RATIO PRIOR TO AND SINCE DODD-FRANK 47% 36% 2009 2019 Page 22Lever # 3 – Lower operating expenses Our efficiency ratio has increased significantly since the enactment of Dodd-Frank. l We expect additional cost savings in 2019 on top of the cost savings we realized in 2018. NYCB EFFICIENCY RATIO PRIOR TO AND SINCE DODD-FRANK 47% 36% 2009 2019 Page 22

OUR BUSINESS MODEL Growth through AcquisitionsOUR BUSINESS MODEL Growth through Acquisitions
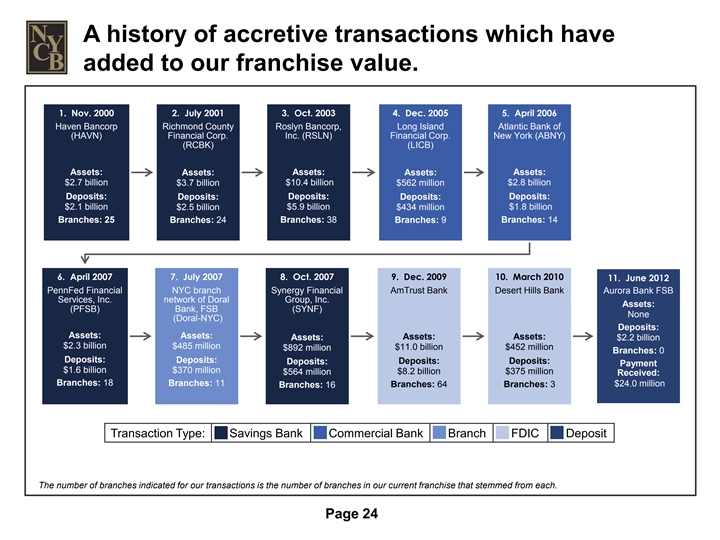
A history of accretive transactions which have added to our franchise value. 1. Nov. 2000 2. July 2001 3. Oct. 2003 4. Dec. 2005 5. April 2006 Haven Bancorp Richmond County Roslyn Bancorp, Long Island Atlantic Bank of (HAVN) Financial Corp. Inc. (RSLN) Financial Corp. New York (ABNY) (RCBK) (LICB) Assets: Assets: Assets: Assets: Assets: $2.7 billion $3.7 billion $10.4 billion $562 million $2.8 billion Deposits: Deposits: Deposits: Deposits: Deposits: $2.1 billion $2.5 billion $5.9 billion $434 million $1.8 billion Branches: 25 Branches: 24 Branches: 38 Branches: 9 Branches: 14 6. April 2007 7. July 2007 8. Oct. 2007 9. Dec. 2009 10. March 2010 11. June 2012 PennFed Financial NYC branch Synergy Financial AmTrust Bank Desert Hills Bank Aurora Bank FSB Services, Inc. network of Doral Group, Inc. Assets: (PFSB) Bank, FSB (SYNF) None (Doral-NYC) Deposits: Assets: Assets: Assets: Assets: Assets: $2.2 billion $2.3 billion $485 million $11.0 billion $452 million $892 million Branches: 0 Deposits: Deposits: Deposits: Deposits: Deposits: Payment $1.6 billion $370 million $8.2 billion $375 million $564 million Received: Branches: 18 Branches: 11 Branches: 64 Branches: 3 $24.0 million Branches: 16 Transaction Type: Savings Bank Commercial Bank Branch FDIC Deposit The number of branches indicated for our transactions is the number of branches in our current franchise that stemmed from each. Page 24A history of accretive transactions which have added to our franchise value. 1. Nov. 2000 2. July 2001 3. Oct. 2003 4. Dec. 2005 5. April 2006 Haven Bancorp Richmond County Roslyn Bancorp, Long Island Atlantic Bank of (HAVN) Financial Corp. Inc. (RSLN) Financial Corp. New York (ABNY) (RCBK) (LICB) Assets: Assets: Assets: Assets: Assets: $2.7 billion $3.7 billion $10.4 billion $562 million $2.8 billion Deposits: Deposits: Deposits: Deposits: Deposits: $2.1 billion $2.5 billion $5.9 billion $434 million $1.8 billion Branches: 25 Branches: 24 Branches: 38 Branches: 9 Branches: 14 6. April 2007 7. July 2007 8. Oct. 2007 9. Dec. 2009 10. March 2010 11. June 2012 PennFed Financial NYC branch Synergy Financial AmTrust Bank Desert Hills Bank Aurora Bank FSB Services, Inc. network of Doral Group, Inc. Assets: (PFSB) Bank, FSB (SYNF) None (Doral-NYC) Deposits: Assets: Assets: Assets: Assets: Assets: $2.2 billion $2.3 billion $485 million $11.0 billion $452 million $892 million Branches: 0 Deposits: Deposits: Deposits: Deposits: Deposits: Payment $1.6 billion $370 million $8.2 billion $375 million $564 million Received: Branches: 18 Branches: 11 Branches: 64 Branches: 3 $24.0 million Branches: 16 Transaction Type: Savings Bank Commercial Bank Branch FDIC Deposit The number of branches indicated for our transactions is the number of branches in our current franchise that stemmed from each. Page 24
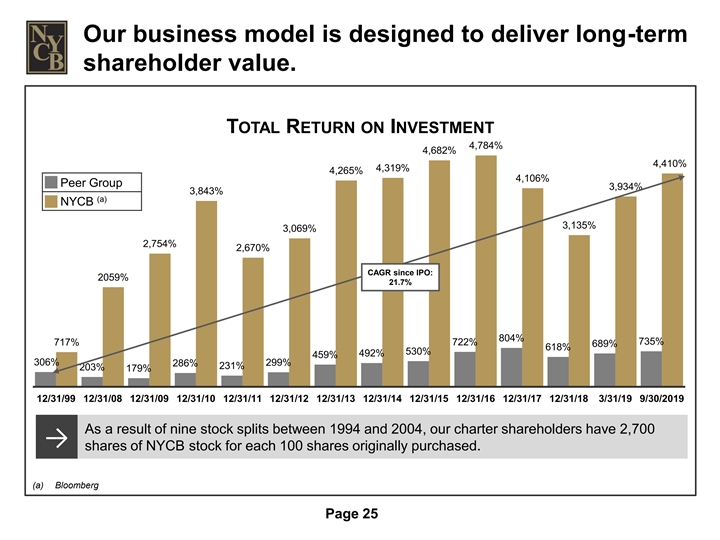
Our business model is designed to deliver long-term shareholder value. TOTAL RETURN ON INVESTMENT 4,784% 4,682% 4,410% 4,319% 4,265% 4,106% Peer Group 3,934% 3,843% (a) NYCB 3,135% 3,069% 2,754% 2,670% CAGR since IPO: 2059% 21.7% 804% 722% 735% 717% 689% 618% 530% 492% 459% 306% 299% 286% 231% 203% 179% 12/31/99 12/31/08 12/31/09 12/31/10 12/31/11 12/31/12 12/31/13 12/31/14 12/31/15 12/31/16 12/31/17 12/31/18 3/31/19 9/30/2019 As a result of nine stock splits between 1994 and 2004, our charter shareholders have 2,700 → shares of NYCB stock for each 100 shares originally purchased. (a) Bloomberg Page 25Our business model is designed to deliver long-term shareholder value. TOTAL RETURN ON INVESTMENT 4,784% 4,682% 4,410% 4,319% 4,265% 4,106% Peer Group 3,934% 3,843% (a) NYCB 3,135% 3,069% 2,754% 2,670% CAGR since IPO: 2059% 21.7% 804% 722% 735% 717% 689% 618% 530% 492% 459% 306% 299% 286% 231% 203% 179% 12/31/99 12/31/08 12/31/09 12/31/10 12/31/11 12/31/12 12/31/13 12/31/14 12/31/15 12/31/16 12/31/17 12/31/18 3/31/19 9/30/2019 As a result of nine stock splits between 1994 and 2004, our charter shareholders have 2,700 → shares of NYCB stock for each 100 shares originally purchased. (a) Bloomberg Page 25
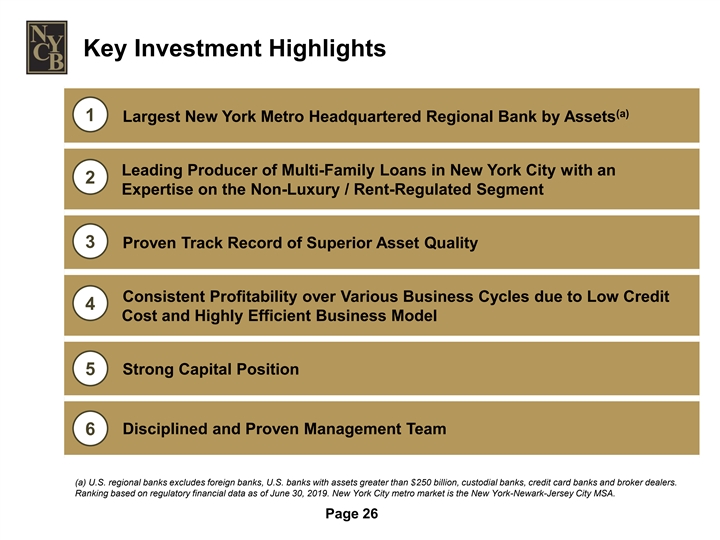
Key Investment Highlights (a) 1 Largest New York Metro Headquartered Regional Bank by Assets Leading Producer of Multi-Family Loans in New York City with an 2 Expertise on the Non-Luxury / Rent-Regulated Segment 3 Proven Track Record of Superior Asset Quality Consistent Profitability over Various Business Cycles due to Low Credit 4 Cost and Highly Efficient Business Model 5 Strong Capital Position Disciplined and Proven Management Team 6 (a) U.S. regional banks excludes foreign banks, U.S. banks with assets greater than $250 billion, custodial banks, credit card banks and broker dealers. Ranking based on regulatory financial data as of June 30, 2019. New York City metro market is the New York-Newark-Jersey City MSA. Page 26Key Investment Highlights (a) 1 Largest New York Metro Headquartered Regional Bank by Assets Leading Producer of Multi-Family Loans in New York City with an 2 Expertise on the Non-Luxury / Rent-Regulated Segment 3 Proven Track Record of Superior Asset Quality Consistent Profitability over Various Business Cycles due to Low Credit 4 Cost and Highly Efficient Business Model 5 Strong Capital Position Disciplined and Proven Management Team 6 (a) U.S. regional banks excludes foreign banks, U.S. banks with assets greater than $250 billion, custodial banks, credit card banks and broker dealers. Ranking based on regulatory financial data as of June 30, 2019. New York City metro market is the New York-Newark-Jersey City MSA. Page 26
For More Information VISIT OUR WEBSITE: ir.myNYCB.com E-MAIL REQUESTS TO: ir@myNYCB.com CALL INVESTOR RELATIONS AT: (516) 683-4420 Investor Relations New York Community Bancorp, Inc. WRITE TO: 615 Merrick Avenue Westbury, NY 11590 Page 27For More Information VISIT OUR WEBSITE: ir.myNYCB.com E-MAIL REQUESTS TO: ir@myNYCB.com CALL INVESTOR RELATIONS AT: (516) 683-4420 Investor Relations New York Community Bancorp, Inc. WRITE TO: 615 Merrick Avenue Westbury, NY 11590 Page 27

APPENDIXAPPENDIX

Securities and Funding Composition SECURITIES FUNDS U.S. Non- Treasury AT 9/30/19 AT 9/30/19 Interest- 1% Equity Other Bearing Securities 3% 6% 1% GSE Certificates Capital Interest- 26% Trust Notes Bearing 2% Checking & FHLB MMA 26% 22% Corporates 14% Savings GSE CMOs 11% 30% ABS 6% GSE CD Municipals Debentures 1% 32% 19% TOTAL FUNDS: $45.2 BN TOTAL SECURITIES: $5.8 BN • Entire portfolio is available for sale • 2.04% cost of funds • Consists primarily of GSE-related securities • Significant capacity given eligibility of multi-family loans • Overall yield is 3.82% • 31.0% is variable rate Page 29Securities and Funding Composition SECURITIES FUNDS U.S. Non- Treasury AT 9/30/19 AT 9/30/19 Interest- 1% Equity Other Bearing Securities 3% 6% 1% GSE Certificates Capital Interest- 26% Trust Notes Bearing 2% Checking & FHLB MMA 26% 22% Corporates 14% Savings GSE CMOs 11% 30% ABS 6% GSE CD Municipals Debentures 1% 32% 19% TOTAL FUNDS: $45.2 BN TOTAL SECURITIES: $5.8 BN • Entire portfolio is available for sale • 2.04% cost of funds • Consists primarily of GSE-related securities • Significant capacity given eligibility of multi-family loans • Overall yield is 3.82% • 31.0% is variable rate Page 29
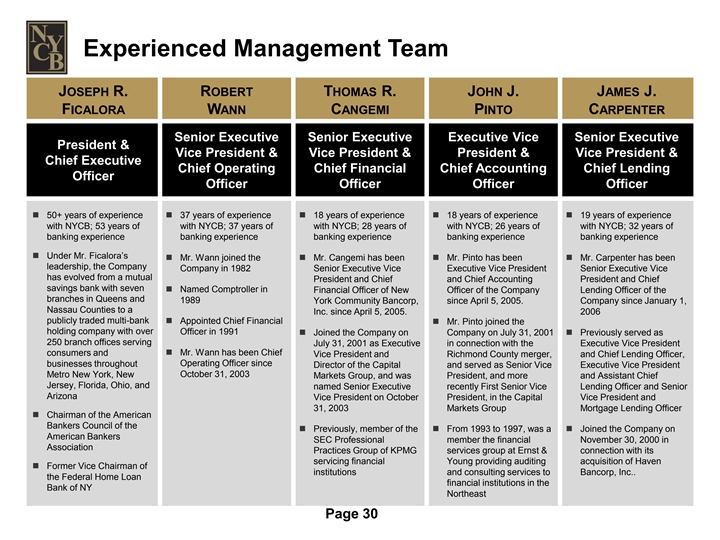
Experienced Management Team JOSEPH R. ROBERT THOMAS R. JOHN J. JAMES J. FICALORA WANN CANGEMI PINTO CARPENTER Senior Executive Senior Executive Executive Vice Senior Executive President & Vice President & Vice President & President & Vice President & Chief Executive Chief Operating Chief Financial Chief Accounting Chief Lending Officer Officer Officer Officer Officer n 50+ years of experience n 37 years of experience n 18 years of experience n 18 years of experience n 19 years of experience with NYCB; 53 years of with NYCB; 37 years of with NYCB; 28 years of with NYCB; 26 years of with NYCB; 32 years of banking experience banking experience banking experience banking experience banking experience n Under Mr. Ficalora’s n Mr. Wann joined the n Mr. Cangemi has been n Mr. Pinto has been n Mr. Carpenter has been leadership, the Company Company in 1982 Senior Executive Vice Executive Vice President Senior Executive Vice has evolved from a mutual President and Chief and Chief Accounting President and Chief savings bank with seven n Named Comptroller in Financial Officer of New Officer of the Company Lending Officer of the branches in Queens and 1989 York Community Bancorp, since April 5, 2005. Company since January 1, Nassau Counties to a Inc. since April 5, 2005. 2006 publicly traded multi-bank n Appointed Chief Financial n Mr. Pinto joined the holding company with over Officer in 1991 n Joined the Company on Company on July 31, 2001 n Previously served as 250 branch offices serving July 31, 2001 as Executive in connection with the Executive Vice President n Mr. Wann has been Chief consumers and Vice President and Richmond County merger, and Chief Lending Officer, Operating Officer since businesses throughout Director of the Capital and served as Senior Vice Executive Vice President October 31, 2003 Metro New York, New Markets Group, and was President, and more and Assistant Chief Jersey, Florida, Ohio, and named Senior Executive recently First Senior Vice Lending Officer and Senior Arizona Vice President on October President, in the Capital Vice President and 31, 2003 Markets Group Mortgage Lending Officer n Chairman of the American Bankers Council of the n Previously, member of the n From 1993 to 1997, was a n Joined the Company on American Bankers SEC Professional member the financial November 30, 2000 in Association Practices Group of KPMG services group at Ernst & connection with its servicing financial Young providing auditing acquisition of Haven n Former Vice Chairman of institutions and consulting services to Bancorp, Inc.. the Federal Home Loan financial institutions in the Bank of NY Northeast Page 30Experienced Management Team JOSEPH R. ROBERT THOMAS R. JOHN J. JAMES J. FICALORA WANN CANGEMI PINTO CARPENTER Senior Executive Senior Executive Executive Vice Senior Executive President & Vice President & Vice President & President & Vice President & Chief Executive Chief Operating Chief Financial Chief Accounting Chief Lending Officer Officer Officer Officer Officer n 50+ years of experience n 37 years of experience n 18 years of experience n 18 years of experience n 19 years of experience with NYCB; 53 years of with NYCB; 37 years of with NYCB; 28 years of with NYCB; 26 years of with NYCB; 32 years of banking experience banking experience banking experience banking experience banking experience n Under Mr. Ficalora’s n Mr. Wann joined the n Mr. Cangemi has been n Mr. Pinto has been n Mr. Carpenter has been leadership, the Company Company in 1982 Senior Executive Vice Executive Vice President Senior Executive Vice has evolved from a mutual President and Chief and Chief Accounting President and Chief savings bank with seven n Named Comptroller in Financial Officer of New Officer of the Company Lending Officer of the branches in Queens and 1989 York Community Bancorp, since April 5, 2005. Company since January 1, Nassau Counties to a Inc. since April 5, 2005. 2006 publicly traded multi-bank n Appointed Chief Financial n Mr. Pinto joined the holding company with over Officer in 1991 n Joined the Company on Company on July 31, 2001 n Previously served as 250 branch offices serving July 31, 2001 as Executive in connection with the Executive Vice President n Mr. Wann has been Chief consumers and Vice President and Richmond County merger, and Chief Lending Officer, Operating Officer since businesses throughout Director of the Capital and served as Senior Vice Executive Vice President October 31, 2003 Metro New York, New Markets Group, and was President, and more and Assistant Chief Jersey, Florida, Ohio, and named Senior Executive recently First Senior Vice Lending Officer and Senior Arizona Vice President on October President, in the Capital Vice President and 31, 2003 Markets Group Mortgage Lending Officer n Chairman of the American Bankers Council of the n Previously, member of the n From 1993 to 1997, was a n Joined the Company on American Bankers SEC Professional member the financial November 30, 2000 in Association Practices Group of KPMG services group at Ernst & connection with its servicing financial Young providing auditing acquisition of Haven n Former Vice Chairman of institutions and consulting services to Bancorp, Inc.. the Federal Home Loan financial institutions in the Bank of NY Northeast Page 30

Reconciliations of GAAP and Non-GAAP Measures While average stockholders’ equity, average assets, return on average assets, and return on average stockholders’ equity are financial measures that are recorded in accordance with U.S. generally accepted accounting principles ( GAAP ), average tangible stockholders’ equity, average tangible assets, return on average tangible assets, and return on average tangible stockholders’ equity are not. Nevertheless, it is management’s belief that these non-GAAP measures should be disclosed in our SEC filings, earnings releases, and other investor communications, for the following reasons: 1. Average tangible stockholders’ equity is an important indication of the Company’s ability to grow organically and through business combinations, as well as our ability to pay dividends and to engage in various capital management strategies. 2. Returns on average tangible assets and average tangible stockholders’ equity are among the profitability measures considered by current and prospective investors, both independent of, and in comparison with, our peers. We calculate average tangible stockholders’ equity by subtracting from average stockholders’ equity the sum of our average goodwill and calculate average tangible assets by subtracting the same sum from our average assets. Average tangible stockholders’ equity, average tangible assets, and the related non-GAAP profitability measures should not be considered in isolation or as a substitute for average stockholders’ equity, average assets, or any other profitability or capital measure calculated in accordance with GAAP. Moreover, the manner in which we calculate these non-GAAP measures may differ from that of other companies reporting non-GAAP measures with similar names. The following table presents reconciliations of our average common stockholders’ equity and average tangible common stockholders’ equity, our average assets and average tangible assets, and the related GAAP and non-GAAP profitability measures at or for the three months ended September 30, 2019: For the Three Months Ended (dollars in thousands) September 30, 2019 Average common stockholders’ equity $ 6,201,970 Less: Average goodwill (2,426,379) Average tangible common stockholders’ equity $ 3,775,591 Average assets $52,257,718 Less: Average goodwill (2,426,379) Average tangible assets $49,831,339 (1) Net income available to common shareholders $90,839 GAAP: Return on average assets 0.76% Return on average common stockholders’ equity 5.89 Non-GAAP: (2) Return on average tangible assets 0.80 (2) Return on average tangible common stockholders’ equity 9.62 (1) To calculate return on average assets for a period, we divide net income generated during that period by average assets recorded during that period. To calculate return on average tangible assets for a period, we divide net income by average tangible assets recorded during that period. (2) To calculate return on average common stockholders’ equity for a period, we divide net income available to common shareholders generated during that period by average common stockholders’ equity recorded during that period. To calculate return on average tangible common stockholders’ equity for a period, we divide net income available to common shareholders generated during that period by average tangible common stockholders’ equity recorded during that period. Page 31Reconciliations of GAAP and Non-GAAP Measures While average stockholders’ equity, average assets, return on average assets, and return on average stockholders’ equity are financial measures that are recorded in accordance with U.S. generally accepted accounting principles ( GAAP ), average tangible stockholders’ equity, average tangible assets, return on average tangible assets, and return on average tangible stockholders’ equity are not. Nevertheless, it is management’s belief that these non-GAAP measures should be disclosed in our SEC filings, earnings releases, and other investor communications, for the following reasons: 1. Average tangible stockholders’ equity is an important indication of the Company’s ability to grow organically and through business combinations, as well as our ability to pay dividends and to engage in various capital management strategies. 2. Returns on average tangible assets and average tangible stockholders’ equity are among the profitability measures considered by current and prospective investors, both independent of, and in comparison with, our peers. We calculate average tangible stockholders’ equity by subtracting from average stockholders’ equity the sum of our average goodwill and calculate average tangible assets by subtracting the same sum from our average assets. Average tangible stockholders’ equity, average tangible assets, and the related non-GAAP profitability measures should not be considered in isolation or as a substitute for average stockholders’ equity, average assets, or any other profitability or capital measure calculated in accordance with GAAP. Moreover, the manner in which we calculate these non-GAAP measures may differ from that of other companies reporting non-GAAP measures with similar names. The following table presents reconciliations of our average common stockholders’ equity and average tangible common stockholders’ equity, our average assets and average tangible assets, and the related GAAP and non-GAAP profitability measures at or for the three months ended September 30, 2019: For the Three Months Ended (dollars in thousands) September 30, 2019 Average common stockholders’ equity $ 6,201,970 Less: Average goodwill (2,426,379) Average tangible common stockholders’ equity $ 3,775,591 Average assets $52,257,718 Less: Average goodwill (2,426,379) Average tangible assets $49,831,339 (1) Net income available to common shareholders $90,839 GAAP: Return on average assets 0.76% Return on average common stockholders’ equity 5.89 Non-GAAP: (2) Return on average tangible assets 0.80 (2) Return on average tangible common stockholders’ equity 9.62 (1) To calculate return on average assets for a period, we divide net income generated during that period by average assets recorded during that period. To calculate return on average tangible assets for a period, we divide net income by average tangible assets recorded during that period. (2) To calculate return on average common stockholders’ equity for a period, we divide net income available to common shareholders generated during that period by average common stockholders’ equity recorded during that period. To calculate return on average tangible common stockholders’ equity for a period, we divide net income available to common shareholders generated during that period by average tangible common stockholders’ equity recorded during that period. Page 31

Peer Group PEER TICKER Bank OZK OZK BankUnited, Inc. BKU Comerica Incorporated CMA F.N.B. Corporation FNB Fifth Third Bancorp FITB Huntington Bancshares Incorporated HBAN Investors Bancorp, Inc. ISBC M&T Bank Corporation MTB People's United Financial, Inc. PBCT Signature Bank SBNY Sterling Bancorp STL Synovus Financial Corp. SNV Valley National Bancorp VLY Webster Financial Corporation WBS Zions Bancorporation ZION Page 32Peer Group PEER TICKER Bank OZK OZK BankUnited, Inc. BKU Comerica Incorporated CMA F.N.B. Corporation FNB Fifth Third Bancorp FITB Huntington Bancshares Incorporated HBAN Investors Bancorp, Inc. ISBC M&T Bank Corporation MTB People's United Financial, Inc. PBCT Signature Bank SBNY Sterling Bancorp STL Synovus Financial Corp. SNV Valley National Bancorp VLY Webster Financial Corporation WBS Zions Bancorporation ZION Page 32