Second Quarter 2022 Investor Presentation Exhibit 99.1
Forward-Looking Information This presentation may include forward‐looking statements by the Company and our authorized officers pertaining to such matters as our goals, intentions, and expectations regarding revenues, earnings, loan production, asset quality, capital levels, and acquisitions, among other matters; our estimates of future costs and benefits of the actions we may take; our assessments of probable losses on loans; our assessments of interest rate and other market risks; and our ability to achieve our financial and other strategic goals. Forward‐looking statements are typically identified by such words as “believe,” “expect,” “anticipate,” “intend,” “outlook,” “estimate,” “forecast,” “project,” “should,” and other similar words and expressions, and are subject to numerous assumptions, risks, and uncertainties, which change over time. Additionally, forward‐looking statements speak only as of the date they are made; the Company does not assume any duty, and does not undertake, to update our forward‐looking statements. Furthermore, because forward‐looking statements are subject to assumptions and uncertainties, actual results or future events could differ, possibly materially, from those anticipated in our statements, and our future performance could differ materially from our historical results. Our forward‐looking statements are subject to the following principal risks and uncertainties: the effect of the COVID-19 pandemic, including the length of time that the pandemic continues, the potential imposition of future shelter in place orders or additional restrictions on travel in the future, the effect of the pandemic on the general economy and on the businesses of our borrowers and their ability to make payments on their obligation, the remedial actions and stimulus measures adopted by federal, state, and local governments; the inability of employees to work due to illness, quarantine, or government mandates; general economic conditions and trends, either nationally or locally; conditions in the securities markets; changes in interest rates; changes in deposit flows, and in the demand for deposit, loan, and investment products and other financial services; changes in real estate values; changes in the quality or composition of our loan or investment portfolios; changes in competitive pressures among financial institutions or from non‐financial institutions; our ability to obtain the necessary shareholder and regulatory approvals of any acquisitions we may propose; our ability to successfully integrate any assets, liabilities, customers, systems, and management personnel we may acquire into our operations, and our ability to realize related revenue synergies and cost savings within expected time frames; changes in legislation, regulations, and policies; the impact of recently adopted accounting pronouncements; and a variety of other matters which, by their nature, are subject to significant uncertainties and/or are beyond our control. More information regarding some of these factors is provided in the Risk Factors section of our Form 10‐K for the year ended December 31, 2021 and in other SEC reports we file. Our forward‐looking statements may also be subject to other risks and uncertainties, including those we may discuss in this presentation, or in our SEC filings, which are accessible on our website and at the SEC’s website, www.sec.gov. Our Supplemental Use of Non-GAAP Financial Measures This presentation may contain certain non-GAAP financial measures which management believes to be useful to investors in understanding the Company’s performance and financial condition, and in comparing our performance and financial condition with those of other banks. Such non-GAAP financial measures are supplemental to, and are not to be considered in isolation or as a substitute for, measures calculated in accordance with GAAP. Cautionary Statements
→ We are a leading producer of multi-family loans in New York City. Within this market we focus almost exclusively on the non-luxury, rent regulated niche, where average rents are below market. → Our expertise in this particular lending niche arises from: A consistent presence in this market for over 50 years Long standing relationships with our borrowers, who come to us for our service and execution capabilities Decades long relationships with the top commercial mortgage brokers in the NYC market Significant expertise at the Board level in the NYC real estate market → In addition, we originate commercial real estate loans, and commercial loans, including asset-based lending through our specialty finance team. → We operate over 230 branches in five states with leading market share in many of the markets we operate in. → We are a conservative lender across all of our loan portfolios. → We are a low-cost provider, resulting in an efficient operation. → We complement our organic growth with accretive acquisitions. Overview: Who we are
Accelerates our transition towards building a dynamic commercial banking organization NYCB & FBC – Enhancing Shareholder Value By Leveraging Two Like-Minded Organizations with Distinctive Strategic Strengths Creates a top-tier regional bank with significant scale and broader diversification Combines two strong management teams and boards Drives strong financial results and enhances capital generation Maintains each bank’s unique low credit risk model Improves funding profile and interest rate risk positioning Market-leading rent-regulated multi-family lender, mortgage originator and servicer
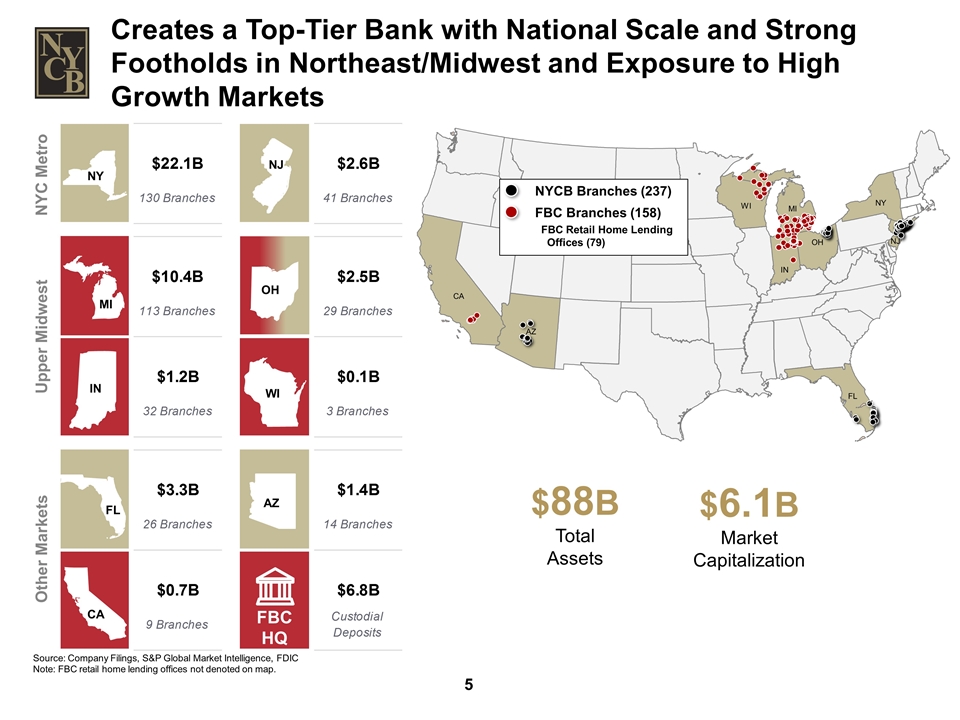
Creates a Top-Tier Bank with National Scale and Strong Footholds in Northeast/Midwest and Exposure to High Growth Markets Source: Company Filings, S&P Global Market Intelligence, FDIC Note: FBC retail home lending offices not denoted on map. MI CA OH WI IN FBC HQ NY FL AZ NJ NYC Metro Upper Midwest Other Markets CA AZ FL WI MI IN NY OH NJ NYCB Branches (237) FBC Branches (158) FBC Retail Home Lending Offices (79) $88B Total Assets $6.1B Market Capitalization
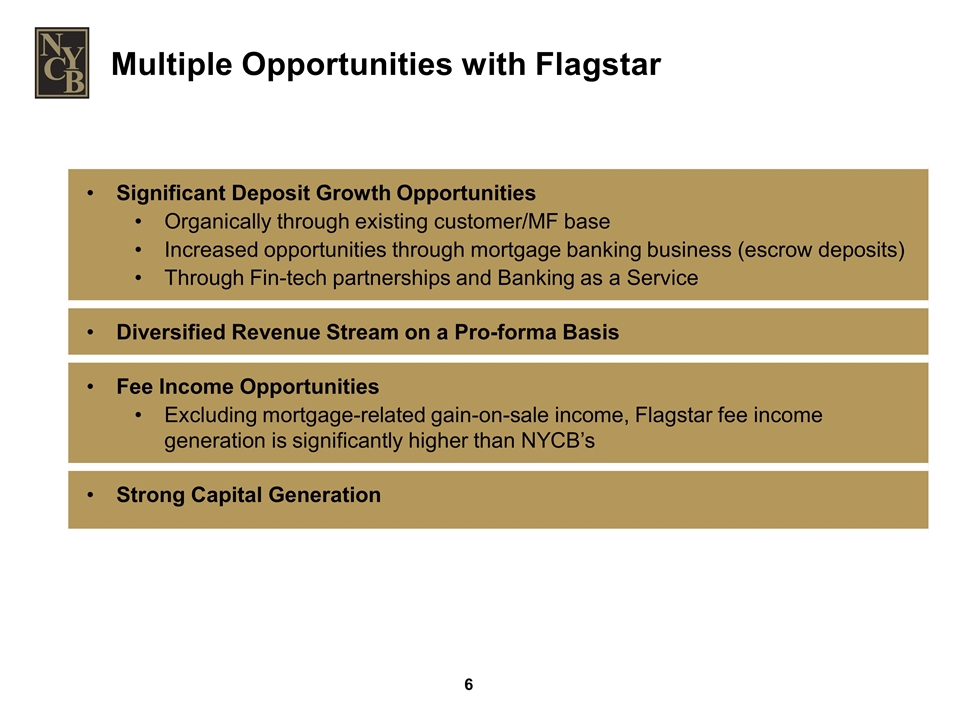
Multiple Opportunities with Flagstar Significant Deposit Growth Opportunities Organically through existing customer/MF base Increased opportunities through mortgage banking business (escrow deposits) Through Fin-tech partnerships and Banking as a Service Diversified Revenue Stream on a Pro-forma Basis Fee Income Opportunities Excluding mortgage-related gain-on-sale income, Flagstar fee income generation is significantly higher than NYCB’s Strong Capital Generation
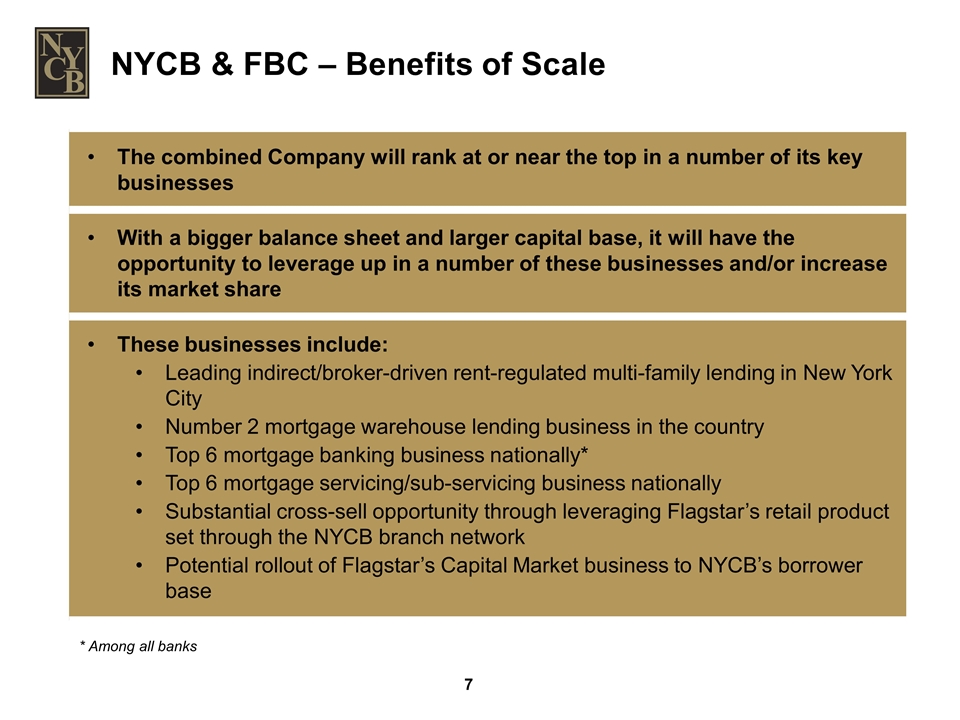
NYCB & FBC – Benefits of Scale The combined Company will rank at or near the top in a number of its key businesses With a bigger balance sheet and larger capital base, it will have the opportunity to leverage up in a number of these businesses and/or increase its market share These businesses include: Leading indirect/broker-driven rent-regulated multi-family lending in New York City Number 2 mortgage warehouse lending business in the country Top 6 mortgage banking business nationally* Top 6 mortgage servicing/sub-servicing business nationally Substantial cross-sell opportunity through leveraging Flagstar’s retail product set through the NYCB branch network Potential rollout of Flagstar’s Capital Market business to NYCB’s borrower base * Among all banks
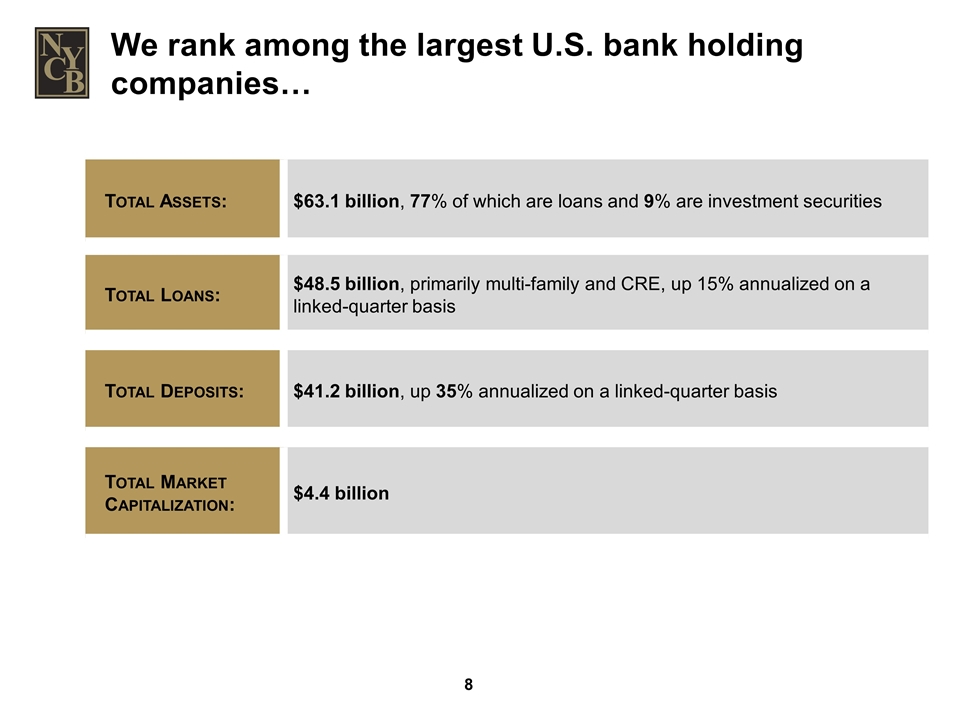
We rank among the largest U.S. bank holding companies… Total Assets: $63.1 billion, 77% of which are loans and 9% are investment securities Total Deposits: $41.2 billion, up 35% annualized on a linked-quarter basis Total Loans: $48.5 billion, primarily multi-family and CRE, up 15% annualized on a linked-quarter basis Total Market Capitalization: $4.4 billion
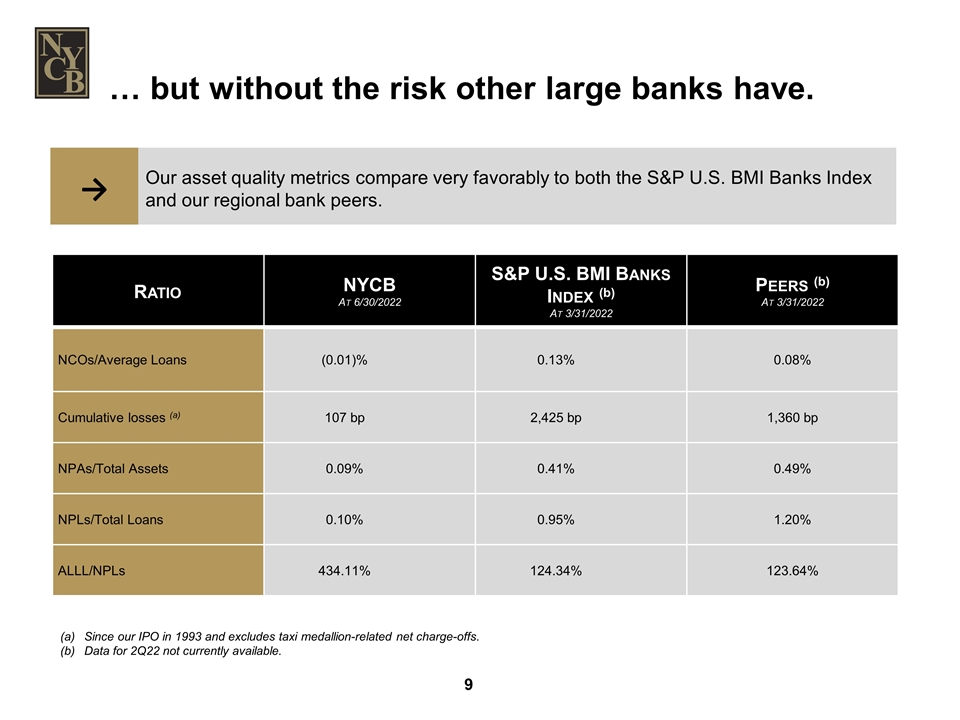
… but without the risk other large banks have. Ratio NYCB At 6/30/2022 S&P U.S. BMI Banks Index (b) At 3/31/2022 Peers (b) At 3/31/2022 NCOs/Average Loans (0.01)% 0.13% 0.08% Cumulative losses (a) 107 bp 2,425 bp 1,360 bp NPAs/Total Assets 0.09% 0.41% 0.49% NPLs/Total Loans 0.10% 0.95% 1.20% ALLL/NPLs 434.11% 124.34% 123.64% → Our asset quality metrics compare very favorably to both the S&P U.S. BMI Banks Index and our regional bank peers. Since our IPO in 1993 and excludes taxi medallion-related net charge-offs. Data for 2Q22 not currently available.
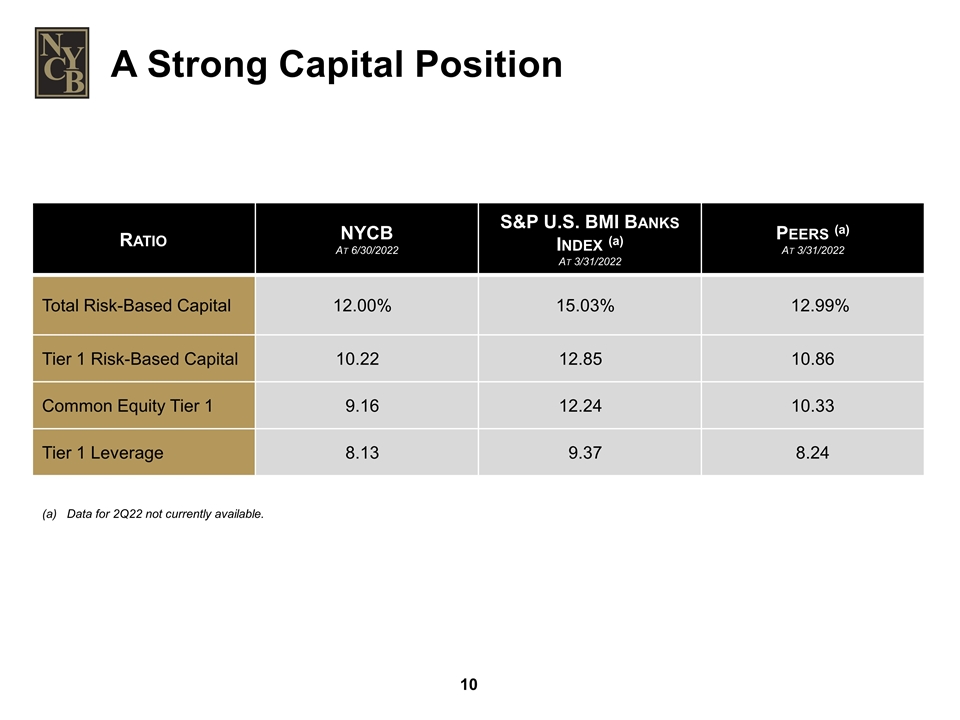
A Strong Capital Position Ratio NYCB At 6/30/2022 S&P U.S. BMI Banks Index (a) At 3/31/2022 Peers (a) At 3/31/2022 Total Risk-Based Capital 12.00% 15.03% 12.99% Tier 1 Risk-Based Capital 10.22 12.85 10.86 Common Equity Tier 1 9.16 12.24 10.33 Tier 1 Leverage 8.13 9.37 8.24 (a) Data for 2Q22 not currently available.
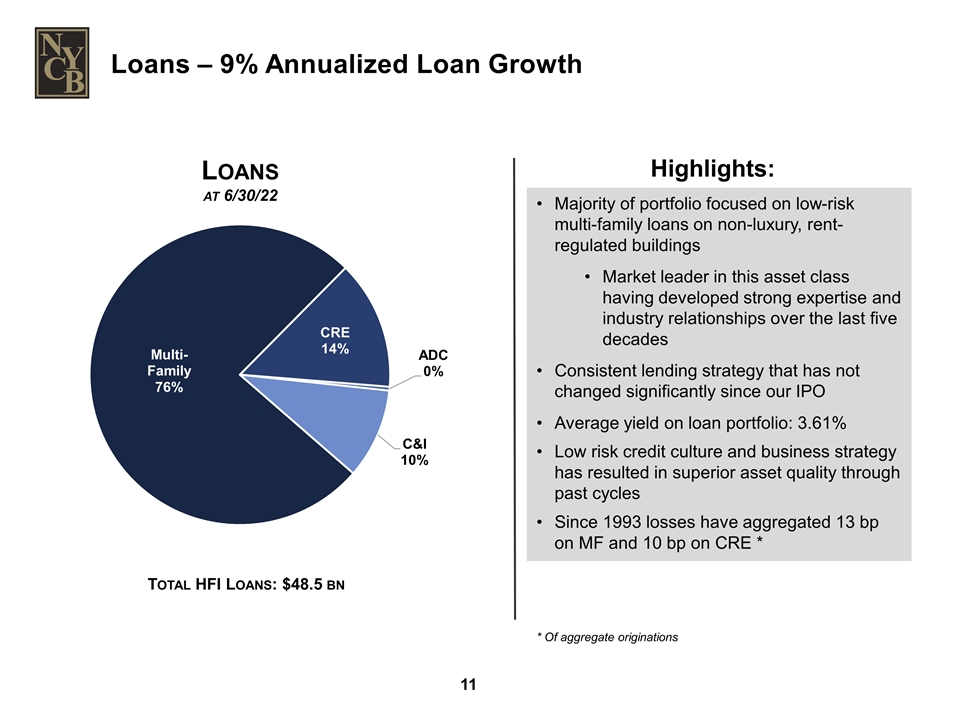
Total HFI Loans: $48.5 bn Loans at 6/30/22 Loans – 9% Annualized Loan Growth Majority of portfolio focused on low-risk multi-family loans on non-luxury, rent-regulated buildings Market leader in this asset class having developed strong expertise and industry relationships over the last five decades Consistent lending strategy that has not changed significantly since our IPO Average yield on loan portfolio: 3.61% Low risk credit culture and business strategy has resulted in superior asset quality through past cycles Since 1993 losses have aggregated 13 bp on MF and 10 bp on CRE * Highlights: * Of aggregate originations
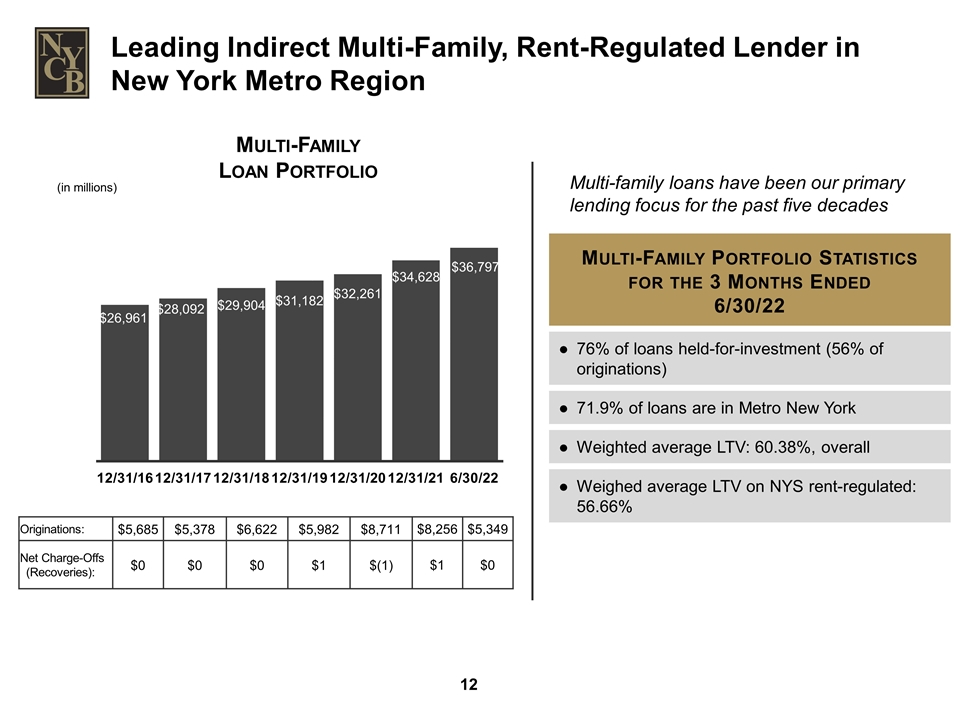
Multi-Family Portfolio Statistics for the 3 Months Ended 6/30/22 76% of loans held-for-investment (56% of originations) 71.9% of loans are in Metro New York Weighted average LTV: 60.38%, overall Weighed average LTV on NYS rent-regulated: 56.66% Multi-Family Loan Portfolio (in millions) Originations: $5,685 $5,378 $6,622 $5,982 $8,711 $8,256 $5,349 Net Charge-Offs (Recoveries): $0 $0 $0 $1 $(1) $1 $0 Leading Indirect Multi-Family, Rent-Regulated Lender in New York Metro Region Multi-family loans have been our primary lending focus for the past five decades
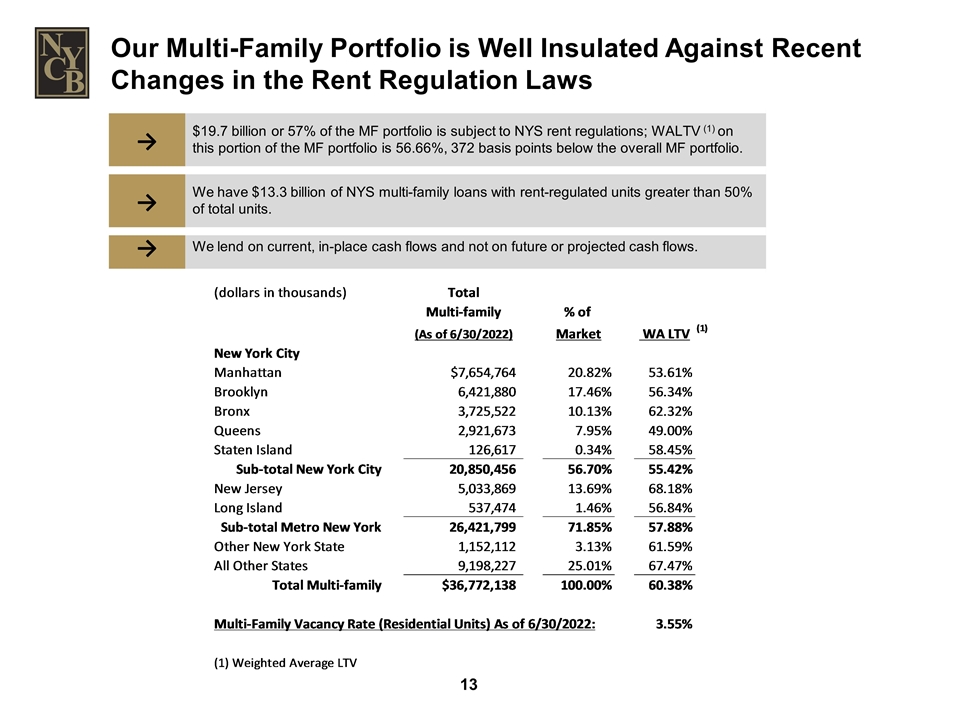
→ $19.7 billion or 57% of the MF portfolio is subject to NYS rent regulations; WALTV (1) on this portion of the MF portfolio is 56.66%, 372 basis points below the overall MF portfolio. Our Multi-Family Portfolio is Well Insulated Against Recent Changes in the Rent Regulation Laws → We lend on current, in-place cash flows and not on future or projected cash flows. → We have $13.3 billion of NYS multi-family loans with rent-regulated units greater than 50% of total units. Multi-Family Portfolio Breakout As of 06/30/2022 (dollars in thousands) Total Multi-family % of (As of 6/30/2022) Market WA LTV (1) New York City Manhattan $7,654,764 0.20816749899067605 0.53605536470737325 Brooklyn 6,421,880 0.1746398319292721 0.56343740863958158 Bronx 3,725,522 0.10131371746728461 0.62317345992878603 Queens 2,921,673 7.9453443800303378E-2 0.4899504461777251 Staten Island ,126,617 3.4432863272731108E-3 0.584504129663446 Sub-total New York City 20,850,456 0.56701777851480928 0.55421505883303435 New Jersey 5,033,869 0.13689356327336746 0.68176019130237453 Long Island ,537,474 1.4616338054643437E-2 0.56837883099834452 Sub-total Metro New York 26,421,799 0.71852767984282018 0.57875116642924029 Other New York State 1,152,112 3.1331112702775131E-2 0.61586396942359534 All Other States 9,198,227 0.25014120745440477 0.67473198933417422 Total Multi-family $36,772,138 1 0.60377203937907364 Multi-Family Vacancy Rate (Residential Units) As of 6/30/2022: 3.5472579451323601E-2 (1) Weighted Average LTV
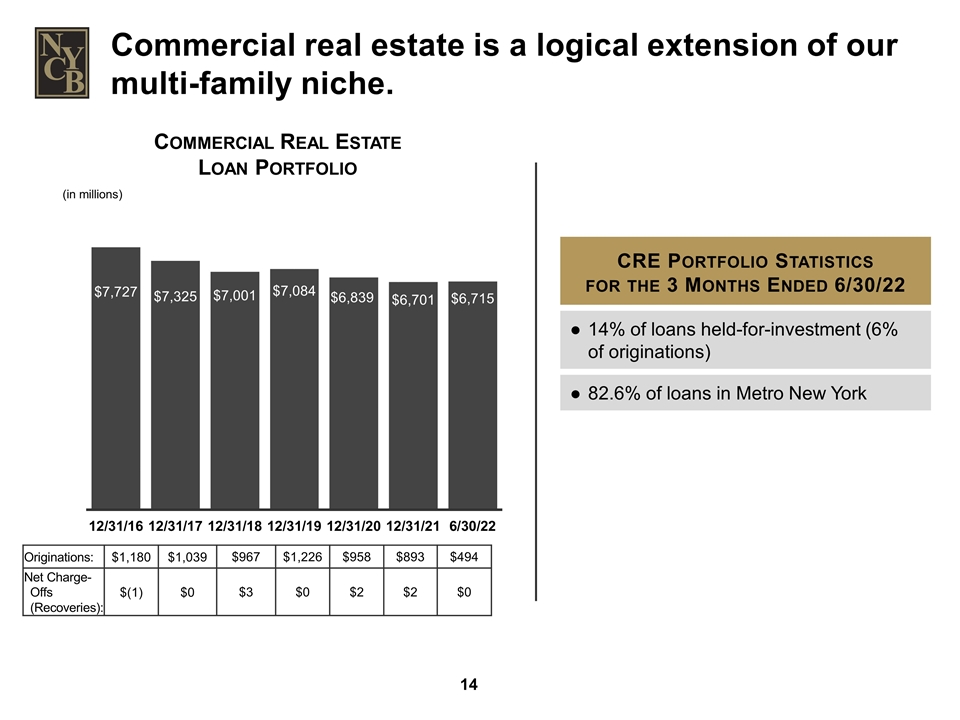
Commercial Real Estate Loan Portfolio (in millions) Originations: $1,180 $1,039 $967 $1,226 $958 $893 $494 Net Charge-Offs (Recoveries): $(1) $0 $3 $0 $2 $2 $0 Commercial real estate is a logical extension of our multi-family niche. CRE Portfolio Statistics for the 3 Months Ended 6/30/22 14% of loans held-for-investment (6% of originations) 82.6% of loans in Metro New York

Specialty Finance Loan and Lease Portfolio (in millions) Originations: $1,266 $1,784 $1,917 $2,800 $2,694 $3,153 $2,516 Net charge-Offs: $0 $0 $0 $0 $0 $0 $0 Our specialty finance business is another high-quality lending niche. Loan Types 9% of loans held-for-investment 29% of originations Syndicated asset-based and dealer floor-plan loans, primarily revolving lines of credit. Equipment loan and lease financing; non-revolving, amortizing obligations with a short duration. Obligors are primarily publicly traded companies with investment grade or near-investment grade ratings. Participants in stable, nationwide industries. Pricing Floating rates tied to SOFR – or LIBOR replacement indices. Fixed rates at a spread over treasuries. Risk-averse Credit & Underwriting Standards Require a perfected first-security interest in, or outright ownership of, the underlying collateral. Loan commitments are structured as senior secured debt or as non-cancellable leases. All transactions are re-underwritten in-house. All underlying documentation re-reviewed by outside counsel. CAGR (2016-2022) 23.6% The team has been working together for over 25 years, mostly at larger regional banks in the Northeast; the past nine years at NYCB. Extensive experience in senior secured lending, transaction structuring, credit, capital markets, and risk management. Excellent track record on credit administration over the past 25 years of originations; with no credit losses since inception at NYCB. As of 6/30/22, this segment has $4.5 billion outstanding (including letters of credit) versus $6.6 billion in commitments. As of 6/30/22, within the $6.6 billion in Specialty Finance commitments, 75% or $5.0 billion are structured as floating rate obligations which have and will continue to benefit in a rising rate environment.
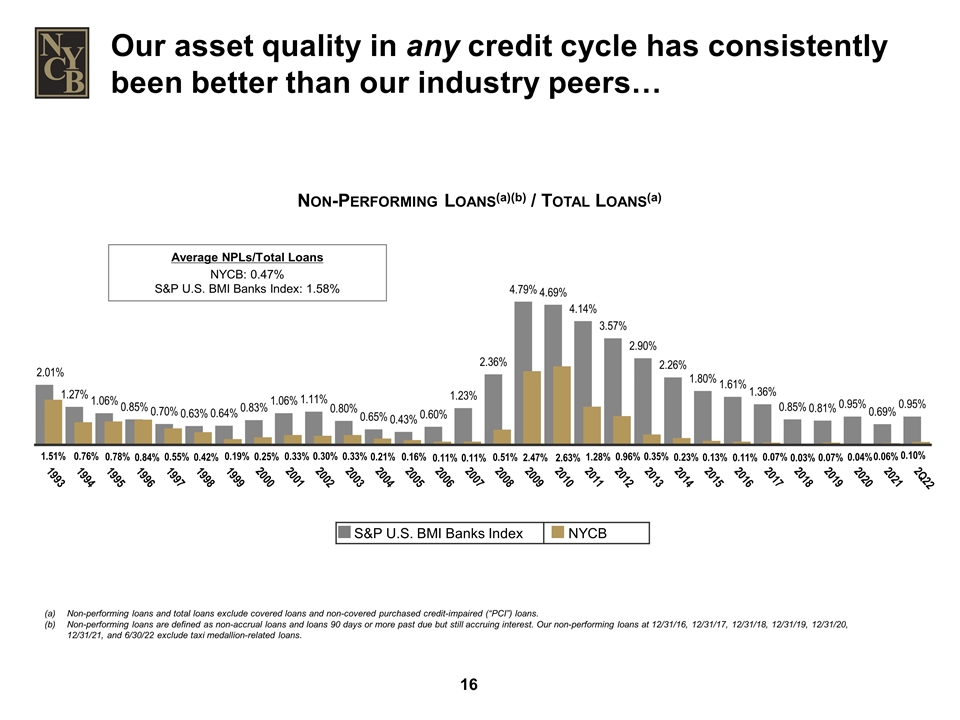
Non-Performing Loans(a)(b) / Total Loans(a) Non-performing loans and total loans exclude covered loans and non-covered purchased credit-impaired (“PCI”) loans. Non-performing loans are defined as non-accrual loans and loans 90 days or more past due but still accruing interest. Our non-performing loans at 12/31/16, 12/31/17, 12/31/18, 12/31/19, 12/31/20, 12/31/21, and 6/30/22 exclude taxi medallion-related loans. Average NPLs/Total Loans NYCB: 0.47% S&P U.S. BMI Banks Index: 1.58% S&P U.S. BMI Banks Index NYCB Our asset quality in any credit cycle has consistently been better than our industry peers…
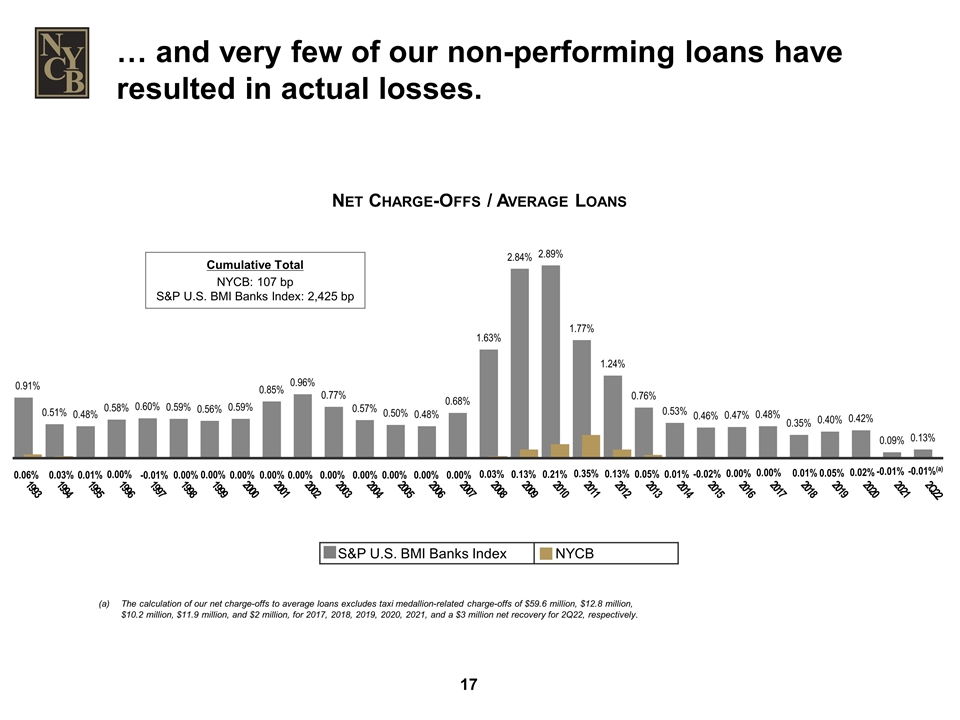
… and very few of our non-performing loans have resulted in actual losses. Net Charge-Offs / Average Loans Cumulative Total NYCB: 107 bp S&P U.S. BMI Banks Index: 2,425 bp The calculation of our net charge-offs to average loans excludes taxi medallion-related charge-offs of $59.6 million, $12.8 million, $10.2 million, $11.9 million, and $2 million, for 2017, 2018, 2019, 2020, 2021, and a $3 million net recovery for 2Q22, respectively. S&P U.S. BMI Banks Index NYCB
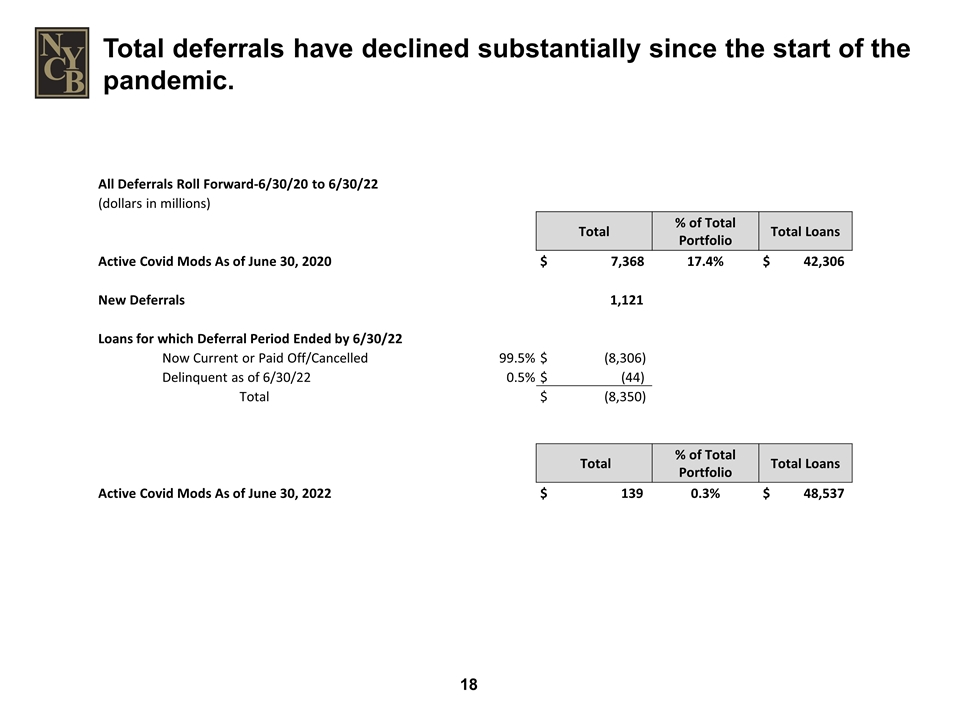
Total deferrals have declined substantially since the start of the pandemic. All Deferrals Roll Forward-6/30/20 to 6/30/22 (dollars in millions) Total % of Total Portfolio Total Loans Active Covid Mods As of June 30, 2020 $ 7,368 17.4% $ 42,306 New Deferrals 1,121 Loans for which Deferral Period Ended by 6/30/22 Now Current or Paid Off/Cancelled 99.5% $ (8,306) Delinquent as of 6/30/22 0.5% $ (44) Total $ (8,350) Total % of Total Portfolio Total Loans Active Covid Mods As of June 30, 2022 $ 139 0.3% $ 48,537
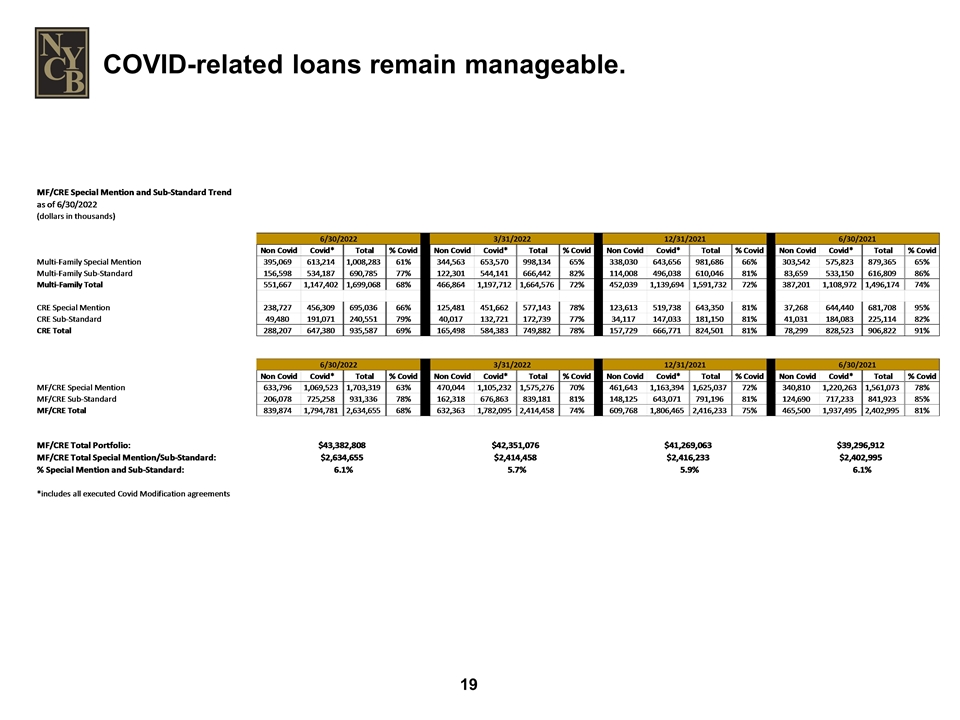
COVID-related loans remain manageable. MF/CRE Special Mention and Sub-Standard Trend as of 6/30/2022 (dollars in thousands) 44742 3/31/2022 44561 44377 Non Covid Covid* Total % Covid Non Covid Covid* Total % Covid Non Covid Covid* Total % Covid Non Covid Covid* Total % Covid Multi-Family Special Mention 395068.96966000012 613214.14826000016 1008283.1179200003 0.6081765501786911 344563.29173 653570.40312999999 998133.69485999993 0.6547924456369254 338030.15041 643655.88619999995 981686.03660999995 0.65566368695912181 303541.86201999994 575822.79887000006 879364.66088999994 0.65481685184757488 Multi-Family Sub-Standard 156597.86639000004 534187.4080299997 690785.27441999968 0.7733045677305681 122301.01939999999 544141.27397999994 666442.29337999993 0.81648670767918241 114008.35980000001 496037.8336500001 610046.19345000014 0.8131152017271881 83659.387229999993 533149.51854999992 616808.90577999991 0.8643674135602718 Multi-Family Total 551666.83605000016 1147401.5562899997 1699068.3923399998 0.67531216604516398 466864.31112999999 1197711.67711 1664575.9882400001 0.71952958925976818 452038.51020999998 1139693.71985 1591732.23006 0.7160084455958019 387201.24924999994 1108972.31742 1496173.5666699999 0.74120566097703156 CRE Special Mention 238727.42666999999 456308.85821000003 695036.28488000005 0.65652523204422775 125480.92343999998 451661.70072999998 577142.62416999997 0.7825824706320097 123612.59445999999 519737.88902000006 643350.48348000005 0.80786119287366209 37268.011729999998 644439.9092600001 681707.92099000013 0.94533140868324061 CRE Sub-Standard 49479.944040000009 191070.72349999999 240550.66753999999 0.79430552180125535 40017.461469999995 132721.48427999998 172738.94574999996 0.76833561594201183 34116.770950000006 147033.25015000001 181150.02110000001 0.8116656529056292 41030.694610000006 184083.24284999998 225113.93745999999 0.81773365490845873 CRE Total 288207.37070999999 647379.58171000006 935586.95241999999 0.69195020306288002 165498.38490999996 584383.1850099999 749881.56991999992 0.77930063686235684 157729.36541 666771.1391700001 824500.50458000007 0.80869706624334059 78298.706340000004 828523.15211000014 906821.85845000017 0.91365591200698082 44742 3/31/2022 44561 44377 Non Covid Covid* Total % Covid Non Covid Covid* Total % Covid Non Covid Covid* Total % Covid Non Covid Covid* Total % Covid MF/CRE Special Mention 633796.39633000013 1069523.0064700001 1703319.4028000003 0.62790513905487455 470044.21516999998 1105232.1038599999 1575276.3190299999 0.70161157792339768 461642.74486999999 1163393.77522 1625036.52009 0.71591854142180589 340809.87374999991 1220262.7081300002 1561072.58188 0.78168223713239371 MF/CRE Sub-Standard 206077.81043000004 725258.13152999966 931335.94195999973 0.77872881186534193 162318.48086999997 676862.75825999992 839181.23912999989 0.80657517911353738 148125.13075000001 643071.08380000014 791196.21455000015 0.81278331717720931 124690.08184 717232.76139999996 841922.84323999996 0.85189844551532656 MF/CRE Total 839874.2067600002 1794781.1379999998 2634655.3447599998 0.68122046459306151 632362.69603999995 1782094.8621199997 2414457.5581599995 0.73809326492286398 609767.87562000006 1806464.8590200001 2416232.7346400004 0.74763694453843621 465499.95558999991 1937495.4695300001 2402995.4251199998 0.80628346158139119 MF/CRE Total Portfolio: $43,382,808.454090007 $42,351,076.97940013 $41,269,062.659610003 $39,296,911.764120013 MF/CRE Total Special Mention/Sub-Standard: $2,634,655.3447599998 $2,414,457.5581599995 $2,416,232.7346400004 $2,402,995.4251199998 % Special Mention and Sub-Standard: 6.7% 5.7% 5.9% 6.1% *includes all executed Covid Modification agreements
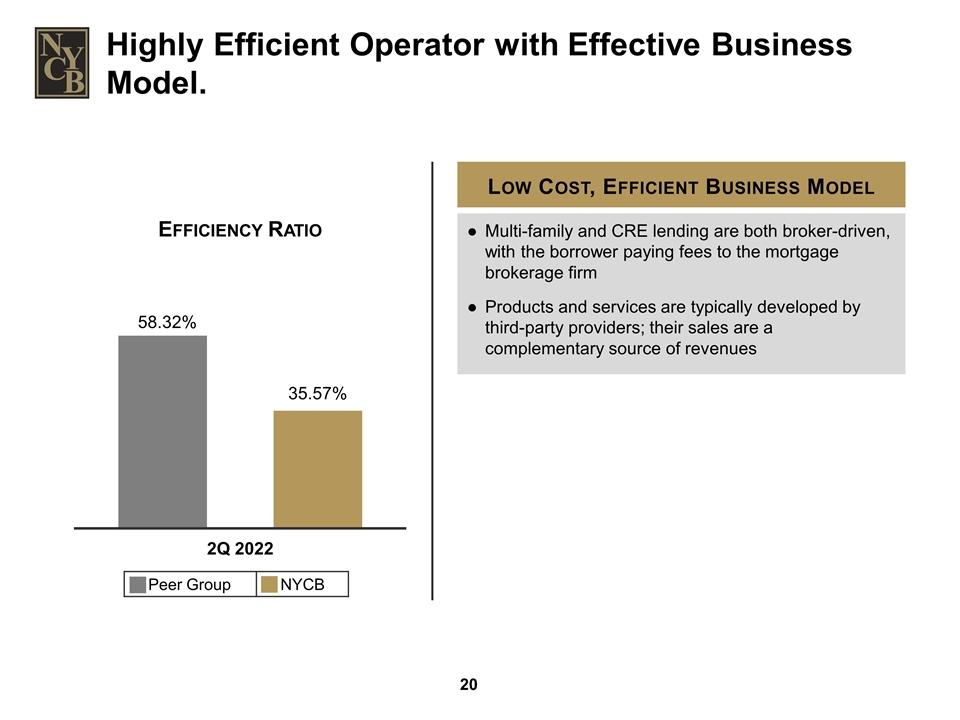
Efficiency Ratio Peer Group NYCB Highly Efficient Operator with Effective Business Model. Low Cost, Efficient Business Model Multi-family and CRE lending are both broker-driven, with the borrower paying fees to the mortgage brokerage firm Products and services are typically developed by third-party providers; their sales are a complementary source of revenues
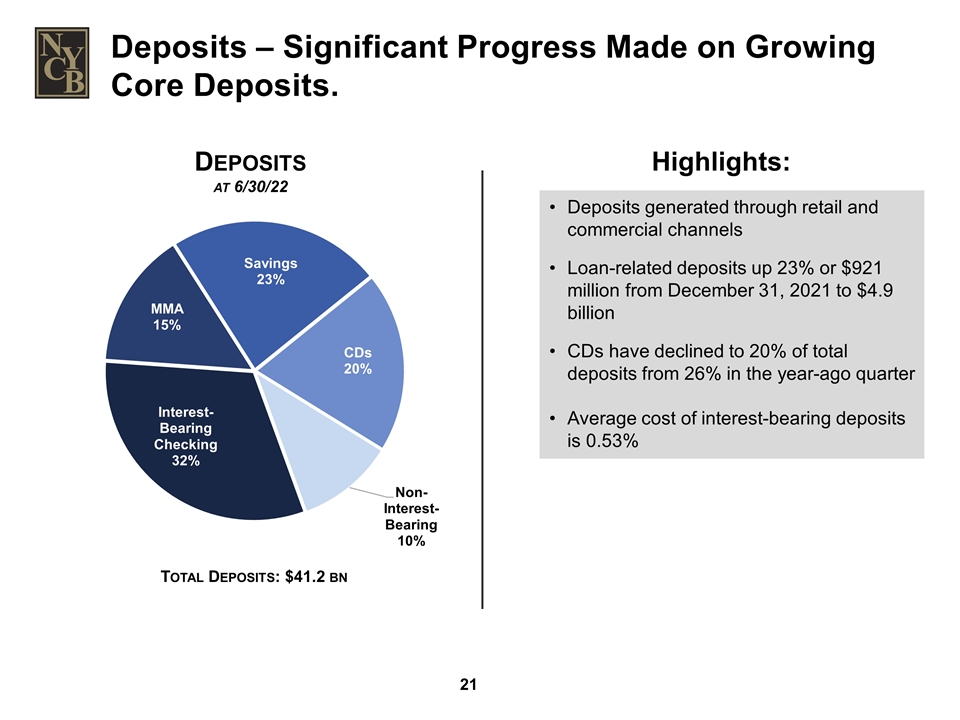
Total Deposits: $41.2 bn Deposits at 6/30/22 Deposits – Significant Progress Made on Growing Core Deposits. Deposits generated through retail and commercial channels Loan-related deposits up 23% or $921 million from December 31, 2021 to $4.9 billion CDs have declined to 20% of total deposits from 26% in the year-ago quarter Average cost of interest-bearing deposits is 0.53% Highlights:
Visit our website: ir.myNYCB.com E-mail requests to: ir@myNYCB.com Call Investor Relations at: (516) 683-4420 Write to: Investor Relations New York Community Bancorp, Inc. 102 Duffy Avenue Hicksville, NY 11801 For More Information
Appendix
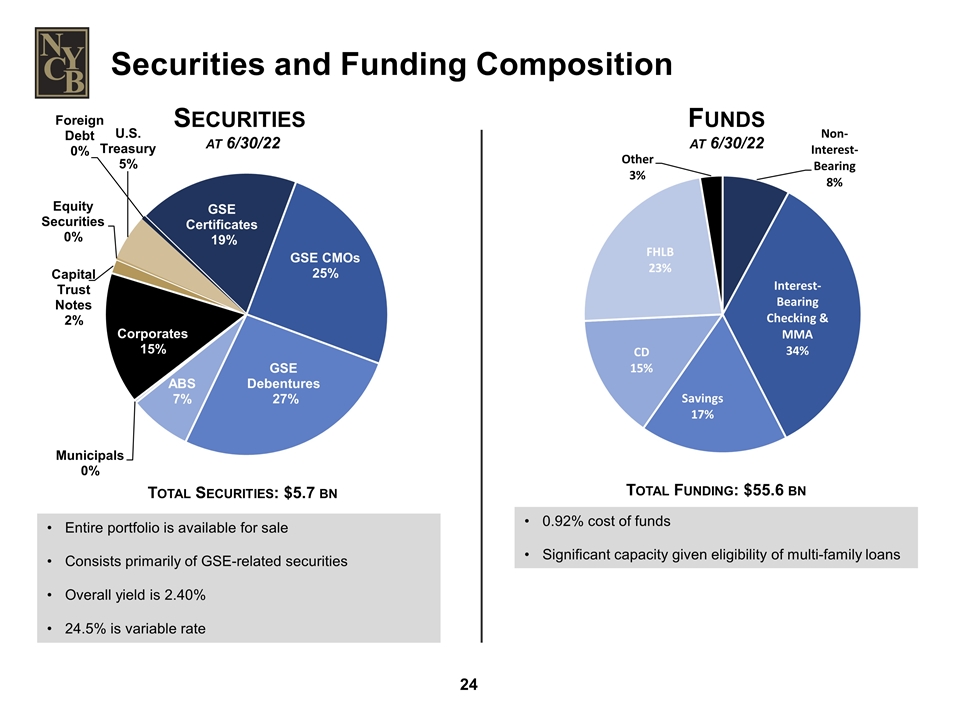
Securities and Funding Composition Funds at 6/30/22 0.92% cost of funds Significant capacity given eligibility of multi-family loans Total Funding: $55.6 bn Entire portfolio is available for sale Consists primarily of GSE-related securities Overall yield is 2.40% 24.5% is variable rate Securities at 6/30/22 Total Securities: $5.7 bn
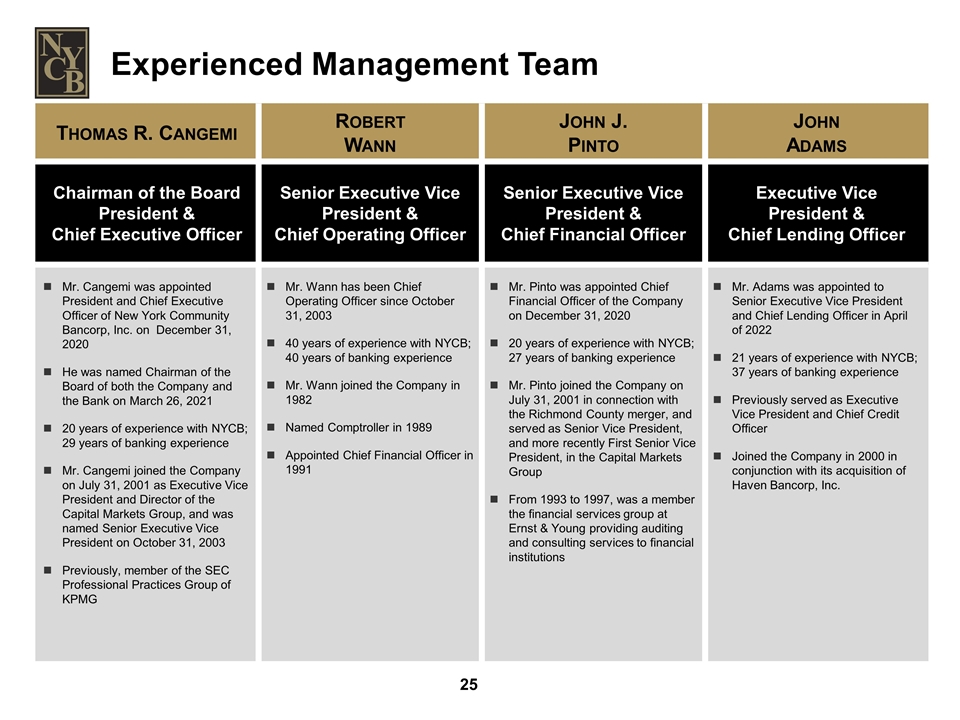
Experienced Management Team Thomas R. Cangemi Robert Wann John J. Pinto John Adams Chairman of the Board President & Chief Executive Officer Senior Executive Vice President & Chief Operating Officer Senior Executive Vice President & Chief Financial Officer Executive Vice President & Chief Lending Officer Mr. Cangemi was appointed President and Chief Executive Officer of New York Community Bancorp, Inc. on December 31, 2020 He was named Chairman of the Board of both the Company and the Bank on March 26, 2021 20 years of experience with NYCB; 29 years of banking experience Mr. Cangemi joined the Company on July 31, 2001 as Executive Vice President and Director of the Capital Markets Group, and was named Senior Executive Vice President on October 31, 2003 Previously, member of the SEC Professional Practices Group of KPMG Mr. Wann has been Chief Operating Officer since October 31, 2003 40 years of experience with NYCB; 40 years of banking experience Mr. Wann joined the Company in 1982 Named Comptroller in 1989 Appointed Chief Financial Officer in 1991 Mr. Pinto was appointed Chief Financial Officer of the Company on December 31, 2020 20 years of experience with NYCB; 27 years of banking experience Mr. Pinto joined the Company on July 31, 2001 in connection with the Richmond County merger, and served as Senior Vice President, and more recently First Senior Vice President, in the Capital Markets Group From 1993 to 1997, was a member the financial services group at Ernst & Young providing auditing and consulting services to financial institutions Mr. Adams was appointed to Senior Executive Vice President and Chief Lending Officer in April of 2022 21 years of experience with NYCB; 37 years of banking experience Previously served as Executive Vice President and Chief Credit Officer Joined the Company in 2000 in conjunction with its acquisition of Haven Bancorp, Inc.
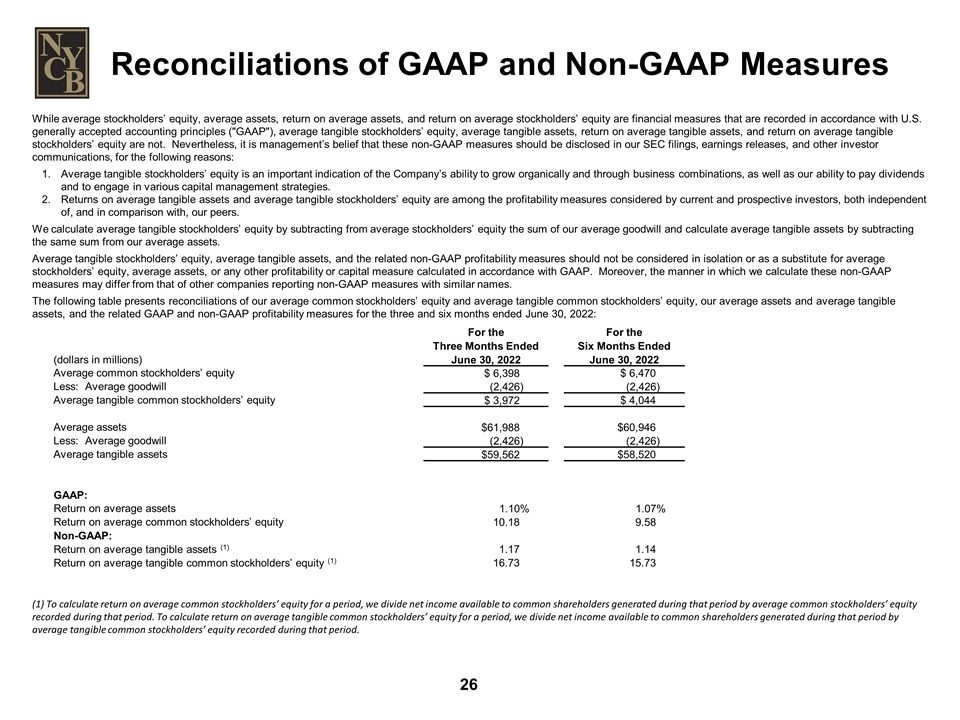
While average stockholders’ equity, average assets, return on average assets, and return on average stockholders’ equity are financial measures that are recorded in accordance with U.S. generally accepted accounting principles ("GAAP"), average tangible stockholders’ equity, average tangible assets, return on average tangible assets, and return on average tangible stockholders’ equity are not. Nevertheless, it is management’s belief that these non-GAAP measures should be disclosed in our SEC filings, earnings releases, and other investor communications, for the following reasons: Average tangible stockholders’ equity is an important indication of the Company’s ability to grow organically and through business combinations, as well as our ability to pay dividends and to engage in various capital management strategies. Returns on average tangible assets and average tangible stockholders’ equity are among the profitability measures considered by current and prospective investors, both independent of, and in comparison with, our peers. We calculate average tangible stockholders’ equity by subtracting from average stockholders’ equity the sum of our average goodwill and calculate average tangible assets by subtracting the same sum from our average assets. Average tangible stockholders’ equity, average tangible assets, and the related non-GAAP profitability measures should not be considered in isolation or as a substitute for average stockholders’ equity, average assets, or any other profitability or capital measure calculated in accordance with GAAP. Moreover, the manner in which we calculate these non-GAAP measures may differ from that of other companies reporting non-GAAP measures with similar names. The following table presents reconciliations of our average common stockholders’ equity and average tangible common stockholders’ equity, our average assets and average tangible assets, and the related GAAP and non-GAAP profitability measures for the three and six months ended June 30, 2022: (1) To calculate return on average common stockholders’ equity for a period, we divide net income available to common shareholders generated during that period by average common stockholders’ equity recorded during that period. To calculate return on average tangible common stockholders’ equity for a period, we divide net income available to common shareholders generated during that period by average tangible common stockholders’ equity recorded during that period. Reconciliations of GAAP and Non-GAAP Measures (dollars in millions) For the Three Months Ended June 30, 2022 For the Six Months Ended June 30, 2022 Average common stockholders’ equity $ 6,398 $ 6,470 Less: Average goodwill (2,426) (2,426) Average tangible common stockholders’ equity $ 3,972 $ 4,044 Average assets $61,988 $60,946 Less: Average goodwill (2,426) (2,426) Average tangible assets $59,562 $58,520 GAAP: Return on average assets 1.10% 1.07% Return on average common stockholders’ equity 10.18 9.58 Non-GAAP: Return on average tangible assets (1) 1.17 1.14 Return on average tangible common stockholders’ equity (1) 16.73 15.73
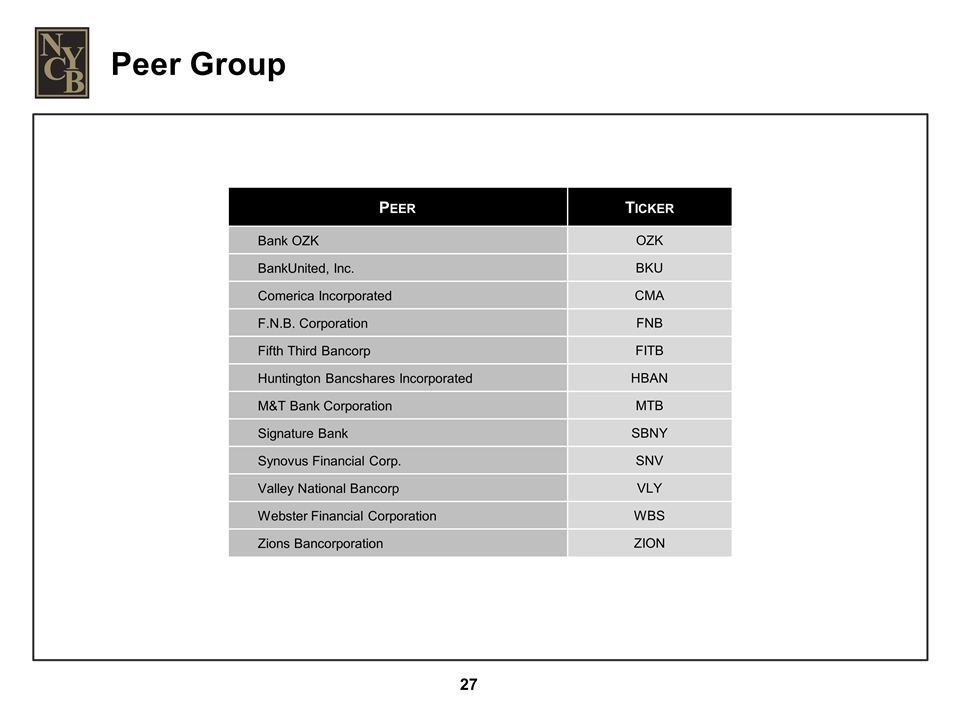
Peer Group Peer Ticker Bank OZK OZK BankUnited, Inc. BKU Comerica Incorporated CMA F.N.B. Corporation FNB Fifth Third Bancorp FITB Huntington Bancshares Incorporated HBAN M&T Bank Corporation MTB Signature Bank SBNY Synovus Financial Corp. SNV Valley National Bancorp VLY Webster Financial Corporation WBS Zions Bancorporation ZION


