Safe Harbor
This presentation, together with other statements and information publicly disseminated by Lexington, contains certain forward-looking
statements within the meaning of Section 27A of the Securities Act of 1933, as amended, and Section 21E of the Securities Exchange Act,
as amended. Lexington intends such forward-looking statements to be covered by the safe harbor provisions for forward-looking
statements contained in the Private Securities Litigation Reform Act of 1995 and include this statement for purposes of complying with
these safe harbor provisions. Forward-looking statements, which are based on certain assumptions and describe Lexington’s future plans,
strategies and expectations, are generally identifiable by use of the words “believes,” “expects,” intends,” “anticipates,” “estimates,”
“projects” or similar expressions. You should not rely on forward-looking statements since they involve known and unknown risks,
uncertainties, uncertainties and other factors which are, in some cases, beyond Lexington’s control and which could materially affect
actual results, performances or achievements. These factors include, but are not limited to those set forth in Lexington’s periodic filings
with the Securities and Exchange Commission, including, without limitation, our Annual Report on Form 10-K for the year ended
December 31, 2005 under “Item 1a. Risk Factors” and “Item 7. Management’s Discussion and Analysis of Financial Condition and
Results of Operations.” Lexington undertakes no obligation to publicly release the results of any revisions to these forward-looking
statements which may be made to reflect events or circumstances after the date hereof or to reflect the occurrence of unanticipated
events. Accordingly, there is no assurance that Lexington’s expectations will be realized.
Lexington believes that funds from operations ("FFO") enhances an investor's understanding of Lexington’s financial condition, results
of operations and cash flows. Lexington believes that FFO is an appropriate, but limited, measure of the performance of an equity
REIT. FFO is defined in the April 2002 “White Paper” issued by the National Association of Real Estate Investment Trusts, Inc. as “net
income (or loss) computed in accordance with generally accepted accounting principles (“GAAP”), excluding gains (or losses) from sales
of property, plus real estate depreciation and amortization and after adjustments for unconsolidated partnerships and joint
ventures.” FFO should not be considered an alternative to net income as an indicator of operating performance or to cash flows from
operating activities as determined in accordance with GAAP, or as a measure of liquidity to other consolidated income or cash flow
statement data as determined in accordance with GAAP. A reconciliation of FFO to net income is provided in Lexington’s Supplemental
Reporting Package for the year ended December 31, 2005, which can be accessed in the Investor Relations section at www.lxp.com.
2

Agenda
I.
Company History
E. Robert Roskind, Chairman
II.
Lexington Corporate Properties Trust
T. Wilson Eglin, Chief Executive Officer
III.
Acquisitions
Richard J. Rouse, Vice Chairman & CIO
Natasha Roberts, Director of Acquisitions
IV.
Lexington Strategic Asset Corp.
Brendan P. Mullinix, Chief Operating Officer
BREAK
V. Portfolio Management
John B. Vander Zwaag, Executive Vice President
VI.
Finance
Patrick Carroll, Chief Financial Officer
VII.
Questions
3

Company History
E. ROBERT ROSKIND,
CHAIRMAN
4

Evolution
- Acquisition volume of $1.0
billion
- Sale/leaseback and
Build-to-Suit
Multiple property types:
office, industrial, retail,
health clubs, hotels,
convenience stores, gas
stations, bus terminals
and restaurants
- Major sponsor of income-
oriented partnerships
1985 - 1992
- Private partnership
- Corporate finance
transactions
- Tax-oriented investment
programs
- Sale/leaseback focus
- Hotels, retail, office and
industrial
1973 – 1985
- 17.7% annual compound
return to shareholders
- 13 consecutive years of
dividend increases
- Joint venture strategy
- Capital source for
corporations and merchant
builders
- Primary focus on office and
industrial
- Nationwide platform
- Assets under management
grew from $200 million to
$4.5 billion
- 1993 IPO
1993 - Present
5

Keys to Long-Term Success
People & Corporate Culture
Investment Strategy
Business Philosophy
6

1993 IPO
Believed that REITs would emerge as best way for
public to invest in real estate
Assets under management have grown from $200
million to $4.5 billion
Track record of smart growth
17.7% annual compound return to shareholders
13 consecutive years of per share dividend increases
7
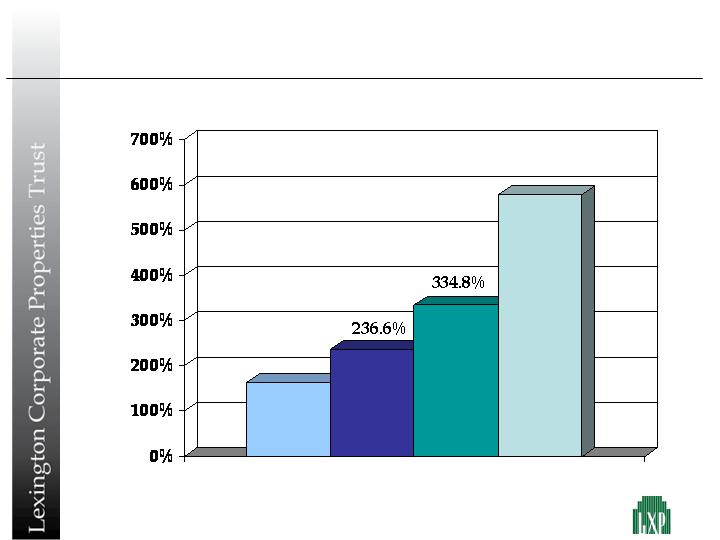
Stellar Market Performance
577.7%
S & P 500
NAREIT
LXP
Total returns 10/22/93 – 12/31/05
Russell
2000
163.2%
Source: Bloomberg
8

Lexington Corporate Properties Trust
T. WILSON EGLIN,
CHIEF EXECUTIVE OFFICER
9

Who We Are – NYSE: LXP
Largest REIT focused on single-tenant office and
industrial properties
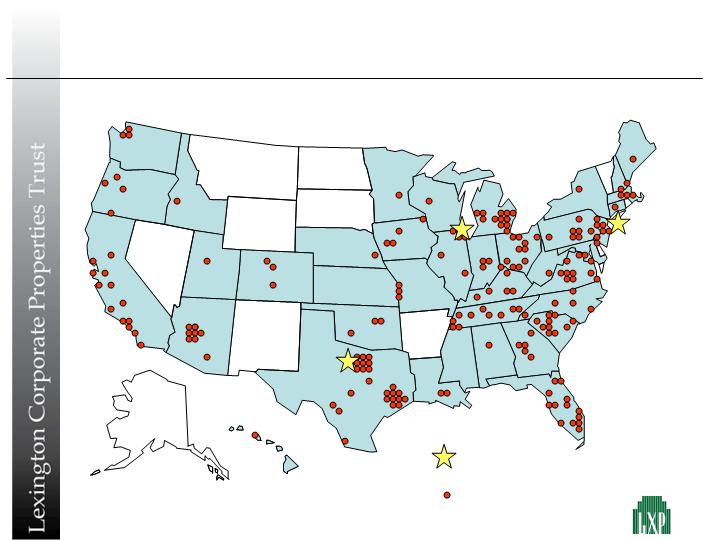
Nationwide investment platform
- 40.2 million square feet in 39 states
- Diversification and competitive advantage
Growth segments
- Corporate sale/leaseback transactions
- Build-to-suit
- Properties subject to existing leases
- UPREIT structure
Joint ventures
Disciplined capital allocator: acquisitions, dispositions,
stock repurchases and capital recycling
Proven management team: average experience 20 years
10

Why Net Lease?
Tenant is responsible for operating expenses
Insulates property owner from rising costs
Long-term leases reduce short-term market risk
Provides predictable, growing cash flow with lower
risk and retenanting costs than multi-tenanted assets
Vacancy risk mitigated due to:
(i) Strategic significance of asset
(ii) Length of lease commitment
(iii) Credit tenant
(iv) Properties suitable for alternate users
11
WV
Nationwide Investment Platform
Corporate Offices
Property Locations
12
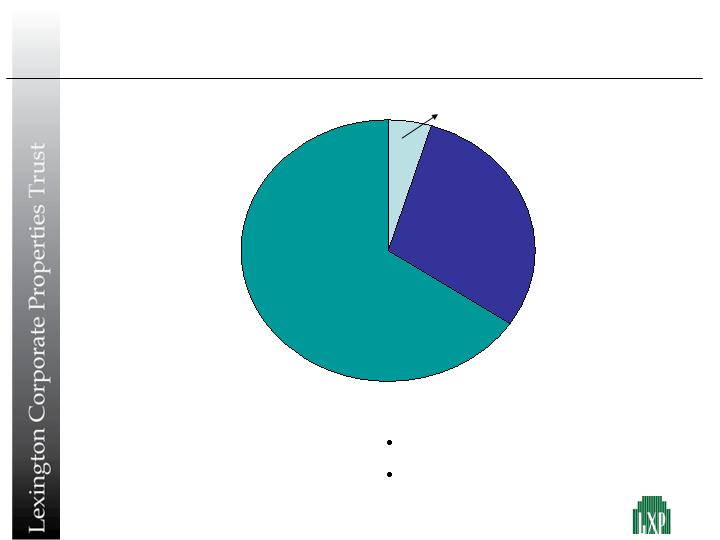
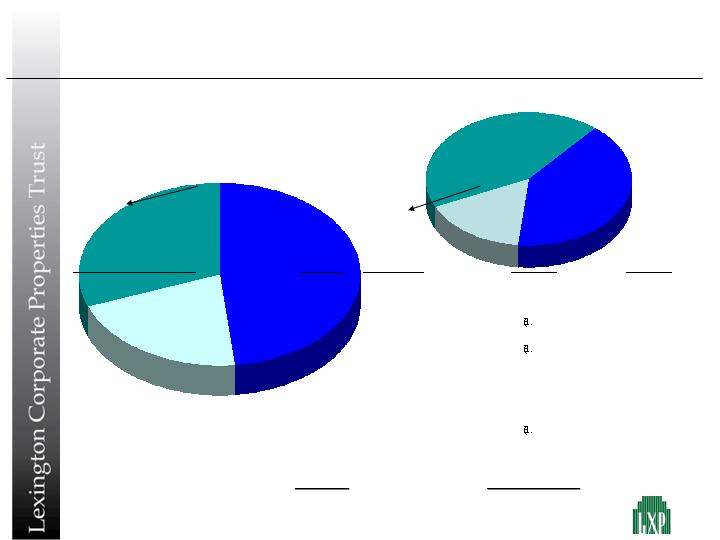
Portfolio Composition
Current Allocation Strategy
Reduced emphasis on retail
Allocation weighted toward office
* Revenue for the twelve months ended
December 31, 2005.
Industrial
29.7%
Office
65.6%
Retail 4.7%
13
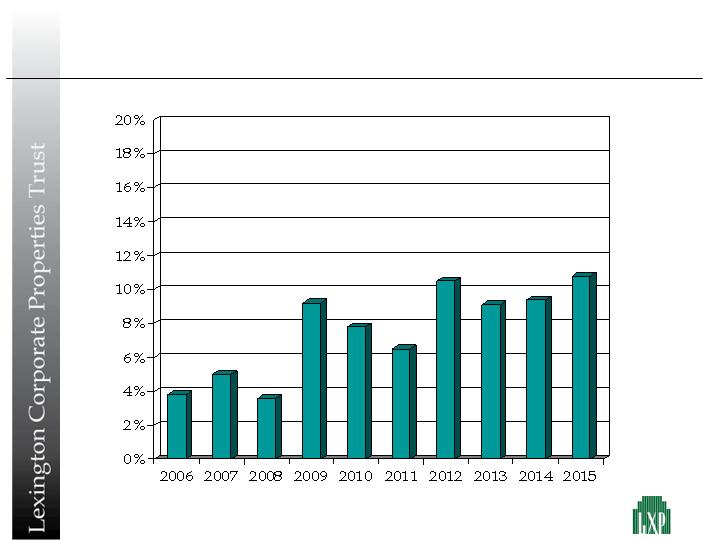
Lease Rollover Schedule
% of Revenue at 12/31/05
14
LXP Tenant Credit Profile
15
Investment
Grade
40.6%
Unrated
30.8%
2005
Non-
investment
Grade 20.9%
Investment
Grade
48.3%
2004
Non-
Investment
Grade 16.4%
Unrated
43.0%
\
Number of
Percentage of Rent
Top 15 Tenants (Guarantors)
Properties
Property Type
12/31/2005
12/31/2004
Baker Hughes, Inc.
4
Office (3)/ Industrial (1)
5.8%
6.0%
Kmart Corporation
7
Industrial(1)/Retail(6)
4.3%
5.3%
Dana Corporation
10
Office (1)/Industrial (9)
3.6%
-
Northwest Pipeline Corp.
1
Office
3.6%
5.2%
Wells Fargo Home Mortgage, Inc.
2
Office
2.8%
2.5%
Invensys Systems, Inc. (Siebe, Inc.)
2
Office
2.5%
-
Exel Logistics, Inc. (NFC plc)
4
Industrial
2.1%
3.0%
Nextel Finance Corporation
4
Office
2.0%
2.8%
Internet Security Systems, Inc.
1
Office
1.9%
-
Owens Corning
4
Industrial
1.8%
2.2%
Michaels Stores, Inc.
2
Industrial
1.7%
2.3%
Harcourt Brace
1
Industrial
1.5%
-
James Hardie Building Products, Inc.
1
Industrial
1.5%
2.0%
(James Hardie Industries N.V.)
Circuit City Stores, Inc.
2
Office (1)/Industrial (1)
1.4%
2.0%
Honeywell, Inc.
3
Office (3)
1.3%
2.5%
48
37.8%

Exposure To Dana Corporation
16
(1) These assets are owned in joint ventures. Lexington’s economic interest is shown.
($000's)
2006
Book
Non-recourse
Location
Type
Rent
Value
Debt Balance
Status
Farmington Hills, MI
Office
2,331
$
29,263
$
20,550
$
Leased but
underutilized
Elizabethtown, KY
Industrial
2,838
$
32,222
$
16,687
$
Fully utilized
Kalamazoo, MI
Industrial
1,843
$
23,607
$
17,625
$
Fully utilized
Dry Ridge, KY
Industrial
1,346
$
15,227
$
7,905
$
Fully utilized
Owensboro, KY
Industrial
796
$
8,998
$
7,069
$
Fully utilized,
expansion started
Elizabethtown, KY
Industrial
537
$
6,055
$
3,144
$
Fully utilized
Gordonsville, TN
Industrial
354
$
3,377
$
-
Fully utilized
Olive Branch, MS
Industrial
959
$
11,028
$
-
Fully utilized
Antioch, TN
1
Industrial
733
$
7,680
$
4,289
$
Motion filed to reject;
50% subleased
Hopkinsville, KY
Industrial
1,451
$
16,424
$
9,777
$
Fully utilized,
expansion started
Crossville, TN
1
Industrial
167
$
1,550
$
-
Fully utilized,
expansion started
TOTAL
13,355
$
155,431
$
87,046
$
Growth Segments
Long-term hold
Expansion
capacity
Financially
strong landlord
Sale/leasebacks
Corporate
Users
Portfolio benefit
Liquid security
Estate planning
Tax deferred
exit strategies
UPREIT
Structure
Nationwide
owner
Not a “1031”
investor
Reliable closer
Purchases
Existing
Leases
Facilitates
construction
financing
Forward
commitments
Build-To-Suit
Merchant
Builders
17
Joint Ventures Enhance Diversification & Returns
Private capital commitments mitigate dependence on capital
markets
Portfolio diversification reduces vacancy risk and credit
exposure
Fee income offsets corporate operating costs and generates
higher returns with less risk
65% leverage
Forward
commitments
BB credit tenants
URS
60% leverage
Large
transactions ($15
million+)
Forward
commitments
BB credit tenants
LION
High leverage
C-corp structure
Special use
properties
B credit tenants
LSAC
65% leverage
Large
transactions ($15
million)
Major markets
Investment
Grade Credits
NYCRF
18

Disciplined Capital Allocator
No equity issued at discount to net asset value or prior issue
price
Disciplined and patient when evaluating acquisition
opportunities
Pruning of non-core assets and bottom 10% of portfolio:
$100-$150 million of sales in 2006
Redeploy proceeds into joint ventures, especially LSAC, and
leveraged investments
Opportunistic repurchase of stock
Will return capital to shareholders if no accretive use
19

Capital Allocation: 2004 Acquisition Program
$935.1 million in assets acquired exceeded $250 million
target
44 properties
GAAP cap rate of 8.9%
$502 million in joint ventures
Acquisition Cost $935,052
Mortgage Debt $624,966
Joint Venture Equity $133,512
LXP Equity $176,574
Investments ($000’s)
Revenues $52,936
Asset Management Fees $ 726
Interest Expense $23,266
Funds From Operations $30,396
FFO Yield 17.2%
Funds From Operations ($000’s)
20
Capital Allocation: 2005 Acquisition Program
$1.14 billion in assets acquired exceeded $500 million
target
43 properties
GAAP cap rate of 8.1%
$464 million in joint ventures
Acquisition Cost $1,138,828
Mortgage Debt $ 794,482
Joint Venture Equity $ 141,337
LXP Equity $ 203,009
Investments ($000’s)
Revenues, net $62,758
Asset Management Fees $ 1,022
Interest Expense $31,493
Funds From Operations $32,287
FFO Yield 15.9%
Funds From Operations ($000’s)
21
Proven Management Team
Industry
Experience
E. Robert Roskind 32
Chairman
Richard J. Rouse 31
Vice Chairman & CIO
T. Wilson Eglin 19
CEO, President & COO
Patrick Carroll 20
CFO, Treasurer & EVP
John B. Vander Zwaag 24
Executive Vice President
Natasha Roberts 11
Director of Acquisitions
Brendan P. Mullinix 9
LSAC Chief Operating Officer
NYSE 10th Anniversary
22

Acquisitions
RICHARD J. ROUSE,
VICE CHAIRMAN & CIO
AND
NATASHA ROBERTS,
DIRECTOR OF ACQUISITIONS
23
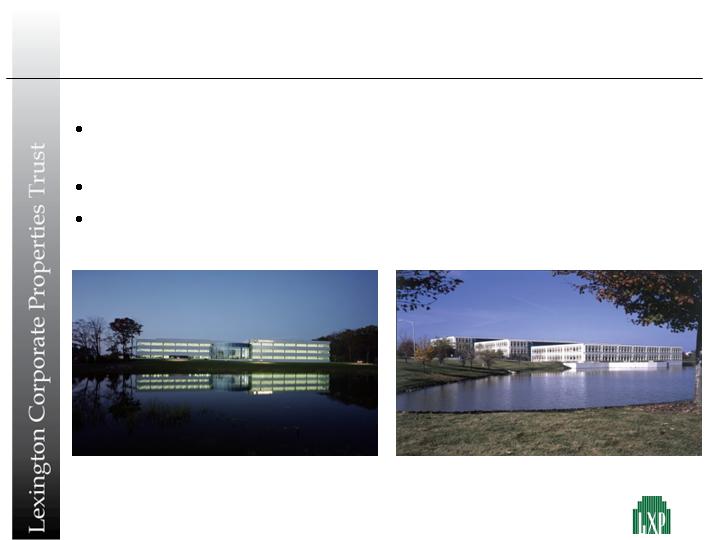
Sourcing
Unparalleled national network of corporate users,
developers, brokers and owners
32 year track record
$10 billion of transactions sourced in 2005
SIRVA, INC.
WESTMONT, IL
MOTOROLA, INC.
FARMINGTON HILLS, MI
24
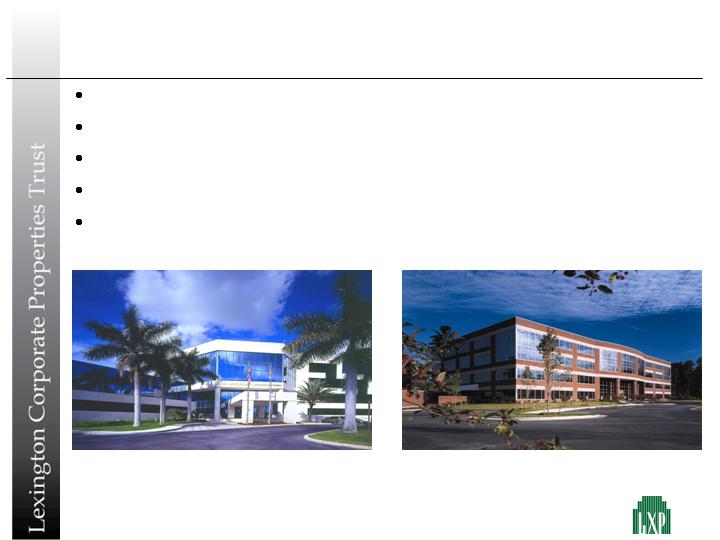
Acquisition Criteria
Single-tenant, net leased commercial properties
Minimum lease term of 7 years remaining
Purchase price: $8 million and up
Nationwide investor
Selective off-shore investor
WACKENHUT
PALM BEACH GARDENS, FL
ALSTOM POWER
RICHMOND, VA
25

External Growth Track Record
26

Acquisition Underwriting
The Building: Design, construction quality,
efficiency, functionality, location,
replacement cost, strategic value to
tenant
The Lease: Landlord exposure, term, rental
increases, maintenance provisions
The Market: Vacancy, absorption, employment and
population trends, contract rent vs.
market
The Tenant: Financial strength, growth prospects,
competitive position
Superior Performance Requires Mastery in Four Critical Areas
27
Case Study: Dana Corp. Sale/Leaseback
Five mission critical manufacturing facilities
Direct relationship – transaction execution critical to tenant
FFO yield: 33.6%
$30 million of mortgage debt repurchased with $23 million
investment – 23% discount to face amount
Purchase Price: $78.9 million
Lease Term: 20 years
Cap Rate: 8.8%
Mortgage: $68.4 million
Term: 10 years
Interest Rate: 5.0%
DANA CORP.
DRY RIDGE, KY
28
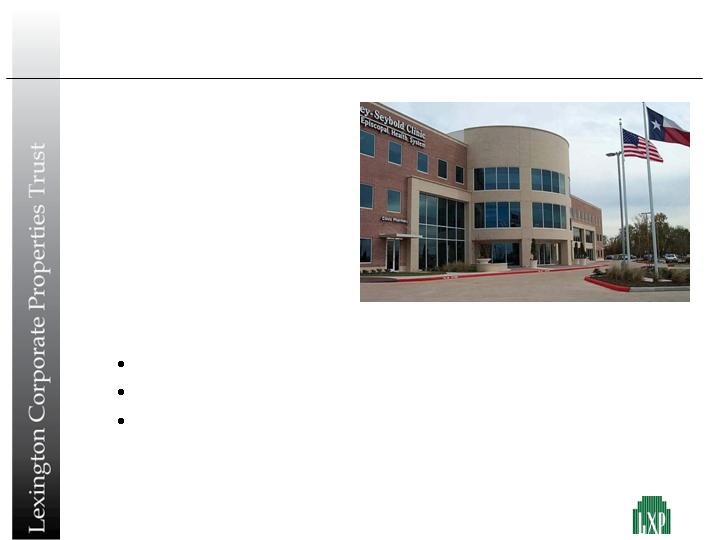
Case Study: Kelsey Seybold Build-to-Suit
Forward commitment generates yield premium
15 year lease to “A” credit tenant
FFO yield: 14.8%
Purchase Price: $14.5 million
Lease Term: 15 years
Avg. Cap Rate: 8.5%
Mortgage: $10.0 million
Term: 15 years
Interest Rate: 5.6%
KELSEY SEYBOLD
SUGAR LAND, TX
29

Case Study: Wells Portfolio Acquisition
$796.4 million purchase price
$296.0 million in joint ventures
7.7% initial cap rate
27 properties – seven year
weighted average lease term
Nationwide platform created
negotiating leverage
5.2% mortgage debt
Investment ($000’s)
Acquisition Cost $796,409
Mortgage Debt $516,593
Joint Venture
Equity $ 75,303
LXP Equity $204,513
Funds From Operations ($000’s)
Revenues $45,255
Asset Management
Fees $ 362
Interest Expense $19,826
Funds From
Operations $25,791
FFO Yield 12.6%
DAIMLER-CHRYSLER
WESTLAKE, TX
30
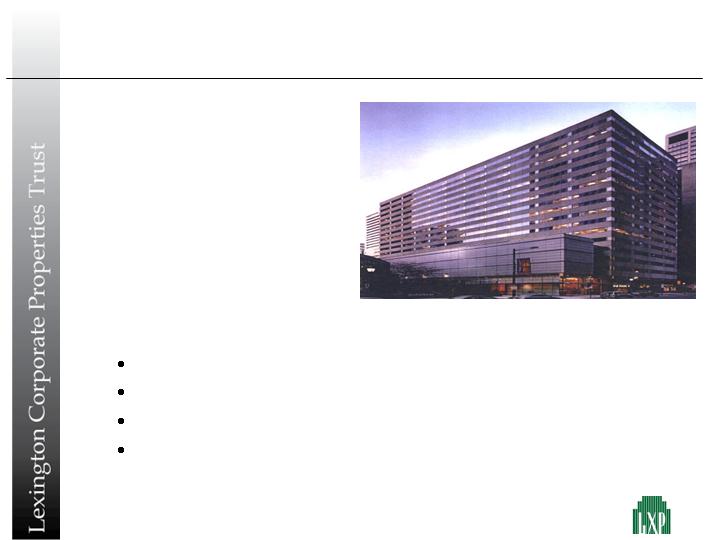
Case Study: 6 Penn Center Acquisition
Purchase Price: $68.3 million
Lease Term: 9 Years
Avg. Cap Rate: 7.1%
Mortgage: $49.0 million
Term: 9 years
Interest Rate: 5.1%
Class “A” office property in CBD location
Philadelphia office of Morgan Lewis
FFO Yield of 12.3%
Complex tax structure eliminated competition
6 PENN CENTER
PHILADELPHIA, PA
31
Lexington Strategic Asset Corp.
BRENDAN P. MULLINIX,
CHIEF OPERATING OFFICER
32

Lexington Strategic Asset Corp.
Closed in October 2005, 6.7 million shares at $10.00 per share, net
proceeds of $61.6 million
Private Offering:
Expected 2006 Public Offering
Growth Plan
$85.0 million
Total Assets Acquired
Since Formation:
Contribution of four real estate assets in exchange for $33.2 million of
stock
LXP Investment:
100,000 shares purchased by LSAC executive officers ($1mm)
Management Investment:
Extend Lexington’s acquisition platform to take advantage of
inefficient pricing in certain credit and asset categories
Strategic Objective:
Investment in high-yielding net leased assets
Investment Focus:
Subsidiary of Lexington Corporate Properties Trust
External Advisor:
“C”-Corp. advised by Lexington Corporate Properties Trust
Corporate Structure:
August 2005
Formed:
33

Why Create LSAC?
Created to capitalize on the expanded use of net lease structures into
non-traditional sectors and property types
Focus on higher yielding net lease investments
- Private/Middle market tenants
- Special purpose real estate
- Specialized facilities
- Integral equipment
- Non-U.S. properties
“One stop” source of sale-leaseback financing for all of a company’s key
property financing needs
Expected to achieve higher unleveraged yields than those available on
traditional net lease real estate investments
“C”-Corp. structure enables non-REIT qualifying investments and
capital recycling to generate high earnings growth
Acquisition criteria does not conflict with Lexington’s
34

Why a “C”-Corp?
Reinvestment & leveraging
of retained cash flow
Dependent on accessing
capital markets
Earnings Growth Driver:
65%-75% of assets readily
accepted
Typically 50%-60% of assets
Leverage:
Very diverse
Primarily REIT-dedicated
funds
Investor Base:
15% maximum tax rate
(qualified individuals)
Ordinary income tax rate
Investor Dividend
Taxation:
40% (none to minimal
anticipated initially due to
shelter)
None
Entity Income Taxation:
No restrictions
Must be “real estate”
Eligible Investments:
Easy
Difficult
Capital Recycling:
No restrictions
4 year hold for “safe harbor”
Asset Sales:
None
90% of taxable income
Payout Requirement:
“C”-Corp
REIT
35
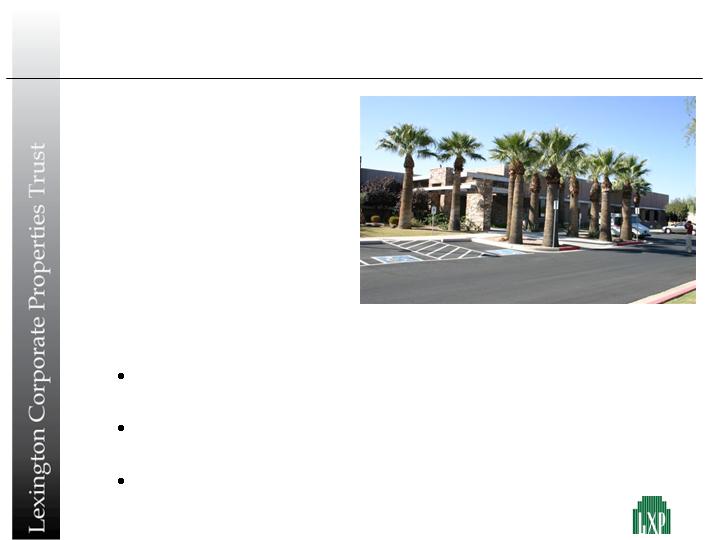
Case Study: Infocrossing, Inc. Sale/Leaseback
Purchase Price: $25.0 million
Lease Term: 20 years
Cap Rate: 9.2%
Mortgage: $17.5 million
Term: 10 years
Interest Rate: 5.6%
Acquisition financing for Infocrossing, Inc.’s purchase of
(i)Structure, LLC
20 year net leases on strategically important data processing
centers in Tempe, AZ and Omaha, NE
FFO yield of 17.5%
INFOCROSSING, INC.
TEMPE, AZ
36
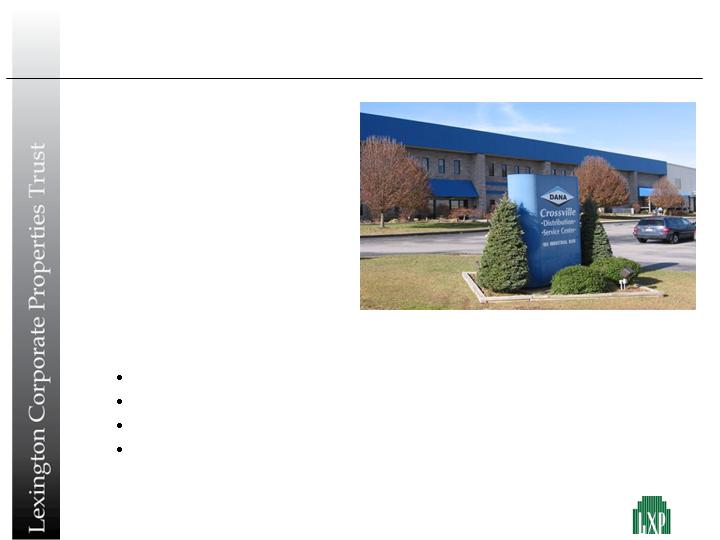
Case Study: Dana Corp. Expansion
Purchase Price: (1) $7.4 million
Lease Term: 10 years
Cap Rate: 9.4%
Square Feet: (1) 222,200
Expansion started on strategically important facility
Significant imbedded capital gain upon lease affirmation
“C”-Corp. structure permits quick re-sale
Opportunity to sell when Dana emerges from bankruptcy
DANA CORP.
CROSSVILLE, TN
(1) Post-expansion
37

LSAC Current Portfolio
38
(1) Amounts shown are post-expansion
Net
Average
Amount
Base
Rentable
Capitalized
Annual
Average
of
Lease
Square
Costs
Rent, Net
Annual
Mortgage
Interest
Location
Tenant
Expiration
Footage
($000's)
($000's)
Yield
($000's)
Rate
Knoxville, TN
Alstom Power
Oct-2014
84,400
12,249
$
1,154
$
9.4%
7,800
$
5.3%
Jacksonville, FL
AmeriCredit Corp.
Jun-2011
85,000
14,761
$
1,112
$
7.5%
5,804
$
5.1%
Tulsa, OK
Metris
Jan-2010
101,100
13,871
$
1,307
$
9.4%
7,689
$
5.1%
Companies, Inc.
Lavonia, GA
TI Group Automotive
May-2020
133,200
14,374
$
1,200
$
8.3%
10,100
$
5.5%
Systems, LLC
Omaha, NE
InfoCrossing, Inc.
Nov-2025
86,800
12,873
$
1,167
$
9.1%
9,000
$
5.6%
Tempe, AZ
InfoCrossing, Inc,
Dec-2025
60,000
12,163
$
1,128
$
9.3%
8,500
$
5.6%
Crossville, TN
(1)
Dana Corporation
Aug-2016
222,200
7,394
$
692
$
9.4%
-
-
TOTAL
772,700
87,685
$
7,760
$
8.8%
48,893
$
5.4%

Portfolio Management
JOHN B. VANDER ZWAAG,
EXECUTIVE VICE PRESIDENT
39

Portfolio Management Objectives:
High Occupancy & Income Growth
High tenant retention
- Recognize and manage occupancy risks
- Invest at the asset level
Maximize potential of existing portfolio
- Asset repositioning
- Building expansions
- Excess land development
Asset Sales
- Continuous process focused on maximizing value
and mitigating risk
40
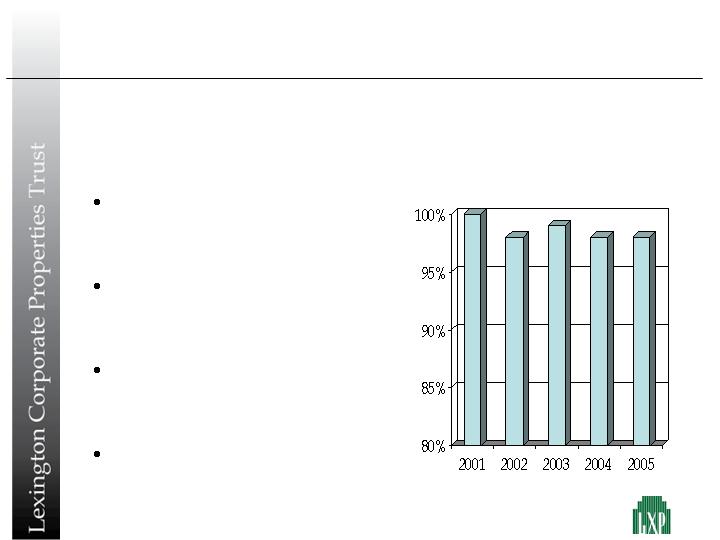
Leasing
Long-Term Leases Reduce Short-Term Market Risk, Provide Cash
Flow Stability and Mitigate Turnover Risks
LXP’s unique asset mix and
emphasis on long-term leases
mitigate vacancy risk
Approximately 73% of the
Company’s leases will expire
post-2010
LXP has a proven history of
extending leases or re-leasing
properties
98.3% leased at year end 2005
Leased*
* As of respective year-ends
41
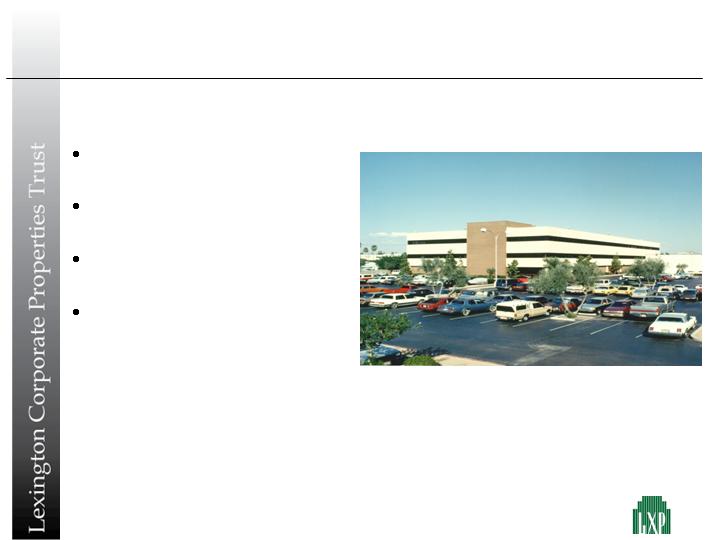
Case Study: I-17 Center, Phoenix, AZ
Formerly occupied by Bank
One
Value at 11/03 vacancy: $3.0
million
Under contract for $7.6
million
Purchase of adjacent land
for $0.7 million adds
significant value and
permits partion and sale to
two buyers
Value Doubles After Adjacent Land Purchase
I-17 CENTER
PHOENIX, AZ
42

Case Study: 1600 Viceroy Drive, Dallas, TX
Former headquarters of
Vartec Telecom
250,000 square feet
$21 million mortgage paid
off at 25% discount
48,000 square foot lease
signed
Multi-tenant strategy
1600 VICEROY DRIVE
DALLAS, TX
Repurchase of Mortgage At 25% Discount Lowers Basis
43
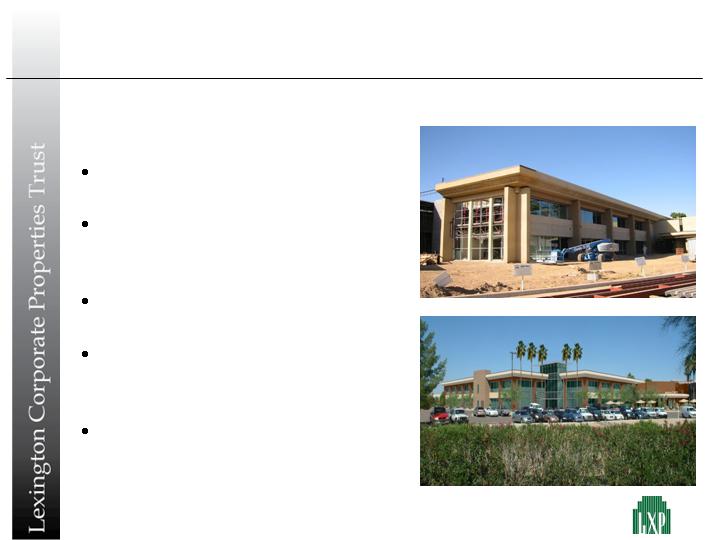
Case Study: Black Canyon Center, Phoenix, AZ
Refurbishment Creates Attractive Multi-Tenant Property
Formerly 100% leased to
Bull Information Systems
Conversion to multi-tenant
tenancy with Bull retained
as main tenant
Added rentable area by
decking and renting atrium
Modernized exterior with
new window lines and
entrance
Now 65% leased
BLACK CANYON CENTER
PHOENIX, AZ
44

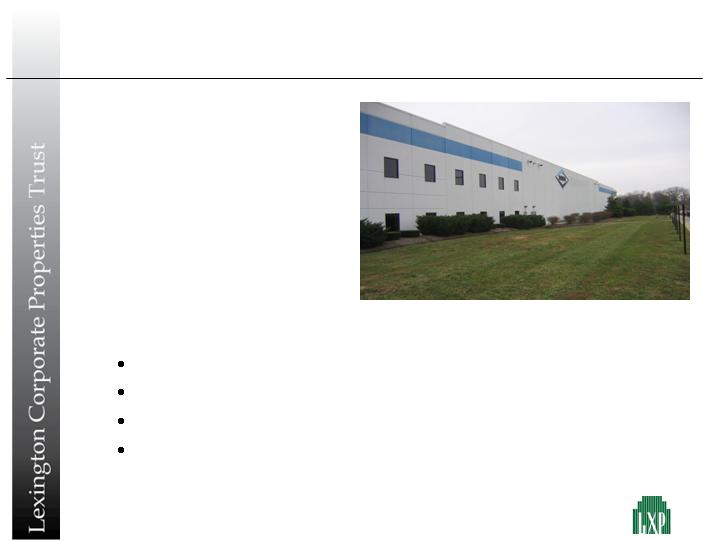
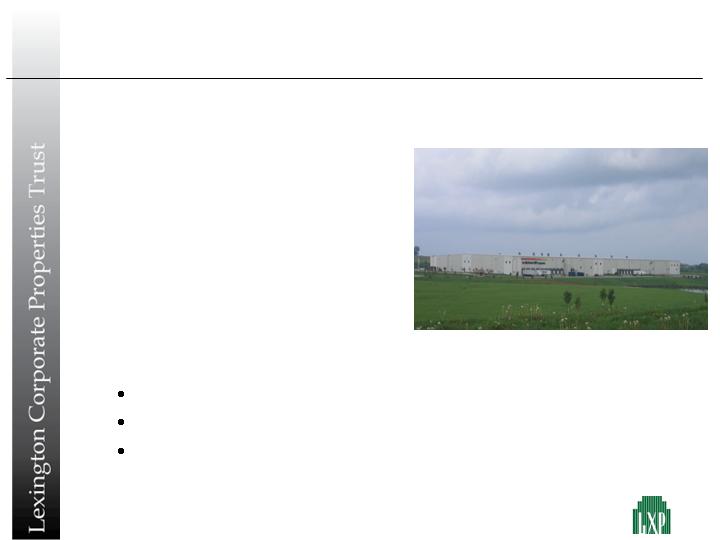
Case Study: Owens Corning, Chester, SC
OWENS CORNING
CHESTER, SC
Expansion and Lease Affirmation for Strategically Essential Real Estate
Initial Investment: $15.5 million
Expansion: $6.4 million
Total: $21.9 million
Avg. Cap Rate: 10.0%
Mortgage: $14.0 million
Mortgage Rate: 5.4%
Initial Lease Exp.: 2020
Extended Lease Exp.: 2025
Expansion from 194,000 square feet to 421,000 square feet
generates higher yield and extended lease term
Facilitates financing on favorable terms
FFO Yield: 10.5% pre expansion
18.1% post expansion and leveraging
45
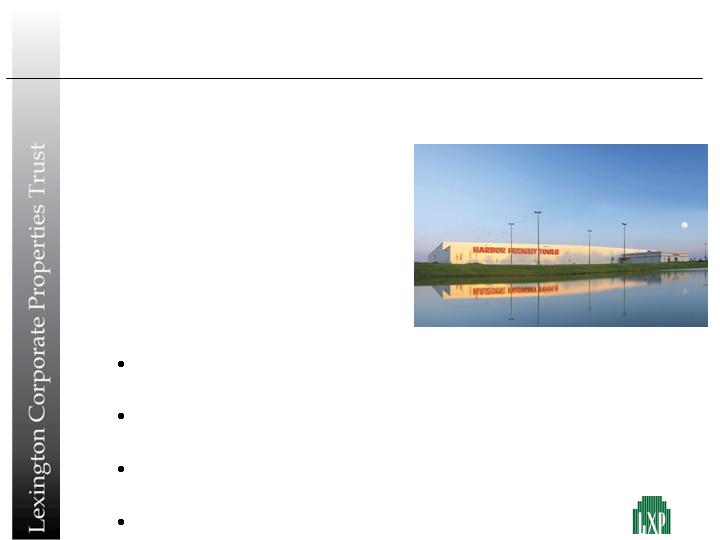
Case Study: Harbor Freight Tools, Dillon, SC
HARBOR FREIGHT TOOLS
DILLON, SC
Expansion & Refinancing Enhances ROE & Reduces Equity Investment
Initial Investment: $16.1 million
Expansion: $13.2 million
Total: $29.3 million
Avg. Cap Rate: 9.3%
Mortgage: $23.8 million
Mortgage Rate: 6.0%
Expansion and lease extension enhance market value to
approximately $40.0 million compared to $29.3 million cost
Refinancing reduces capital investment and enhances return on
equity
Market value of equity is approximately $16.2 million
compared to $5.5 million equity investment
Current FFO yield of 23.9%
46
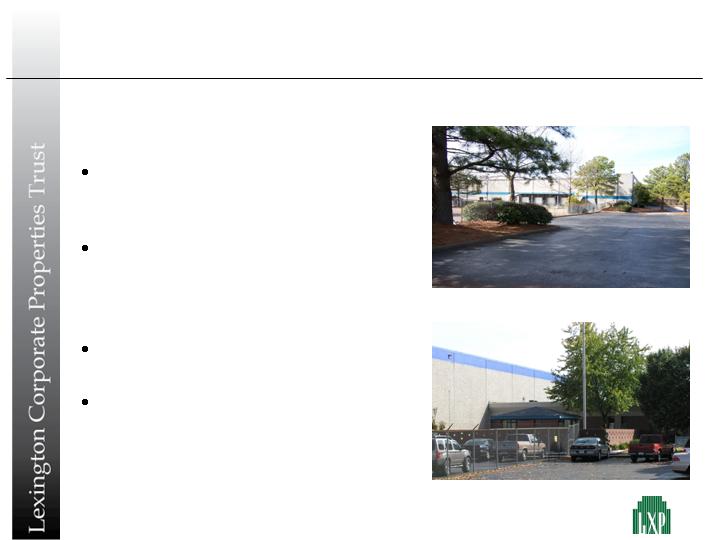
Case Study: Collierville, TN and Olive Branch, MS
Relocated Tenant to Facility We Expanded; Leased Vacant
Building to FedEx for 15 Years
Proactive tenant relationship
creates dual investment
opportunities
Expanded Olive Branch
facility by 100,000 square
feet enhancing cash flows
and long-term occupancy
Attractive basis in both
assets
GAAP cap rate of 10.3%
FEDEX CORPORATION
COLLIERVILLE, TN
DANA CORP.
OLIVE BRANCH, MS
47
Case Study: McGraw Hill, Dubuque, IA
Cash-out Refinancing Enhances Yield
Purchase Price: $11.6 million
Initial Mortgage: $7.4 million
Initial Equity: $4.2 million
Refinanced Amount: $10.9 million
Interest Rate: 5.4%
Year Acquired: 2003
Asset appreciation enables cash-out refinancing
Enhanced returns with less capital at risk
FFO Yield: 19.1% pre refinancing
75.0% post refinancing
MC GRAW HILL
DUBUQUE, IA
48
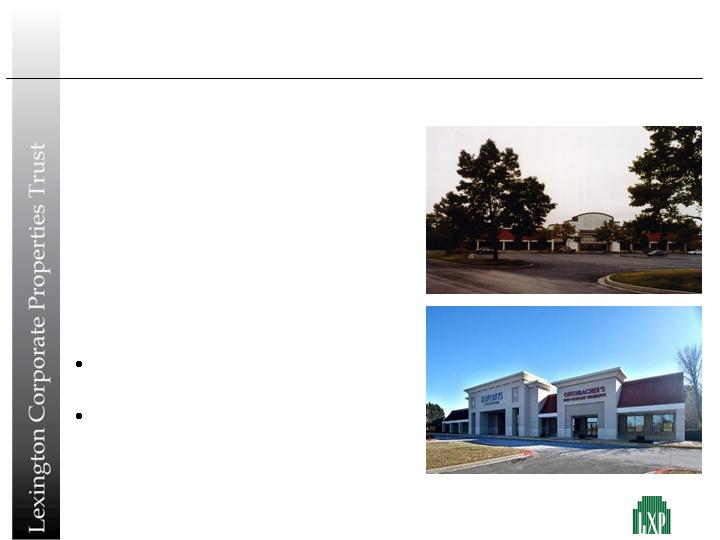
Case Study: Dobbin Road, Columbia, MD
Retail Vacancy Redeveloped and Sold for Huge Profit
Date Acquired: December 1998
Total Investment: $6.6 million
Date Sold: April, 2005
Sales Price: $12.0 million
76% capital appreciation on
6.5 year hold
Former Hechinger store
leased to Haverty Furniture
and Offenbacher Aquatics
DOBBIN ROAD
COLUMBIA, MD
49

Finance
PATRICK CARROLL,
CHIEF FINANCIAL OFFICER
50
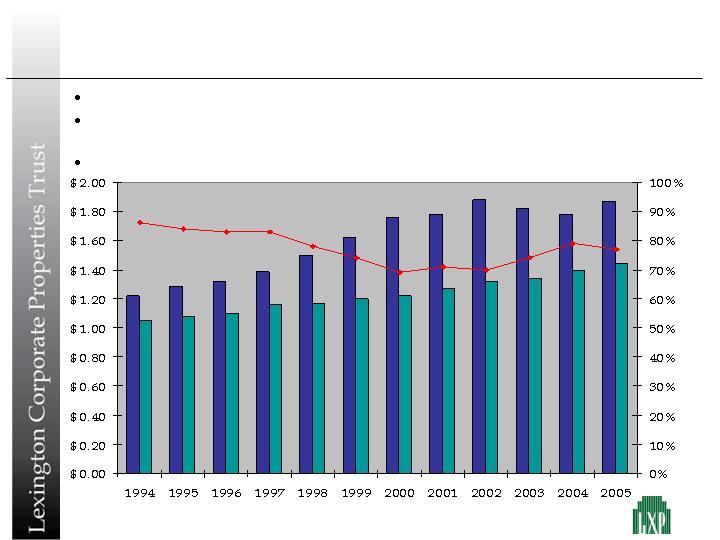
Financial Track Record
3.5% FFO per share compound growth from 1994 to 2005
Grew overall dividend by 39% over same period while reducing FFO payout from
86% to 76%
Dividend per share has increased for thirteen consecutive years
• Payout Ratio • Dividend Per Share • FFO Per Share
51

Operating Results
52
* Before non-recurring items
($ in millions, except per share data)
Quarterly
Quarters Ended
Years Ended
Percentage
December 31,
December 31,
Change
2005
2004
2005
2004
2003
Gross Revenues
42.2%
$53.9
$37.9
$197.1
$143.4
$106.0
Funds From Operations*
20.8%
$30.2
$25.0
$114.6
$93.2
$72.1
FFO Per Share/Unit*
4.3%
$0.48
$0.46
$1.87
$1.79
$1.82
Dividend Per Share
2.9%
$0.36
$0.35
$1.44
$1.40
$1.34
Payout Ratio
(1.4%)
75.0%
76.1%
77.0%
78.2%
73.6%

Balance Sheet Overview
53
($ in millions, except per share data)
Years Ended December 31,
2005
2004
2003
2002
Mortgages and notes payable
1,170.6
$
765.9
$
551.4
$
491.5
$
Preferred stock
234.0
$
214.0
$
79.0
$
-
Market value of common equity
1,232.8
$
1,220.0
$
931.0
$
561.1
$
Total market capitalization
2,637.4
$
2,199.9
$
1,561.4
$
1,052.6
$
Debt to total market capitalization
44.4%
34.8%
35.3%
46.7%
Shares/units outstanding
57,876
54,030
46,112
35,287

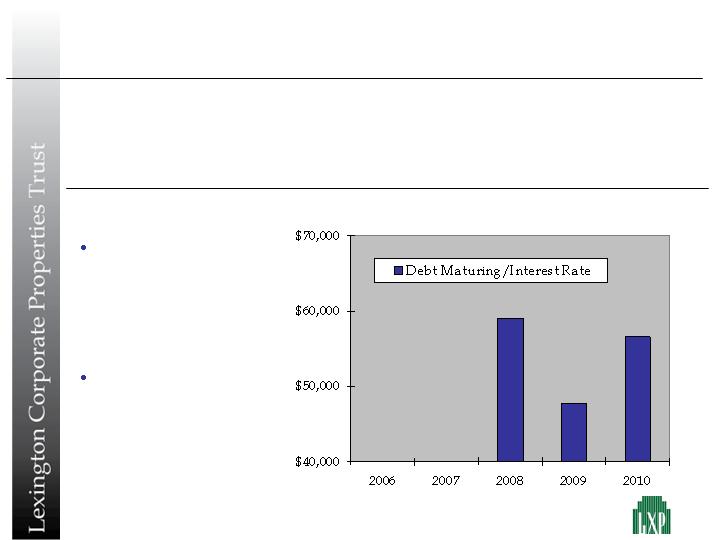
Debt Amortization
$317 million of consolidated balance sheet debt amortizes over time
Consolidated Properties
in millions
Joint Venture Properties (Pro Rata Share)
in millions
54
Debt Structure
($000’s)
$1,096,973
$255,072
$841,901
Balloon
Payment
100.0%
$1,460,804
$121,112
6.01%
Total
23.2%
$302,114
$21,682
July 2014
6.00%
Joint Venture
76.7%
$1,158,690
$99,430
January 2013
6.01%
Consolidated
% of
Total
12/31/05
Balance
Debt Service
Avg.
Maturity
Fixed Rate
Flat yield curve
reduces pre-payment
costs and creates
refinancing
opportunities
Near term maturities
can be refinanced at
lower rates
6.79%
7.18%
7.88%
55

Capacity For Growth
Joint ventures
- $700.0 million in acquisition capacity
- Non-public market capital source
Moderate balance sheet leverage
- 44% of market capitalization at December 31, 2005
Internal capital generation
- Amortizing debt
- Dividend reinvestment plan
56

Conclusion
T. WILSON EGLIN,
CHIEF EXECUTIVE OFFICER
57
Components of Value: Leases and Real Estate
REAL ESTATE
40.2 million square feet
3,683 acres
107 Office buildings
59 Industrial buildings
23 Retail buildings
39 States
$87.49 psf at $21.00 per
share
LEASES
202 Leases
137 Tenants
2006 rental revenues of
$242.0 million
Balanced lease rollover
Weighted average term
of 7 years
58

Key Strategies to Enhance Value
Grow our joint venture programs
- Fee income generates higher ROE with less
risk and offsets corporate overhead
- Diversify capital risk
Continually evaluate portfolio
- Prune non-core holdings
- Exit slower growth markets
- Mitigate vacancy risk
- Reinvest or distribute sale proceeds
Increase future cash flow and grow net asset value
- Strategic acquisitions and dispositions
- Disciplined, effective capital allocation
- Asset improvement initiatives
Real estate is cyclical: take profits opportunistically
59

Proven Ability To Add Value
Selective acquisitions, focus on joint ventures, asset
improvement initiatives and capital recycling
2006
Significant equity issuance at premium, purchase of
assets at “par”, three additional joint venture
programs, locked in low cost, long-term financing,
enhanced asset management capabilities
2001-2005
Capital recycling: developed joint venture business,
repurchased 1.4 million shares at a $10.62 per share
1998-2000
Acquisitions with OP Units, common shares issued at
premium to NAV, own account acquisitions
1996-1997
Active asset management: dispositions, leasing,
refinancing
1994-1995
IPO
1993
60
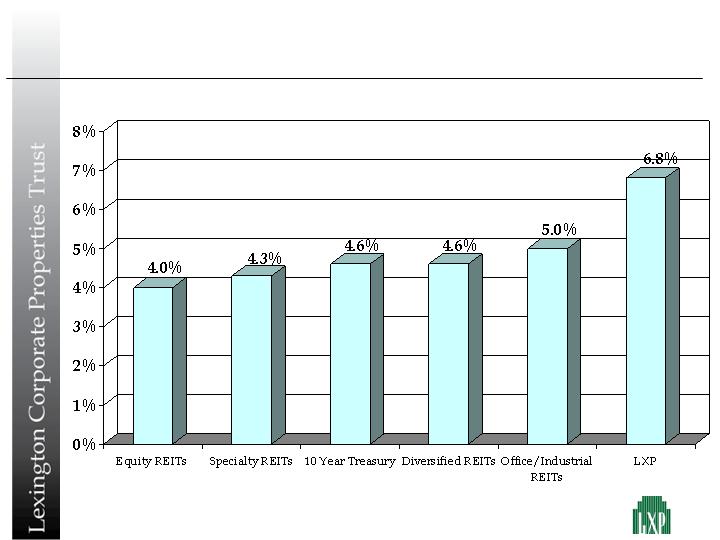
Above Average Dividend Yield
As of February, 2006.
Source: NAREIT
61

Focus on Long-Term Value Growth
High-quality diverse assets
Compelling basis relative to replacement cost
Unique focus on long-term value
Experienced management in place to execute
strategies
Financial flexibility
Disciplined capital allocation
62
Q & A
QUESTIONS & ANSWERS
63

BIOGRAPHIES
64

Biographies of Senior Management
E. ROBERT ROSKIND
Mr. Roskind has served as the Chairman of our Board of Trustees since October 1993 and was our
Co-Chief Executive Officer from October 1993 to January 2003. Mr. Roskind founded The LCP
Group, L.P. ("LCP"), a real estate advisory firm, in 1973 and has been its Chairman since 1976. Mr.
Roskind spends approximately 25% of his business time on the affairs of LCP and its affiliates;
however, Mr. Roskind prioritizes his business time to address the needs of us ahead of LCP and its
affiliates. LCP has been the general partner of various limited partnerships with which we have
had prior dealings. Mr. Roskind received his B.S. in 1966 from the University of Pennsylvania and
is a 1969 Harlan Fiske Stone Graduate of the Columbia Law School.
RICHARD J. ROUSE
Mr. Rouse has served as our Chief Investment Officer since January 2003, as Vice Chairman of our
Board of Trustees since April 1996 and as a trustee of us since October 1993. Mr. Rouse served as
our President from October 1993 to April 1996, and as one of our Co-Chief Executive Officers from
October 1993 to January 2003. Mr. Rouse graduated from Michigan State University in 1968 and
received his M.B.A. in 1970 from the Wharton School of Finance and Commerce of the University
of Pennsylvania.
T. WILSON EGLIN
Mr. Eglin has served as our Chief Executive Officer since January 2003, our Chief Operating Officer
since October 1993 and as a trustee of us since May 1994. Mr. Eglin served as Executive Vice
President from October 1993 to April 1996, and since April 1996 has served as our President. Mr.
Eglin received his B.A. from Connecticut College in 1986.
65

Biographies of Senior Management
PATRICK CARROLL
Mr. Carroll has served as our Chief Financial Officer since May 1998, our Treasurer since January
1999 and one of our Executive Vice Presidents since January 2003. Prior to joining us, Mr. Carroll
was, from 1993 to 1998, a Senior Manager in the real estate practice of Coopers & Lybrand L.L.P., a
public accounting firm that was one of the predecessors of Pricewaterhouse, Coopers LLP. Mr.
Carroll received his B.B.A. from Hofstra University in 1986, his M.S. in Taxation from C.W. Post in
1995, and is a Certified Public Accountant.
JOHN B. VANDER ZWAAG
Mr. Vander Zwaag has been employed by us since May 2003 and currently is one of our Executive
Vice Presidents. From 1982 to 1992, he was employed by LCP serving as Director of Acquisitions
from 1987 to 1992. Between his employment by LCP and us, Mr. Vander Zwaag was Managing
Director of Chesterton Binswanger Capital Advisors (1992 - 1997) and Managing Director with
Cohen Financial (1997 - 2003). He received his B.A. from Amherst College in 1979 and his M.B.A.
from Columbia University in 1982.
NATASHA ROBERTS
Ms. oberts has served as one of our Senior Vice Presidents and our Director of Acquisitions since
January 2006 and as a member of our acquisitions department since January 1997. Prior to joining
us, Ms. Roberts worked for Net Lease Partners Realty Advisors, a real estate advisory firm from
1995 to 1997. She received her B.F.A from New York University in 1989.
66

Biographies of Senior Management
BRENDAN P. MULLINIX
Mr. Mullinix is one of our Senior Vice Presidents and an Executive Vice President, the Chief
Operating Officer and the Secretary of Lexington Strategic Asset Corp. Mr. Mullinix has served as
one of our Vice Presidents since February 2000 and as a member of our acquisitions department
since October 1996. He received his B.A. from Columbia University in 1996.
67

Biographies of Board of Trustees
GEOFFREY DOHRMANN
Mr. Dohrmann has served as one of our trustees since August 2000. Mr. Dohrmann co-
founded Institutional Real Estate, Inc., a real estate-oriented publishing and consulting
company in 1987 and is currently its Chairman and Chief Executive Officer. Mr. Dohrmann
also belongs to the advisory boards for the National Real Estate Index, The Journal of Real
Estate Portfolio Management and Center for Real Estate Enterprise Management. Mr.
Dohrmann is also a fellow of the Homer Hoyt Institute and holds the Counselors of Real Estate
(CRE) designation.
CARL D. GLICKMAN
Mr. Glickman has served as one of our trustees since May 1994. Mr. Glickman has been
President of The Glickman Organization, a real estate development and management firm,
since 1953. Mr. Glickman is on the Board of Directors of Bear Stearns Companies, Inc., and
Cleveland State University.
JAMES GROSFELD
Mr. Grosfeld has served as one of our trustees since November 2003. He also serves as a
Director of Copart, Inc. and BlackRock, Inc. He has served on the Advisory Board of the
Federal National Mortgage Association and as Director of Interstate Bakeries Corporation and
Addington Resources. He was Chairman and Chief Executive Officer of Pulte Home
Corporation from 1974 to 1990. He received his B.A. from Amherst College in 1959 and L.L.B.
from Columbia Law School in 1962.
68

KEVIN W. LYNCH
Mr. Lynch has served as one of our trustees from May 2003 to the present and from May 1996 to
May 2000. Mr. Lynch co-founded and has been a Principal of The Townsend Group since 1983.
The Townsend Group is a real estate consulting firm to institutional investors in the United States.
Mr. Lynch is a frequent industry speaker and member of the Pension Real Estate Association and
the National Council of Real Estate Investment Fiduciaries. He currently sits on the Real Estate
Advisory Board for New York University and is a Director for First Industrial Realty Trust.
STANLEY R. PERLA
Mr. Perla has served as one of our trustees since August 2003. Mr. Perla, a licensed Certified
Public Accountant, was a partner for Ernst & Young LLP, a public accounting firm from
September 1978 to June 2003. He served as Ernst & Young's National Director of Real Estate
Accounting as well as Ernst & Young's National Accounting and Auditing Committee. He is an
active member of the National Association of Real Estate Investment Trusts and the National
Association of Real Estate Companies. Mr. Perla is also a director of American Mortgage
Acceptance Company and Vice President - Director of Internal Audit for Vornado Realty Trust.
SETH M. ZACHARY
Mr. Zachary has served as one of our trustees since November 1993. Since 1987, Mr. Zachary has
been a partner, and is currently the Chairman, of the law firm Paul, Hastings, Janofsky & Walker
LLP, counsel to the Company.
Biographies of Board of Trustees
69