Winter 2013 LEXINGTON REALTY TRUST A real estate investment trust specializing in single - tenant commercial properties.
Disclosure This presentation contains certain forward - looking statements within the meaning of Section 27 A of the Securities Act of 1933 , as amended, and Section 21 E of the Securities Exchange Act of 1934 , as amended, which involve known and unknown risks, uncertainties or other factors not under Lexington Realty Trust’s (“Lexington” or “LXP”) control which may cause actual results, performance or achievements of Lexington to be materially different from the results, performance, or other expectations implied by these forward - looking statements . These factors include, but are not limited to, those factors and risks detailed in Lexington’s periodic filings with the Securities and Exchange Commission . Except as required by law, Lexington undertakes no obligation to publicly release the results of any revisions to those forward - looking statements which may be made to reflect events or circumstances after the occurrence of unanticipated events . Accordingly, there is no assurance that Lexington’s expectations will be realized . Lexington assumes no obligation to update or supplement forward - looking statements that become untrue because of subsequent events . 2
Ten Reasons To Own LXP 5.2% Dividend Yield (1) Conservative Payout Ratio Advantages of Net Lease Properties Diversified Portfolio Active Asset Management & Capital Recycling Attractive Growth Prospects Strong Balance Sheet Refinancing Opportunity Compelling Value Investment Experienced Management 3 (1) Based on annualized dividend of $0.60 per share and the March 4, 2013 closing price of $11.56 per share.
Strong Dividend Yield 4
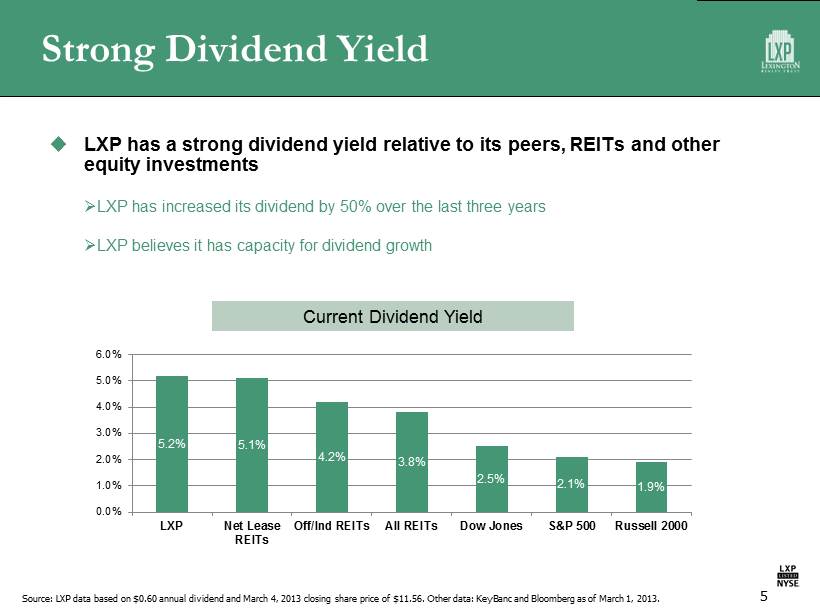
Strong Dividend Yield LXP has a strong dividend yield relative to its peers, REITs and other equity investments » LXP has increased its dividend by 50% over the last three years » LXP believes it has capacity for dividend growth Current Dividend Yield 5 Source: LXP data based on $0.60 annual dividend and March 4, 2013 closing share price of $11.56. Other data: KeyBanc and Bloomberg as of March 1, 2013. 5.2% 5.1% 4.2% 3.8% 2.5% 2.1% 1.9% 0.0% 1.0% 2.0% 3.0% 4.0% 5.0% 6.0% LXP Net Lease REITs Off/Ind REITs All REITs Dow Jones S&P 500 Russell 2000
Conservative Payout Ratio 6
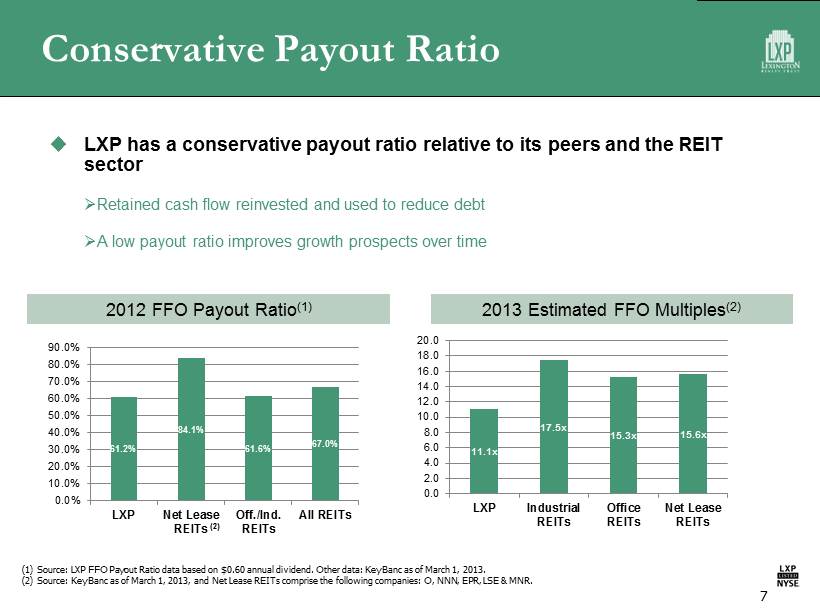
Conservative Payout Ratio LXP has a conservative payout ratio relative to its peers and the REIT sector » Retained cash flow reinvested and used to reduce debt » A low payout ratio improves growth prospects over time 7 (1) Source: LXP FFO Payout Ratio data based on $0.60 annual dividend. Other data: KeyBanc as of March 1, 2013. (2) Source: KeyBanc as of March 1, 2013, and Net Lease REITs comprise the following companies: O, NNN, EPR, LSE & MNR. 2013 Estimated FFO Multiples (2) 11.1x 17.5x 15.3x 15.6x 0.0 2.0 4.0 6.0 8.0 10.0 12.0 14.0 16.0 18.0 20.0 LXP Industrial REITs Office REITs Net Lease REITs 2012 FFO Payout Ratio (1) 61.2% 84.1% 61.6% 67.0% 0.0% 10.0% 20.0% 30.0% 40.0% 50.0% 60.0% 70.0% 80.0% 90.0% LXP Net Lease REITs Off./Ind. REITs All REITs (2)
Advantages of Net Lease Properties 8
Advantages of Net Lease Properties Predictable cash flow Operating expenses paid by the tenant High levels of occupancy Long - term leases A diversified portfolio of net - leased properties should trade at a premium to multi - tenant properties. 9

Diversified Portfolio 10
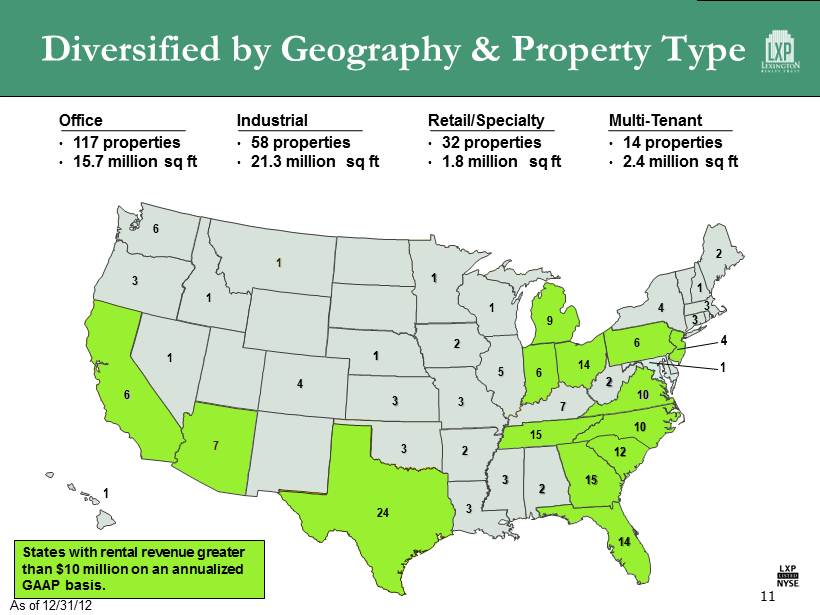
Diversified by Geography & Property Type 11 Office • 117 properties • 15.7 million sq ft Industrial • 58 properties • 21.3 million sq ft Retail/Specialty • 32 properties • 1.8 million sq ft Multi - Tenant • 14 properties • 2.4 million sq ft 24 1 6 7 1 1 3 2 3 3 1 1 3 6 2 3 5 14 14 15 2 1 10 6 9 3 7 15 6 10 12 2 2 4 3 3 1 1 4 1 States with rental revenue greater than $10 million on an annualized GAAP basis. As of 12/31/12 4
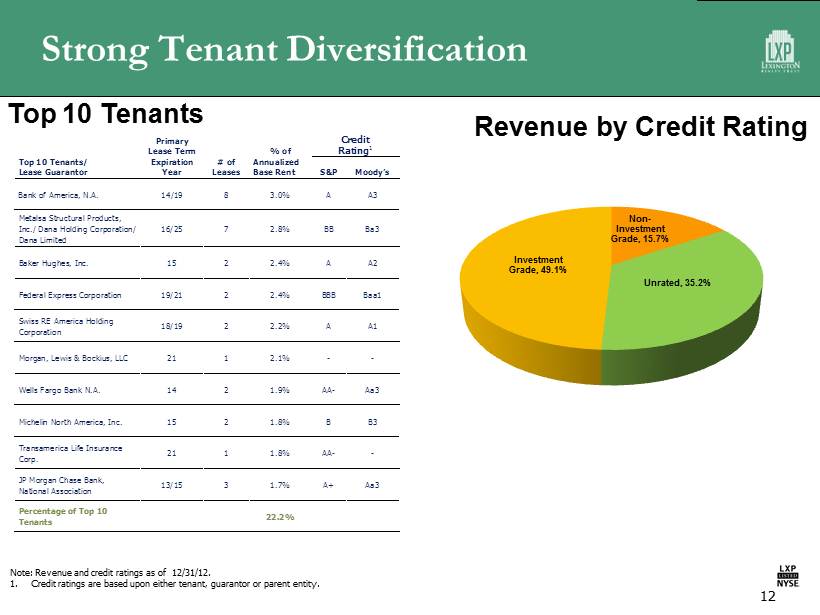
Strong Tenant Diversification 12 Primary Lease Term % of Credit Rating 1 Top 10 Tenants/ Lease Guarantor Expiration Year # of Leases Annualized Base Rent S&P Moody’s Bank of America, N.A. 14/19 8 3.0% A A3 Metalsa Structural Products, Inc./ Dana Holding Corporation/ Dana Limited 16/25 7 2.8% BB Ba3 Baker Hughes, Inc. 15 2 2.4% A A2 Federal Express Corporation 19/21 2 2.4% BBB Baa1 Swiss RE America Holding Corporation 18/19 2 2.2% A A1 Morgan, Lewis & Bockius, LLC 21 1 2.1% - - Wells Fargo Bank N.A. 14 2 1.9% AA- Aa3 Michelin North America, Inc. 15 2 1.8% B B3 Transamerica Life Insurance Corp. 21 1 1.8% AA- - JP Morgan Chase Bank, National Association 13/15 3 1.7% A+ Aa3 Percentage of Top 10 Tenants 22.2% Top 10 Tenants Revenue by Credit Rating Note: Revenue and credit ratings as of 12/31/12. 1. Credit ratings are based upon either tenant, guarantor or parent entity. Non - Investment Grade, 15.7% Unrated, 35.2% Investment Grade, 49.1%
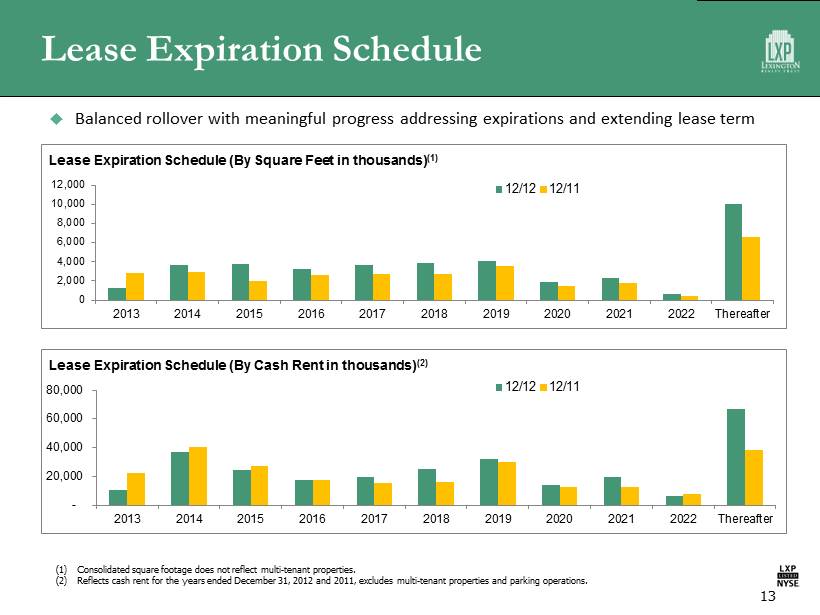
Lease Expiration Schedule 13 Balanced rollover with meaningful progress addressing expirations and extending lease term 0 2,000 4,000 6,000 8,000 10,000 12,000 2013 2014 2015 2016 2017 2018 2019 2020 2021 2022 Thereafter Lease Expiration Schedule (By Square Feet in thousands) (1) 12/12 12/11 - 20,000 40,000 60,000 80,000 2013 2014 2015 2016 2017 2018 2019 2020 2021 2022 Thereafter Lease Expiration Schedule (By Cash Rent in thousands) (2) 12/12 12/11 (1) Consolidated square footage does not reflect multi - tenant properties. (2) Reflects cash rent for the years ended December 31, 2012 and 2011, excludes multi - tenant properties and parking operations.
Active Asset Management & Capital Recycling 14
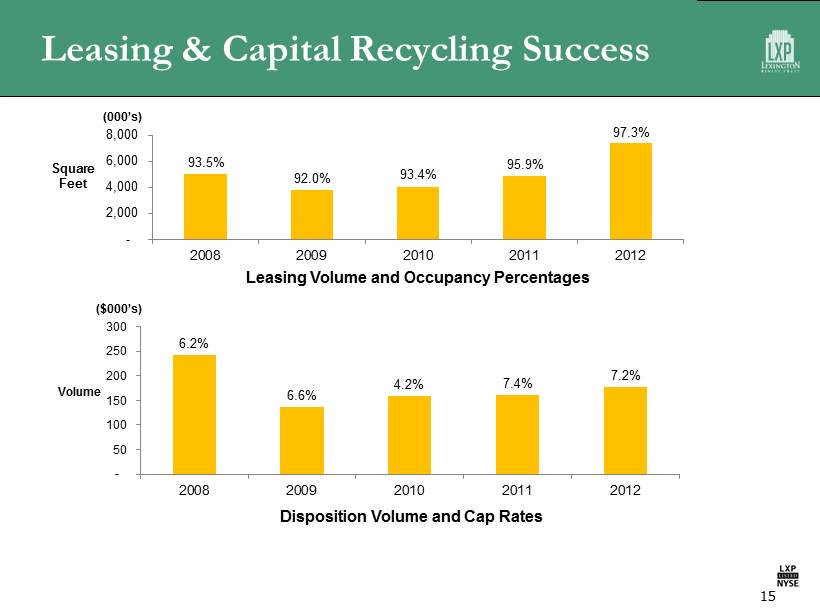
Leasing & Capital Recycling Success 15 93.5% 92.0% 93.4% 95.9% 97.3% - 2,000 4,000 6,000 8,000 2008 2009 2010 2011 2012 6.2% 6.6% 4.2% 7.4% 7.2% - 50 100 150 200 250 300 2008 2009 2010 2011 2012 Square Feet Leasing Volume and Occupancy Percentages Volume Disposition Volume and Cap Rates ($000’s) (000’s)

Attractive Growth Prospects 16
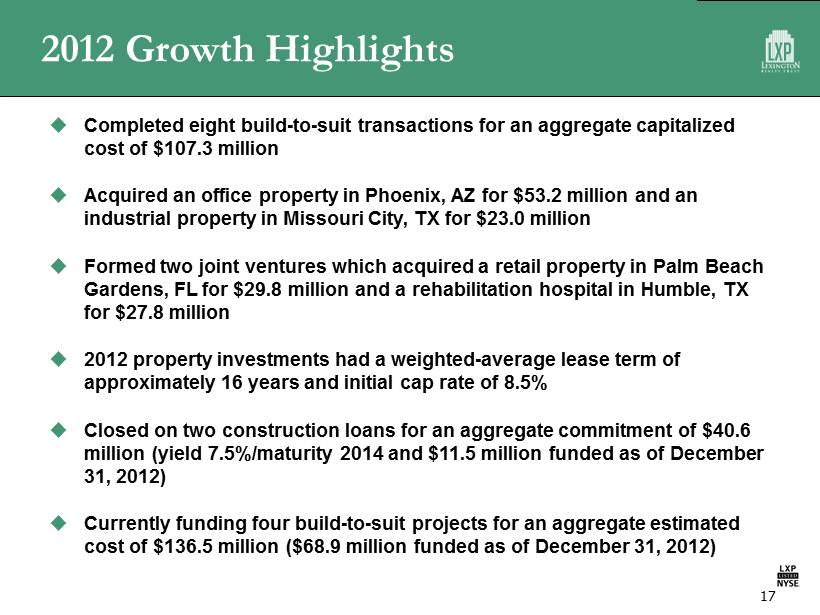
2012 Growth Highlights Completed eight build - to - suit transactions for an aggregate capitalized cost of $107.3 million Acquired an office property in Phoenix, AZ for $53.2 million and an industrial property in Missouri City, TX for $23.0 million Formed two joint ventures which acquired a retail property in Palm Beach Gardens, FL for $29.8 million and a rehabilitation hospital in Humble, TX for $27.8 million 2012 property investments had a weighted - average lease term of approximately 16 years and initial cap rate of 8.5% Closed on two construction loans for an aggregate commitment of $40.6 million (yield 7.5%/maturity 2014 and $11.5 million funded as of December 31, 2012) Currently funding four build - to - suit projects for an aggregate estimated cost of $136.5 million ($68.9 million funded as of December 31, 2012) 17
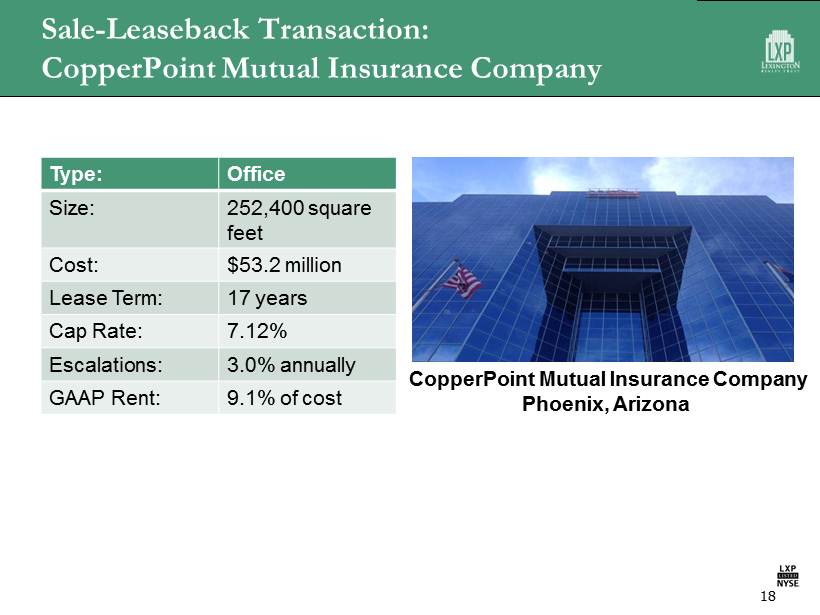
Sale - Leaseback Transaction: CopperPoint Mutual Insurance Company 18 Type: Office Size: 252,400 square feet Cost: $53.2 million Lease Term: 17 years Cap Rate: 7.12% Escalations: 3.0% annually GAAP Rent: 9.1% of cost CopperPoint Mutual Insurance Company Phoenix, Arizona
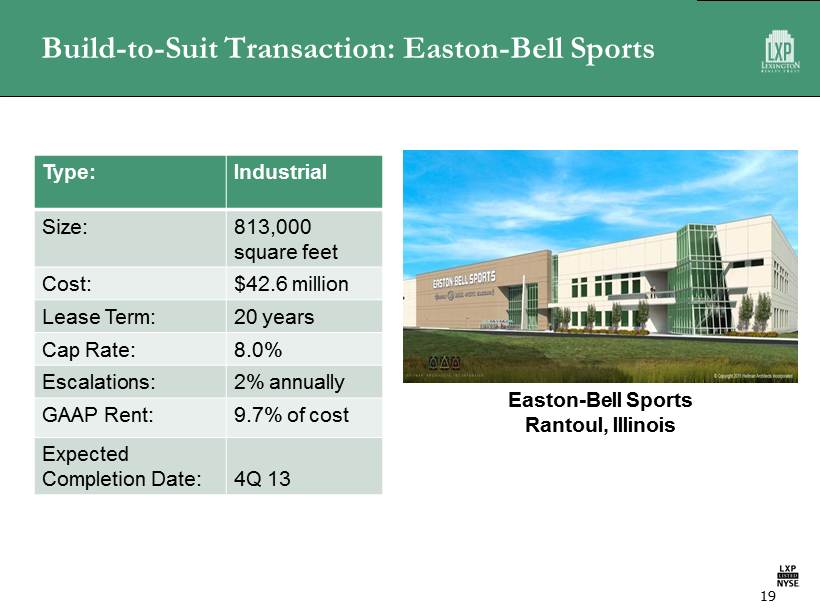
Build - to - Suit Transaction: Easton - Bell Sports Type: Industrial Size: 813,000 square feet Cost: $42.6 million Lease Term: 20 years Cap Rate: 8.0% Escalations: 2% annually GAAP Rent: 9.7% of cost Expected Completion Date: 4Q 13 19 Easton - Bell Sports Rantoul, Illinois
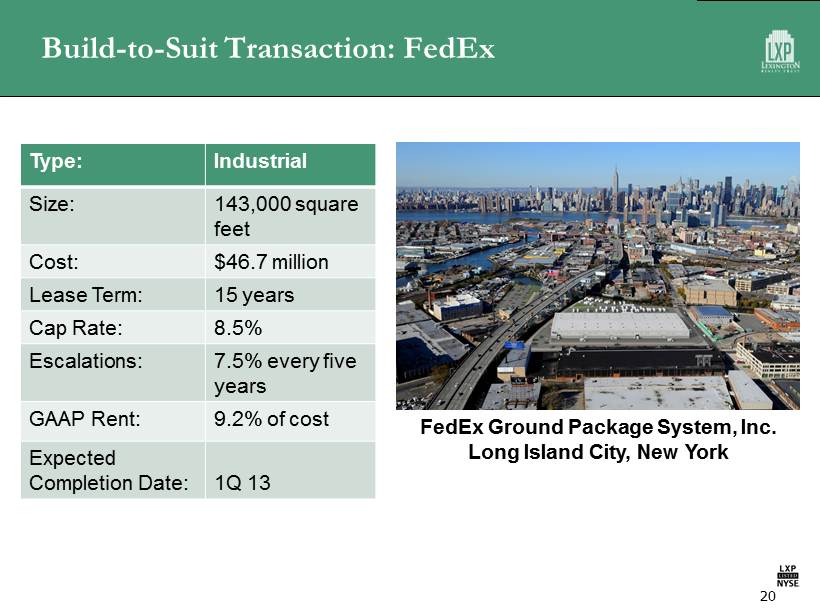
Build - to - Suit Transaction: FedEx Type: Industrial Size: 143,000 square feet Cost: $46.7 million Lease Term: 15 years Cap Rate: 8.5% Escalations: 7.5% every five years GAAP Rent: 9.2% of cost Expected Completion Date : 1Q 13 20 FedEx Ground Package System, Inc. Long Island City, New York
Strong Balance Sheet 21
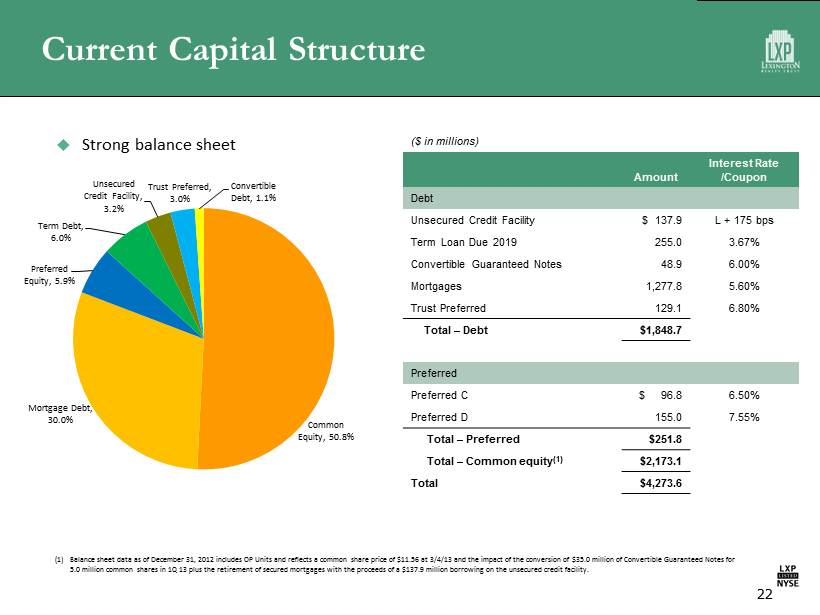
Current Capital Structure 22 (1) Balance sheet data as of December 31, 2012 includes OP Units and reflects a common share price of $11.56 at 3/4/13 and the im pac t of the conversion of $35.0 million of Convertible Guaranteed Notes for 5.0 million common shares in 1Q 13 plus the retirement of secured mortgages with the proceeds of a $137.9 million borrowing o n t he unsecured credit facility. Strong balance sheet ($ in millions) Amount Interest Rate /Coupon Debt Unsecured Credit Facility $ 137.9 L + 175 bps Term Loan Due 2019 255.0 3.67% Convertible Guaranteed Notes 48.9 6.00% Mortgages 1,277.8 5.60% Trust Preferred 129.1 6.80% Total – Debt $1,848.7 Preferred Preferred C $ 96.8 6.50% Preferred D 155.0 7.55% Total – Preferred $251.8 Total – Common equity ( 1 ) $2,173.1 Total $4,273.6 Common Equity, 50.8% Mortgage Debt, 30.0% Preferred Equity, 5.9% Term Debt, 6.0% Unsecured Credit Facility, 3.2% Trust Preferred, 3.0% Convertible Debt, 1.1%
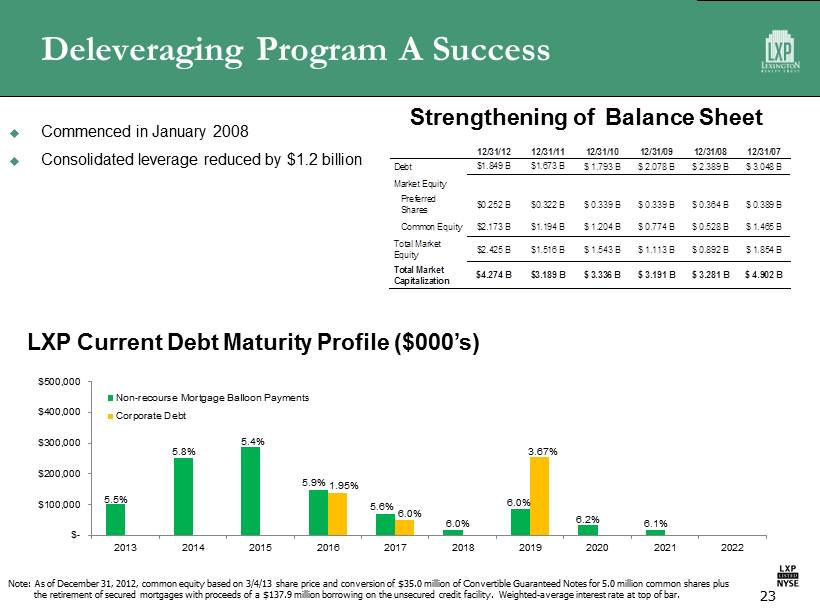
Deleveraging Program A Success 23 Commenced in January 2008 Consolidated leverage reduced by $ 1.2 billion 12/31/12 12/31/11 12/31/10 12/31/09 12/31/08 12/31/07 Debt $1.849 B $1.673 B $ 1.793 B $ 2.078 B $ 2.389 B $ 3.048 B Market Equity Preferred Shares $0.252 B $0.322 B $ 0.339 B $ 0.339 B $ 0.364 B $ 0.389 B Common Equity $2.173 B $1.194 B $ 1.204 B $ 0.774 B $ 0.528 B $ 1.465 B Total Market Equity $2.425 B $1.516 B $ 1.543 B $ 1.113 B $ 0.892 B $ 1.854 B Total Market Capitalization $4.274 B $3.189 B $ 3.336 B $ 3.191 B $ 3.281 B $ 4.902 B Strengthening of Balance Sheet LXP Current Debt Maturity Profile ($000’s) Note: As of December 31, 2012, common equity based on 3/4/13 share price and conversion of $35.0 million of Convertible Guarante ed Notes for 5.0 million common shares plus the retirement of secured mortgages with proceeds of a $137.9 million borrowing on the unsecured credit facility. Weighted - average interest rate at top of bar. $- $100,000 $200,000 $300,000 $400,000 $500,000 2013 2014 2015 2016 2017 2018 2019 2020 2021 2022 Non-recourse Mortgage Balloon Payments Corporate Debt 5.5% 5.8% 5.4% 5.6% 5.9% 6.0% 6.0% 6.0% 6.1% 6.2% 3.67% 1.95%
Refinancing Opportunity 24
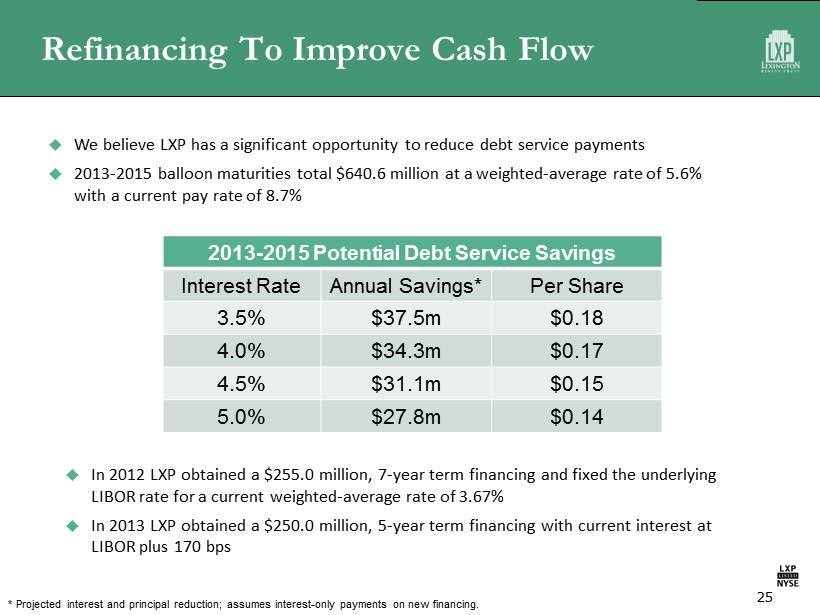
Refinancing To Improve Cash Flow 25 We believe LXP has a significant opportunity to reduce debt service payments 2013 - 2015 balloon maturities total $640.6 million at a weighted - average rate of 5.6% with a current pay rate of 8.7% 2013 - 2015 Potential Debt Service Savings Interest Rate Annual Savings* Per Share 3.5% $37.5m $0.18 4.0% $34.3m $0.17 4.5% $31.1m $0.15 5.0% $27.8m $0.14 In 2012 LXP obtained a $255.0 million, 7 - year term financing and fixed the underlying LIBOR rate for a current weighted - average rate of 3.67% In 2013 LXP obtained a $250.0 million, 5 - year term financing with current interest at LIBOR plus 170 bps * Projected interest and principal reduction; assumes interest - only payments on new financing.
Compelling Value Investment 26
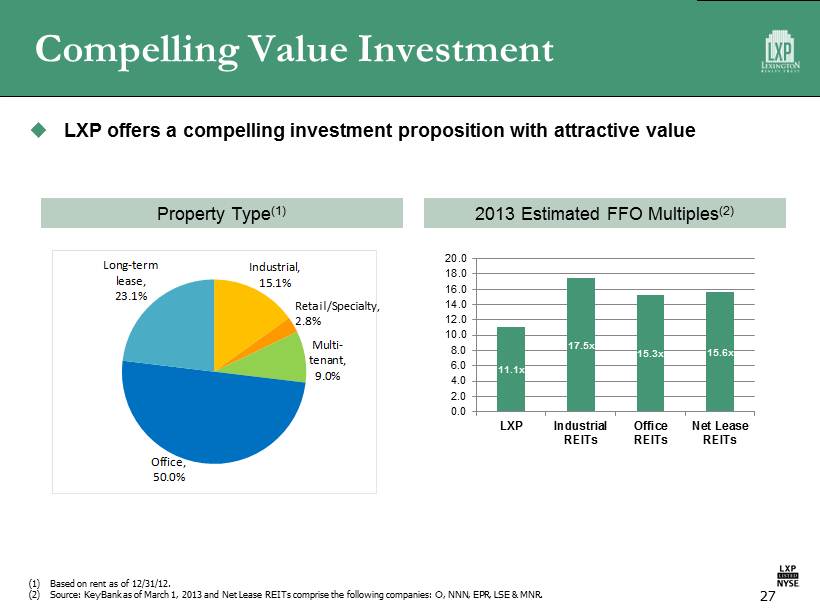
Compelling Value Investment LXP offers a compelling investment proposition with attractive value Property Type (1) Industrial, 15.1% Multi - tenant, 9.0% Office, 50.0% Long - term lease, 23.1% 27 (1) Based on rent as of 12/31/12. (2) Source: KeyBank as of March 1, 2013 and Net Lease REITs comprise the following companies: O, NNN, EPR, LSE & MNR. 2013 Estimated FFO Multiples (2) 11.1x 17.5x 15.3x 15.6x 0.0 2.0 4.0 6.0 8.0 10.0 12.0 14.0 16.0 18.0 20.0 LXP Industrial REITs Office REITs Net Lease REITs Retail/Specialty, 2.8%
Experienced Management 28
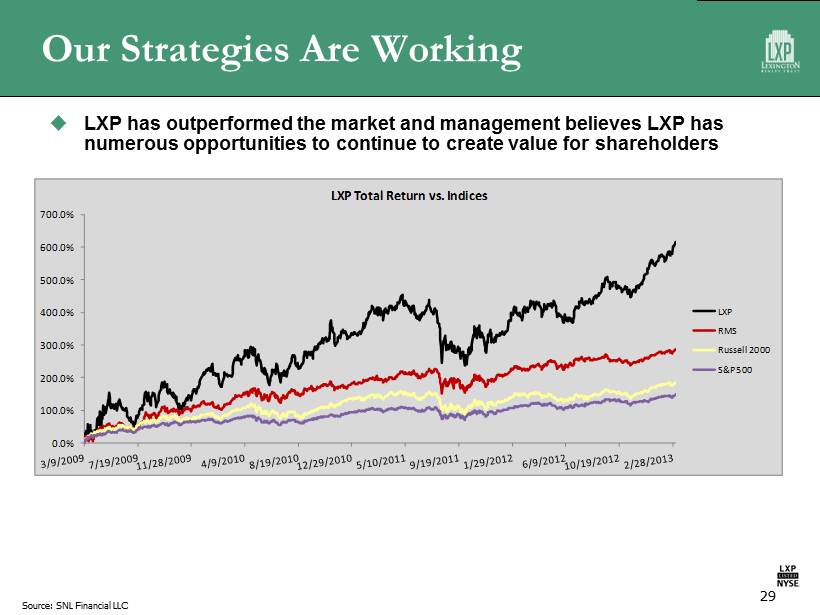
Our Strategies Are Working 29 LXP has outperformed the market and management believes LXP has numerous opportunities to continue to create value for shareholders Source: SNL Financial LLC 0.0% 100.0% 200.0% 300.0% 400.0% 500.0% 600.0% 700.0% LXP Total Return vs. Indices LXP RMS Russell 2000 S&P 500
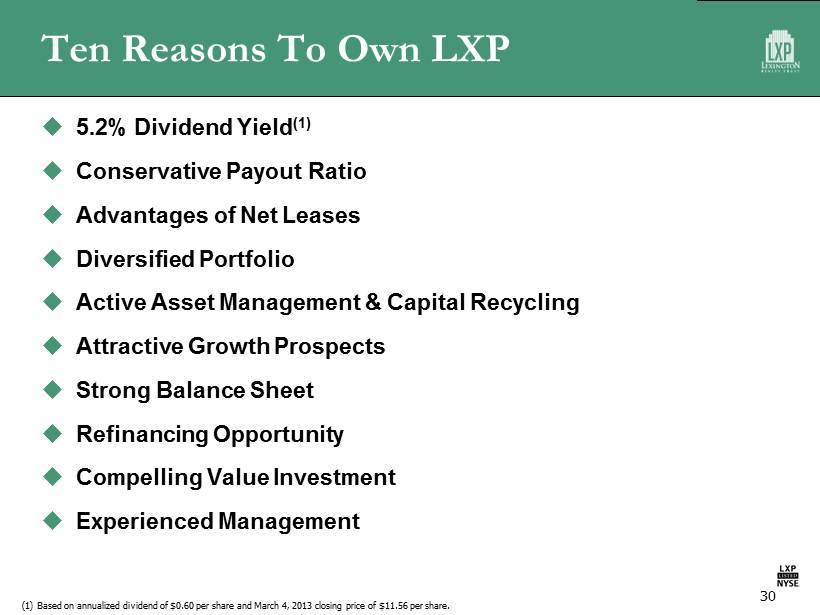
Ten Reasons To Own LXP 5.2% Dividend Yield (1) Conservative Payout Ratio Advantages of Net Leases Diversified Portfolio Active Asset Management & Capital Recycling Attractive Growth Prospects Strong Balance Sheet Refinancing Opportunity Compelling Value Investment Experienced Management 30 (1) Based on annualized dividend of $0.60 per share and March 4, 2013 closing price of $11.56 per share.
Winter 2013 LEXINGTON REALTY TRUST. A real estate investment trust specializing in single tenant commercial properties.