Exhibit 99.1
LEXINGTON REALTY TRUST
QUARTERLY SUPPLEMENTAL INFORMATION
September 30, 2018
Table of Contents
| Section | | Page |
| | | |
| Third Quarter 2018 Earnings Press Release | | 3 |
| | | |
| Portfolio Data | | |
| Investment / Capital Recycling Summary | | 14 |
| Financing Summary | | 15 |
| Leasing Summary | | 16 |
| Other Revenue Data | | 18 |
| Portfolio Detail by Asset Class | | 20 |
| Portfolio Composition | | 21 |
| Components of Net Asset Value | | 22 |
| Top Markets | | 23 |
| Single-Tenant Office Markets | | 24 |
| Tenant Industry Diversification | | 25 |
| Top 10 Tenants or Guarantors | | 26 |
| Lease Rollover Schedules – GAAP Basis | | 27 |
| Property Leases and Vacancies | | 29 |
| Select Credit Metrics Summary | | 37 |
| Financial Covenants | | 38 |
| Mortgages and Notes Payable | | 39 |
| Debt Maturity Schedule | | 41 |
| Selected Balance Sheet Account Data | | 42 |
| Non-GAAP Measures – Definitions | | 43 |
| Reconciliation of Non-GAAP Measures | | 45 |
| Investor Information | | 49 |
This Quarterly Earnings Press Release and Quarterly Supplemental Information contains certain forward-looking statements which involve known and unknown risks, uncertainties or other factors not under the control of Lexington Realty Trust (“Lexington”), which may cause actual results, performance or achievements of Lexington and its subsidiaries to be materially different from the results, performance, or other expectations implied by these forward-looking statements. Factors that could cause or contribute to such differences include, but are not limited to, those discussed under the headings “Management’s Discussion and Analysis of Financial Condition and Results of Operations” and “Risk Factors” in Lexington’s periodic reports filed with the Securities and Exchange Commission, including, but not limited to, risks related to: (1) the authorization of Lexington’s Board of Trustees of future dividend declarations, (2) Lexington’s ability to achieve its estimates of net income attributable to common shareholders and Adjusted Company FFO available to all equityholders and unitholders – diluted for the year ending December 31, 2018, (3) the successful consummation of any lease, acquisition, build-to-suit, disposition, financing or other transaction on the terms described herein or at all, (4) the failure to continue to qualify as a real estate investment trust, (5) changes in general business and economic conditions, including the impact of any new legislation, (6) competition, (7) increases in real estate construction costs, (8) changes in interest rates, (9) changes in accessibility of debt and equity capital markets, and (10) future impairment charges. Copies of the periodic reports Lexington files with the Securities and Exchange Commission are available on Lexington’s web site atwww.lxp.com. Forward-looking statements, which are based on certain assumptions and describe Lexington’s future plans, strategies and expectations, are generally identifiable by use of the words “believes,” “expects,” “intends,” “anticipates,” “estimates,” “projects,” may,” “plans,” “predicts,” “will,” “will likely result,” “is optimistic,” “goal,” “objective” or similar expressions. Except as required by law, Lexington undertakes no obligation to revise those forward-looking statements to reflect events or circumstances after the occurrence of unanticipated events. Accordingly, there is no assurance that Lexington’s expectations will be realized.
| | LEXINGTONREALTYTRUST |
| | TRADED: NYSE: LXP |
| | ONEPENNPLAZA, SUITE4015 |
| | NEWYORK, NY 10119-4015 |
FOR IMMEDIATE RELEASE
LEXINGTON REALTY TRUST REPORTS THIRD QUARTER 2018 RESULTS
New York, NY - November 6, 2018 - Lexington Realty Trust (“Lexington”) (NYSE:LXP), a real estate investment trust focused on single-tenant industrial real estate investments, today announced results for the third quarter ended September 30, 2018.
Third Quarter 2018 Highlights
| • | Generated Net Income attributable to common shareholders of $216.2 million, or $0.90 per diluted common share. |
| • | Generated Adjusted Company Funds From Operations available to all equityholders and unitholders - diluted (“Adjusted Company FFO”) of $58.2 million, or $0.24 per diluted common share. |
| • | Disposed of 21 office assets to a newly-formed joint venture for an aggregate gross disposition price of $725.8 million and acquired a 20% interest in the joint venture for an aggregate cost of $53.7 million. |
| • | Sold seven additional non-industrial properties for an aggregate gross sale price of $113.7 million. |
| • | Acquired three industrial properties for an aggregate cost of $71.1 million. |
| • | Repurchased and retired 945,880 common shares at an average price of $8.08 per share. |
| • | Repaid $195 million, net under its unsecured revolving credit facility and repaid $151 million of its 2020 term loan. |
| • | Completed 867,000 square feet of new leases and lease extensions with portfolio 96.8% leased at quarter end. |
Subsequent Events
| • | Repaid $149 million of remaining balance of its 2020 term loan. |
| • | Repurchased and retired 2,681,215 common shares at an average price of $8.06 per share and increased repurchase authorization by 10.0 million common shares. |
| • | Sold an office property for a gross sale price of $16.0 million. |
Adjusted Company FFO is a non-GAAP financial measure. It and certain other non-GAAP financial measures are defined and reconciled later in this press release. GAAP net income is different than taxable income.
T. Wilson Eglin, Chief Executive Officer and President of Lexington Realty Trust, commented, “Our repositioning efforts during the third quarter led to the successful disposition of $839 million of non-industrial assets, which included a $726 million office portfolio sold to a newly-formed joint venture. Disposition and reinvestment initiatives this year have increased industrial revenues to over 60% of our overall portfolio while significantly reducing our office exposure. During the quarter, we acquired $71 million of high-quality industrial assets, retired $346 million of corporate debt and repurchased and retired 0.9 million common shares. We are extremely pleased with our third quarter execution, and, as we look ahead, we remain committed to disposing of non-industrial assets so our portfolio consists of primarily single-tenant, net-leased industrial assets.”
FINANCIAL RESULTS
Revenues
For the quarter ended September 30, 2018, total gross revenues were $100.0 million, compared with total gross revenues of $97.7 million for the quarter ended September 30, 2017. The increase was primarily attributable to revenue generated from 2018 and 2017 property acquisitions and new leases, partially offset by property sales and lease expirations.
Net Income Attributable to Common Shareholders
For the quarter ended September 30, 2018, net income attributable to common shareholders was $216.2 million, or $0.90 per diluted share, compared with net income attributable to common shareholders for the quarter ended September 30, 2017 of $3.9 million, or $0.02 per diluted share. The change between periods relates primarily to the timing of gains on sales and impairments recognized on real estate, including the gains on sales of 21 office assets during the quarter ended September 30, 2018.
Adjusted Company FFO
For the quarter ended September 30, 2018, Lexington generated Adjusted Company FFO of $58.2 million, or $0.24 per diluted share, compared to Adjusted Company FFO for the quarter ended September 30, 2017 of $60.7 million, or $0.25 per diluted share.
Dividends/Distributions
As previously announced, during the third quarter of 2018, Lexington declared a regular quarterly common share/unit dividend/distribution for the quarter ended September 30, 2018 of $0.1775 per common share/unit, which was paid on October 15, 2018 to common shareholders/unitholders of record as of September 28, 2018. Lexington previously declared two cash dividends of $0.812 per share on its Series C Cumulative Convertible Preferred Stock (“Series C Preferred”) for the quarters ended September 30, 2018 and December 31, 2018 which are expected to be paid on November 15, 2018 and February 15, 2019, respectively, to Series C Preferred Shareholders of record as of October 31, 2018 and January 31, 2019, respectively.
TRANSACTION ACTIVITY
ACQUISITION TRANSACTIONS
| Primary Tenant | | Location | | Sq. Ft. | | | Property Type | | Initial Basis
($000) | | | Approximate
Lease Term
(Yrs) |
| Wal-Mart | | Spartanburg, SC | | | 341,660 | | | Industrial | | $ | 27,632 | | | 6 |
| UNIS | | Pasadena, TX | | | 257,835 | | | Industrial | | | 23,868 | | | 5 |
| Teasdale Foods | | Carrollton, TX | | | 356,855 | | | Industrial | | | 19,564 | | | 7 |
| | | | | | 956,350 | | | | | $ | 71,064 | | | |
The above were acquired at aggregate weighted-average GAAP and cash capitalization rates of 6.1% and 5.6%, respectively.
PROPERTY DISPOSITIONS
| Primary Tenant | | Location | | Property Type | | Gross
Disposition
Price
($000) | | | Annualized
Net Income(1)
($000) | | | Annualized
NOI(1)
($000) | | | Month of
Disposition | | %
Leased | |
| United HealthCare(2) | | San Antonio, TX | | Office | | $ | 27,650 | | | $ | 1,814 | | | $ | 2,149 | | | July | | | 100.0 | % |
| Kmart | | Galesburg, IL | | Other | | | 100 | | | | 294 | | | | 11 | | | July | | | 100.0 | % |
| Encompass Health | | Vineland, NJ | | Other | | | 20,200 | | | | 1,173 | | | | 1,176 | | | July | | | 100.0 | % |
| Gavilon Group | | Omaha, NE | | Office | | | 46,250 | | | | 3,309 | | | | 2,998 | | | August | | | 100.0 | % |
| K-VA-T Food Stores | | Chattanooga, TN | | Other | | | 1,100 | | | | 103 | | | | 130 | | | August | | | 100.0 | % |
| Nextel Communications | | Hampton, VA | | Office | | | 10,375 | | | | 548 | | | | 1,162 | | | August | | | 100.0 | % |
| Orange Business Services | | Herndon, VA | | Office | | | 8,000 | | | | 1,060 | | | | 1,867 | | | August | | | 100.0 | % |
| | | | | | | $ | 113,675 | | | $ | 8,301 | | | $ | 9,493 | | | | | | | |
JOINT VENTURE DISPOSITION - 21 PROPERTIES
| Primary Tenant | | Location | | Property Type | | Gross
Disposition
Price(1)
($000) | | | Annualized
Net Income(1)
($000) | | | Annualized
NOI(1)
($000) | | | Month of
Disposition | | %
Leased | |
| Various(3) | | Various | | Office | | $ | 725,800 | | | $ | 28,582 | | | $ | 58,967 | | | August | | | 98.6 | % |
| (1) | Quarterly period prior to sale; excluding impairment charges, annualized. |
| (2) | $3.2 million of the sale price placed into escrow to fund future tenant allowances. |
| (3) | Properties sold/contributed to newly-formed joint venture. Lexington acquired a 20% interest in the joint venture for $53.7 million. |
These dispositions resulted in aggregate gains on sales of $202.4 million.
LEASING
| | | LEASE EXTENSIONS | | | | | | | | | | | |
| | | | | | | | | | | | | | |
| | | Location | | | | Primary Tenant(1) | | Prior
Term | | Lease
Expiration Date | | Sq. Ft. | |
| | | Office | | | | | | | | | | | | |
| 1 | | Meridian | | ID | | T-Mobile | | 06/2019 | | 06/2026 | | | 77,484 | |
| 2 | | Rockaway(2) | | NJ | | Atlantic Health | | 12/2029 | | 12/2031 | | | 92,326 | |
| 3 | | Glendale | | AZ | | Honeywell | | 07/2019 | | 07/2024 | | | 252,300 | |
| 4 | | Columbus | | IN | | Cummins | | 07/2019 | | 07/2024 | | | 390,100 | |
| 4 | | Total office lease extensions | | | | | | | | | | | 812,210 | |
| | | NEW LEASES | | | | | | | | | | | |
| | | | | | | | | | | | | | |
| | | Location | | | | | | | | Lease
Expiration Date | | Sq. Ft. | |
| | | Office/Multi-Tenant | | | | | | | | | | | | |
| 1 | | Arlington | | TX | | N/A | | | | 10/2021 | | | 4,979 | |
| 2 | | Houston | | TX | | Pulte Homes | | | | 09/2027 | | | 20,978 | |
| 3 | | Phoenix | | AZ | | Valor IT | | | | 07/2025 | | | 28,710 | |
| 3 | | Total new office leases | | | | | | | | | | | 54,667 | |
| | | | | | | | | | | | | | | |
| 7 | | TOTAL NEW AND EXTENDED LEASES | | | | | | | | | | | 866,877 | |
| (1) | Leases greater than 10,000 square feet. |
| (2) | Property sold to newly-formed joint venture. |
As of September 30, 2018, Lexington's portfolio was 96.8% leased.
BALANCE SHEET/CAPITAL MARKETS
In the third quarter of 2018, Lexington repurchased and retired 945,880 common shares at an average price of $8.08 per share under its repurchase authorization announced on July 2, 2015 in the amount of 10.0 million common shares. As of September 30, 2018, there were approximately 4.7 million common shares remaining to be repurchased under the authorization. Subsequent to quarter end, Lexington repurchased and retired 2,681,215 common shares at an average price of $8.06 per share bringing the total common shares repurchased in 2018 to 4,552,870 at an average price of $8.04 per share. In addition, subsequent to quarter end, Lexington's Board of Trustees increased the amount of common shares available for repurchase by 10.0 million common shares. As a result, there are 12,046,218 common shares available for repurchase as of November 6, 2018.
Also, in the third quarter, Lexington repaid $195 million, net, under its unsecured revolving credit facility and ended the quarter with no amounts outstanding. In addition, Lexington repaid $151 million of the 2020 term loan and satisfied an aggregate of $110.1 million of non-recourse mortgage debt, including debt encumbering assets sold to the newly-formed joint venture.
2018 EARNINGS GUIDANCE
Lexington now estimates that its net income attributable to common shareholders per diluted common share for the year ended December 31, 2018 will be within an expected range of $0.90 to $0.92.
Additionally, Lexington now estimates that its Adjusted Company FFO for the year ended December 31, 2018 is expected to be within a range of $0.93 to $0.95 per diluted common share, which is an increase from its previous guidance of $0.92 to $0.94 per diluted common share. This guidance is forward looking, excludes the impact of certain items and is based on current expectations.
THIRD QUARTER 2018 CONFERENCE CALL
Lexington will host a conference call today, November 6, 2018, at 8:30 a.m. Eastern Time, to discuss its results for the quarter ended September 30, 2018. Interested parties may participate in this conference call by dialing 1-844-825-9783 (U.S.), 1-412-317-5163 (International) or 1-855-669-9657 (Canada). A replay of the call will be available through February 5, 2019, at 1-877-344-7529 (U.S.), 1-412-317-0088 (International) or 1-855-669-9658 (Canada), pin code for all replay numbers is 10125219. A link to a live webcast of the conference call is available atwww.lxp.com within the Investors section.
ABOUT LEXINGTON REALTY TRUST
Lexington Realty Trust (NYSE: LXP) is a publicly traded real estate investment trust (REIT) that owns a diversified portfolio of real estate assets consisting primarily of equity investments in single-tenant net-leased commercial properties across the United States. Lexington seeks to expand its industrial portfolio through build-to-suit transactions, sale-leaseback transactions and other transactions, including acquisitions. For more information, including Lexington's Quarterly Supplemental Information package, or to follow Lexington on social media, visitwww.lxp.com.
Contact:
Investor or Media Inquiries for Lexington Realty Trust:
Heather Gentry, Senior Vice President of Investor Relations
Lexington Realty Trust
Phone: (212) 692-7200 E-mail: hgentry@lxp.com
This release contains certain forward-looking statements which involve known and unknown risks, uncertainties or other factors not under Lexington's control which may cause actual results, performance or achievements of Lexington to be materially different from the results, performance, or other expectations implied by these forward-looking statements. Factors that could cause or contribute to such differences include, but are not limited to, those discussed under the headings “Management's Discussion and Analysis of Financial Condition and Results of Operations” and “Risk Factors” in Lexington's periodic reports filed with the Securities and Exchange Commission, including risks related to: (1) the authorization by Lexington's Board of Trustees of future dividend declarations, (2) Lexington's ability to achieve its estimates of net income attributable to common shareholders and Adjusted Company FFO for the year ending December 31, 2018, (3) the successful consummation of any lease, acquisition, build-to-suit, disposition, financing or other transaction, (4) the failure to continue to qualify as a real estate investment trust, (5) changes in general business and economic conditions, including the impact of any legislation, (6) competition, (7) increases in real estate construction costs, (8) changes in interest rates, (9) changes in accessibility of debt and equity capital markets, and (10) future impairment charges. Copies of the periodic reports Lexington files with the Securities and Exchange Commission are available on Lexington's web site atwww.lxp.com. Forward-looking statements, which are based on certain assumptions and describe Lexington's future plans, strategies and expectations, are generally identifiable by use of the words “believes,” “expects,” “intends,” “anticipates,” “estimates,” “projects”, “may,” “plans,” “predicts,” “will,” “will likely result,” “is optimistic,” “goal,” “objective” or similar expressions. Except as required by law, Lexington undertakes no obligation to publicly release the results of any revisions to those forward-looking statements which may be made to reflect events or circumstances after the occurrence of unanticipated events. Accordingly, there is no assurance that Lexington's expectations will be realized.
References to Lexington refer to Lexington Realty Trust and its consolidated subsidiaries. All interests in properties and loans are held, and all property operating activities are conducted, through special purpose entities, which are separate and distinct legal entities that maintain separate books and records, but in some instances are consolidated for financial statement purposes and/or disregarded for income tax purposes. The assets and credit of each special purpose entity with a property subject to a mortgage loan are not available to creditors to satisfy the debt and other obligations of any other person, including any other special purpose entity or affiliate. Consolidated entities that are not property owner subsidiaries do not directly own any of the assets of a property owner subsidiary (or the general partner, member of managing member of such property owner subsidiary), but merely hold partnership, membership or beneficial interests therein which interests are subordinate to the claims of the property owner subsidiary's (or its general partner's, member's or managing member's) creditors.
Non-GAAP Financial Measures - Definitions
Lexington has used non-GAAP financial measures as defined by the Securities and Exchange Commission Regulation G in this Quarterly Earnings Release and in other public disclosures.
Lexington believes that the measures defined below are helpful to investors in measuring our performance or that of an individual investment. Since these measures exclude certain items which are included in their respective most comparable measures under generally accepted accounting principles (“GAAP”), reliance on the measures has limitations; management compensates for these limitations by using the measures simply as supplemental measures that are weighed in balance with other GAAP measures. These measures are not necessarily indications of our cash flow available to fund cash needs. Additionally, they should not be used as an alternative to the respective most comparable GAAP measures when evaluating Lexington's financial performance or cash flow from operating, investing or financing activities or liquidity.
Cash Rent: Cash Rent is calculated by making adjustments to GAAP rent to remove the impact of GAAP required adjustments to rental income such as adjustments for straight-line rents relating to free rent periods and contractual rent increases. Cash Rent excludes lease termination income. Lexington believes Cash Rent provides a meaningful indication of an investment's ability to fund cash needs.
Company Funds Available for Distribution (“FAD”): FAD is calculated by making adjustments to Adjusted Company FFO (see below) for (1) straight-line adjustments, (2) lease incentive amortization, (3) amortization of above/below market leases, (4) lease termination payments, net, (5) non-cash interest, net, (6) non-cash charges, net, (7) cash paid for tenant improvements, and (8) cash paid for lease costs. Although FAD may not be comparable to that of other real estate investment trusts (“REITs”), Lexington believes it provides a meaningful indication of its ability to fund cash needs. FAD is a non-GAAP financial measure and should not be viewed as an alternative measurement of operating performance to net income, as an alternative to net cash flows from operating activities or as a measure of liquidity.
Funds from Operations (“FFO”) and Adjusted Company FFO: Lexington believes that Funds from Operations, or FFO, which is a non-GAAP measure, is a widely recognized and appropriate measure of the performance of an equity REIT. Lexington believes FFO is frequently used by securities analysts, investors and other interested parties in the evaluation of REITs, many of which present FFO when reporting their results. FFO is intended to exclude GAAP historical cost depreciation and amortization of real estate and related assets, which assumes that the value of real estate diminishes ratably over time. Historically, however, real estate values have risen or fallen with market conditions. As a result, FFO provides a performance measure that, when compared year over year, reflects the impact to operations from trends in occupancy rates, rental rates, operating costs, development activities, interest costs and other matters without the inclusion of depreciation and amortization, providing perspective that may not necessarily be apparent from net income.
The National Association of Real Estate Investment Trusts, or NAREIT, defines FFO as “net income (or loss) computed in accordance with GAAP, excluding gains (or losses) from sales of property, plus real estate depreciation and amortization and after adjustments for non-consolidated partnerships and joint ventures.” NAREIT clarified its computation of FFO to exclude impairment charges on depreciable real estate owned directly or indirectly. FFO does not represent cash generated from operating activities in accordance with GAAP and is not indicative of cash available to fund cash needs.
Lexington presents FFO available to common shareholders and unitholders - basic and also presents FFO available to all equityholders and unitholders - diluted on a company-wide basis as if all securities that are convertible, at the holder's option, into Lexington’s common shares, are converted at the beginning of the period. Lexington also presents Adjusted Company FFO available to all equityholders and unitholders - diluted which adjusts FFO available to all equityholders and unitholders - diluted for certain items which we believe are not indicative of the operating results of Lexington's real estate portfolio. Lexington believes this is an appropriate presentation as it is frequently requested by security analysts, investors and other interested parties. Since others do not calculate these measures in a similar fashion, these measures may not be comparable to similarly titled measures as reported by others. These measures should not be considered as an alternative to net income as an indicator of Lexington’s operating performance or as an alternative to cash flow as a measure of liquidity.
GAAP and Cash Yield or Capitalization Rate: GAAP and cash yields or capitalization rates are measures of operating performance used to evaluate the individual performance of an investment. These measures are estimates and are not presented or intended to be viewed as a liquidity or performance measure that present a numerical measure of Lexington's historical or future financial performance, financial position or cash flows. The yield or capitalization rate is calculated by dividing the annualized NOI (as defined below, except GAAP rent adjustments are added back to rental income to calculate GAAP yield or capitalization rate) the investment is expected to generate (or has generated) divided by the acquisition/completion cost (or sale) price.
Net Operating Income (“NOI”): NOI is a measure of operating performance used to evaluate the individual performance of an investment. This measure is not presented or intended to be viewed as a liquidity or performance measure that presents a numerical measure of Lexington's historical or future financial performance, financial position or cash flows. Lexington defines NOI as operating revenues (rental income (less GAAP rent adjustments and lease termination income), tenant reimbursements and other property income) less property operating expenses. Other REITs may use different methodologies for calculating NOI, and accordingly, Lexington's NOI may not be comparable to other companies. Because NOI excludes general and administrative expenses, interest expense, depreciation and amortization, acquisition-related expenses, other nonproperty income and losses, and gains and losses from property dispositions, it provides a performance measure that, when compared year over year, reflects the revenues and expenses directly associated with owning and operating commercial real estate and the impact to operations from trends in occupancy rates, rental rates, and operating costs, providing a perspective on operations not immediately apparent from net income. Lexington believes that net income is the most directly comparable GAAP measure to NOI.
# # #
LEXINGTON REALTY TRUST AND CONSOLIDATED SUBSIDIARIES
CONDENSED CONSOLIDATED STATEMENTS OF OPERATIONS
(Unaudited and in thousands, except share and per share data)
| | | Three months ended September 30, | | | Nine months ended September 30, | |
| | | 2018 | | | 2017 | | | 2018 | | | 2017 | |
| Gross revenues: | | | | | | | | | | | | | | | | |
| Rental | | $ | 91,815 | | | $ | 89,704 | | | $ | 283,986 | | | $ | 265,923 | |
| Tenant reimbursements | | | 8,143 | | | | 7,985 | | | | 24,102 | | | | 23,549 | |
| Total gross revenues | | | 99,958 | | | | 97,689 | | | | 308,088 | | | | 289,472 | |
| Expense applicable to revenues: | | | | | | | | | | | | | | | | |
| Depreciation and amortization | | | (37,716 | ) | | | (43,495 | ) | | | (129,693 | ) | | | (128,706 | ) |
| Property operating | | | (10,678 | ) | | | (11,694 | ) | | | (33,061 | ) | | | (36,784 | ) |
| General and administrative | | | (7,482 | ) | | | (7,963 | ) | | | (23,899 | ) | | | (25,561 | ) |
| Litigation reserve | | | — | | | | (2,050 | ) | | | — | | | | (2,050 | ) |
| Non-operating income | | | 766 | | | | 1,005 | | | | 1,666 | | | | 4,997 | |
| Interest and amortization expense | | | (21,159 | ) | | | (18,887 | ) | | | (63,224 | ) | | | (57,828 | ) |
| Debt satisfaction gains (charges), net | | | (2,228 | ) | | | 2,424 | | | | (2,228 | ) | | | 2,378 | |
| Impairment charges and loan loss | | | (2,542 | ) | | | (21,986 | ) | | | (90,860 | ) | | | (43,577 | ) |
| Gains on sales of properties | | | 202,371 | | | | 10,645 | | | | 239,577 | | | | 55,078 | |
| Income before provision for income taxes and equity in earnings (losses) of non-consolidated entities | | | 221,290 | | | | 5,688 | | | | 206,366 | | | | 57,419 | |
| Provision for income taxes | | | (444 | ) | | | (375 | ) | | | (1,326 | ) | | | (1,174 | ) |
| Equity in earnings (losses) of non-consolidated entities | | | 4 | | | | 283 | | | | 192 | | | | (1,064 | ) |
| Net income | | | 220,850 | | | | 5,596 | | | | 205,232 | | | | 55,181 | |
| Less net income attributable to noncontrolling interests | | | (2,834 | ) | | | (55 | ) | | | (3,225 | ) | | | (448 | ) |
| Net income attributable to Lexington Realty Trust shareholders | | | 218,016 | | | | 5,541 | | | | 202,007 | | | | 54,733 | |
| Dividends attributable to preferred shares – Series C | | | (1,573 | ) | | | (1,573 | ) | | | (4,718 | ) | | | (4,718 | ) |
| Allocation to participating securities | | | (253 | ) | | | (52 | ) | | | (279 | ) | | | (183 | ) |
| Net income attributable to common shareholders | | $ | 216,190 | | | $ | 3,916 | | | $ | 197,010 | | | $ | 49,832 | |
| | | | | | | | | | | | | | | | | |
| Net income attributable to common shareholders - per common share basic | | $ | 0.91 | | | $ | 0.02 | | | $ | 0.83 | | | $ | 0.21 | |
| Weighted-average common shares outstanding – basic | | | 237,354,669 | | | | 237,989,098 | | | | 237,577,198 | | | | 237,632,572 | |
| | | | | | | | | | | | | | | | | |
| Net income attributable to common shareholders - per common share diluted | | $ | 0.90 | | | $ | 0.02 | | | $ | 0.83 | | | $ | 0.21 | |
| Weighted-average common shares outstanding – diluted | | | 246,058,298 | | | | 241,702,715 | | | | 241,660,588 | | | | 241,442,227 | |
LEXINGTON REALTY TRUST AND CONSOLIDATED SUBSIDIARIES
CONDENSED CONSOLIDATED BALANCE SHEETS
(Unaudited and in thousands, except share and per share data)
| | | September 30, 2018 | | | December 31, 2017 | |
| Assets: | | | | | | | | |
| Real estate, at cost | | $ | 3,005,959 | | | $ | 3,936,459 | |
| Real estate - intangible assets | | | 418,268 | | | | 599,091 | |
| | | | 3,424,227 | | | | 4,535,550 | |
| Less: accumulated depreciation and amortization | | | 934,096 | | | | 1,225,650 | |
| Real estate, net | | | 2,490,131 | | | | 3,309,900 | |
| Assets held for sale | | | 134,744 | | | | 2,827 | |
| Cash and cash equivalents | | | 128,444 | | | | 107,762 | |
| Restricted cash | | | 263,543 | | | | 4,394 | |
| Investment in and advances to non-consolidated entities | | | 70,879 | | | | 17,476 | |
| Deferred expenses, net | | | 15,211 | | | | 31,693 | |
| Rent receivable – current | | | 3,584 | | | | 5,450 | |
| Rent receivable – deferred | | | 54,551 | | | | 52,769 | |
| Other assets | | | 10,853 | | | | 20,749 | |
| Total assets | | $ | 3,171,940 | | | $ | 3,553,020 | |
| | | | | | | | | |
| Liabilities and Equity: | | | | | | | | |
| Liabilities: | | | | | | | | |
| Mortgages and notes payable, net | | $ | 585,369 | | | $ | 689,810 | |
| Revolving credit facility borrowings | | | — | | | | 160,000 | |
| Term loans payable, net | | | 447,099 | | | | 596,663 | |
| Senior notes payable, net | | | 495,825 | | | | 495,198 | |
| Trust preferred securities, net | | | 127,271 | | | | 127,196 | |
| Dividends payable | | | 48,384 | | | | 49,504 | |
| Liabilities held for sale | | | 1,446 | | | | — | |
| Accounts payable and other liabilities | | | 29,239 | | | | 38,644 | |
| Accrued interest payable | | | 10,234 | | | | 5,378 | |
| Deferred revenue - including below market leases, net | | | 19,163 | | | | 33,182 | |
| Prepaid rent | | | 10,909 | | | | 16,610 | |
| Total liabilities | | | 1,774,939 | | | | 2,212,185 | |
| | | | | | | | | |
| Commitments and contingencies | | | | | | | | |
| Equity: | | | | | | | | |
| Preferred shares, par value $0.0001 per share; authorized 100,000,000 shares: | | | | | | | | |
| Series C Cumulative Convertible Preferred, liquidation preference $96,770; 1,935,400 shares issued and outstanding | | | 94,016 | | | | 94,016 | |
| Common shares, par value $0.0001 per share; authorized 400,000,000 shares, 238,946,145 and 240,689,081 shares issued and outstanding in 2018 and 2017, respectively | | | 24 | | | | 24 | |
| Additional paid-in-capital | | | 2,803,581 | | | | 2,818,520 | |
| Accumulated distributions in excess of net income | | | (1,518,669 | ) | | | (1,589,724 | ) |
| Accumulated other comprehensive income | | | 652 | | | | 1,065 | |
| Total shareholders’ equity | | | 1,379,604 | | | | 1,323,901 | |
| Noncontrolling interests | | | 17,397 | | | | 16,934 | |
| Total equity | | | 1,397,001 | | | | 1,340,835 | |
| Total liabilities and equity | | $ | 3,171,940 | | | $ | 3,553,020 | |
LEXINGTON REALTY TRUST AND CONSOLIDATED SUBSIDIARIES
EARNINGS PER SHARE
(Unaudited and in thousands, except share and per share data)
| | | Three Months Ended | | | Nine Months Ended | |
| | | September 30, | | | September 30, | |
| | | 2018 | | | 2017 | | | 2018 | | | 2017 | |
| EARNINGS PER SHARE: | | | | | | | | | | | | |
| | | | | | | | | | | | | |
| Basic: | | | | | | | | | | | | | | | | |
| Net income attributable to common shareholders | | $ | 216,190 | | | $ | 3,916 | | | $ | 197,010 | | | $ | 49,832 | |
| | | | | | | | | | | | | | | | | |
| Weighted-average number of common shares outstanding - basic | | | 237,354,669 | | | | 237,989,098 | | | | 237,577,198 | | | | 237,632,572 | |
| | | | | | | | | | | | | | | | | |
| Net income attributable to common shareholders - per common share basic | | $ | 0.91 | | | $ | 0.02 | | | $ | 0.83 | | | $ | 0.21 | |
| | | | | | | | | | | | | | | | | |
| Diluted: | | | | | | | | | | | | | | | | |
| Net income attributable to common shareholders - basic | | $ | 216,190 | | | $ | 3,916 | | | $ | 197,010 | | | $ | 49,832 | |
| Impact of assumed conversions | | | 4,159 | | | | (173 | ) | | | 2,505 | | | | (192 | ) |
| Net income attributable to common shareholders | | $ | 220,349 | | | $ | 3,743 | | | $ | 199,515 | | | $ | 49,640 | |
| | | | | | | | | | | | | | | | | |
| Weighted-average common shares outstanding - basic | | | 237,354,669 | | | | 237,989,098 | | | | 237,577,198 | | | | 237,632,572 | |
| Effect of dilutive securities: | | | | | | | | | | | | | | | | |
| Unvested share-based payment awards and options | | | 382,956 | | | | 66,748 | | | | 463,922 | | | | 95,788 | |
| Preferred shares - Series C | | | 4,710,570 | | | | — | | | | — | | | | — | |
| Operating partnership units | | | 3,610,103 | | | | 3,646,869 | | | | 3,619,468 | | | | 3,713,867 | |
| Weighted-average common shares outstanding - diluted | | | 246,058,298 | | | | 241,702,715 | | | | 241,660,588 | | | | 241,442,227 | |
| | | | | | | | | | | | | | | | | |
| Net income attributable to common shareholders - per common share diluted | | $ | 0.90 | | | $ | 0.02 | | | $ | 0.83 | | | $ | 0.21 | |
LEXINGTON REALTY TRUST AND CONSOLIDATED SUBSIDIARIES
ADJUSTED COMPANY FUNDS FROM OPERATIONS & COMPANY FUNDS AVAILABLE FOR DISTRIBUTION
(Unaudited and in thousands, except share and per share data)
| | | Three Months Ended | | | Nine Months Ended | |
| | | September 30, | | | September 30, | |
| | | 2018 | | | 2017 | | | 2018 | | | 2017 | |
| FUNDS FROM OPERATIONS: | | | | | | | | | | | | | | | | |
| Basic and Diluted: | | | | | | | | | | | | | | | | |
| Net income attributable to common shareholders | | $ | 216,190 | | | $ | 3,916 | | | $ | 197,010 | | | $ | 49,832 | |
| Adjustments: | | | | | | | | | | | | | | | | |
| Depreciation and amortization | | | 37,063 | | | | 42,015 | | | | 126,442 | | | | 124,633 | |
| Impairment charges - real estate, including non-consolidated entities | | | 2,542 | | | | 21,986 | | | | 90,860 | | | | 41,795 | |
| Noncontrolling interests - OP units | | | 2,586 | | | | (173 | ) | | | 2,506 | | | | (192 | ) |
| Amortization of leasing commissions | | | 653 | | | | 1,480 | | | | 3,251 | | | | 4,073 | |
| Joint venture and noncontrolling interest adjustment | | | 980 | | | | 259 | | | | 1,496 | | | | 864 | |
| Gains on sales of properties, including non-consolidated entities and net of tax | | | (202,242 | ) | | | (10,645 | ) | | | (239,448 | ) | | | (56,530 | ) |
| FFO available to common shareholders and unitholders - basic | | | 57,772 | | | | 58,838 | | | | 182,117 | | | | 164,475 | |
| Preferred dividends | | | 1,573 | | | | 1,573 | | | | 4,718 | | | | 4,718 | |
| Amount allocated to participating securities | | | 253 | | | | 52 | | | | 279 | | | | 183 | |
| FFO available to all equityholders and unitholders - diluted | | | 59,598 | | | | 60,463 | | | | 187,114 | | | | 169,376 | |
| Litigation reserve | | | — | | | | 2,050 | | | | — | | | | 2,050 | |
| Debt satisfaction charges, net | | | 2,228 | | | | (2,424 | ) | | | 2,228 | | | | (2,378 | ) |
| Loan loss | | | — | | | | — | | | | — | | | | 5,294 | |
| Other(1) | | | (3,613 | ) | | | 612 | | | | (6,733 | ) | | | 1,100 | |
| Adjusted Company FFO available to all equityholders and unitholders - diluted | | | 58,213 | | | | 60,701 | | | | 182,609 | | | | 175,442 | |
| | | | | | | | | | | | | | | | | |
| FUNDS AVAILABLE FOR DISTRIBUTION: | | | | | | | | | | | | | | | | |
| Adjustments: | | | | | | | | | | | | | | | | |
| Straight-line adjustments | | | (5,367 | ) | | | (4,002 | ) | | | (16,246 | ) | | | (12,552 | ) |
| Lease incentives | | | 404 | | | | 515 | | | | 1,459 | | | | 1,456 | |
| Amortization of above/below market leases | | | 89 | | | | 320 | | | | 313 | | | | 1,180 | |
| Lease termination payments, net | | | (308 | ) | | | (142 | ) | | | (925 | ) | | | (437 | ) |
| Non-cash interest, net | | | 1,031 | | | | 795 | | | | 3,355 | | | | 1,447 | |
| Non-cash charges, net | | | 1,635 | | | | 2,066 | | | | 5,199 | | | | 6,199 | |
| Tenant improvements | | | (69 | ) | | | (4,072 | ) | | | (6,663 | ) | | | (10,067 | ) |
| Lease costs | | | (1,273 | ) | | | (2,228 | ) | | | (3,074 | ) | | | (5,284 | ) |
| Company Funds Available for Distribution | | $ | 54,355 | | | $ | 53,953 | | | $ | 166,027 | | | $ | 157,384 | |
| | | | | | | | | | | | | | | | | |
| Per Common Share and Unit Amounts | | | | | | | | | | | | | | | | |
| Basic: | | | | | | | | | | | | | | | | |
| FFO | | $ | 0.24 | | | $ | 0.24 | | | $ | 0.76 | | | $ | 0.68 | |
| | | | | | | | | | | | | | | | | |
| Diluted: | | | | | | | | | | | | | | | | |
| FFO | | $ | 0.24 | | | $ | 0.24 | | | $ | 0.76 | | | $ | 0.69 | |
| Adjusted Company FFO | | $ | 0.24 | | | $ | 0.25 | | | $ | 0.74 | | | $ | 0.71 | |
| | | | | | | | | | | | | | | | | |
| Basic: | | | | | | | | | | | | | | | | |
| Weighted-average common shares outstanding - basic EPS | | | 237,354,669 | | | | 237,989,098 | | | | 237,577,198 | | | | 237,632,572 | |
| Operating partnership units(2) | | | 3,610,103 | | | | 3,646,869 | | | | 3,619,468 | | | | 3,713,867 | |
| Weighted-average common shares outstanding - basic FFO | | | 240,964,772 | | | | 241,635,967 | | | | 241,196,666 | | | | 241,346,439 | |
| | | | | | | | | | | | | | | | | |
| Diluted: | | | | | | | | | | | | | | | | |
| Weighted-average common shares outstanding - diluted EPS | | | 246,058,298 | | | | 241,702,715 | | | | 241,660,588 | | | | 241,442,227 | |
| Unvested share-based payment awards and options | | | — | | | | 655,228 | | | | — | | | | 650,348 | |
| Preferred shares - Series C | | | — | | | | 4,710,570 | | | | 4,710,570 | | | | 4,710,570 | |
| Weighted-average common shares outstanding - diluted FFO | | | 246,058,298 | | | | 247,068,513 | | | | 246,371,158 | | | | 246,803,145 | |
| (1) | "Other" primarily consisted of the acceleration of below-market lease intangible accretion in 2018 and transaction related costs in 2017. |
| (2) | Includes OP units other than OP units held by Lexington. |
LEXINGTON REALTY TRUST AND CONSOLIDATED SUBSIDIARIES
RECONCILIATION OF NON-GAAP MEASURES
2018 EARNINGS GUIDANCE
| | | Twelve Months Ended
December 31, 2018 | |
| | | Range | |
| Estimated: | | | | | | |
| Net income attributable to common shareholders per diluted common share(1) | | $ | 0.90 | | | $ | 0.92 | |
| Depreciation and amortization | | | 0.69 | | | | 0.69 | |
| Impact of capital transactions | | | (0.66 | ) | | | (0.66 | ) |
| Estimated Adjusted Company FFO per diluted common share | | $ | 0.93 | | | $ | 0.95 | |
| (1) | Assumes all convertible securities are dilutive. |
LEXINGTON REALTY TRUST
2018 Third Quarter Investment / Capital Recycling Summary
PROPERTY INVESTMENTS
| | | Primary Tenant | | Location | | Square Feet (Approx.) | | | Property Type | | Initial Basis ($000) | | | Month Closed | | Primary
Lease
Expiration | |
| 1 | | Wal-Mart | | Spartanburg | | SC | | | 342,000 | | | Industrial | | $ | 27,632 | | | August | | 07/2024 | |
| 2 | | UNIS | | Pasadena | | TX | | | 258,000 | | | Industrial | | | 23,868 | | | August | | 08/2023 | |
| 3 | | Teasdale Foods | | Carrollton | | TX | | | 357,000 | | | Industrial | | | 19,564 | | | September | | 03/2025 | |
| | | | | | | | | | | | | | | | | | | | | | |
| | | | | | | | | | | | | | | | | | | | | | |
| 3 | | TOTAL PROPERTY INVESTMENTS | | | | | | 957,000 | | | | | $ | 71,064 | | | | | | |
CAPITAL RECYCLING
PROPERTY DISPOSITIONS
| | | Primary Tenant | | Location | | Property Type | | Gross
Disposition Price
($000) | | | Annualized Net
Income ($000)(1) | | | Annualized
NOI
($000)(1)(2) | | | Month of
Disposition | | % Leased | | Gross
Disposition
Price PSF | |
| 1 | | United HealthCare(3) | | San Antonio | | TX | | Office | | $ | 27,650 | | | $ | 1,814 | | | $ | 2,149 | | | July | | 100 | % | | $ | 194.04 | |
| 2 | | Kmart | | Galesburg | | IL | | Other | | | 100 | | | | 294 | | | | 11 | | | July | | 100 | % | | | 1.05 | |
| 3 | | Encompass Health | | Vineland | | NJ | | Other | | | 20,200 | | | | 1,173 | | | | 1,176 | | | July | | 100 | % | | | 514.16 | |
| 4 | | Gavilon Group | | Omaha | | NE | | Office | | | 46,250 | | | | 3,309 | | | | 2,998 | | | August | | 100 | % | | | 361.87 | |
| 5 | | K-VA-T Food Stores | | Chattanooga | | TN | | Other | | | 1,100 | | | | 103 | | | | 130 | | | August | | 100 | % | | | 26.11 | |
| 6 | | Nextel Communications | | Hampton | | VA | | Office | | | 10,375 | | | | 548 | | | | 1,162 | | | August | | 100 | % | | | 103.10 | |
| 7 | | Orange Business Services | | Herndon | | VA | | Office | | | 8,000 | | | | 1,060 | | | | 1,867 | | | August | | 100 | % | | | 60.32 | |
| | | | | | | | | | | | | | | | | | | | | | | | | | | | | | |
| 7 | | TOTAL PROPERTY DISPOSITIONS | | $ | 113,675 | | | $ | 8,301 | | | $ | 9,493 | | | | | | | | | | |
JOINT VENTURE DISPOSITION - 21 PROPERTIES
| | | Primary Tenant | | Location | | Property Type | | Gross
Disposition Price
($000) | | | Annualized Net
Income ($000)(1) | | | Annualized
NOI
($000)(1)(2) | | | Month of
Disposition | | % Leased | | Gross
Disposition
Price PSF | |
| | | Various(4) | | Various | | | | Office | | $ | 725,800 | | | $ | 28,582 | | | $ | 58,967 | | | August | | 98.6 | % | | $ | 189.83 | |
Footnotes
| (1) | Quarterly period prior to sale; excluding impairment charges, annualized. |
| (2) | See definitions of non-GAAP measures and reconciliations to applicable GAAP measures in this document. |
| (3) | $3.2 million of the sale price placed into escrow to fund potential future tenant allowances. |
| (4) | Properties sold/contributed to newly-formed joint venture. Lexington acquired a 20% interest in the joint venture for $53.7 million. |
LEXINGTON REALTY TRUST
2018 Third Quarter Financing Summary
DEBT RETIRED
| Location | | Primary Tenant | | Property Type | | Face /
Satisfaction
($000) | | | Fixed Rate | | Maturity
Date |
| Consolidated Mortgage Debt: | | | | | | | | | | | |
| Erwin, NY | | Corning | | Industrial | | $ | 6,708 | | | 5.910% | | 10/2018 |
| Charlotte, NC(1) | | AvidXchange | | Office | | | 37,400 | | | 5.298% | | 01/2033 |
| Charlotte, NC(1) | | AvidXchange | | Office | | | 8,500 | | | 5.000% | | 12/2022 |
| Richmond, VA(1) | | McGuireWoods | | Office | | | 57,500 | | | 5.191% | | 02/2031 |
| | | | | | | | | | | | | |
| | | | | | | $ | 110,108 | | | | | |
| CORPORATE LEVEL FINANCING | | | | | | |
| | | Quarterly Activity, Net
($000) | | Rate | | Maturity Date |
| Revolving Credit Facility | | $ 195,000 satisfaction | | LIBOR plus 100 bps | | 08/2019 |
| 2020 Term Loan | | $ 151,000 satisfaction | | LIBOR plus 110 bps | | 08/2020 |
Footnotes
| (1) | Assumed by newly-formed joint venture. |
LEXINGTON REALTY TRUST
2018 Third Quarter Leasing Summary
LEASE EXTENSIONS
| | | | Tenant(3) | | Location | | | Prior
Term | | Lease
Expiration
Date | | Sq. Ft. | | | New GAAP
Rent Per
Annum
($000)(1) | | | Prior
GAAP
Rent Per
Annum
($000) | | | New Cash
Rent Per
Annum
($000)(1)(2) | | | Prior
Cash Rent
Per
Annum
($000)(2) | |
| | | | | | | | | | | | | | | | | | | | | | | | | | | | | |
| | | | Office | | | | | | | | | | | | | | | | | | | | | | | | | | | | | | | | |
| | | | | | | | | | | | | | | | | | | | | | | | | | | | | | | | | | | | |
| 1 | | | T-Mobile | | | Meridian | | | | ID | | | 06/2019 | | 06/2026 | | | 77,484 | | | $ | 1,439 | | | $ | 1,105 | | | $ | 1,356 | | | $ | 1,510 | |
| 2 | | | Atlantic Health (4) | | | Rockaway | | | | NJ | | | 12/2029 | | 12/2031 | | | 92,326 | | | | 1,345 | | | | 1,345 | | | | 1,562 | | | | 1,562 | |
| 3 | | | Honeywell | | | Glendale | | | | AZ | | | 07/2019 | | 07/2024 | | | 252,300 | | | | 2,099 | | | | 1,902 | | | | 2,054 | | | | 2,014 | |
| 4 | | | Cummins | | | Columbus | | | | IN | | | 07/2019 | | 07/2024 | | | 390,100 | | | | 4,868 | | | | 4,540 | | | | 4,925 | | | | 4,762 | |
| | | | | | | | | | | | | | | | | | | | | | | | | | | | | | | | | | | | |
| 4 | | | Total office lease extensions | | | | | | | | | | | | | | | 812,210 | | | $ | 9,751 | | | $ | 8,892 | | | $ | 9,897 | | | $ | 9,848 | |
| | | | | | | | | | | | | | | | | | | | | | | | | | | | | | | | | | | | |
| | | | | | | | | | | | | | ` | | | | | | | | | | | | | | | | | | | | | | |
| 4 | | | TOTAL EXTENDED LEASES | | | | | | | | | | | | | | | 812,210 | | | $ | 9,751 | | | $ | 8,892 | | | $ | 9,897 | | | $ | 9,848 | |
NEW LEASES
| | | Tenant(3) | | Location | | | Lease
Expiration
Date | | Sq. Ft. | | | New GAAP
Rent Per
Annum
($000)(1) | | | New Cash
Rent Per
Annum
($000)(1)(2) | |
| | | Office / Multi-tenant Office | | | | | | | | | | | | | | | | | | | | | | |
| 1 | | N/A | | | Arlington | | | | TX | | | 10/2021 | | | 4,979 | | | $ | 85 | | | $ | 85 | |
| 2 | | Pulte Homes | | | Houston | | | | TX | | | 09/2027 | | | 20,978 | | | | 257 | | | | 280 | |
| 3 | | Valor IT | | | Phoenix | | | | AZ | | | 07/2025 | | | 28,710 | | | | 536 | | | | 577 | |
| | | | | | | | | | | | | | | | | | | | | | | | | |
| 3 | | Total office new leases | | | | | | | | | | | | | 54,667 | | | $ | 878 | | | $ | 942 | |
| | | | | | | | | | | | | | | | | | | | | | | | | |
| 3 | | TOTAL NEW LEASES | | | | | | | | | | | | | 54,667 | | | $ | 878 | | | $ | 942 | |
| | | | | | | | | | | | | | | | | | | | | | | | | |
| 7 | | TOTAL NEW AND EXTENDED LEASES | | | | | | | | | | | | | 866,877 | | | $ | 10,629 | | | $ | 10,839 | |
LEXINGTON REALTY TRUST
2018 Third Quarter Leasing Summary (Continued)
NEW VACANCY(5)
| Tenant | | Location | | | Lease
Expiration
Date | | Sq. Ft. | | | 2017
GAAP
Rent
($000) | | | 2017
Cash Rent
($000)(2) | |
| Industrial | | | | | | | | | | | | | | | | | |
| Plastic Omnium | | Duncan | | | | SC | | | 09/2018 | | | 221,833 | | | $ | 1,025 | | | $ | 1,025 | |
Footnotes
| (1) | Assumes twelve months rent from the later of 10/1/18 or lease commencement/extension, excluding free rent periods as applicable. |
| (2) | See definitions of non-GAAP measures and reconciliations to applicable GAAP measures in this document. |
| (3) | Leases greater than 10,000 square feet. |
| (4) | Property sold to newly-formed joint venture. |
| (5) | Excludes multi-tenant properties and non-consolidated investments. |
LEXINGTON REALTY TRUST
Other Revenue Data
9/30/2018
($000)
Other Revenue Data
| | | GAAP Rent | |
| Asset Class | | Nine months ended | |
| | | 9/30/18(1)(4) | | | 9/30/18
Percentage | | | 9/30/17
Percentage | |
| Industrial | | $ | 135,999 | | | | 60.7 | % | | | 41.9 | % |
| Office | | | 75,661 | | | | 33.7 | % | | | 53.0 | % |
| Other | | | | | | | | | | | | |
| Multi-tenant | | | 8,370 | | | | 3.7 | % | | | 2.8 | % |
| Retail | | | 2,203 | | | | 1.0 | % | | | 1.2 | % |
| Specialty | | | 2,023 | | | | 0.9 | % | | | 1.1 | % |
| | | $ | 224,256 | | | | 100.0 | % | | | 100.0 | % |
| | | GAAP Rent | |
| Credit Ratings(2) | | Nine months ended | |
| | | 9/30/18(1)(4) | | | 9/30/18
Percentage | | | 9/30/17
Percentage | |
| Investment Grade | | $ | 100,263 | | | | 44.7 | % | | | 39.4 | % |
| Non-Investment Grade | | | 39,728 | | | | 17.7 | % | | | 15.9 | % |
| Unrated | | | 84,265 | | | | 37.6 | % | | | 44.7 | % |
| | | $ | 224,256 | | | | 100.0 | % | | | 100.0 | % |
| Weighted-Average Lease Term - Cash Basis | | | As of 9/30/18 | | | | As of 9/30/17 | |
| | | | 8.5 years | | | | 9.1 years | |
Rent Estimates for Current Assets
| Year | | GAAP(3)(4) | | | Cash(3) | | | Difference | |
| 2018 - remaining | | $ | 75,736 | | | $ | 71,174 | | | $ | (4,562 | ) |
| 2019 | | | 283,843 | | | | 272,504 | | | | (11,339 | ) |
Footnotes
| (1) | Nine months ended 9/30/2018 GAAP rent, excluding termination income, recognized for consolidated properties owned as of 9/30/2018. |
| (2) | Credit ratings are based upon either tenant, guarantor or parent. Generally, multi-tenant assets are included in unrated. |
| (3) | Amounts assume (1) lease terms for non-cancellable periods only, (2) no new or renegotiated leases are entered into after 9/30/2018, and (3) no properties are sold or acquired after 9/30/2018. |
| (4) | Excludes the acceleration of below-market lease intangible accretion on three Kmart assets. |
LEXINGTON REALTY TRUST
Other Revenue Data (Continued)
9/30/2018
($000)
Same-Store NOI(1)
| | | Nine months ended September 30, | |
| | | 2018 | | | 2017 | |
| Total Cash Rent | | $ | 182,008 | | | $ | 181,482 | |
| Tenant Reimbursements | | | 12,611 | | | | 10,848 | |
| Property Operating Expenses | | | (20,891 | ) | | | (19,366 | ) |
| Same-Store NOI | | $ | 173,728 | | | $ | 172,964 | |
| | | | | | | | | |
| Change in Same-Store NOI | | | 0.4 | % | | | | |
| Same-Store Percent Leased(2) | | As of 9/30/18 | | | As of 9/30/17 | |
| | | | 95.6 | % | | | 98.5 | % |
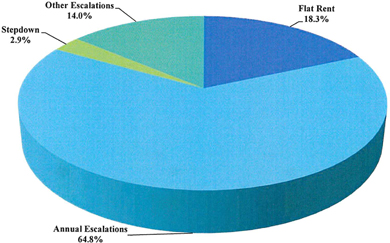
Lease Escalation Data(3)
Footnotes
| (1) | NOI is on a consolidated cash basis for all consolidated properties except properties acquired and sold in 2018 and 2017. See definitions of non-GAAP measures and reconciliations to applicable GAAP measures in this document. |
| (2) | Excludes properties acquired or sold in 2018 and 2017. |
| (3) | Based on nine months consolidated cash rents for single-tenant leases (properties greater than 70% leased) owned as of September 30, 2018. Excludes parking operations and rents from prior tenants. |
LEXINGTON REALTY TRUST
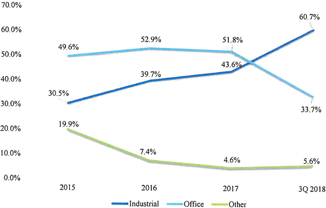
Portfolio Detail By Asset Class
9/30/2018
($000, except square footage)
| Asset Class | | YE 2015 | | | YE 2016 | | | YE 2017 | | | Q3 2018 | |
| | | | | | | | | | | | | |
| Industrial | | | | | | | | | | | | | | | | |
| % of ABR(1) | | | 30.5 | % | | | 39.7 | % | | | 43.6 | % | | | 60.7 | % |
| LTL(5) | | | 47.4 | % | | | 50.8 | % | | | 47.1 | % | | | 41.6 | % |
| STL(6) | | | 52.6 | % | | | 49.2 | % | | | 52.9 | % | | | 58.4 | % |
| Leased | | | 99.6 | % | | | 99.9 | % | | | 99.9 | % | | | 99.9 | % |
| Wtd. Avg. Lease Term(2) | | | 10.1 | | | | 10.4 | | | | 10.6 | | | | 9.8 | |
| Mortgage Debt | | $ | 292,293 | | | $ | 240,790 | | | $ | 193,529 | | | $ | 207,787 | |
| % Investment Grade(1) | | | 27.9 | % | | | 26.2 | % | | | 28.9 | % | | | 36.2 | % |
| Square Feet | | | 25,693,585 | | | | 27,476,653 | | | | 35,396,894 | | | | 38,196,782 | |
| | | | | | | | | | | | | | | | | |
| Office | | | | | | | | | | | | | | | | |
| % of ABR(1) | | | 49.6 | % | | | 52.9 | % | | | 51.8 | % | | | 33.7 | % |
| LTL(5) | | | 23.2 | % | | | 26.9 | % | | | 30.1 | % | | | 21.4 | % |
| STL(6) | | | 76.8 | % | | | 73.1 | % | | | 69.9 | % | | | 78.6 | % |
| Leased | | | 99.6 | % | | | 99.6 | % | | | 99.2 | % | | | 99.4 | % |
| Wtd. Avg. Lease Term(2) | | | 7.2 | | | | 7.2 | | | | 7.7 | | | | 5.9 | |
| Mortgage Debt | | $ | 329,696 | | | $ | 490,948 | | | $ | 495,842 | | | $ | 375,942 | |
| % Investment Grade(1) | | | 48.0 | % | | | 48.1 | % | | | 52.0 | % | | | 65.1 | % |
| Square Feet | | | 12,847,877 | | | | 11,569,940 | | | | 10,881,264 | | | | 5,886,614 | |
| | | | | | | | | | | | | | | | | |
| Other | | | | | | | | | | | | | | | | |
| % of ABR(1)(7) | | | 19.9 | % | | | 7.4 | % | | | 4.6 | % | | | 5.6 | % |
| LTL(5) | | | 74.7 | % | | | 20.9 | % | | | 26.1 | % | | | 19.0 | % |
| STL(6) | | | 25.3 | % | | | 79.1 | % | | | 73.9 | % | | | 81.0 | % |
| Leased | | | 64.7 | % | | | 60.5 | % | | | 81.8 | % | | | 53.1 | % |
| Wtd. Avg. Lease Term(2)(3) | | | 15.3 | | | | 9.5 | | | | 10.1 | | | | 10.6 | |
| Mortgage Debt | | $ | 269,336 | | | $ | 13,435 | | | $ | 7,697 | | | $ | 6,906 | |
| % Investment Grade(1) | | | 8.4 | % | | | 16.0 | % | | | 12.9 | % | | | 14.2 | % |
| Square Feet | | | 3,728,561 | | | | 4,277,704 | | | | 2,335,904 | | | | 3,100,018 | |
| | | | | | | | | | | | | | | | | |
| Loans Receivable | | $ | 95,871 | | | $ | 94,210 | | | $ | - | | | $ | - | |
| Construction in progress(4) | | $ | 103,954 | | | $ | 111,771 | | | $ | 4,219 | | | $ | 1,212 | |
Footnotes
| (1) | Percentage of GAAP rent, excluding termination income, for consolidated properties owned as of each respective period. |
| (3) | Cash basis adjusted to reflect NY land leases to the first purchase option date, as applicable. |
| (4) | Includes development classified as real estate under construction on a consolidated basis. |
| (5) | Long-term leases ("LTL") are defined as leases having a remaining term of ten years or longer. |
| (6) | Short-term leases ("STL") are defined as leases having a remaining term of less than ten years. |
| (7) | Excludes the acceleration of below-market lease intangible accretion on three Kmart assets in Q3 2018. |
LEXINGTON REALTY TRUST
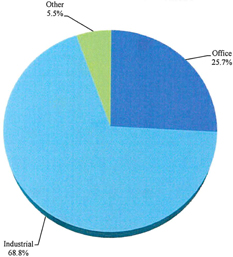
Portfolio Composition
9/30/2018
As a Percent of Gross Book Value(1)
Portfolio Composition(2) (3)
Footnotes
| (1) | Based on gross book value of real estate assets and real estate under construction as of 9/30/2018; excludes held for sale assets. |
| (2) | Based on respective period GAAP rent, excluding termination income. |
| (3) | Excludes the acceleration of below-market lease intangible accretion on three Kmart assets in Q3 2018. |
LEXINGTON REALTY TRUST
Components of Net Asset Value
9/30/2018
($000)
The purpose of providing the following information is to enable readers to derive their own estimates of net asset value. This information is not intended to be an asset-by-asset or enterprise valuation.
| Consolidated properties nine month net operating income (NOI)(1) | | | |
| Industrial | | $ | 121,180 | |
| Office | | | 63,994 | |
| Other | | | | |
| Multi-Tenant | | | 2,188 | |
| Specialty | | | 1,629 | |
| Retail | | | 478 | |
| Total Net Operating Income | | $ | 189,469 | |
| | | | | |
| Lexington's share of non-consolidated nine month NOI(1) | | | | |
| NNN-OFFICE JV | | | | |
| Office | | $ | 845 | |
| OTHER JV | | | | |
| Office | | $ | 323 | |
| Other | | | 1,363 | |
| | | $ | 1,686 | |
| Other income | | | | |
| Advisory fees | | $ | 701 | |
| | | | | |
| | | | | |
| In service assets not fairly valued by capitalized NOI method(1) | | | | |
| Wholly-owned assets acquired in 2018 | | $ | 204,554 | |
| Wholly-owned assets less than 70% leased | | $ | 41,292 | |
| | | | | |
| Add other assets: | | | | |
| Assets held for sale | | $ | 134,744 | |
| Construction in progress | | | 1,212 | |
| Developable land | | | 6,357 | |
| Cash and cash equivalents | | | 128,444 | |
| Restricted cash | | | 263,543 | |
| Accounts receivable, net | | | 3,584 | |
| Other assets | | | 10,853 | |
| Total other assets | | $ | 548,737 | |
| | | | | |
| Liabilities: | | | | |
| Corporate level debt (face amount) | | $ | 1,078,120 | |
| Mortgages and notes payable (face amount) | | | 590,635 | |
| Dividends payable | | | 48,384 | |
| Liabilities held for sale | | | 1,446 | |
| Accounts payable, accrued expenses and other liabilities | | | 50,382 | |
| Preferred stock, at liquidation value | | | 96,770 | |
| Lexington's share of non-consolidated mortgages | | | 110,430 | |
| Total deductions | | $ | 1,976,167 | |
| | | | | |
| Common shares & OP units at 9/30/2018 | | | 242,556,248 | |
Footnotes
| (1) | NOI for the existing property portfolio at September 30, 2018, excludes NOI related to assets undervalued by a capitalized NOI method and assets held for sale. Assets undervalued by a capitalized NOI method are identified generally by occupancies under 70% and assets acquired in 2018. For assets in this category an NOI capitalization approach is not appropriate, and accordingly, Lexington's net book value has been used. See definitions of non-GAAP measures and reconciliations to applicable GAAP measures in this document. |
LEXINGTON REALTY TRUST
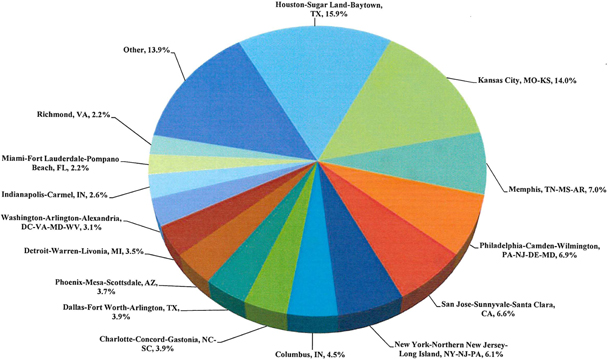
Top Markets
9/30/2018
| | | Core Based Statistical Area(2) | | Percent of
GAAP Rent as of
9/30/18(1)(4) | |
| 1 | | Houston-Sugar Land-Baytown, TX | | | 10.1 | % |
| 2 | | Memphis, TN-MS-AR | | | 7.5 | % |
| 3 | | Kansas City, MO-KS | | | 5.1 | % |
| 4 | | Detroit-Warren-Livonia, MI | | | 4.6 | % |
| 5 | | Kennewick-Pasco-Richland, WA | | | 4.4 | % |
| 6 | | New York-Northern New Jersey-Long Island, NY-NJ-PA | | | 3.8 | % |
| 7 | | Nashville-Davidson-Murfreesboro-Franklin, TN | | | 3.2 | % |
| 8 | | Dallas-Fort Worth-Arlington, TX | | | 2.9 | % |
| 9 | | Philadelphia-Camden-Wilmington, PA-NJ-DE-MD | | | 2.7 | % |
| 10 | | Atlanta-Sandy Springs-Marietta, GA | | | 2.3 | % |
| 11 | | San Jose-Sunnyvale-Santa Clara, CA | | | 2.2 | % |
| 12 | | Jackson, MS | | | 2.1 | % |
| 13 | | Indianapolis-Carmel, IN | | | 1.6 | % |
| 14 | | Phoenix-Mesa-Scottsdale, AZ | | | 1.6 | % |
| 15 | | Columbus, IN | | | 1.5 | % |
| 16 | | Greenville-Anderson-Mauldin, SC | | | 1.5 | % |
| 17 | | Champaign-Urbana, IL | | | 1.4 | % |
| 18 | | Columbus, OH | | | 1.3 | % |
| 19 | | Charlotte-Concord-Gastonia, NC-SC | | | 1.3 | % |
| 20 | | Jackson, TN | | | 1.3 | % |
| | | Total Top Markets(3) | | | 62.7 | % |
Footnotes
| (1) | Nine months ended 9/30/2018 GAAP rent, excluding termination income, recognized for consolidated properties owned as of 9/30/2018. |
| (2) | A Core Based Statistical Area is the official term for a functional region based around an urban center of at least 10,000 people, based on standards published by the Office of Management and Budget (OMB) in 2000. These standards are used to replace the definitions of metropolitan areas that were defined in 1990. |
| (3) | Total shown may differ from detailed amounts due to rounding. |
| (4) | Excludes the acceleration of below-market lease intangible accretion on three Kmart assets. |
LEXINGTON REALTY TRUST
Single-Tenant Office Markets(1)(2)
9/30/2018
Footnotes
| (1) | Nine months ended 9/30/2018 GAAP rent, excluding termination income, recognized for consolidated single-tenant office properties owned as of 9/30/2018. |
| (2) | A Core Based Statistical Area is the official term for a functional region based around an urban center of at least 10,000 people, based on standards published by the Office of Management and Budget (OMB) in 2000. These standards are used to replace the definitions of metropolitan areas that were defined in 1990. |
LEXINGTON REALTY TRUST
Tenant Industry Diversification(1)(2)
9/30/2018
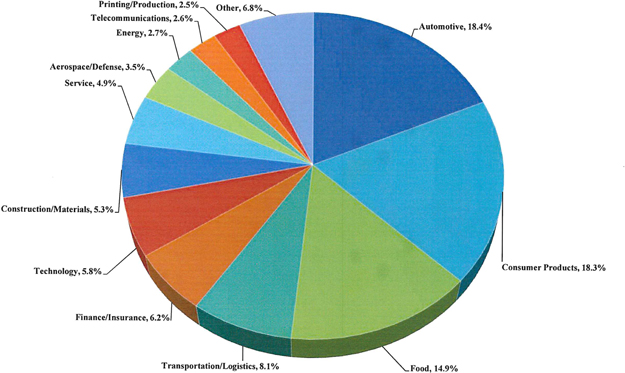
Footnotes
| (1) | Nine months ended 9/30/2018 GAAP rent, excluding termination income, recognized for consolidated properties owned as of 9/30/2018. |
| (2) | Excludes the acceleration of below-market lease intangible accretion on three Kmart assets. |
LEXINGTON REALTY TRUST
Top 10 Tenants or Guarantors
9/30/2018
Top 10 Tenants or Guarantors - GAAP Basis
| Tenants or Guarantors | | Number of
Leases | | | Sq. Ft.
Leased | | | Sq. Ft.
Leased as a
Percent of
Consolidated
Portfolio(2) | | | GAAP
Rent as of
9/30/2018
($000)(1)(4) | | | Percent of
GAAP Rent as
of 9/30/2018
($000)(1) (2) (4) | |
| The Dow Chemical Company | | | 1 | | | | 664,100 | | | | 1.4 | % | | $ | 11,137 | | | | 5.0 | % |
| Preferred Freezer Services of Richland, LLC (Preferred Freezer Services, LLC & Preferred Freezer Services Operating, LLC) | | | 1 | | | | 456,412 | | | | 1.0 | % | | | 9,850 | | | | 4.4 | % |
| Nissan North America, Inc. | | | 2 | | | | 2,971,000 | | | | 6.3 | % | | | 9,620 | | | | 4.3 | % |
| FedEx Corporation / Federal Express Corporation | | | 2 | | | | 661,616 | | | | 1.4 | % | | | 9,111 | | | | 4.1 | % |
| Metalsa Structural Products, Inc. / Dana Structural Products, LLC (Dana Holding Corporation and Dana Limited) | | | 7 | | | | 2,053,359 | | | | 4.4 | % | | | 7,456 | | | | 3.3 | % |
| Swiss Re America Holding Corporation / Westport Insurance Corporation / Swiss Re Management (US) Corporation | | | 2 | | | | 476,123 | | | | 1.0 | % | | | 6,080 | | | | 2.7 | % |
| United States of America | | | 2 | | | | 329,229 | | | | 0.7 | % | | | 6,028 | | | | 2.7 | % |
| Undisclosed(3) | | | 3 | | | | 1,090,383 | | | | 2.3 | % | | | 5,355 | | | | 2.4 | % |
| Watco Dock & Rail III, L.L.C. (Watco Companies, L.L.C.) | | | 1 | | | | 132,449 | | | | 0.3 | % | | | 5,080 | | | | 2.3 | % |
| Xerox Corporation | | | 1 | | | | 202,000 | | | | 0.4 | % | | | 4,981 | | | | 2.2 | % |
| | | | 22 | | | | 9,036,671 | | | | 19.2 | % | | $ | 74,698 | | | | 33.3 | % |
Footnotes
| (1) | Nine months ended 9/30/2018 GAAP rent, excluding termination income, recognized for consolidated properties owned as of 9/30/2018. |
| (2) | Total shown may differ from detailed amounts due to rounding. |
| (3) | Tenant is a domestic subsidiary of an international automaker. |
| (4) | Excludes the acceleration of below-market lease intangible accretion on three Kmart assets. |
LEXINGTON REALTY TRUST
Lease Rollover Schedule - Consolidated Single-Tenant Properties GAAP Basis
9/30/2018
($000)
| Year | | Number
of
Leases
Expiring | | | GAAP
Rent as of
9/30/2018 | | | Percent of
GAAP Rent
as of
9/30/2018 | | | Percent of
GAAP Rent
as of
9/30/2017 | |
| 2018 - remaining | | | 4 | | | $ | 5,814 | | | | 2.7 | % | | | 3.4 | % |
| 2019 | | | 15 | | | | 18,255 | | | | 8.5 | % | | | 9.3 | % |
| 2020 | | | 12 | | | | 13,254 | | | | 6.2 | % | | | 5.2 | % |
| 2021 | | | 14 | | | | 17,539 | | | | 8.2 | % | | | 6.4 | % |
| 2022 | | | 4 | | | | 4,655 | | | | 2.2 | % | | | 3.8 | % |
| 2023 | | | 9 | | | | 7,332 | | | | 3.4 | % | | | 4.0 | % |
| 2024 | | | 16 | | | | 18,867 | | | | 8.8 | % | | | 5.7 | % |
| 2025 | | | 12 | | | | 10,622 | | | | 5.0 | % | | | 9.2 | % |
| 2026 | | | 9 | | | | 10,543 | | | | 4.9 | % | | | 5.5 | % |
| 2027 | | | 11 | | | | 23,867 | | | | 11.1 | % | | | 7.5 | % |
| Thereafter | | | 35 | | | | 83,634 | | | | 39.0 | % | | | 37.9 | % |
| | | | | | | | | | | | | | | | | |
| Total(1) | | | 141 | | | $ | 214,382 | | | | 100.0 | % | | | | |
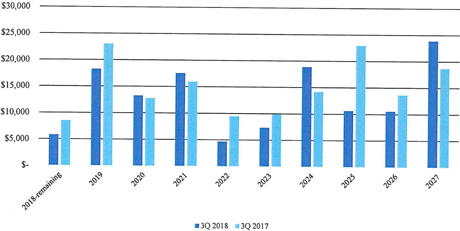
Footnotes
| (1) | Total shown may differ from detailed amounts due to rounding and does not include multi-tenant properties, parking operations, lease termination income and the acceleration of below-market lease intangible accretion on three Kmart assets. |
LEXINGTON REALTY TRUST
Lease Rollover Schedule - Consolidated Properties GAAP Basis
9/30/2018
($000)
| Year | | Number
of
Leases
Expiring | | | GAAP
Rent as of
9/30/2018 | | | Percent of
GAAP
Rent
as of
9/30/2018 | |
| 2018 - remaining | | | 34 | | | $ | 6,734 | | | | 3.0 | % |
| 2019 | | | 24 | | | | 18,782 | | | | 8.5 | % |
| 2020 | | | 19 | | | | 13,376 | | | | 6.1 | % |
| 2021 | | | 20 | | | | 19,844 | | | | 9.0 | % |
| 2022 | | | 4 | | | | 4,655 | | | | 2.1 | % |
| 2023 | | | 10 | | | | 7,332 | | | | 3.3 | % |
| 2024 | | | 18 | | | | 19,178 | | | | 8.7 | % |
| 2025 | | | 15 | | | | 11,989 | | | | 5.4 | % |
| 2026 | | | 9 | | | | 10,543 | | | | 4.8 | % |
| 2027 | | | 12 | | | | 23,867 | | | | 10.8 | % |
| Thereafter | | | 37 | | | | 84,515 | | | | 38.3 | % |
| | | | | | | | | | | | | |
| Total(1) | | | 202 | | | $ | 220,815 | | | | 100.0 | % |
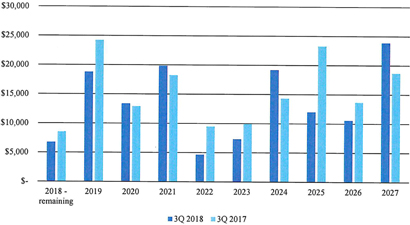
Footnotes
| (1) | Total shown may differ from detailed amounts due to rounding and does not include parking operations, lease termination income and the acceleration of below-market lease intangible accretion on three Kmart assets. |
LEXINGTON REALTY TRUST
Property Leases and Vacancies - Consolidated Portfolio - 9/30/2018
Year of
Lease
Expiration | | Date of Lease
Expiration | | Property Location | | City | | State | | | Note | | | Primary Tenant or Guarantor (19) | | Sq. Ft.
Leased or
Available (1) | | | GAAP
Rent
as of
9/30/2018
($000) (3) | | | Cash
Rent
as of
9/30/2018
($000) (2) | | | 9/30/2018
Debt Balance
($000) | | | Debt
Maturity | |
| INDUSTRIAL PROPERTIES | | | | | | | | | | | | | | | | | | | | | | | | | | | | | | | | | |
| 2018 | | 12/31/2018 | | 1133 Poplar Creek Rd. | | Henderson | | | NC | | | | – | | | Staples | | | 196,946 | | | | 652 | | | | 665 | | | | - | | | - | |
| | | | | 2935 Van Vactor Dr. | | Plymouth | | | IN | | | | – | | | Bay Valley Foods | | | 300,500 | | | | 642 | | | | 642 | | | | - | | | - | |
| | | | | 749 Southrock Dr. | | Rockford | | | IL | | | | – | | | Jacobson Warehouse | | | 150,000 | | | | 353 | | | | 405 | | | | - | | | - | |
| 2019 | | 10/17/2019 | | 10345 Philipp Pkwy. | | Streetsboro | | | OH | | | | – | | | L'Oreal USA | | | 649,250 | | | | 1,958 | | | | 2,113 | | | | 16,688 | | | 09/2019 | |
| | | 12/31/2019 | | 191 Arrowhead Dr. | | Hebron | | | OH | | | | – | | | Owens Corning | | | 250,410 | | | | 427 | | | | 427 | | | | - | | | - | |
| | | | | 200 Arrowhead Dr. | | Hebron | | | OH | | | | – | | | Owens Corning | | | 400,522 | | | | 683 | | | | 683 | | | | - | | | - | |
| | | | | 2415 US Hwy. 78 East | | Moody | | | AL | | | | – | | | Michelin | | | 595,346 | | | | 1,056 | | | | 1,087 | | | | - | | | - | |
| 2020 | | 1/31/2020 | | 101 Michelin Dr. | | Laurens | | | SC | | | | – | | | Michelin | | | 1,164,000 | | | | 2,586 | | | | 2,586 | | | | - | | | - | |
| | | 5/31/2020 | | 359 Gateway Dr. | | Lavonia | | | GA | | | | – | | | TI Automotive | | | 133,221 | | | | 714 | | | | 900 | | | | 6,740 | | | 12/2020 | |
| | | 6/30/2020 | | 1650-1654 Williams Rd. | | Columbus | | | OH | | | | – | | | ODW Logistics | | | 772,450 | | | | 1,008 | | | | 1,010 | | | | - | | | - | |
| | | | | 3102 Queen Palm Dr. | | Tampa | | | FL | | | | – | | | Time | | | 229,605 | | | | 926 | | | | 1,010 | | | | - | | | - | |
| | | 9/30/2020 | | 3350 Miac Cove Rd. | | Memphis | | | TN | | | | – | | | Mimeo.com | | | 107,400 | | | | 314 | | | | 336 | | | | - | | | - | |
| | | 12/19/2020 | | 1901 Ragu Dr. | | Owensboro | | | KY | | | | 6 | | | Unilever | | | 443,380 | | | | 1,119 | | | | 966 | | | | - | | | - | |
| | | 12/31/2020 | | 2203 Sherrill Dr. | | Statesville | | | NC | | | | – | | | Geodis America | | | 639,800 | | | | 1,870 | | | | 1,847 | | | | - | | | - | |
| 2021 | | 3/31/2021 | | 2455 Premier Row | | Orlando | | | FL | | | | – | | | Walgreen Co. | | | 205,016 | | | | 589 | | | | 381 | | | | - | | | - | |
| | | 5/31/2021 | | 291 Park Center Dr. | | Winchester | | | VA | | | | – | | | Kraft Heinz | | | 344,700 | | | | 1,065 | | | | 1,058 | | | | - | | | - | |
| | | 6/30/2021 | | 11624 S. Distribution Cv. | | Olive Branch | | | MS | | | | – | | | Hamilton Beach | | | 1,170,218 | | | | 1,812 | | | | 1,447 | | | | - | | | - | |
| | | 9/30/2021 | | 3820 Micro Dr. | | Millington | | | TN | | | | – | | | Ingram Micro | | | 701,819 | | | | 1,359 | | | | 1,405 | | | | - | | | - | |
| | | 10/25/2021 | | 6938 Elm Valley Dr. | | Kalamazoo | | | MI | | | | – | | | Dana | | | 150,945 | | | | 1,310 | | | | 1,520 | | | | - | | | - | |
| | | 11/30/2021 | | 2880 Kenny Biggs Rd. | | Lumberton | | | NC | | | | – | | | Quickie Manufacturing | | | 423,280 | | | | 1,017 | | | | 1,077 | | | | - | | | - | |
| | | 12/31/2021 | | 3686 South Central Ave. | | Rockford | | | IL | | | | – | | | Pierce Packaging | | | 93,000 | | | | 237 | | | | 237 | | | | - | | | - | |
| 2022 | | 3/31/2022 | | 5417 Campus Dr. | | Shreveport | | | LA | | | | – | | | Tire Rack | | | 257,849 | | | | 1,007 | | | | 1,052 | | | | - | | | - | |
| 2023 | | 2/28/2023 | | 7670 Hacks Cross Rd. | | Olive Branch | | | MS | | | | – | | | MAHLE Industries | | | 268,104 | | | | 679 | | | | 668 | | | | - | | | - | |
| | | 8/31/2023 | | 10535 Red Bluff Rd. | | Pasadena | | | TX | | | | – | | | Unis | | | 257,835 | | | | 139 | | | | 135 | | | | - | | | - | |
| | | 12/31/2023 | | 120 Southeast Pkwy. Dr. | | Franklin | | | TN | | | | – | | | United Technologies | | | 289,330 | | | | 553 | | | | 553 | | | | - | | | - | |
| 2024 | | 1/31/2024 | | 1285 W. State Road 32 | | Lebanon | | | IN | | | | – | | | Continental Tire | | | 741,880 | | | | 1,711 | | | | 1,657 | | | | - | | | - | |
| | | 3/31/2024 | | 1520 Lauderdale Memorial Hwy. | | Cleveland | | | TN | | | | – | | | General Electric | | | 851,370 | | | | 1,926 | | | | 1,958 | | | | - | | | - | |
| | | 4/30/2024 | | 113 Wells St. | | North Berwick | | | ME | | | | – | | | United Technologies | | | 993,685 | | | | 1,349 | | | | 1,471 | | | | 883 | | | 04/2019 | |
| | | 5/31/2024 | | 901 East Bingen Point Way | | Bingen | | | WA | | | | – | | | Boeing | | | 124,539 | | | | 1,977 | | | | 1,951 | | | | - | | | - | |
| | | 7/31/2024 | | 5795 North Blackstock Road | | Spartanburg | | | SC | | | | – | | | Wal-Mart | | | 341,660 | | | | 184 | | | | 179 | | | | - | | | - | |
| | | 9/30/2024 | | 1621 Veterans Memorial Pkwy. E | | Lafayette | | | IN | | | | – | | | Caterpillar | | | 309,400 | | | | 911 | | | | 903 | | | | - | | | - | |
LEXINGTON REALTY TRUST
Property Leases and Vacancies - Consolidated Portfolio - 9/30/2018
Year of
Lease
Expiration | | Date of Lease Expiration | | Property Location | | City | | State | | | Note | | | Primary Tenant or Guarantor (19) | | Sq. Ft.
Leased or
Available (1) | | | GAAP
Rent
as of
9/30/2018
($000) (3) | | | Cash
Rent
as of
9/30/2018
($000) (2) | | | 9/30/2018
Debt Balance
($000) | | | Debt
Maturity | |
| 2024 | | 10/31/2024 | | 43955 Plymouth Oaks Blvd. | | Plymouth | | | MI | | | | – | | | Tower Automotive | | | 311,612 | | | | 1,193 | | | | 1,137 | | | | - | | | - | |
| | | | | 2115 East Belt Line Rd. | | Carrollton | | | TX | | | | – | | | L.E. Klein | | | 58,202 | | | | 12 | | | | 9 | | | | - | | | - | |
| 2025 | | 3/31/2025 | | 2115 East Belt Line Rd. | | Carrollton | | | TX | | | | 13 | | | Teasdale | | | 298,653 | | | | 66 | | | | 53 | | | | - | | | - | |
| | | 6/30/2025 | | 10000 Business Blvd. | | Dry Ridge | | | KY | | | | – | | | Dana | | | 336,350 | | | | 1,009 | | | | 1,009 | | | | - | | | - | |
| | | | | 301 Bill Bryan Rd. | | Hopkinsville | | | KY | | | | – | | | Metalsa / Dana | | | 424,904 | | | | 1,266 | | | | 1,266 | | | | - | | | - | |
| | | | | 4010 Airpark Dr. | | Owensboro | | | KY | | | | – | | | Metalsa / Dana | | | 211,598 | | | | 906 | | | | 906 | | | | - | | | - | |
| | | | | 730 North Black Branch Rd. | | Elizabethtown | | | KY | | | | – | | | Metalsa / Dana | | | 167,770 | | | | 403 | | | | 403 | | | | - | | | - | |
| | | | | 750 North Black Branch Rd. | | Elizabethtown | | | KY | | | | – | | | Metalsa / Dana | | | 539,592 | | | | 2,129 | | | | 2,129 | | | | - | | | - | |
| | | 7/14/2025 | | 590 Ecology Ln. | | Chester | | | SC | | | | – | | | Boral Limited | | | 420,597 | | | | 1,314 | | | | 1,760 | | | | 6,764 | | | 08/2025 | |
| | | 7/31/2025 | | 7005 Cochran Rd. | | Glenwillow | | | OH | | | | – | | | Royal Appliance | | | 458,000 | | | | 1,546 | | | | 1,576 | | | | - | | | - | |
| | | 12/31/2025 | | 1700 47th Ave North | | Minneapolis | | | MN | | | | – | | | Owens Corning | | | 18,620 | | | | 412 | | | | 413 | | | | - | | | - | |
| 2026 | | 3/30/2026 | | 121 Technology Dr. | | Durham | | | NH | | | | 15 | | | Heidelberg | | | 500,500 | | | | 1,903 | | | | 2,479 | | | | - | | | - | |
| | | 3/31/2026 | | 633 Garrett Pkwy. | | Lewisburg | | | TN | | | | – | | | Calsonic Kansei | | | 310,000 | | | | 971 | | | | 901 | | | | - | | | - | |
| | | 6/30/2026 | | 351 Chamber Dr. | | Chillicothe | | | OH | | | | – | | | Kitchen Collection | | | 475,218 | | | | 869 | | | | 854 | | | | - | | | - | |
| | | 9/30/2026 | | 900 Industrial Blvd. | | Crossville | | | TN | | | | – | | | Dana | | | 222,200 | | | | 433 | | | | 433 | | | | - | | | - | |
| | | | | 3931 Lakeview Corporate Dr. | | Edwardsville | | | IL | | | | – | | | Amazon.com | | | 769,500 | | | | 2,015 | | | | 1,905 | | | | - | | | - | |
| | | 10/31/2026 | | 5001 Greenwood Rd. | | Shreveport | | | LA | | | | – | | | Libbey | | | 646,000 | | | | 1,624 | | | | 1,645 | | | | - | | | - | |
| | | 11/30/2026 | | 250 Rittenhouse Cir. | | Bristol | | | PA | | | | – | | | Estée Lauder | | | 241,977 | | | | 860 | | | | 868 | | | | - | | | - | |
| | | | | 736 Addison Rd. | | Erwin | | | NY | | | | – | | | Corning | | | 408,000 | | | | 1,038 | | | | 1,044 | | | | - | | | - | |
| 2027 | | 1/31/2027 | | 27200 West 157th St. | | New Century | | | KS | | | | – | | | Amazon.com | | | 446,500 | | | | 930 | | | | 801 | | | | - | | | - | |
| | | 2/28/2027 | | 554 Nissan Pkwy. | | Canton | | | MS | | | | – | | | Nissan | | | 1,466,000 | | | | 4,700 | | | | 4,507 | | | | - | | | - | |
| | | 4/30/2027 | | 16407 Applewhite Rd. | | San Antonio | | | TX | | | | 18 | | | Undisclosed / HVAC | | | 849,275 | | | | 2,245 | | | | 2,071 | | | | - | | | - | |
| | | | | 200 Sam Griffin Rd. | | Smyrna | | | TN | | | | – | | | Nissan | | | 1,505,000 | | | | 4,920 | | | | 4,682 | | | | - | | | - | |
| | | 6/30/2027 | | 1501 Nolan Ryan Expy. | | Arlington | | | TX | | | | – | | | Arrow Electronics | | | 74,739 | | | | 305 | | | | 296 | | | | - | | | - | |
| | | 9/30/2027 | | 1550 Hwy 302 | | Byhalia | | | MS | | | | – | | | McCormick | | | 615,600 | | | | 1,843 | | | | 1,310 | | | | - | | | - | |
| | | 10/31/2027 | | 201 James Lawrence Rd. | | Jackson | | | TN | | | | – | | | Kellogg | | | 1,062,055 | | | | 2,958 | | | | 2,766 | | | | - | | | - | |
| | | 12/31/2027 | | 10590 Hamilton Ave. | | Cincinnati | | | OH | | | | – | | | Hillman Group | | | 264,598 | | | | 610 | | | | 610 | | | | - | | | - | |
| 2028 | | 1/31/2028 | | 490 Westridge Pkwy. | | McDonough | | | GA | | | | – | | | Georgia-Pacific | | | 1,121,120 | | | | 2,802 | | | | 2,481 | | | | - | | | - | |
| | | 3/31/2028 | | 29-01-Borden Ave./29-10 Hunters Point Ave. | | Long Island City | | | NY | | | | – | | | FedEx | | | 140,330 | | | | 3,851 | | | | 3,756 | | | | 40,862 | | | 03/2028 | |
| | | 8/31/2028 | | 1420 Greenwood Rd. | | McDonough | | | GA | | | | – | | | United States Cold Storage | | | 296,972 | | | | 1,627 | | | | 1,601 | | | | - | | | - | |
| | | 9/30/2028 | | 904 Industrial Rd. | | Marshall | | | MI | | | | – | | | Tenneco | | | 246,508 | | | | 512 | | | | 631 | | | | - | | | - | |
LEXINGTON REALTY TRUST
Property Leases and Vacancies - Consolidated Portfolio - 9/30/2018
Year of
Lease
Expiration | | Date of Lease
Expiration | | Property Location | | City | | State | | | Note | | | Primary Tenant or Guarantor (19) | | Sq. Ft.
Leased or
Available (1) | | | GAAP
Rent
as of
9/30/2018
($000) (3) | | | Cash
Rent
as of
9/30/2018
($000) (2) | | | 9/30/2018
Debt Balance
($000) | | | Debt
Maturity | |
| 2029 | | 7/31/2029 | | 8500 Nail Rd. | | Olive Branch | | | MS | | | | – | | | Sephora | | | 716,080 | | | | 1,307 | | | | 852 | | | | - | | | - | |
| | | 11/24/2029 | | 318 Pappy Dunn Blvd. | | Anniston | | | AL | | | | – | | | IAC Group | | | 276,782 | | | | 1,305 | | | | 1,233 | | | | - | | | - | |
| 2030 | | 3/31/2030 | | 549 Wingo Rd. | | Byhalia | | | MS | | | | – | | | Asics | | | 855,878 | | | | 3,291 | | | | 3,066 | | | | - | | | - | |
| | | 5/31/2030 | | 3301 Stagecoach Rd. NE | | Thomson | | | GA | | | | – | | | Hollander | | | 208,000 | | | | 697 | | | | 650 | | | | - | | | - | |
| | | | | 4015 Lakeview Corporate Drive | | Edwardsville | | | IL | | | | – | | | Spectrum | | | 1,017,780 | | | | 917 | | | | 720 | | | | - | | | - | |
| 2031 | | 10/31/2031 | | 1020 W. Airport Rd. | | Romeoville | | | IL | | | | – | | | ARYZTA | | | 188,166 | | | | 2,690 | | | | 2,530 | | | | - | | | - | |
| | | 12/18/2031 | | 80 Tyson Dr. | | Winchester | | | VA | | | | 16 | | | Undisclosed / Automaker | | | 400,400 | | | | 1,776 | | | | 1,550 | | | | - | | | - | |
| 2032 | | 4/30/2032 | | 13930 Pike Rd. | | Missouri City | | | TX | | | | – | | | Vulcan | | | - | | | | 1,592 | | | | 1,464 | | | | - | | | - | |
| | | 8/24/2032 | | 16950 Pine Dr. | | Romulus | | | MI | | | | 16 | | | Undisclosed / Automaker | | | 500,023 | | | | 1,926 | | | | 1,795 | | | | - | | | - | |
| | | 10/31/2032 | | 27255 SW 95th Ave. | | Wilsonville | | | OR | | | | – | | | Pacific Natural Foods | | | 508,277 | | | | 2,340 | | | | 1,933 | | | | - | | | - | |
| | | | | 26700 Bunert Road | | Warren | | | MI | | | | – | | | Lipari | | | 260,243 | | | | 2,912 | | | | 2,572 | | | | 25,850 | | | 11/2032 | |
| 2034 | | 9/30/2034 | | 5625 North Sloan Ln. | | North Las Vegas | | | NV | | | | – | | | Nicholas | | | 180,235 | | | | 1,917 | | | | 1,703 | | | | - | | | - | |
| | | 10/31/2034 | | 1001 Innovation Rd. | | Rantoul | | | IL | | | | – | | | Vista Outdoor | | | 813,126 | | | | 3,147 | | | | 2,766 | | | | - | | | - | |
| 2035 | | 3/31/2035 | | 13863 Industrial Rd. | | Houston | | | TX | | | | – | | | Spitzer | | | 187,800 | | | | 1,826 | | | | 1,585 | | | | - | | | - | |
| | | | | 7007 F.M. 362 Rd. | | Brookshire | | | TX | | | | – | | | Spitzer | | | 262,095 | | | | 1,433 | | | | 1,243 | | | | - | | | - | |
| | | 6/30/2035 | | 111 West Oakview Pkwy. | | Oak Creek | | | WI | | | | – | | | Stella & Chewy's | | | 164,007 | | | | 1,574 | | | | 1,406 | | | | - | | | - | |
| | | 8/31/2035 | | 2800 Polar Way | | Richland | | | WA | | | | 9 | | | Preferred Freezer | | | 456,412 | | | | 9,850 | | | | 8,440 | | | | 110,000 | | | 01/2026 | |
| | | 10/22/2035 | | 2860 Clark St. | | Detroit | | | MI | | | | 16 | | | Undisclosed / Automaker | | | 189,960 | | | | 1,653 | | | | 1,653 | | | | - | | | - | |
| 2036 | | 5/31/2036 | | 671 Washburn Switch Rd. | | Shelby | | | NC | | | | – | | | Clearwater Paper | | | 673,425 | | | | 2,089 | | | | 1,823 | | | | - | | | - | |
| | | 6/30/2036 | | 100 Ryobi Drive | | Anderson | | | SC | | | | 23 | | | One World Technologies | | | 1,327,022 | | | | 3,335 | | | | 2,819 | | | | - | | | - | |
| 2037 | | 3/31/2037 | | 4005 E I-30 | | Grand Prairie | | | TX | | | | – | | | O'Neal Industries | | | 215,000 | | | | 1,404 | | | | 1,169 | | | | - | | | - | |
| 2038 | | 3/31/2038 | | 13901/14035 Industrial Rd. | | Houston | | | TX | | | | – | | | Watco | | | 132,449 | | | | 5,080 | | | | 4,349 | | | | - | | | - | |
| 2042 | | 5/31/2042 | | 4801 North Park Dr. | | Opelika | | | AL | | | | – | | | Golden State Enterprises | | | 165,493 | | | | 2,533 | | | | 1,978 | | | | - | | | - | |
| N/A | | Vacancy | | 3350 Miac Cove Rd. | | Memphis | | | TN | | | | – | | | (Available for Lease) | | | 32,679 | | | | - | | | | - | | | | - | | | - | |
| INDUSTRIAL TOTAL/WEIGHTED AVERAGE | | | | | | | | | | | | 99.9% Leased | | | 38,196,782 | | | $ | 135,999 | | | $ | 127,930 | | | $ | 207,787 | | | | |
LEXINGTON REALTY TRUST
Property Leases and Vacancies - Consolidated Portfolio - 9/30/2018
Year of Lease
Expiration | | Date of Lease
Expiration | | Property Location | | City | | State | | | Note | | | Primary Tenant or Guarantor (19) | | Sq.Ft.
Leased or
Available (1) | | | GAAP
Rent
as of
9/30/2018
($000) (3) | | | Cash
Rent
as of
9/30/2018
($000) (2) | | | 9/30/2018
Debt Balance
($000) | | | Debt
Maturity | |
| OFFICE PROPERTIES | | | | | | | | | | | | | | | | | | | | | | | | | | | | | | | |
| 2018 | | 12/22/2018 | | 5200 Metcalf Ave. | | Overland Park | | | KS | | | | – | | | Swiss Re | | | 320,198 | | | | 4,167 | | | | 4,152 | | | | 32,297 | | | 05/2019 | |
| 2019 | | 1/31/2019 | | 820 Gears Rd. | | Houston | | | TX | | | | – | | | Ricoh | | | 78,895 | | | | 885 | | | | 884 | | | | - | | | - | |
| | | 2/28/2019 | | 10475 Crosspoint Blvd. | | Indianapolis | | | IN | | | | – | | | DMC Insurance | | | 3,764 | | | | 54 | | | | 54 | | | | - | | | - | |
| | | 4/1/2019 | | 9201 Stateline Rd. | | Kansas City | | | MO | | | | – | | | Swiss Re | | | 155,925 | | | | 1,913 | | | | 1,913 | | | | 15,388 | | | 05/2019 | |
| | | 6/19/2019 | | 3965 Airways Blvd. | | Memphis | | | TN | | | | 23 | | | Federal Express | | | 521,286 | | | | 5,260 | | | | 5,326 | | | | - | | | - | |
| | | 10/31/2019 | | 10475 Crosspoint Blvd. | | Indianapolis | | | IN | | | | – | | | John Wiley | | | 123,047 | | | | 1,701 | | | | 1,758 | | | | - | | | - | |
| | | | | 9601 Renner Blvd. | | Lenexa | | | KS | | | | – | | | T-Mobile USA | | | 77,484 | | | | 857 | | | | 1,137 | | | | 8,265 | | | 12/2019 | |
| | | 12/31/2019 | | 2800 Waterford Lake Dr. | | Midlothian | | | VA | | | | 22 | | | Alstom Power | | | 99,057 | | | | 1,638 | | | | 1,769 | | | | - | | | - | |
| 2020 | | 2/14/2020 | | 5600 Broken Sound Blvd. | | Boca Raton | | | FL | | | | – | | | Oce - USA Holding | | | 143,290 | | | | 1,683 | | | | 1,875 | | | | 18,862 | | | 02/2020 | |
| | | 5/31/2020 | | 2401 Cherahala Blvd. | | Knoxville | | | TN | | | | – | | | CaremarkPCS | | | 59,748 | | | | 580 | | | | 588 | | | | - | | | - | |
| | | 6/30/2020 | | 3711 San Gabriel | | Mission | | | TX | | | | – | | | T-Mobile West | | | 75,016 | | | | 742 | | | | 745 | | | | - | | | - | |
| | | 8/31/2020 | | 133 First Park Dr. | | Oakland | | | ME | | | | – | | | T-Mobile USA | | | 78,610 | | | | 860 | | | | 1,129 | | | | 8,202 | | | 10/2020 | |
| | | 9/30/2020 | | 9200 South Park Center Loop | | Orlando | | | FL | | | | 24 | | | ECMC Group | | | 59,927 | | | | 852 | | | | 893 | | | | - | | | - | |
| 2021 | | 1/31/2021 | | 1701 Market St. | | Philadelphia | | | PA | | | | – | | | Morgan Lewis | | | 289,432 | | | | 3,223 | | | | 3,378 | | | | - | | | - | |
| | | 3/31/2021 | | 1701 Market St. | | Philadelphia | | | PA | | | | – | | | Car-Tel | | | 1,220 | | | | 47 | | | | 47 | | | | - | | | - | |
| | | 6/30/2021 | | 1415 Wyckoff Rd. | | Wall | | | NJ | | | | – | | | NJ Natural Gas | | | 157,511 | | | | 2,830 | | | | 2,830 | | | | 8,847 | | | 01/2021 | |
| | | | | 2050 Roanoke Rd. | | Westlake | | | TX | | | | – | | | Charles Schwab | | | 130,199 | | | | 1,552 | | | | 1,592 | | | | - | | | | |
| | | 8/31/2021 | | 3500 North Loop Rd. | | McDonough | | | GA | | | | 11 | | | TSYS | | | 62,218 | | | | 748 | | | | 1,001 | | | | - | | | - | |
| | | 10/31/2021 | | 1401 Nolan Ryan Expy. | | Arlington | | | TX | | | | – | | | Butler America Aerospace | | | 4,979 | | | | - | | | | - | | | | - | | | - | |
| | | 11/30/2021 | | 29 South Jefferson Rd. | | Whippany | | | NJ | | | | – | | | CAE | | | 123,734 | | | | 1,750 | | | | 1,959 | | | | 12,297 | | | 11/2021 | |
| 2022 | | 5/30/2022 | | 13651 McLearen Rd. | | Herndon | | | VA | | | | – | | | United States of America | | | 159,644 | | | | 2,353 | | | | 2,415 | | | | - | | | - | |
| | | 7/31/2022 | | 1440 E 15th St. | | Tucson | | | AZ | | | | – | | | CoxCom | | | 28,591 | | | | 421 | | | | 421 | | | | - | | | - | |
| | | 10/31/2022 | | 4455 American Way | | Baton Rouge | | | LA | | | | – | | | New Cingular Wireless | | | 70,100 | | | | 874 | | | | 841 | | | | - | | | - | |
| 2023 | | 6/30/2023 | | 420 Riverport Rd. | | Kingsport | | | TN | | | | – | | | Kingsport Power | | | 42,770 | | | | 141 | | | | 233 | | | | - | | | - | |
LEXINGTON REALTY TRUST
Property Leases and Vacancies - Consolidated Portfolio - 9/30/2018
Year of Lease
Expiration | | Date of Lease
Expiration | | Property Location | | City | | State | | | Note | | | Primary Tenant or Guarantor (19) | | Sq.Ft.
Leased or
Available (1) | | | GAAP
Rent
as of
9/30/2018
($000) (3) | | | Cash
Rent
as of
9/30/2018
($000) (2) | | | 9/30/2018
Debt Balance
($000) | | | Debt
Maturity | |
| 2023 | | 9/30/2023 | | 1701 Market St. | | Philadelphia | | | PA | | | | – | | | CBC Restaurant | | | 8,070 | | | | 158 | | | | 168 | | | | - | | | - | |
| | | 10/31/2023 | | 3943 Denny Ave. | | Pascagoula | | | MS | | | | – | | | Huntington Ingalls | | | 94,841 | | | | 445 | | | | 445 | | | | - | | | - | |
| | | 12/14/2023 | | 3333 Coyote Hill Rd. | | Palo Alto | | | CA | | | | – | | | Xerox | | | 202,000 | | | | 4,981 | | | | 5,303 | | | | 33,624 | | | 12/2023 | |
| 2024 | | 2/14/2024 | | 1362 Celebration Blvd. | | Florence | | | SC | | | | – | | | MED3000 | | | 32,000 | | | | 430 | | | | 432 | | | | - | | | - | |
| | | 5/31/2024 | | 3476 Stateview Blvd. | | Fort Mill | | | SC | | | | – | | | Wells Fargo | | | 169,083 | | | | 1,462 | | | | 1,436 | | | | - | | | - | |
| | | | | 3480 Stateview Blvd. | | Fort Mill | | | SC | | | | – | | | Wells Fargo | | | 169,218 | | | | 1,519 | | | | 1,437 | | | | - | | | - | |
| | | 7/15/2024 | | 19019 North 59th Ave. | | Glendale | | | AZ | | | | – | | | Honeywell | | | 252,300 | | | | 1,469 | | | | 1,489 | | | | - | | | - | |
| | | 7/31/2024 | | 500 Jackson St. | | Columbus | | | IN | | | | – | | | Cummins | | | 390,100 | | | | 3,405 | | | | 3,571 | | | | 8,826 | | | 07/2019 | |
| | | 8/31/2024 | | 10475 Crosspoint Blvd. | | Indianapolis | | | IN | | | | – | | | HQ Global Workplaces | | | 14,236 | | | | 231 | | | | 231 | | | | - | | | | |
| | | 10/31/2024 | | 1409 Centerpoint Blvd. | | Knoxville | | | TN | | | | 23 | | | Alstom Power | | | 84,404 | | | | 944 | | | | 932 | | | | - | | | - | |
| 2025 | | 1/31/2025 | | 1401 Nolan Ryan Expy. | | Arlington | | | TX | | | | – | | | Triumph Group | | | 111,409 | | | | 1,229 | | | | 1,311 | | | | - | | | - | |
| | | 2/28/2025 | | 1401 Nolan Ryan Expy. | | Arlington | | | TX | | | | – | | | Infotech Enterprise | | | 13,590 | | | | 153 | | | | 158 | | | | - | | | - | |
| | | 5/31/2025 | | 1701 Market St. | | Philadelphia | | | PA | | | | – | | | TruMark Financial | | | 2,641 | | | | 189 | | | | 189 | | | | - | | | - | |
| 2026 | | 6/30/2026 | | 3265 East Goldstone Dr. | | Meridian | | | ID | | | | – | | | T-Mobile USA | | | 77,484 | | | | 830 | | | | 1,118 | | | | 8,077 | | | 08/2019 | |
| 2027 | | 1/31/2027 | | 1701 Market St. | | Philadelphia | | | PA | | | | – | | | Drybar | | | 1,975 | | | | 106 | | | | 79 | | | | - | | | - | |
| | | 10/31/2027 | | 11201 Renner Blvd. | | Lenexa | | | KS | | | | – | | | United States of America | | | 169,585 | | | | 3,675 | | | | 3,547 | | | | 32,112 | | | 11/2027 | |
| | | 11/30/2027 | | 1700 Millrace Dr. | | Eugene | | | OR | | | | 10, 23, 25 | | | Oregon Research Institute | | | 80,011 | | | | 1,575 | | | | 1,374 | | | | - | | | - | |
| 2029 | | 3/31/2029 | | 2800 High Meadow Cir. | | Auburn Hills | | | MI | | | | – | | | Faurecia | | | 278,000 | | | | 2,660 | | | | 2,461 | | | | - | | | - | |
| | | 7/31/2029 | | 2999 Southwest 6th St. | | Redmond | | | OR | | | | 12 | | | T-Mobile USA / Consumer Cellular | | | 77,260 | | | | 1,101 | | | | 1,337 | | | | - | | | - | |
| 2033 | | 12/31/2033 | | 8555 South River Pkwy. | | Tempe | | | AZ | | | | – | | | Versum | | | 95,133 | | | | 1,327 | | | | 914 | | | | - | | | - | |
| 2036 | | 10/31/2036 | | 270 Abner Jackson Pkwy. | | Lake Jackson | | | TX | | | | – | | | Dow | | | 664,100 | | | | 11,137 | | | | 9,279 | | | | 189,145 | | | 10/2036 | |
| N/A | | N/A | | 1701 Market St. | | Philadelphia | | | PA | | | | – | | | Parking Operations | | | - | | | | 1,504 | | | | 1,504 | | | | - | | | - | |
| | | Vacancy | | 1701 Market St. | | Philadelphia | | | PA | | | | – | | | (Available for Lease) | | | 699 | | | | - | | | | - | | | | - | | | - | |
| | | | | 1401 Nolan Ryan Expy. | | Arlington | | | TX | | | | – | | | (Available for Lease) | | | 31,830 | | | | - | | | | - | | | | - | | | - | |
| OFFICE TOTAL/WEIGHTED AVERAGE | | | | | | | | | | | | 99.4% Leased | | | 5,886,614 | | | $ | 75,661 | | | $ | 75,655 | | | $ | 375,942 | | | | |
LEXINGTON REALTY TRUST
Property Leases and Vacancies - Consolidated Portfolio - 9/30/2018
Year of Lease
Expiration | | Date of Lease
Expiration | | Property Location | | City | | State | | | Note | | | Primary Tenant or Guarantor (19) | | Sq.Ft.
Leased or
Available (1) | | | GAAP Rent
as of 9/30/2018
($000) (3) | | | Cash Rent
as of 9/30/2018
($000) (2) | | | 9/30/2018
Debt Balance
($000) | | | Debt
Maturity | |
| OTHER PROPERTIES | | | | | | | | | | | | | | | | | | | | | | | | | | | | | | | | | |
| Retail | | | | | | | | | | | | | | | | | | | | | | | | | | | | | | | | | |
| 2019 | | 1/31/2019 | | 12080 Carmel Mountain Rd. | | San Diego | | | CA | | | | 17 | | | Kmart | | | 107,210 | | | | 5,571 | | | | 67 | | | | - | | | - | |
| | | | | 21082 Pioneer Plaza Dr. | | Watertown | | | NY | | | | 17 | | | Kmart | | | 120,727 | | | | 994 | | | | 99 | | | | - | | | - | |
| | | | | 255 Northgate Dr. | | Manteca | | | CA | | | | 17, 23 | | | Kmart | | | 107,489 | | | | 1,941 | | | | 105 | | | | - | | | - | |
| | | | | 97 Seneca Trail | | Fairlea | | | WV | | | | – | | | Kmart | | | 90,933 | | | | 262 | | | | 69 | | | | - | | | - | |
| 2023 | | 2/28/2023 | | 733 East Main St. | | Jefferson | | | NC | | | | 23 | | | Delhaize | | | 34,555 | | | | 117 | | | | 120 | | | | - | | | - | |
| | | 7/1/2023 | | 1053 Mineral Springs Rd. | | Paris | | | TN | | | | – | | | Kroger | | | 31,170 | | | | 119 | | | | 119 | | | | - | | | - | |
| 2024 | | 3/31/2024 | | B.E.C. 45th St./Lee Blvd. | | Lawton | | | OK | | | | – | | | Safeway | | | 30,757 | | | | 144 | | | | 139 | | | | - | | | - | |
| N/A | | Vacancy | | 832 N. Westover Blvd . | | Albany | | | GA | | | | – | | | (Available for Lease) | | | 45,554 | | | | - | | | | - | | | | - | | | - | |
| Specialty | | | | | | | | | | | | | | | | | | | | | | | | | | | | | | | | | | | |
| 2029 | | 1/31/2029 | | 175 Holt Garrison Pkwy. | | Danville | | | VA | | | | – | | | Home Depot | | | - | | | | 162 | | | | 195 | | | | - | | | - | |
| 2048 | | 12/31/2048 | | 30 Light St. | | Baltimore | | | MD | | | | – | | | 30 Charm City | | | - | | | | 224 | | | | 224 | | | | - | | | - | |
| 2055 | | 1/31/2055 | | 499 Derbyshire Dr. | | Venice | | | FL | | | | – | | | Littlestone Brotherhood | | | 31,180 | | | | 1,431 | | | | 1,004 | | | | - | | | - | |
| 2112 | | 8/31/2112 | | 201-215 N. Charles St. | | Baltimore | | | MD | | | | – | | | 201 NC Leasehold | | | - | | | | 206 | | | | 206 | | | | - | | | - | |
| Multi-tenant (4)(8)(14) | | | | | | | | | | | | | | | | | | | | | | | | | | | | | | | | | |
| | | Various | | 50 Tyger River Dr. | | Duncan | | | SC | | | | 11 | | | Vacant | | | 221,833 | | | | 769 | | | | 769 | | | | - | | | - | |
| | | Various | | 100 Barnes Rd. | | Wallingford | | | CT | | | | 11 | | | Vacant | | | 44,400 | | | | 254 | | | | 270 | | | | - | | | - | |
| | | Various | | 11511 Luna Rd. | | Farmers Branch | | | TX | | | | 4 (90%) | | | IBM | | | 181,072 | | | | 1,884 | | | | 1,092 | | | | - | | | - | |
| | | Various | | 1311 Broadfield Blvd. | | Houston | | | TX | | | | 4 (49%) | | | Saipem | | | 155,407 | | | | 534 | | | | 373 | | | | - | | | - | |
| | | Various | | 13430 North Black Canyon Fwy. | | Phoenix | | | AZ | | | | 4 (65%) | | | Multi-Tenant | | | 138,940 | | | | 786 | | | | 1,028 | | | | - | | | - | |
| | | Various | | 1460 Tobias Gadson Blvd. | | Charleston | | | SC | | | | 4 (64%) | | | Vallen Distribution | | | 50,247 | | | | 295 | | | | 295 | | | | 6,906 | | | 02/2021 | |
| | | Various | | 2210 Enterprise Dr. | | Florence | | | SC | | | | 4 (21%) | | | Caliber Funding | | | 176,557 | | | | 586 | | | | 625 | | | | - | | | - | |
| | | Various | | 3456 Meyers Ave. | | Memphis | | | TN | | | | 11 | | | Vacant | | | 780,000 | | | | 1,031 | | | | 504 | | | | - | | | - | |
| | | Various | | 6050 Dana Way | | Antioch | | | TN | | | | 4 (97%) | | | Multi-Tenant | | | 674,528 | | | | 1,725 | | | | 1,701 | | | | - | | | - | |
| | | Various | | King St./1042 Fort St. Mall | | Honolulu | | | HI | | | | 4 (48%) | | | Multi-Tenant | | | 77,459 | | | | 506 | | | | 506 | | | | - | | | - | |
| OTHER TOTAL/WEIGHTED AVERAGE | | | | | | | | | | | | 53.1% Leased | | | 3,100,018 | | | $ | 19,541 | | | $ | 9,510 | | | $ | 6,906 | | | | |
| | | | | | | | | | | | | | | | | | | | | | | | | | | | | | | | | | | | |
| TOTAL CONSOLIDATED PORTFOLIO/WEIGHTED AVERAGE | | | | | | | | | | 96.8% Leased | | | 47,183,414 | | | $ | 231,201 | | | $ | 213,095 | | | $ | 590,635 | | | | |
LEXINGTON REALTY TRUST
Property Leases and Vacancies - Consolidated Portfolio - 9/30/2018
Year of
Lease
Expiration | | Date of Lease
Expiration | | Property Location | | City | | State | | | Note | | | Primary Tenant or Guarantor (19) | | Sq.Ft.
Leased or
Available (1) | | | LXP %
Ownership | | | GAAP
Rent
as of
9/30/2018
($000) (3) | | | Cash
Rent
as of
9/30/2018
($000) (2) | | | 9/30/2018
Debt Balance
($000) | | | Debt Maturity (21) |
| NON-CONSOLIDATED PROPERTIES | | | | | | | | | | | | | | | | | | | | | | | | | | | | | | | | | | |
| NNN OFFICE JV PROPERTIES | | | | | | | | | | | | | | | | | | | | | | | | | | | | | | | | | | |
| 2022 | | 12/31/2022 | | 231 N. Martingale Rd. | | Schaumburg | | | IL | | | | 7 | | | Career Education Corporation | | | 317,198 | | | | 20 | % | | | 396 | | | | 394 | | | | 362,800 | | | 09/2021 |
| 2023 | | 2/28/2023 | | 1315 West Century Dr. | | Louisville | | | CO | | | | 7 | | | Rogue Wave Software | | | 20,000 | | | | 20 | % | | | 27 | | | | 27 | | | | - | | | - |
| | | 3/31/2023 | | 8900 Freeport Pkwy. | | Irving | | | TX | | | | 7 | | | Nissan | | | 268,445 | | | | 20 | % | | | 360 | | | | 325 | | | | - | | | - |
| 2025 | | 2/28/2025 | | 6555 Sierra Dr. | | Irving | | | TX | | | | 7 | | | TXU | | | 247,254 | | | | 20 | % | | | 326 | | | | 271 | | | | - | | | - |
| | | 3/14/2025 | | 601 & 701 Experian Pkwy. | | Allen | | | TX | | | | 7 | | | Experian Holdings | | | 292,700 | | | | 20 | % | | | 278 | | | | 264 | | | | - | | | - |
| | | 6/30/2025 | | 2500 Patrick Henry Pkwy. | | McDonough | | | GA | | | | 7 | | | Georgia Power | | | 111,911 | | | | 20 | % | | | 140 | | | | 119 | | | | - | | | - |
| | | 9/30/2025 | | 10001 Richmond Ave. | | Houston | | | TX | | | | 7 | | | Schlumberger | | | 554,385 | | | | 20 | % | | | 541 | | | | 481 | | | | - | | | - |
| | | 12/31/2025 | | 4001 International Pkwy. | | Carrollton | | | TX | | | | 7 | | | Motel 6 | | | 138,443 | | | | 20 | % | | | 218 | | | | 194 | | | | - | | | - |
| 2026 | | 3/31/2026 | | 500 Olde Worthington Rd. | | Westerville | | | OH | | | | 7 | | | Syneos | | | 97,000 | | | | 20 | % | | | 115 | | | | 100 | | | | - | | | - |
| | | 4/30/2026 | | 800 East Canal St. | | Richmond | | | VA | | | | 5 | | | Richmond Belly Ventures | | | 2,568 | | | | 20 | % | | | 1 | | | | 1 | | | | - | | | - |
| | | 11/30/2026 | | 500 Kinetic Dr. | | Huntington | | | WV | | | | 7 | | | Amazon.com | | | 68,693 | | | | 20 | % | | | 106 | | | | 98 | | | | - | | | - |
| 2027 | | 2/28/2027 | | 800 East Canal St. | | Richmond | | | VA | | | | 5 | | | Sumitomo | | | 8,503 | | | | 20 | % | | | 2 | | | | 2 | | | | - | | | - |
| | | 4/30/2027 | | 1315 West Century Dr. | | Louisville | | | CO | | | | 7 | | | GHX Ultimate Parent | | | 86,877 | | | | 20 | % | | | 128 | | | | 108 | | | | - | | | - |
| | | 6/30/2027 | | 3902 Gene Field Rd. | | St. Joseph | | | MO | | | | 7 | | | Boehringer Ingelheim USA | | | 98,849 | | | | 20 | % | | | 182 | | | | 167 | | | | - | | | - |
| | | 7/6/2027 | | 2221 Schrock Rd. | | Columbus | | | OH | | | | 7 | | | MS Consultants | | | 42,290 | | | | 20 | % | | | 59 | | | | 54 | | | | - | | | - |
| | | 8/7/2027 | | 25 Lakeview Dr. | | Jessup | | | PA | | | | 7 | | | TMG Health | | | 150,000 | | | | 20 | % | | | 200 | | | | 185 | | | | - | | | - |
| 2028 | | 4/30/2028 | | 9655 Maroon Cir. | | Englewood | | | CO | | | | 7 | | | TriZetto | | | 166,912 | | | | 20 | % | | | 360 | | | | 323 | | | | - | | | - |
| 2029 | | 1/31/2029 | | 6226 West Sahara Ave. | | Las Vegas | | | NV | | | | 7 | | | Nevada Power | | | 282,000 | | | | 20 | % | | | 298 | | | | 266 | | | | - | | | - |
| 2030 | | 8/31/2030 | | 800 East Canal St. | | Richmond | | | VA | | | | -- | | | McGuireWoods | | | 224,537 | | | | 20 | % | | | 80 | | | | 76 | | | | 57,500 | | | 02/2031 |
| | | 9/30/2030 | | 800 East Canal St. | | Richmond | | | VA | | | | 5 | | | The Riverstone Group | | | 25,707 | | | | 20 | % | | | 8 | | | | 7 | | | | - | | | - |
| 2031 | | 1/10/2031 | | 810 Gears Rd. | | Houston | | | TX | | | | 7 | | | United States of America | | | 68,985 | | | | 20 | % | | | 104 | | | | 123 | | | | - | | | - |
| | | 3/1/2031 | | 800 East Canal St. | | Richmond | | | VA | | | | 5 | | | Towne Bank | | | 26,047 | | | | 20 | % | | | 9 | | | | 8 | | | | - | | | - |
| | | 12/31/2031 | | 333 Mt. Hope Ave. | | Rockaway | | | NJ | | | | 7 | | | Atlantic Health | | | 92,326 | | | | 20 | % | | | 156 | | | | 113 | | | | - | | | - |
| 2032 | | 4/30/2032 | | 1210 AvidXchange Ln. | | Charlotte | | | NC | | | | – | | | AvidXchange | | | 201,450 | | | | 20 | % | | | 518 | | | | 453 | | | | 45,900 | | | 12/2022; 01/2033 |
| | | 10/31/2032 | | 143 Diamond Ave. | | Parachute | | | CO | | | | 7 | | | Alenco | | | 49,024 | | | | 20 | % | | | 96 | | | | 94 | | | | - | | | - |
| 2033 | | 3/31/2033 | | 9201 East Dry Creek Rd. | | Centennial | | | CO | | | | 7 | | | Arrow Electronics | | | 128,500 | | | | 20 | % | | | 246 | | | | 204 | | | | - | | | - |
| 2088 | | 8/8/2088 | | 800 East Canal St. | | Richmond | | | VA | | | | 5 | | | The City of Richmond, Virginia | | | - | | | | 20 | % | | | 5 | | | | 5 | | | | - | | | - |
| N/A | | Vacancy | | 810 Gears Rd. | | Houston | | | TX | | | | 7 | | | (Available for Lease) | | | 9,910 | | | | 20 | % | | | - | | | | - | | | | - | | | - |
| | | | | 800 East Canal St. | | Richmond | | | VA | | | | 5 | | | (Available for Lease) | | | 42,947 | | | | 20 | % | | | - | | | | - | | | | - | | | - |
| NNN OFFICE JV TOTAL/WEIGHTED AVERAGE | | | | | | | | | | 98.6% Leased | | | 3,823,461 | | | | | | | $ | 4,959 | | | $ | 4,462 | | | $ | 466,200 | | | |
LEXINGTON REALTY TRUST
Property Leases and Vacancies - Consolidated Portfolio - 9/30/2018
Year of
Lease
Expiration | | Date of Lease
Expiration | | Property Location | | City | | State | | | Note | | | Primary Tenant or Guarantor (19) | | Sq.Ft.
Leased or
Available (1) | | | LXP %
Ownership | | | GAAP
Rent
as of
9/30/2018
($000) (3) | | | Cash
Rent
as of
9/30/2018
($000) (2) | | | 9/30/2018
Debt Balance
($000) | | | Debt
Maturity (21) |
| OTHER NON-CONSOLIDATED PROPERTIES | | | | | | | | | | | | | | | | | | | | | | | | | | | | | | | | | | |
| 2029 | | 1/31/2029 | | 18839 McKay Blvd. | | Humble | | | TX | | | | – | | | RehabCare Group | | | 55,646 | | | | 15 | % | | | 2,049 | | | | 1,926 | | | | 13,687 | | | 05/2019 |
| 2033 | | 10/31/2033 | | 607 & 611 Lumsden Professional Ct. | | Brandon | | | FL | | | | 20 | | | BluePearl | | | 8,500 | | | | 15 | % | | | 154 | | | | 154 | | | | - | | | - |
| | | | | 4525 Ulmerton Rd. | | Clearwater | | | FL | | | | 20 | | | BluePearl | | | 3,000 | | | | 15 | % | | | 92 | | | | 92 | | | | - | | | - |
| | | | | 455 Abernathy Rd. | | Atlanta | | | GA | | | | 20 | | | BluePearl | | | 32,000 | | | | 15 | % | | | 907 | | | | 760 | | | | - | | | - |
| | | | | 820 Frontage Rd. | | Northfield | | | IL | | | | 20 | | | BluePearl | | | 14,000 | | | | 15 | % | | | 359 | | | | 359 | | | | - | | | - |
| | | | | 4126 Packard Rd. | | Ann Arbor | | | MI | | | | 20 | | | BluePearl | | | 3,500 | | | | 15 | % | | | 43 | | | | 43 | | | | - | | | - |
| | | | | 29080 Inkster Rd. | | Southfield | | | MI | | | | 20 | | | BluePearl | | | 38,000 | | | | 15 | % | | | 955 | | | | 851 | | | | 18,791 | | | 11/2018 |
| 2036 | | 8/31/2036 | | 2203 North Westgreen Blvd. | | Katy | | | TX | | | | – | | | British Schools | | | 274,000 | | | | 25 | % | | | 4,830 | | | | 4,830 | | | | 49,275 | | | 12/2022 |
| OTHER NON-CONSOLIDATED TOTAL/WEIGHTED AVERAGE | | | | | | | | | | 100% Leased | | | 428,646 | | | | | | | $ | 9,389 | | | $ | 9,015 | | | $ | 81,753 | | | |
| | | | | | | | | | | | | | | | | | | | | | | | | | | | | | | | | | | | | | | |
| NON-CONSOLIDATED TOTAL/WEIGHTED AVERAGE | | | | | | | | | | 98.8% Leased | | | 4,252,107 | | | | | | | $ | 14,348 | | | $ | 13,477 | | | $ | 547,953 | | | |
Footnotes
| 1 | Square footage leased or available. |
| 2 | Nine months ended 9/30/2018 cash rent. See definitions of non-GAAP measures and reconciliations to applicable GAAP measures in this document. |
| 3 | Nine months ended 9/30/2018 GAAP rent, excluding termination income. |
| 4 | Percent represents % leased as of 9/30/2018. |
| 5 | Part of Richmond, Virginia property, which is primarily leased to McGuireWoods LLP. |
| 6 | Lexington has a 71.1% interest in this property. |
| 7 | NNN Office JV obtained a $362.8 million mortgage which is cross-collateralized and cross-defaulted. |
| 8 | Multi-tenant properties are properties less than 50% leased to a single tenant. |
| 9 | ConAgra Foods, Inc. provides credit support. |
| 10 | Educational Policy Improvement Center lease for 10,791 square feet expires 11/2019; however, space is then leased to Oregon Research Institute through 11/2027. |
| 11 | Cash and GAAP rent amounts represent/include prior tenant. |
| 12 | T-Mobile USA lease expires 1/31/2019; however, new tenant (Consumer Cellular Incorporated) lease expires 7/31/2029. |
| 13 | Teasdale Foods, Inc. lease for 240,451 sqft (original space) expires 3/31/2025; however 58,202 sqft (expansion space) lease expires 12/31/2026. Subsequent to 9/30/2018, lease for both spaces extended to 12/31/2033. |
| 14 | The multi-tenanted properties incurred approximately $3.0 million in operating expenses, net for the nine months ended 9/30/2018. |
| 15 | Heidelberg Americas, Inc. lease expires 3/30/2021; however, new tenant (Goss International Americas, Inc.) lease expires 3/30/2026. |
| 16 | Tenant is a domestic subsidiary of an international automaker. |
| 17 | GAAP rent includes the acceleration of below-market lease intangible accretion. |
| 18 | Lease restricts certain disclosures. Guarantor is investment grade. |
| 19 | See Annual Report and other applicable disclosures for actual tenant names. |
| 20 | All debt is cross-collateralized and cross-defaulted. |
| 21 | Interest rates range from 4.0% to 5.3% at 9/30/2018. |
| 22 | Tenant exercised an early termination option. |
| 23 | Property held for sale at 9/30/2018. |
| 24 | Subsequent to 9/30/2018, ECMC Group paid $1.5 million to terminate its lease and a new 10 year and five month lease was signed with CardWorks Servicing. |
| 25 | Property sold subsequent to 9/30/2018. |
LEXINGTON REALTY TRUST
Select Credit Metrics Summary(1)
| | | 9/30/2018 | |
| | | | |
| Adjusted Company FFO Payout Ratio | | | 72.0 | % |
| | | | | |
| Unencumbered Assets | | | $2.8 billion | |
| | | | | |
| Unencumbered NOI | | | 72.0 | % |
| | | | | |
| (Debt + Preferred) / Gross Assets | | | 42.3 | % |
| | | | | |
| Debt/Gross Assets | | | 40.0 | % |
| | | | | |
| Secured Debt / Gross Assets | | | 14.1 | % |
| | | | | |
| Net Debt / Adjusted EBITDA | | | 4.3 | x |
| | | | | |
| (Net Debt + Preferred) / Adjusted EBITDA | | | 4.7 | x |
| | | | | |
| Credit Facilities Availability(2) | | | $505.0 million | |
| | | | | |
| Unsecured Debt / Unencumbered NOI | | | 5.5 | x |
Footnotes
| (1) | See reconciliations of non-GAAP measures in this document. Lexington believes these credit metrics provide investors with additional information to evaluate its liquidity and performance. |
| (2) | Subject to covenant compliance. |
LEXINGTON REALTY TRUST
FINANCIAL COVENANTS(1)
Corporate Level Debt
| | | Must be: | | | 9/30/2018 | |
| Bank Loans: | | | | | | | | |
| | | | | | | | | |
| Maximum Leverage | | | <60% | | | | 40.1 | % |
| Fixed Charge Coverage | | | >1.5x | | | | 2.6 | x |
| Recourse Secured Indebtedness Ratio | | | <10% cap value | | | | 0.0 | % |
| Secured Indebtedness Ratio | | | <45% | | | | 19.7 | % |
| Unsecured Debt Service Coverage | | | >2.0x | | | | 4.8 | x |
| Unencumbered Leverage | | | <60% | | | | 26.2 | % |
| | | | | | | | | |
| Bonds: | | | | | | | | |
| | | | | | | | | |
| Debt to Total Assets | | | <60% | | | | 40.8 | % |
| Secured Debt to Total Assets | | | <40% | | | | 14.4 | % |
| Debt Service Coverage | | | >1.5x | | | | 3.7 | x |
| Unencumbered Assets to Unsecured Debt | | | >150% | | | | 297.7 | % |
Footnotes
| (1) | The following is a summary of the key financial covenants for Lexington's credit facility and term loans and senior notes, as defined and calculated per the terms of the credit facility and term loans and senior notes, as applicable. These calculations are presented to show Lexington's compliance with such covenants only and are not measures of Lexington's liquidity or performance. |
LEXINGTON REALTY TRUST
Consolidated Properties: Mortgages and Notes Payable
9/30/2018
| Property | | Footnotes | | | Debt
Balance
($000) | | | Interest
Rate
(%) | | | Maturity(a) | | Current
Estimated Annual
Debt Service
($000)(c) | | | Balloon
Payment
($000) | |
| INDUSTRIAL | | | | | | | | | | | | | | | | | | | | | | |
| North Berwick, ME | | | | | | $ | 883 | | | | 3.560 | % | | 04/2019 | | $ | 894 | | | $ | - | |
| Streetsboro, OH | | | | | | | 16,688 | | | | 5.749 | % | | 09/2019 | | | 1,306 | | | | 16,338 | |
| Lavonia, GA | | | | | | | 6,740 | | | | 5.460 | % | | 12/2020 | | | 741 | | | | 5,895 | |
| Chester, SC | | | | | | | 6,764 | | | | 5.380 | % | | 08/2025 | | | 1,144 | | | | 362 | |
| Richland, WA | | | | | | | 110,000 | | | | 4.000 | % | | 01/2026 | | | 4,400 | | | | 99,492 | |
| Long Island City, NY | | | | | | | 40,862 | | | | 3.500 | % | | 03/2028 | | | 4,879 | | | | - | |
| Warren, MI | | | | | | | 25,850 | | | | 5.380 | % | | 11/2032 | | | 1,391 | | | | 22,037 | |
| | | | | | | $ | 207,787 | | | | 4.304 | % | | 7.8 | | $ | 14,755 | | | $ | 144,124 | |
| | | | | | | | | | | | | | | | | | | | | | | |
| OFFICE | | | | | | | | | | | | | | | | | | | | | | |
| Overland Park, KS | | | | | | $ | 32,297 | | | | 5.891 | % | | 05/2019 | | $ | 1,705 | | | $ | 31,812 | |
| Kansas City, MO | | | | | | | 15,388 | | | | 5.883 | % | | 05/2019 | | | 813 | | | | 15,179 | |
| Columbus, IN | | | | | | | 8,826 | | | | 2.210 | % | | 07/2019 | | | 3,971 | | | | 4,993 | |
| Meridian, ID | | | | | | | 8,077 | | | | 6.010 | % | | 08/2019 | | | 650 | | | | 7,675 | |
| Lenexa, KS | | | | | | | 8,265 | | | | 6.270 | % | | 12/2019 | | | 774 | | | | 7,770 | |
| Boca Raton, FL | | | | | | | 18,862 | | | | 6.470 | % | | 02/2020 | | | 1,542 | | | | 18,414 | |
| Oakland, ME | | | | | | | 8,202 | | | | 5.930 | % | | 10/2020 | | | 750 | | | | 7,660 | |
| Wall, NJ | | | | | | | 8,847 | | | | 6.250 | % | | 01/2021 | | | 3,774 | | | | - | |
| Whippany, NJ | | | | | | | 12,297 | | | | 6.298 | % | | 11/2021 | | | 1,344 | | | | 10,400 | |
| Palo Alto, CA | | | | | | | 33,624 | | | | 3.970 | % | | 12/2023 | | | 7,059 | | | | - | |
| Lenexa, KS | | | | | | | 32,112 | | | | 3.700 | % | | 11/2027 | | | 3,106 | | | | 10,000 | |
| Lake Jackson, TX | | | | | | | 189,145 | | | | 4.040 | % | | 10/2036 | | | 12,347 | | | | 11,305 | |
| | | | | | | $ | 375,942 | | | | 4.577 | % | | 10.7 | | $ | 37,835 | | | $ | 125,208 | |
| OTHER | | | | | | | | | | | | | | | | | | | | | | |
| Charleston, SC | | | | | | $ | 6,906 | | | | 5.850 | % | | 02/2021 | | $ | 520 | | | $ | 6,632 | |
| | | | | | | $ | 6,906 | | | | 5.850 | % | | 2.3 | | $ | 520 | | | $ | 6,632 | |
| | | | | | | | | | | | | | | | | | | | | | | |
| Subtotal/Wtg. Avg./Years Remaining(i) | | | | | | $ | 590,635 | | | | 4.496 | % | | 9.6 | | $ | 53,110 | | | $ | 275,964 | |
LEXINGTON REALTY TRUST
Consolidated Properties: Mortgages and Notes Payable
9/30/2018
| Property | | Footnotes | | | Debt
Balance
($000) | | | Interest
Rate
(%) | | | Maturity(a) | | Current
Estimated Annual
Debt Service
($000)(c) | | | Balloon
Payment
($000) | |
| Corporate(f) | | | | | | | | | | | | | | | | | | | | | | |
| Term Loan | | | (b)(g) | | | $ | 149,000 | | | | 3.240 | % | | 08/2020 | | $ | 4,895 | | | $ | 149,000 | |
| Term Loan | | | (h) | | | | 300,000 | | | | 2.625 | % | | 01/2021 | | | 7,984 | | | | 300,000 | |
| Senior Notes | | | | | | | 250,000 | | | | 4.250 | % | | 06/2023 | | | 10,625 | | | | 250,000 | |
| Senior Notes | | | | | | | 250,000 | | | | 4.400 | % | | 06/2024 | | | 11,000 | | | | 250,000 | |
| Trust Preferred Notes | | | (d) | | | | 129,120 | | | | 4.039 | % | | 04/2037 | | | 5,288 | | | | 129,120 | |
| Subtotal/Wtg. Avg./Years Remaining(i) | | | | | | $ | 1,078,120 | | | | 3.668 | % | | 5.5 | | $ | 39,792 | | | $ | 1,078,120 | |
| Total/Wtg. Avg./Years Remaining(i) | | | (e) | | | $ | 1,668,755 | | | | 3.961 | % | | 6.9 | | $ | 92,902 | | | $ | 1,354,084 | |
Footnotes
| (a) | Subtotal and total based on weighted-average term to maturity shown in years based on debt balance. |
| (b) | Term loan satisfied subsequent to 9/30/18. |
| (c) | Remaining payments for debt with less than 12 months to maturity, all others are debt service for next 12 months. |
| (d) | Rate is three month LIBOR plus 170 bps. |
| (e) | See reconciliations of non-GAAP measures in this document. |
| (g) | Rate ranges from LIBOR plus 0.90% to 1.75%. LIBOR rate was fixed at 1.09% through February 2018 via interest rate swap agreements on the then $250.0 million of borrowings. |
| (h) | Rate ranges from LIBOR plus 0.90% to 1.75%. LIBOR rate fixed at 1.42% through January 2019 via interest rate swap agreements on $255.0 million of borrowings. |
| (i) | Total shown may differ from detailed amounts due to rounding. |
LEXINGTON REALTY TRUST
Debt Maturity Schedule
9/30/2018
($000)
| Consolidated Properties |
| Year | | Mortgage
Scheduled
Amortization | | | Mortgage
Balloon
Payments | | | Corporate Debt | |
| 2018 - remaining | | $ | 6,560 | | | $ | - | | | $ | - | |
| 2019 | | | 26,681 | | | | 83,767 | | | | - | |
| 2020 | | | 23,174 | | | | 31,969 | | | | 149,000 | |
| 2021 | | | 23,433 | | | | 17,032 | | | | 300,000 | |
| 2022 | | | 22,120 | | | | - | | | | - | |
| | | $ | 101,968 | | | $ | 132,768 | | | $ | 449,000 | |
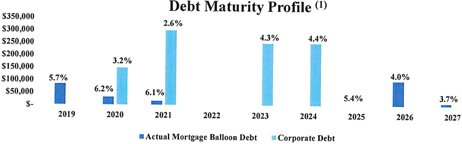
Footnotes
| (1) | Percentage denotes weighted-average interest rate. |
LEXINGTON REALTY TRUST
Selected Balance Sheet Account Data
9/30/2018
($000)
| Balance Sheet | |
| | | | |
| Other assets | | $ | 10,853 | |
| | | | | |
| The components of other assets are: | | | | |
| | | | | |
| Deposits | | $ | 200 | |
| Equipment | | | 480 | |
| Prepaids | | | 1,530 | |
| Other receivables | | | 1,345 | |
| Deferred lease incentives | | | 6,646 | |
| Interest rate swap derivative asset | | | 652 | |
| | | | | |
| Accounts payable and other liabilities | | | | |
| | | | | |
| The components of accounts payable and other liabilities are: | | $ | 29,239 | |
| | | | | |
| Accounts payable and accrued expenses | | $ | 15,605 | |
| CIP accruals and other | | | 3,625 | |
| Taxes | | | 352 | |
| Deferred lease costs | | | 6,128 | |
| Deposits | | | 1,512 | |
| Escrows | | | 488 | |
| Transaction costs | | | 1,529 | |
LEXINGTON REALTY TRUST
NON-GAAP MEASURES
DEFINITIONS
Lexington has used non-GAAP financial measures as defined by the Securities and Exchange Commission Regulation G in the Quarterly Earnings Press Release, in this Quarterly Supplemental Information and in other public disclosures.
Lexington believes that the measures defined below are helpful to investors in measuring our performance or that of an individual investment. Since these measures exclude certain items which are included in their respective most comparable Generally Accepted Accounting Principles (“GAAP”) measures, reliance on the measures has limitations; management compensates for these limitations by using the measures simply as supplemental measures that are weighed in balance with other GAAP measures. These measures are not necessarily indications of our cash flow available to fund cash needs. Additionally, they should not be used as an alternative to the respective most comparable GAAP measures when evaluating Lexington's financial performance or cash flow from operating, investing, or financing activities or liquidity.
Definitions:
Adjusted EBITDA: Adjusted EBITDA represents EBITDA (earnings before interest, taxes, depreciation and amortization) modified to include other adjustments to GAAP net income for gains on sales of properties, impairment charges, debt satisfaction gains (charges), net, non-cash charges, net, straight-line adjustments, non-recurring charges and adjustments for pro-rata share of non-wholly owned entities. Lexington’s calculation of Adjusted EBITDA may not be comparable to similarly titled measures used by other companies. Lexington believes that net income is the most directly comparable GAAP measure to Adjusted EBITDA.
Cash Rent: Cash Rent is calculated by making adjustments to GAAP rent to remove the impact of GAAP required adjustments to rental income such as adjustments for straight-line rents related to free rent periods and contractual rent increases. Cash Rent excludes lease termination income. Lexington believes Cash Rent provides a meaningful indication of an investments ability to fund cash needs.
Funds from Operations (“FFO”) and Adjusted Company FFO: Lexington believes that Funds from Operations, or FFO, which is a non-GAAP measure, is a widely recognized and appropriate measure of the performance of an equity real estate investment trust (“REIT”). Lexington believes FFO is frequently used by securities analysts, investors and other interested parties in the evaluation of REITs, many of which present FFO when reporting their results. FFO is intended to exclude GAAP historical cost depreciation and amortization of real estate and related assets, which assumes that the value of real estate diminishes ratably over time. Historically, however, real estate values have risen or fallen with market conditions. As a result, FFO provides a performance measure that, when compared year over year, reflects the impact to operations from trends in occupancy rates, rental rates, operating costs, development activities, interest costs and other matters without the inclusion of depreciation and amortization, providing perspective that may not necessarily be apparent from net income.
The National Association of Real Estate Investment Trusts, or NAREIT, defines FFO as “net income (or loss) computed in accordance with GAAP, excluding gains (or losses) from sales of property, plus real estate depreciation and amortization and after adjustments for non-consolidated partnerships and joint ventures.” NAREIT clarified its computation of FFO to exclude impairment charges on depreciable real estate owned directly or indirectly. FFO does not represent cash generated from operating activities in accordance with GAAP and is not indicative of cash available to fund cash needs.
Lexington presents FFO available to common shareholders and unitholders - basic and also presents FFO available to all equityholders and unitholders - diluted on a company-wide basis as if all securities that are convertible, at the holder's option, into Lexington’s common shares, are converted at the beginning of the period. Lexington also presents Adjusted Company FFO available to all equityholders and unitholders - diluted which adjusts FFO available to all equityholders and unitholders - diluted for certain items which we believe are not indicative of the operating results of Lexington's real estate portfolio. Lexington believes this is an appropriate presentation as it is frequently requested by security analysts, investors and other interested parties. Since others do not calculate these measures in a similar fashion, these measures may not be comparable to similarly titled measures as reported by others. These measures should not be considered as an alternative to net income as an indicator of Lexington’s operating performance or as an alternative to cash flow as a measure of liquidity.
GAAP and Cash Yield or Capitalization Rate: GAAP and cash yields or capitalization rates are measures of operating performance used to evaluate the individual performance of an investment. These measures are estimates and are not presented or intended to be viewed as a liquidity or performance measure that present a numerical measure of Lexington's historical or future financial performance, financial position or cash flows. The yield or capitalization rate is calculated by dividing the annualized NOI (as defined below, except GAAP rent adjustments are added back to rental income to calculate GAAP yield or capitalization rate) the investment is expected to generate (or has generated) by the acquisition/completion cost (or sale) price.
LEXINGTON REALTY TRUST
NON-GAAP MEASURES
DEFINITIONS (CONTINUED)
Net Operating Income (NOI): NOI is a measure of operating performance used to evaluate the individual performance of an investment. This measure is not presented or intended to be viewed as a liquidity or performance measure that presents a numerical measure of Lexington's historical or future financial performance, financial position or cash flows. Lexington defines NOI as operating revenues (rental income (less GAAP rent adjustments and lease termination income), tenant reimbursements and other property income) less property operating expenses. Other REITs may use different methodologies for calculating NOI, and accordingly, Lexington's NOI may not be comparable to that of other companies. Because NOI excludes general and administrative expenses, interest expense, depreciation and amortization, acquisition-related expenses, other nonproperty income and losses, and gains and losses from property dispositions, it provides a performance measure that, when compared year over year, reflects the revenues and expenses directly associated with owning and operating commercial real estate and the impact to operations from trends in occupancy rates, rental rates, and operating costs, providing a perspective on operations not immediately apparent from net income. Lexington believes that net income is the most directly comparable GAAP measure to NOI.
Same-Store NOI: Same-Store NOI represents the NOI for consolidated properties that were owned and included in our portfolio for two comparable reporting periods excluding properties encumbered by mortgage loans in default and the revenue associated with the expansion of properties, as applicable. As Same-Store NOI excludes the change in NOI from acquired and disposed of properties, it highlights operating trends such as occupancy levels, rental rates and operating costs on properties. Other REITs may use different methodologies for calculating Same-Store NOI, and accordingly, Lexington's Same-Store NOI may not be comparable to other REITs. Management believes that Same-Store NOI is a useful supplemental measure of Lexington's operating performance. However, Same-Store NOI should not be viewed as an alternative measure of Lexington 's financial performance since it does not reflect the operations of Lexington's entire portfolio, nor does it reflect the impact of general and administrative expenses, acquisition-related expenses, interest expense, depreciation and amortization costs, other nonproperty income and losses, the level of capital expenditures and leasing costs necessary to maintain the operating performance of Lexington's properties, or trends in development and construction activities which are significant economic costs and activities that could materially impact Lexington's results from operations. Lexington believes that net income is the most directly comparable GAAP measure to Same-Store NOI.
LEXINGTON REALTY TRUST
RECONCILIATION OF NON-GAAP MEASURES
($000)
| | | Nine months ended
September 30, 2018 | |
| | | | |
| Cash Rent Reconciliation: | | | | |
| | | | | |
| Rental revenue as reported | | $ | 283,986 | |
| | | | | |
| Rental revenue from sold properties | | | (51,860 | ) |
| Lease termination income | | | (925 | ) |
| | | | | |
| GAAP rent per supplement | | | 231,201 | |
| | | | | |
| GAAP rent adjustments:(1) | | | | |
| Straight-line adjustments | | | (12,275 | ) |
| Lease incentives | | | 690 | |
| Amortization of above/below market leases | | | (6,521 | ) |
| | | | | |
| Cash rent per supplement | | $ | 213,095 | |
Consolidated debt reconciliation September 30, 2018:
| | | GAAP Balance | | | Deferred Loan
Costs, net | | | Discounts | | | Gross Balance | |
| | | | | | | | | | | | | |
| Mortgages and notes payable(2) | | $ | 585,369 | | | $ | 5,266 | | | $ | - | | | $ | 590,635 | |
| Revolving credit facility borrowings(3) | | | - | | | | - | | | | - | | | | - | |
| Term loans payable(3) | | | 447,099 | | | | 1,901 | | | | - | | | | 449,000 | |
| Senior notes payable(3) | | | 495,825 | | | | 2,872 | | | | 1,303 | | | | 500,000 | |
| Trust preferred securities(3) | | | 127,271 | | | | 1,849 | | | | - | | | | 129,120 | |
| Consolidated debt | | $ | 1,655,564 | | | $ | 11,888 | | | $ | 1,303 | | | $ | 1,668,755 | |
Footnotes
| (1) | Individual items are adjusted for sold properties, which were previously reflected in the reconciliation. |
LEXINGTON REALTY TRUST
RECONCILIATION OF NON-GAAP MEASURES (CONTINUED)
($000)
Same-Store NOI Reconciliation:
| | | Nine months ended September 30, | |
| | | 2018 | | | 2017 | |
| | | | | | | |
| Net Income | | $ | 205,232 | | | $ | 55,181 | |
| | | | | | | | | |
| Interest and amortization expense | | | 63,224 | | | | 57,828 | |
| Provision for income taxes | | | 1,326 | | | | 1,174 | |
| Depreciation and amortization | | | 129,693 | | | | 128,706 | |
| General and administrative | | | 23,899 | | | | 25,561 | |
| Litigation reserve | | | - | | | | 2,050 | |
| Pursuit / transaction costs | | | 205 | | | | 1,100 | |
| Non-operating income | | | (1,666 | ) | | | (4,997 | ) |
| Gains on sales of properties | | | (239,577 | ) | | | (55,078 | ) |
| Impairment charges and loan loss | | | 90,860 | | | | 43,577 | |
| Debt satisfaction (gains) charges, net | | | 2,228 | | | | (2,378 | ) |
| Equity in (earnings) losses of non-consolidated entities | | | (192 | ) | | | 1,064 | |
| Lease termination income | | | (925 | ) | | | (2,934 | ) |
| Straight-line adjustments | | | (16,246 | ) | | | (12,552 | ) |
| Lease incentives | | | 1,459 | | | | 1,456 | |
| Amortization of above/below market leases | | | (6,632 | ) | | | 1,180 | |
| | | | | | | | | |
| Net Operating Income - ("NOI") | | | 252,888 | | | | 240,938 | |
| | | | | | | | | |
| Less NOI: | | | | | | | | |
| Acquisitions and dispositions | | | (79,160 | ) | | | (67,974 | ) |
| | | | | | | | | |
| Same-Store NOI | | $ | 173,728 | | | $ | 172,964 | |
NOI for NAV:
| | | Nine months ended | |
| | | September 30, 2018 | |
| | | | |
| NOI per above | | $ | 252,888 | |
| Less NOI: | | | | |
| Disposed of properties | | | (48,198 | ) |
| Assets held for sale | | | (10,668 | ) |
| Assets acquired in 2018 | | | (3,385 | ) |
| Assets less than 70% leased / Other | | | (1,168 | ) |
| NOI for NAV | | $ | 189,469 | |
LEXINGTON REALTY TRUST
RECONCILIATION OF NON-GAAP MEASURES (CONTINUED)
($000)
Reconciliation to Adjusted EBITDA:
| | | Three months ended | | | | |
| | | 9/30/2018 | | | 6/30/2018 | | | 3/31/2018 | | | 12/31/2017 | | | Trailing 12 Months | |
| | | | | | | | | | | | | | | | |
| Net income (loss) attributable to Lexington Realty Trust shareholders | | $ | 218,016 | | | $ | (1,694 | ) | | $ | (14,315 | ) | | $ | 30,850 | | | $ | 232,857 | |
| Interest and amortization expense | | | 21,159 | | | | 21,734 | | | | 20,331 | | | | 20,055 | | | | 83,279 | |
| Provision for income taxes | | | 444 | | | | 379 | | | | 503 | | | | 743 | | | | 2,069 | |
| Depreciation and amortization | | | 37,716 | | | | 45,440 | | | | 46,537 | | | | 45,262 | | | | 174,955 | |
| Straight-line adjustments | | | (5,367 | ) | | | (6,013 | ) | | | (4,866 | ) | | | (7,232 | ) | | | (23,478 | ) |
| Lease incentives | | | 404 | | | | 519 | | | | 536 | | | | 513 | | | | 1,972 | |
| Amortization of above/below market leases | | | (3,384 | ) | | | (3,226 | ) | | | (22 | ) | | | 364 | | | | (6,268 | ) |
| Gains on sales of properties | | | (202,371 | ) | | | (14,432 | ) | | | (22,774 | ) | | | (8,350 | ) | | | (247,927 | ) |
| Impairment charges and loan loss | | | 2,542 | | | | 35,269 | | | | 53,049 | | | | 1,419 | | | | 92,279 | |
| Debt satisfaction (gains) charges, net | | | 2,228 | | | | - | | | | - | | | | (3,818 | ) | | | (1,590 | ) |
| Unearned contingent acquisition consideration | | | - | | | | - | | | | - | | | | (3,922 | ) | | | (3,922 | ) |
| Non-cash charges, net | | | 1,635 | | | | 1,625 | | | | 1,939 | | | | 2,119 | | | | 7,318 | |
| | | | | | | | | | | | | | | | | | | | | |
| Pro-rata share adjustments: | | | | | | | | | | | | | | | | | | | | |
| Non-consolidated entities adjustment | | | 1,388 | | | | 449 | | | | 445 | | | | 341 | | | | 2,623 | |
| Noncontrolling interests adjustment | | | 2,580 | | | | 644 | | | | (723 | ) | | | 345 | | | | 2,846 | |
| | | | | | | | | | | | | | | | | | | | | |
| Adjusted EBITDA | | $ | 76,990 | | | $ | 80,694 | | | $ | 80,640 | | | $ | 78,689 | | | $ | 317,013 | |
LEXINGTON REALTY TRUST
RECONCILIATION OF NON-GAAP MEASURES (CONTINUED)
($000)
Reconciliation of Select Credit Metrics:
| Adjusted Company FFO Payout: | | Nine months ended
September 30, 2018 | | | (Debt + Preferred) / Gross Assets: | | Nine months ended
September 30, 2018 | |
| Common share dividends per share | | $ | 0.5325 | | | Consolidated debt | | $ | 1,655,564 | |
| Adjusted Company FFO per diluted share | | | 0.74 | | | Preferred shares liquidation preference | | | 96,770 | |
| Adjusted Company FFO payout ratio | | | 72.0 | % | | Debt and preferred | | $ | 1,752,334 | |
| | | | | | | | | | | |
| Unencumbered Assets: | | | | | | Total assets | | $ | 3,171,940 | |
| Real estate, at cost | | $ | 3,424,227 | | | Plus depreciation and amortization: | | | | |
| held for sale real estate, at cost | | | 141,231 | | | Real estate | | | 934,096 | |
| less encumbered real estate, at cost | | | (797,382 | ) | | Deferred lease costs | | | 19,074 | |
| Unencumbered assets | | $ | 2,768,076 | | | Held for sale assets | | | 14,217 | |
| | | | | | | | | | | |
| Unencumbered NOI: | | | | | | Gross assets | | $ | 4,139,327 | |
| NOI | | $ | 252,888 | | | | | | | |
| Disposed of properties NOI | | | (48,198 | ) | | (Debt + Preferred) / Gross Assets | | | 42.3 | % |
| Adjusted NOI | | | 204,690 | | | | | | | |
| less encumbered adjusted NOI | | | (57,237 | ) | | Debt / Gross Assets: | | | | |
| Unencumbered adjusted NOI (Quarters) | | $ | 147,453 | | | Consolidated debt | | $ | 1,655,564 | |
| Unencumbered NOI % | | | 72.0 | % | | | | | | |
| | | | | | | Gross assets | | $ | 4,139,327 | |
| Net Debt / Adjusted EBITDA: | | | | | | | | | | |
| Adjusted EBITDA | | $ | 317,013 | | | Debt / Gross assets | | | 40.0 | % |
| | | | | | | | | | | |
| Consolidated debt | | $ | 1,655,564 | | | Secured Debt / Gross Assets: | | | | |
| less consolidated cash and cash equivalents(1) | | | (385,252 | ) | | Mortgages and notes payable | | $ | 585,369 | |
| Non-consolidated debt, net | | | 107,700 | | | | | | | |
| Net debt | | $ | 1,378,012 | | | Gross assets | | $ | 4,139,327 | |
| | | | | | | | | | | |
| Net debt / Adjusted EBITDA | | | 4.3 | x | | Secured Debt / Gross Assets | | | 14.1 | % |
| | | | | | | | | | | |
| (Net Debt + Preferred) / Adjusted EBITDA: | | | | | | Unsecured Debt / Unencumbered NOI: | | | | |
| Adjusted EBITDA | | $ | 317,013 | | | Consolidated debt | | $ | 1,655,564 | |
| | | | | | | less mortgages and notes payable | | | (585,369 | ) |
| Net debt | | $ | 1,378,012 | | | Unsecured Debt | | $ | 1,070,195 | |
| Preferred shares liquidation preference | | | 96,770 | | | | | | | |
| Net debt + preferred | | $ | 1,474,782 | | | Unencumbered adjusted NOI (Annual) | | $ | 193,850 | |
| | | | | | | | | | | |
| (Net Debt + Preferred) / Adjusted EBITDA | | | 4.7 | x | | Unsecured Debt / Unencumbered NOI | | | 5.5 | x |
Footnotes
| (1) | Includes funds held at 1031 exchange intermediaries. |
Investor Information
| Computershare | Overnight Correspondence: |
| PO Box 505000 | 462 South 4th Street, Suite 1600 |
| Louisville, KY 40233 | Louisville, KY 40202 |
| (800) 850-3948 | |
| www-us.computershare.com/investor | |
| Heather Gentry | |
| Senior Vice President, Investor Relations | |
| Telephone (direct) | (212) 692-7219 |
| Facsimile (main) | (212) 594-6600 |
| E-mail | hgentry@lxp.com |
| Bank of America/Merrill Lynch | | Jeffries & Company, Inc. | |
| James Feldman | (646) 855-5808 | Jon Peterson | (212) 284-1705 |
| | | | |
| Barclays Capital | | KeyBanc Capital Markets Inc. | |
| Ross L. Smotrich | (212) 526-2306 | Craig Mailman | (917) 368-2316 |
| | | | |
| D.A. Davidson | | Ladenburg Thalmann & Co., Inc. | |
| Barry Oxford | (212) 240-9871 | John Massocca | (212) 409-2543 |
| | | | |
| Evercore Partners | | Stifel Nicolaus | |
| Sheila K. McGrath | (212) 497-0882 | John W. Guinee | (443) 224-1307 |
| | | | |
| J.P. Morgan Chase | | Wells Fargo Securities, LLC | |
| Anthony Paolone | (212) 622-6682 | Todd J. Stender | (562) 637-1371 |

LEXINGTON REALTY TRUST
One Penn Plaza, Suite 4015 | New York, NY 10119-4015 | (212) 692-7200 | www.lxp.com