Exhibit 99.2
TABLE OF CONTENTS
September 30, 2021
| | PAGE |
| | |
| SUMMARY / HIGHLIGHTS | 3 |
| | |
| FINANCIAL DATA | |
| CONSOLIDATED BALANCE SHEETS | 4 |
| CONSOLIDATED STATEMENTS OF OPERATIONS | 5 |
| NON-GAAP FINANCIAL DATA | 6 |
| SELECT CREDIT METRICS SUMMARY | 10 |
| OTHER FINANCIAL DATA | 11 |
| | |
| CAPITAL DEPLOYMENT / RECYCLING | |
| QUARTERLY INVESTMENTS / CAPITAL RECYCLING | 12 |
| DEVELOPMENT SUMMARY | 13 |
| CAPITAL EXPENDITURES AND LEASING COSTS | 14 |
| | |
| PORTFOLIO DATA | |
| PORTFOLIO DATA | 15 |
| SAME STORE DATA | 16 |
| PORTFOLIO DETAIL BY ASSET CLASS | 17 |
| PORTFOLIO COMPOSITION | 18 |
| INDUSTRIAL MARKETS AND INDUSTRIES | 19 |
| INDUSTRIAL PORTFOLIO DETAIL | 20 |
| | PAGE |
| | |
| TENANT DATA | |
| TOP 15 TENANTS | 21 |
| QUARTERLY LEASING SUMMARY | 22 |
| LEASE ROLLOVER SCHEDULES | 24 |
| PROPERTY LEASES AND VACANCIES | 26 |
| | |
| DEBT | |
| MORTGAGES AND NOTES PAYABLE | 37 |
| DEBT MATURITY SCHEDULE | 39 |
| DEBT COVENANTS | 40 |
| | |
| COMPONENTS OF NET ASSET VALUE | 41 |
| | |
| NON-GAAP MEASURES DEFINITIONS | 42 |
| | |
| INVESTOR INFORMATION | 46 |
This Quarterly Supplemental Information contains certain forward-looking statements which involve known and unknown risks, uncertainties or other factors not under the control of Lexington Realty Trust (“Lexington”), which may cause actual results, performance or achievements of Lexington and its subsidiaries to be materially different from the results, performance, or other expectations implied by these forward-looking statements. Factors that could cause or contribute to such differences include, but are not limited to, those discussed under the headings “Management’s Discussion and Analysis of Financial Condition and Results of Operations” and “Risk Factors” in Lexington’s periodic reports filed with the Securities and Exchange Commission, including, but not limited to, risks related to: (1) the potential adverse impact on Lexington or its tenants from the novel coronavirus (COVID-19), (2) the authorization of Lexington’s Board of Trustees of future dividend declarations, (3) the successful consummation of any lease, acquisition, build-to-suit, development project, disposition, financing or other transaction on the terms described herein or at all, (4) the failure to continue to qualify as a real estate investment trust, (5) changes in general business and economic conditions, including the impact of any new legislation, (6) competition, (7) increases in real estate construction costs, (8) changes in interest rates, (9) changes in accessibility of debt and equity capital markets, and (10) future impairment charges. Copies of the periodic reports Lexington files with the Securities and Exchange Commission are available on Lexington’s web site at www.lxp.com. Forward-looking statements, which are based on certain assumptions and describe Lexington’s future plans, strategies and expectations, are generally identifiable by use of the words “believes,” “expects,” “intends,” “anticipates,” “estimates,” “projects,” may,” “plans,” “predicts,” “will,” “will likely result,” “is optimistic,” “goal,” “objective” or similar expressions. Except as required by law, Lexington undertakes no obligation to revise those forward-looking statements to reflect events or circumstances after the occurrence of unanticipated events. Accordingly, there is no assurance that Lexington’s expectations will be realized.
See definitions of non-GAAP measures and reconciliations to applicable GAAP measures in this document.
SUMMARY / HIGHLIGHTS
September 30, 2021
Lexington is a real estate investment trust (“REIT”) focused on single-tenant industrial real estate investments. Lexington has been a publicly traded REIT since 1993 (NYSE: LXP). Lexington’s investment strategy is focused on the acquisition and development of high quality and well-located industrial warehouse and distribution facilities. Lexington announced an increase in the annualized dividend to $0.48 per common share.
| | | | |
| Quarterly Highlights | | Portfolio Statistics |
| | | | |
| - Net Income - $0.02 per diluted common share | | # of Properties: | 138 |
| | | | |
| - Adjusted Company FFO - $0.19 per diluted common share | | # of States: | 28 |
| | | | |
| - Completed 2.6 million square feet of new leases and lease extensions | | Square Footage: | 57.7 million |
| | | | |
| - Acquired five warehouse/distribution properties for an aggregate cost of $134.8 million | | Ongoing Development Projects: | 8 |
| | | | |
| - Commenced development of five warehouse/distribution properties comprising an aggregate of 2.8 million square feet in the Greenville-Spartanburg, South Carolina and Phoenix, Arizona markets | | Stabilized Portfolio% Leased: | 98.9% |
| | | | |
| - Invested an aggregate of $57.3 million in eight ongoing development projects | | # of Leases: | 164 |
| | | | |
| - Disposed of three properties for an aggregate gross disposition price of $35.4 million | | % Industrial: | 94.9% |
| | | | |
| -Issued $400.0 million aggregate principal amount of 2.375% Senior Notes due 2031 and redeemed all$188.8 million aggregate principal amount of 4.25% Senior Notes due 2023 | | Weighted-Average Lease Term (Cash Basis): | 6.6 years |
| | | | |
| - Net Debt to Adjusted EBITDA ratio was 5.4x at quarter end | | Weighted-Average Age: | 11.5 years |
| | | | |
CONSOLIDATED BALANCE SHEETS
(Unaudited and in thousands, except share and per share data)
| | | September 30, 2021 | | | December 31, 2020 | |
| Assets: | | | | | | |
| Real estate, at cost | | $ | 3,721,870 | | | $ | 3,514,564 | |
| Real estate - intangible assets | | | 402,365 | | | | 409,293 | |
| Investments in real estate under construction | | | 185,704 | | | | 75,906 | |
| Real estate, gross | | | 4,309,939 | | | | 3,999,763 | |
| Less: accumulated depreciation and amortization | | | 911,410 | | | | 884,465 | |
| Real estate, net | | | 3,398,529 | | | | 3,115,298 | |
| Assets held for sale | | | 30,145 | | | | 16,530 | |
| Right-of-use assets, net | | | 29,067 | | | | 31,423 | |
| Cash and cash equivalents | | | 150,077 | | | | 178,795 | |
| Restricted cash | | | 373 | | | | 626 | |
| Investments in non-consolidated entities | | | 51,021 | | | | 56,464 | |
| Deferred expenses, net | | | 13,289 | | | | 15,901 | |
| Rent receivable - current | | | 1,998 | | | | 2,899 | |
| Rent receivable - deferred | | | 71,317 | | | | 66,959 | |
| Other assets | | | 12,661 | | | | 8,331 | |
| Total assets | | $ | 3,758,477 | | | $ | 3,493,226 | |
| | | | | | | | | |
| Liabilities and Equity: | | | | | | | | |
| Liabilities: | | | | | | | | |
| Mortgages and notes payable, net | | $ | 115,633 | | | $ | 136,529 | |
| Term loan payable, net | | | 298,320 | | | | 297,943 | |
| Senior notes payable, net | | | 987,590 | | | | 779,275 | |
| Trust preferred securities, net | | | 127,570 | | | | 127,495 | |
| Dividends payable | | | 34,283 | | | | 35,401 | |
| Liabilities held for sale | | | 1,122 | | | | 790 | |
| Operating lease liabilities | | | 30,109 | | | | 32,515 | |
| Accounts payable and other liabilities | | | 59,681 | | | | 55,208 | |
| Accrued interest payable | | | 5,638 | | | | 6,334 | |
| Deferred revenue - including below market leases, net | | | 15,490 | | | | 17,264 | |
| Prepaid rent | | | 14,679 | | | | 13,335 | |
| Total liabilities | | | 1,690,115 | | | | 1,502,089 | |
| | | | | | | | | |
| Commitments and contingencies | | | | | | | | |
| Equity: | | | | | | | | |
| Preferred shares, par value $0.0001 per share; authorized 100,000,000 shares: | | | | | | | | |
| Series C Cumulative Convertible Preferred, liquidation preference $96,770; 1,935,400 shares issues and outstanding | | | 94,016 | | | | 94,016 | |
| Common shares, par value $0.0001 per share; authorized 400,000,000 shares, 282,638,707 and 277,152,450 shares issued and outstanding in 2021 and 2020, respectively | | | 28 | | | | 28 | |
| Additional paid-in-capital | | | 3,239,850 | | | | 3,196,315 | |
| Accumulated distributions in excess of net income | | | (1,276,134 | ) | | | (1,301,726 | ) |
| Accumulated other comprehensive loss | | | (10,891 | ) | | | (17,963 | ) |
| Total shareholders’ equity | | | 2,046,869 | | | | 1,970,670 | |
| Noncontrolling interests | | | 21,493 | | | | 20,467 | |
| Total equity | | | 2,068,362 | | | | 1,991,137 | |
| Total liabilities and equity | | $ | 3,758,477 | | | $ | 3,493,226 | |
CONSOLIDATED STATEMENTS OF OPERATIONS
(Unaudited and in thousands, except share and per share data)
| | | Three months ending September 30, | | | Nine months ending September 30, | |
| | | 2021 | | | 2020 | | | 2021 | | | 2020 | |
| Gross revenues: | | | | | | | | | | | | | | | | |
| Rental revenue | | $ | 82,353 | | | $ | 83,592 | | | $ | 254,570 | | | $ | 243,421 | |
| Other revenue | | | 1,064 | | | | 922 | | | | 2,945 | | | | 3,712 | |
| Total gross revenues | | | 83,417 | | | | 84,514 | | | | 257,515 | | | | 247,133 | |
| Expenses applicable to revenues: | | | | | | | | | | | | | | | | |
| Depreciation and amortization | | | (45,359 | ) | | | (40,555 | ) | | | (130,579 | ) | | | (120,869 | ) |
| Property operating | | | (11,406 | ) | | | (11,343 | ) | | | (33,966 | ) | | | (31,895 | ) |
| General and administrative | | | (8,363 | ) | | | (7,232 | ) | | | (24,695 | ) | | | (22,612 | ) |
| Non-operating income | | | 472 | | | | 40 | | | | 953 | | | | 314 | |
| Interest and amortization expense | | | (12,210 | ) | | | (13,649 | ) | | | (35,170 | ) | | | (42,610 | ) |
| Debt satisfaction gains (losses), net | | | (13,222 | ) | | | 17,557 | | | | (13,222 | ) | | | 18,950 | |
| Impairment charges | | | (2,048 | ) | | | (6,175 | ) | | | (2,048 | ) | | | (7,792 | ) |
| Gains on sales of properties | | | 16,122 | | | | 20,878 | | | | 104,767 | | | | 41,876 | |
| Income before provision for income taxes and equity in earnings (losses) of non-consolidated entities | | | 7,403 | | | | 44,035 | | | | 123,555 | | | | 82,495 | |
| Provision for income taxes | | | (270 | ) | | | (286 | ) | | | (986 | ) | | | (1,361 | ) |
| Equity in earnings (losses) of non-consolidated entities | | | (75 | ) | | | (131 | ) | | | (249 | ) | | | 35 | |
| Net income | | | 7,058 | | | | 43,618 | | | | 122,320 | | | | 81,169 | |
| Less net income attributable to noncontrolling interests | | | (420 | ) | | | (1,714 | ) | | | (1,962 | ) | | | (2,245 | ) |
| Net income attributable to Lexington Realty Trust shareholders | | | 6,638 | | | | 41,904 | | | | 120,358 | | | | 78,924 | |
| Dividends attributable to preferred shares - Series C | | | (1,573 | ) | | | (1,573 | ) | | | (4,718 | ) | | | (4,718 | ) |
| Allocation to participating securities | | | (37 | ) | | | (46 | ) | | | (170 | ) | | | (118 | ) |
| Net income attributable to common shareholders | | $ | 5,028 | | | $ | 40,285 | | | $ | 115,470 | | | $ | 74,088 | |
| | | | | | | | | | | | | | | | | |
| Net income attributable to common shareholders - per common share basic | | $ | 0.02 | | | $ | 0.15 | | | $ | 0.42 | | | $ | 0.28 | |
| Weighted-average common shares outstanding - basic | | | 278,124,204 | | | | 274,696,046 | | | | 276,379,718 | | | | 264,211,668 | |
| | | | | | | | | | | | | | | | | |
| Net income attributable to common shareholders - per common share diluted | | $ | 0.02 | | | $ | 0.15 | | | $ | 0.41 | | | $ | 0.28 | |
| Weighted-average common shares outstanding - diluted | | | 282,048,458 | | | | 276,022,762 | | | | 278,581,849 | | | | 265,446,221 | |
NON-GAAP FINANCIAL DATA
(Unaudited and in thousands, except share and per share data)
| | | Three months ending September 30, | | | Nine months ending September 30, | |
| | | 2021 | | | 2020 | | | 2021 | | | 2020 | |
| FUNDS FROM OPERATIONS: | | | | | | | | | | | | | | | | |
| Basic and Diluted: | | | | | | | | | | | | | | | | |
| Net income attributable to common shareholders | | $ | 5,028 | | | $ | 40,285 | | | $ | 115,470 | | | $ | 74,088 | |
| Adjustments: | | | | | | | | | | | | | | | | |
| Depreciation and amortization | | | 44,652 | | | | 39,858 | | | | 128,442 | | | | 118,605 | |
| Impairment charges - real estate | | | 2,048 | | | | 6,175 | | | | 2,048 | | | | 7,792 | |
| Noncontrolling interest - OP units | | | 240 | | | | 1,518 | | | | 1,391 | | | | 1,702 | |
| Amortization of leasing commissions | | | 707 | | | | 697 | | | | 2,137 | | | | 2,264 | |
| Joint venture and noncontrolling interest adjustment | | | 2,115 | | | | 2,094 | | | | 6,344 | | | | 6,463 | |
| Gain on sales of properties, including non-consolidated entities | | | (16,122 | ) | | | (20,886 | ) | | | (104,767 | ) | | | (42,433 | ) |
| FFO available to common shareholders and unitholders - basic | | | 38,668 | | | | 69,741 | | | | 151,065 | | | | 168,481 | |
| Preferred dividends | | | 1,573 | | | | 1,573 | | | | 4,718 | | | | 4,718 | |
| Amount allocated to participating securities | | | 37 | | | | 46 | | | | 170 | | | | 118 | |
| FFO available to common equityholders and unitholders - diluted | | | 40,278 | | | | 71,360 | | | | 155,953 | | | | 173,317 | |
| Transaction costs | | | 64 | | | | 1 | | | | 205 | | | | 81 | |
| Debt satisfaction gains (losses), net, including non-consolidated entities | | | 13,222 | | | | (17,522 | ) | | | 13,222 | | | | (18,894 | ) |
| Adjusted Company FFO available to all equityholders and unitholders - diluted | | $ | 53,564 | | | $ | 53,839 | | | $ | 169,380 | | | $ | 154,504 | |
| | | | | | | | | | | | | | | | | |
| Per Common Share and Unit Amounts: | | | | | | | | | | | | | | | | |
| Basic: | | | | | | | | | | | | | | | | |
| FFO | | $ | 0.14 | | | $ | 0.25 | | | $ | 0.54 | | | $ | 0.63 | |
| | | | | | | | | | | | | | | | | |
| Diluted: | | | | | | | | | | | | | | | | |
| FFO | | $ | 0.14 | | | $ | 0.25 | | | $ | 0.55 | | | $ | 0.63 | |
| Adjusted Company FFO | | $ | 0.19 | | | $ | 0.19 | | | $ | 0.59 | | | $ | 0.57 | |
| | | | | | | | | | | | | | | | | |
| Weighted-Average Common Shares: | | | | | | | | | | | | | | | | |
| Basic: | | | | | | | | | | | | | | | | |
| Weighted-average common shares outstanding - basic EPS | | | 278,124,204 | | | | 274,696,046 | | | | 276,379,718 | | | | 264,211,668 | |
| Operating partnership units (1) | | | 1,161,757 | | | | 3,060,436 | | | | 2,263,105 | | | | 3,100,309 | |
| Weighted-average common shares outstanding - basic FFO | | | 279,285,961 | | | | 277,756,482 | | | | 278,642,823 | | | | 267,311,977 | |
| | | | | | | | | | | | | | | | | |
| Diluted: | | | | | | | | | | | | | | | | |
| Weighted-average common shares outstanding - diluted. EPS | | | 282,048,458 | | | | 276,022,762 | | | | 278,581,849 | | | | 265,446,221 | |
| Unvested share-based payments awards | | | 53,320 | | | | 19,261 | | | | 35,645 | | | | 19,813 | |
| Operating partnership units (1) | | | 1,161,757 | | | | 3,060,436 | | | | 2,263,105 | | | | 3,100,309 | |
| Preferred shares - Series C | | | 4,710,570 | | | | 4,710,570 | | | | 4,710,570 | | | | 4,710,570 | |
| Weighted-average common shares outstanding - diluted FFO | | | 287,974,105 | | | | 283,813,029 | | | | 285,591,169 | | | | 273,276,913 | |
| | | | | | | | | | | | | | | | | |
| (1) Includes OP units other than OP units held by Lexington. |
NON-GAAP FINANCIAL DATA (CONTINUED)
(Unaudited and in thousands)
| | | Three months ending September 30, | | | Nine months ending September 30, | |
| | | 2021 | | | 2020 | | | 2021 | | | 2020 | |
| Adjusted Company FFO available to all equityholders and unitholders - diluted | | $ | 53,564 | | | $ | 53,839 | | | $ | 169,380 | | | $ | 154,504 | |
| | | | | | | | | | | | | | | | | |
| FUNDS AVAILABLE FOR DISTRIBUTION | | | | | | | | | | | | | | | | |
| Adjustments: | | | | | | | | | | | | | | | | |
| Straight-line adjustments | | | (3,196 | ) | | | (3,995 | ) | | | (8,146 | ) | | | (10,224 | ) |
| Lease incentives | | | 192 | | | | 214 | | | | 605 | | | | 732 | |
| Amortization of above/below market leases | | | (314 | ) | | | (435 | ) | | | (1,211 | ) | | | (1,110 | ) |
| Lease termination payments, net | | | (662 | ) | | | (211 | ) | | | 881 | | | | 70 | |
| Non-cash interest, net | | | 110 | | | | 293 | | | | 351 | | | | 1,081 | |
| Non-cash charges, net | | | 1,766 | | | | 1,663 | | | | 5,341 | | | | 4,984 | |
| Second generation tenant improvements | | | (3,443 | ) | | | (2,332 | ) | | | (4,178 | ) | | | (9,453 | ) |
| Second generation lease costs | | | (2,287 | ) | | | (550 | ) | | | (5,341 | ) | | | (4,969 | ) |
| Joint venture and non-controlling interest adjustment | | | (54 | ) | | | (146 | ) | | | (181 | ) | | | (330 | ) |
| Company Funds Available for Distribution | | $ | 45,676 | | | $ | 48,340 | | | $ | 157,501 | | | $ | 135,285 | |
NON-GAAP FINANCIAL DATA (CONTINUED)
($000)
Net Operating Income (“NOI”):
| | | Nine months ending September 30, | |
| | | 2021 | | | 2020 | |
| Net income | | $ | 122,320 | | | $ | 81,169 | |
| | | | | | | | | |
| Interest and amortization expense | | | 35,170 | | | | 42,610 | |
| Provision for income taxes | | | 986 | | | | 1,361 | |
| Depreciation and amortization | | | 130,579 | | | | 120,869 | |
| General and administrative | | | 24,695 | | | | 22,612 | |
| Transaction costs | | | 205 | | | | 81 | |
| Non-operating/advisory fee income | | | (3,239 | ) | | | (3,392 | ) |
| Gains on sales of properties | | | (104,767 | ) | | | (41,876 | ) |
| Impairment charges | | | 2,048 | | | | 7,792 | |
| Debt satisfaction (gains) losses, net | | | 13,222 | | | | (18,950 | ) |
| Equity in (earnings) losses of non-consolidated entities | | | 249 | | | | (35 | ) |
| Lease termination income, net | | | (13,787 | ) | | | (662 | ) |
| Straight-line adjustments | | | (8,146 | ) | | | (10,224 | ) |
| Lease incentives | | | 605 | | | | 732 | |
| Amortization of above/below market leases | | | (1,211 | ) | | | (1,110 | ) |
| | | | | | | | | |
| NOI | | | 198,929 | | | | 200,977 | |
| | | | | | | | | |
| Less NOI: | | | | | | | | |
| Acquisitions and dispositions | | | (32,989 | ) | | | (36,180 | ) |
| Same-Store NOI | | $ | 165,940 | | | $ | 164,797 | |
NON-GAAP FINANCIAL DATA (CONTINUED)
($000)
Adjusted EBITDA:
| | | 9/30/2021 | | | 6/30/2021 | | | 3/31/2021 | | | 12/31/2020 | | | Trailing 12 Months | |
| Net income attributable to | | | | | | | | | | | | | | | | | | | | |
| Lexington Realty Trust shareholders | | $ | 6,638 | | | $ | 72,678 | | | $ | 41,042 | | | $ | 104,378 | | | $ | 224,736 | |
| Interest and amortization expense | | | 12,210 | | | | 11,474 | | | | 11,486 | | | | 12,591 | | | | 47,761 | |
| Provision for income taxes | | | 270 | | | | 344 | | | | 372 | | | | 223 | | | | 1,209 | |
| Depreciation and amortization | | | 45,359 | | | | 43,044 | | | | 42,176 | | | | 40,723 | | | | 171,302 | |
| Straight-line adjustments | | | (3,196 | ) | | | (2,930 | ) | | | (2,020 | ) | | | (3,430 | ) | | | (11,576 | ) |
| Lease incentives | | | 192 | | | | 194 | | | | 219 | | | | 189 | | | | 794 | |
| Amortization of above/below market leases | | | (314 | ) | | | (437 | ) | | | (460 | ) | | | (470 | ) | | | (1,681 | ) |
| Gains on sales of properties | | | (16,122 | ) | | | (66,726 | ) | | | (21,919 | ) | | | (97,163 | ) | | | (201,930 | ) |
| Impairment charges | | | 2,048 | | | | - | | | | - | | | | 6,668 | | | | 8,716 | |
| Debt satisfaction (gains) losses, net | | | 13,222 | | | | - | | | | - | | | | (2,502 | ) | | | 10,720 | |
| Non-cash charges, net | | | 1,766 | | | | 1,811 | | | | 1,764 | | | | 1,690 | | | | 7,031 | |
| | | | | | | | | | | | | | | | | | | | | |
| Pro-rata share adjustments: | | | | | | | | | | | | | | | | | | | | |
| Non-consolidated entities adjustment | | | 2,837 | | | | 2,854 | | | | 2,839 | | | | 2,925 | | | | 11,455 | |
| Noncontrolling interests adjustment | | | 228 | | | | 923 | | | | 252 | | | | 617 | | | | 2,020 | |
| | | | | | | | | | | | | | | | | | | | | |
| Adjusted EBITDA | | $ | 65,138 | | | $ | 63,229 | | | $ | 75,751 | | | $ | 66,439 | | | $ | 270,557 | |
SELECT CREDIT METRICS SUMMARY (1)
| | | 12/31/2018 | | 12/31/2019 | | 12/31/2020 | | 9/30/2021 |
| Adjusted Company FFO Payout Ratio | | 74.0% | | 51.6% | | 55.6% | | 54.7% |
| | | | | | | | | |
| Unencumbered Assets | | $2.8 billion | | $3.3 billion | | $3.8 billion | | $4.1 billion |
| | | | | | | | | |
| Unencumbered NOI | | 71.5% | | 84.1% | | 89.3% | | 91.5% |
| | | | | | | | | |
| (Debt + Preferred) / Gross Assets | | 40.3% | | 34.5% | | 32.5% | | 34.6% |
| | | | | | | | | |
| Debt/Gross Assets | | 37.8% | | 32.1% | | 30.4% | | 32.6% |
| | | | | | | | | |
| Secured Debt / Gross Assets | | 14.5% | | 9.6% | | 3.1% | | 2.5% |
| | | | | | | | | |
| Net Debt / Adjusted EBITDA | | 4.7x | | 4.9x | | 4.8x | | 5.4x |
| | | | | | | | | |
| (Net Debt + Preferred) / Adjusted EBITDA | | 5.0x | | 5.3x | | 5.1x | | 5.7x |
| | | | | | | | | |
| Credit Facilities Availability (2) | | $505.0 million | | $600.0 million | | $600.0 million | | $600.0 million |
| | | | | | | | | |
| Unsecured Debt / Unencumbered NOI | | 4.9x | | 4.6x | | 5.3x | | 6.1x |
Footnotes
| (1) | Lexington believes these credit metrics provide investors with additional information to evaluate its liquidity and performance. |
| (2) | Subject to covenant compliance. |
LEXINGTON REALTY TRUST |
| OTHER FINANCIAL DATA |
| 9/30/2021 |
| ($000) |
Rent Estimates for Current Assets
| Year | | | Base Rent (1) | | | Cash Base Rent (1) | | | Difference | |
| 2021 - remaining | | | $ | 71,964 | | | $ | 67,842 | | | $ | (4,122 | ) |
| 2022 | | | | 281,974 | | | | 275,855 | | | | (6,119 | ) |
| | | | |
| Balance Sheet | | | |
| Other assets | | $ | 12,661 | |
| | | | | |
| The components of other assets are: | | | | |
| | | | | |
| Deposits | | $ | 3,054 | |
| Equipment | | | 425 | |
| Prepaids | | | 2,529 | |
| Note receivable | | | 1,495 | |
| Other receivables | | | 842 | |
| Deferred lease incentives | | | 4,316 | |
| | | | | |
| Accounts payable and other liabilities | | | | |
| | | | | |
| The components of accounts payable and other liabilities are: | | $ | 59,681 | |
| | | | | |
| Accounts payable and accrued expenses | | $ | 21,226 | |
| CIP accruals and other | | | 20,540 | |
| Taxes | | | 240 | |
| Deferred lease costs | | | 2,181 | |
| Deposits | | | 4,555 | |
| Transaction costs | | | 48 | |
| Derivative liability | | | 10,891 | |
| Footnote |
| (1) | Amounts assume (i) lease terms for non-cancellable periods only, (ii) no new or renegotiated leases are entered into after 9/30/2021, and (iii) no properties are sold or acquired after 9/30/2021. |
LEXINGTON REALTY TRUST |
| QUARTERLY INVESTMENTS / CAPITAL RECYCLING SUMMARY |
| 9/30/2021 |
| | | | | | | | | | | | | | | | | | |
| PROPERTY ACQUISITIONS | | | | | | | | | | | | | | | |
| | | | | | | | | | | | | | | | | | |
| | | Property Type | | Market | | Square Feet | | Initial Basis
($000) | | Month
Closed | | Primary Lease Expiration | | Percent Leased at Acquisition | |
| 1 | | Warehouse/distribution | | Greenville-Spartanburg | | SC | | | 275,400 | | $ | 29,421 | | July | | | 04/2029 | | | 100 | % |
| 2 | | Warehouse/distribution | | Greenville-Spartanburg | | SC | | | 235,600 | | | 26,106 | | July | | | 12/2029 | | | 100 | % |
| 3 | | Warehouse/distribution (1) | | Greenville-Spartanburg | | SC | | | 195,000 | | | 18,394 | | July | | | N/A | | | - | % |
| 4 | | Warehouse/distribution | | Greenville-Spartanburg | | SC | | | 327,360 | | | 31,646 | | July | | | 09/2026 | | | 100 | % |
| 5 | | Warehouse/distribution | | Columbus | | OH | | | 292,730 | | | 29,265 | | August | | | 11/2029 | | | 100 | % |
| | | | | | | | | | | | | | | | | | | | | | |
| 5 | | TOTAL PROPERTY INVESTMENTS | | | | | | | 1,326,090 | | $ | 134,832 | | | | | | | | | |
Footnotes
| (1) | Subsequent to acquisition, property fully leased for 5.5 years. |
| | | | | | | | | | | | | | | | | | | |
| CAPITAL RECYCLING | | | | | | | | | | | | | |
| | | | | | | | | | | | | | | | | | | |
| | | Location | | Property Type | | Gross
Disposition Price
($000) | | Annualized
Net Income ($000) (1) | | Annualized
NOI ($000)(1) | | Month of Disposition | | % Leased | | Gross
Disposition
Price PSF |
| 1 | | Mission(2) | | TX | | Office | | $ | 10,426 | | $ | 963 | | $ | 1,033 | | July | | | 100 | % | | $ | 138.99 | |
| 2 | | Venice(2)(3) | | FL | | Other | | | 19,261 | | | 1,744 | | | 1,423 | | July | | | 100 | % | | | 617.72 | |
| 3 | | Baltimore(2)(3) | | MD | | Other | | | 5,682 | | | 305 | | | 309 | | July | | | 100 | % | | | - | |
| | | | | | | | | | | | | | | | | | | | | | | | | | |
| 3 | | TOTAL PROPERTY DISPOSITIONS | | | | $ | 35,369 | | $ | 3,012 | | $ | 2,765 | | | | | | | | | | |
| | | | | | | | | | | | | | | | | | | | | | | | | | |
Footnotes
| (1) | Generally, quarterly period prior to sale annualized. |
| (2) | Sale price partially satisfied via the redemption of 1,598,906 operating partnership units. |
| (3) | Primarily land investments. |
LEXINGTON REALTY TRUST |
| DEVELOPMENT SUMMARY |
| 9/30/2021 |
| | Project
(% owned) | | # of
Buildings | | Market | | Estimated
Sq. Ft. | | Estimated
Project Cost
($000) | | GAAP
Investment Balance
as of 9/30/2021
($000) (1) | | Lexington
Amount Funded
as of 9/30/2021
($000) | | Estimated
Building
Completion
Date | | Approximate
Lease Term
(Yrs) | | % Leased
as of
9/30/2021 |
| | | | | | | | | | | | | | | | | | | | | | | |
| Consolidated | | | | | | | | | | | | | | | | | | | | | |
| | | | | | | | | | | | | | | | | | | | | | | |
| 1 | Fairburn (87%) (2)(3) | | 1 | | Atlanta, GA | | 907,675 | | $ | 53,800 | | $ | 47,551 | | $ | 43,900 | | 2Q 2021 | | TBD | | 0% |
| 2 | KeHE Distributors BTS (100%) | | 1 | | Phoenix, AZ | | 468,182 | | | 72,000 | | | 60,044 | | | 52,329 | | 4Q 2021 | | 15 | | 100% |
| 3 | Mt. Comfort (80%)(2) | | 1 | | Indianapolis, IN | | 1,053,360 | | | 60,300 | | | 15,808 | | | 9,912 | | 2Q 2022 | | TBD | | 0% |
| 4 | Smith Farms (90%)(2) | | 3 | | Greenville-Spartanburg, SC | | 1,939,524 | | | 132,800 | | | 17,609 | | | 13,396 | | 2Q 2022 | | TBD | | 0% |
| 5 | Cotton 303 (93%)(2) | | 2 | | Phoenix, AZ | | 880,678 | | | 84,200 | | | 23,636 | | | 20,339 | | 2Q 2022 | | TBD | | 0% |
| 6 | Ocala (80%)(2) | | 1 | | Central Florida | | 1,085,280 | | | 80,900 | | | 21,056 | | | 15,093 | | 3Q 2022 | | TBD | | 0% |
| | | | | | | | | | | | | | | | | | | | | | | |
| 6 | Total Consolidated Development Projects | | | | | | $ | 484,000 | | $ | 185,704 | | $ | 154,969 | | | | | | |
| | | | | | | | | | | | | | | | | | | | | | | |
| | | | | | | | | | | | | | | | | | | | | | | |
| Non - Consolidated | | | | | | | | | | | | | | | | | | | | | |
| | | | | | | | | | | | | | | | | | | | | | | |
| 1 | ETNA Park 70 (90%) (4) | | TBD | | Columbus, OH | | TBD | | | TBD | | $ | 12,857 | | $ | 13,321 | | TBD | | TBD | | 0% |
| 2 | ETNA Park 70 East (90%) (4) | | TBD | | Columbus, OH | | TBD | | | TBD | | | 7,979 | | | 8,176 | | TBD | | TBD | | 0% |
| | | | | | | | | | | | | | | | | | | | | | | |
| 2 | Total Non-Consolidated Development Projects | | | | | | | | $ | 20,836 | | $ | 21,497 | | | | | | |
| | | | | | | | | | | | | | | | | | | | | | | |
| 8 | Total Development Projects | | | | | | | | | | | $ | 206,540 | | $ | 176,466 | | | | | | |
Footnotes
| (1) | GAAP investment balance is in real estate under construction for consolidated projects and in investments in non-consolidated entities for non-consolidated projects. |
| (2) | Estimated project cost includes estimated tenant improvements and lease costs and excludes potential developer partner promote. |
| (3) | Base building substantially completed during the second quarter of 2021. Property not in service as of 9/30/2021. Subsequent to 9/30/2021, signed a seven-year lease for all 907,675 square feet. |
| (4) | Plans and specifications have not been completed and the square footage, project cost and completion date cannot be determined. |
LEXINGTON REALTY TRUST |
| CAPITAL EXPENDITURES AND LEASING COSTS (1) |
| 9/30/2021 |
| ($000) |
| | | | | | | |
| | | Nine months ending September 30, | |
| | | 2021 | | | 2020 | |
| First Generation Costs | | | | | | | | |
| Leasing Costs | | $ | 364 | | | $ | - | |
| Total First Generation Costs | | $ | 364 | | | $ | - | |
| | | | | | | | | |
| Second Generation Costs | | | | | | | | |
| Tenant Improvements | | | | | | | | |
| Industrial | | $ | 3,001 | | | $ | 8,652 | |
| Office/Other | | | 1,177 | | | | 801 | |
| Total Second Generation Tenant Improvements | | $ | 4,178 | | | $ | 9,453 | |
| Leasing Costs | | | | | | | | |
| Industrial | | $ | 4,711 | | | $ | 1,000 | |
| Office/Other | | | 630 | | | | 3,969 | |
| Total Second Generation Leasing Costs | | $ | 5,341 | | | $ | 4,969 | |
| Total Second Generation Costs | | $ | 9,519 | | | $ | 14,422 | |
| | | | | | | | | |
| Building Improvements | | | | | | | | |
| Industrial | | $ | 4,684 | | | $ | 4,330 | |
| Office/Other | | | 509 | | | | 1,433 | |
| Total Building Improvements | | $ | 5,193 | | | $ | 5,763 | |
| | | | | | | | | |
| Total Capital Expenditures and Leasing Costs | | $ | 15,076 | | | $ | 20,185 | |
Footnote
| (1) | Consolidated costs on a cash basis. Amounts exclude capitalized interest, if any. Leasing costs includes payments for lease incentives, if any. |
LEXINGTON REALTY TRUST |
| PORTFOLIO DATA |
| 9/30/2021 |
| ($000) |
| | | Base Rent | |
| Asset Class | | Nine months ended | |
| | | 9/30/2021(1) | | | 9/30/2021
Percentage | | | 9/30/2020
Percentage | |
| Industrial | | $ | 188,373 | | | | 91.4 | % | | | 80.9 | % |
| Office/Other | | | 17,723 | | | | 8.6 | % | | | 19.1 | % |
| | | $ | 206,096 | | | | 100.0 | % | | | 100.0 | % |
| | | | | | | | | | | | | |
| | | Base Rent | |
| Credit Ratings (2) | | Nine months ended | |
| | | 9/30/2021(1) | | | 9/30/2021
Percentage | | | 9/30/2020
Percentage | |
| Investment Grade | | $ | 100,281 | | | | 48.7 | % | | | 52.2 | % |
| Non-Investment Grade | | | 37,841 | | | | 18.3 | % | | | 20.7 | % |
| Unrated | | | 67,974 | | | | 33.0 | % | | | 27.1 | % |
| | | $ | 206,096 | | | | 100.0 | % | | | 100.0 | % |
| | | | | | | | | | | | | |
| Weighted-Average Lease Term - Cash Basis | | | | | | As of 9/30/2021 | | | As of 9/30/2020 | |
| | | | | | | 6.6 years | | | 7.8 years | |
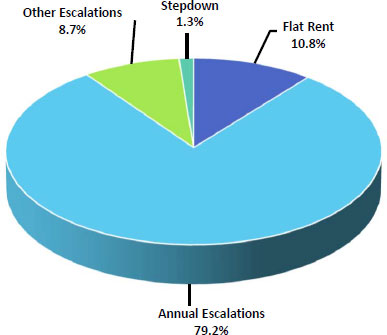
Lease Escalation Data (3)
Footnotes
| (1) | Nine months ended 9/30/2021 Base Rent recognized for consolidated properties owned as of 9/30/2021. |
| (2) | Credit ratings are based upon either tenant, guarantor or parent/ultimate parent. |
| (3) | Based on nine months consolidated Cash Base Rents for single-tenant leases (properties 50% leased to a single tenant) owned as of 9/30/2021. Excludes parking operations and rents from prior tenants. |
LEXINGTON REALTY TRUST |
| SAME STORE DATA |
| 9/30/2021 |
| ($000) |
| Same-Store NOI (1) | | | | | Same-Store NOI by Components (1) | | | | |
| | | | | | | | | | |
| | | Consolidated | | | Industrial | | | Office/Other | |
| | | Nine months ended September 30, | | | Nine months ended September 30, | | | Nine months ended September 30, | |
| | | 2021 | | | 2020 | | | 2021 | | | 2020 | | | 2021 | | | 2020 | |
| Total Cash Base Rent | | $ | 170,269 | | | $ | 169,229 | | | $ | 151,257 | | | $ | 149,574 | | | $ | 19,012 | | | $ | 19,655 | |
| Tenant Reimbursements | | | 21,071 | | | | 20,086 | | | | 15,579 | | | | 14,965 | | | | 5,492 | | | | 5,121 | |
| Property Operating Expenses | | | (25,400 | ) | | | (24,518 | ) | | | (18,221 | ) | | | (17,732 | ) | | | (7,179 | ) | | | (6,786 | ) |
| Same-Store NOI | | $ | 165,940 | | | $ | 164,797 | | | $ | 148,615 | | | $ | 146,807 | | | $ | 17,325 | | | $ | 17,990 | |
| | | | | | | | | | | | | | | | | | | | | | | | | |
| Change in Same-Store NOI(2) | | | 0.7 | % | | | | | | | 1.2 | % | | | | | | | -3.7 | % | | | | |
| Same-Store Statistics (3) | | | | | | | | | | Same-Store Statistics by Components (3) | |
| | | | | | | | | | |
| | | Consolidated | | | Industrial | | | Office/Other | |
| | | As of
9/30/2021 | | | As of
9/30/2020 | | | As of
9/30/2021 | | | As of
9/30/2020 | | | As of
9/30/2021 | | | | As of
9/30/2020 | |
| | | | | | | | | | | | | | | | | | | | | | | | | |
| Same-Store # of Properties | | | 106 | | | | 106 | | | | 94 | | | | 94 | | | | 12 | | | | 12 | |
| | | | | | | | | | | | | | | | | | | | | | | | | |
| Same-Store Percent Leased | | | 98.7 | % | | | 99.8 | % | | | 99.0 | % | | | 99.8 | % | | | 88.5 | % | | | 96.8 | % |
Footnotes
| (1) | NOI is on a consolidated cash basis excluding properties acquired and sold in 2021 and 2020. |
| (2) | Excluding single-tenant, full building vacancies same-store NOI growth was 1.9% consolidated and 2.5% industrial. |
| (3) | At September 30, 2021, excludes properties acquired or sold in 2021 and 2020. |
LEXINGTON REALTY TRUST |
| PORTFOLIO DETAIL BY ASSET CLASS |
| 9/30/2021 |
| ($000, except square footage) |
| |
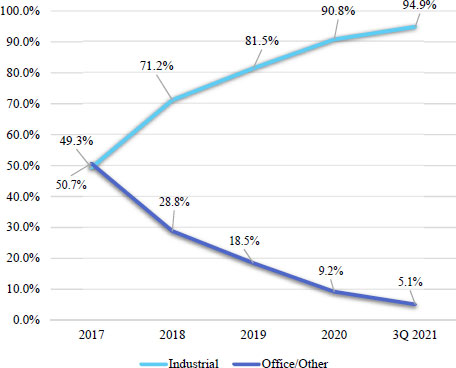
| Asset Class | | YE 2018 (1) | | | YE 2019 | | | YE 2020 | | | 9/30/2021 | |
| Industrial | | | | | | | | | | | | | | | | |
| % of Cost (2) | | | 71.2 | % | | | 81.5 | % | | | 90.8 | % | | | 94.9 | % |
| % of ABR (3) | | | 65.4 | % | | | 75.5 | % | | | 86.3 | % | | | 91.4 | % |
| % Leased (4) | | | 96.3 | % | | | 97.9 | % | | | 98.7 | % | | | 99.2 | % |
| Wtd. Avg. Lease Term (5) | | | 9.7 | | | | 8.3 | | | | 7.4 | | | | 6.9 | |
| Mortgage Debt | | $ | 206,006 | | | $ | 109,939 | | | $ | 105,419 | | | $ | 101,855 | |
| % Investment Grade (3) | | | 31.6 | % | | | 45.9 | % | | | 50.8 | % | | | 50.6 | % |
| Square Feet | | | 41,447,962 | | | | 48,742,014 | | | | 53,938,155 | | | | 56,216,962 | |
| | | | | | | | | | | | | | | | | |
| Office/Other | | | | | | | | | | | | | | | | |
| % of Cost (2) | | | 28.8 | % | | | 18.5 | % | | | 9.2 | % | | | 5.1 | % |
| % of ABR (3)(6) | | | 34.6 | % | | | 24.5 | % | | | 13.7 | % | | | 8.6 | % |
| % Leased | | | 87.1 | % | | | 85.8 | % | | | 89.3 | % | | | 88.5 | % |
| Wtd. Avg. Lease Term (5) | | | 7.2 | | | | 8.5 | | | | 7.2 | | | | 3.2 | |
| Mortgage Debt | | $ | 369,508 | | | $ | 283,933 | | | $ | 32,993 | | | $ | 15,420 | |
| % Investment Grade (3) | | | 53.2 | % | | | 57.3 | % | | | 42.0 | % | | | 27.6 | % |
| Square Feet | | | 6,111,588 | | | | 3,876,294 | | | | 2,171,633 | | | | 1,457,981 | |
| | | | | | | | | | | | | | | | | |
| Construction in progress (7) | | $ | 1,840 | | | $ | 15,208 | | | $ | 79,022 | | | $ | 188,692 | |
Footnotes
| (1) | Certain amounts reclassified to reflect the current presentation. |
| (2) | Based on gross book value of real estate assets; excludes held for sale assets. |
| (3) | Percentage of Base Rent, for consolidated properties owned as of each respective period. |
| (4) | 2021 is for Stabilized Portfolio. |
| (6) | YE 2018 excludes the acceleration of below-market lease intangible accretion on one asset subsequently sold. |
| (7) | Includes development classified as real estate under construction on a consolidated basis and capital expenditure for our operating properties. |
LEXINGTON REALTY TRUST |
| PORTFOLIO COMPOSITION |
| 9/30/2021 |
As a Percent of Gross Book Value (1)
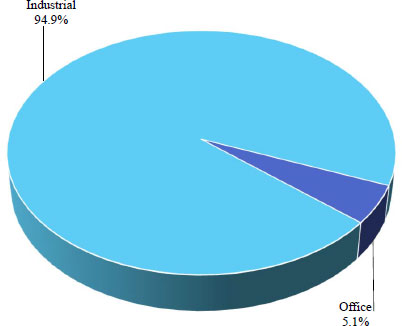
Portfolio Composition (2)
Footnotes
| (1) | Based on gross book value of real estate assets as of 9/30/2021, excludes held for sale assets. |
| (2) | Based on gross book value of real estate assets as of 9/30/2021, 12/31/2020, 12/31/2019, 12/31/2018 and 12/31/2017, as applicable and excludes held for sale assets. |
LEXINGTON REALTY TRUST |
| INDUSTRIAL MARKETS AND INDUSTRIES |
| 9/30/2021 |
| Markets (1) | | Percent of Base Rent as
of 9/30/2021 (2) | |
| Memphis, TN | | 7.7 | % |
| Houston, TX | | 6.9 | % |
| Greenville/Spartanburg, SC | | 6.1 | % |
| Dallas/Ft Worth, TX | | 5.7 | % |
| Atlanta, GA | | 5.5 | % |
| Phoenix, AZ | | 5.2 | % |
| Cincinnati/Dayton, OH | | 5.1 | % |
| Chicago, IL | | 5.0 | % |
| Nashville, TN | | 4.5 | % |
| Detroit, MI | | 4.1 | % |
| Savannah, GA | | 2.7 | % |
| Jackson, MS | | 2.5 | % |
| St. Louis, MO | | 2.5 | % |
| Indianapolis, IN | | 2.4 | % |
| DC/Baltimore, MD | | 2.3 | % |
| Central Florida | | 2.2 | % |
| New York/New Jersey | | 2.0 | % |
| Columbus, OH | | 2.0 | % |
| Cleveland, OH | | 2.0 | % |
| Charlotte, NC | | 1.9 | % |
| Total Industrial Portfolio Concentration (3) | | 78.3 | % |
| Industries | | Percent of Base Rent as
of 9/30/2021 (2) | |
| Consumer Products | | 23.1 | % |
| Automotive | | 19.2 | % |
| Food | | 15.7 | % |
| E-Commerce | | 14.5 | % |
| Transportation/Logistics | | 11.1 | % |
| Construction/Materials | | 9.0 | % |
| Apparel | | 2.3 | % |
| Specialty | | 1.6 | % |
| Technology | | 1.2 | % |
| Aerospace/Defense | | 1.1 | % |
| Retail Department | | 0.7 | % |
| Printing/Production | | 0.3 | % |
| Other | | 0.2 | % |
| | | | |
| Total Industrial Portfolio Concentration (3) | | 100.0 | % |
| Footnotes |
| (1) | Based on CoStar.com inventory data. |
| (2) | Nine months ended 9/30/2021 Base Rent recognized for consolidated industrial properties owned as of 9/30/2021. |
| (3) | Total shown may differ from detailed amounts due to rounding. |
| | |
LEXINGTON REALTY TRUST |
| INDUSTRIAL PORTFOLIO DETAIL(1) |
| 9/30/2021 |
| | | | | | | | | |
| | | Warehouse/
Distribution | | Cold Storage | | Heavy Manufacturing | | Light Manufacturing |
| # of Properties | | 100 | | 4 | | 13 | | 9 |
| | | | | | | | | |
| Square Feet | | 48,243,747 | | 925,616 | | 4,751,345 | | 2,296,254 |
| | | | | | | | | |
| % of Industrial Base Rent(2) | | 81% | | 5% | | 8% | | 6% |
| | | | | | | | | |
| Weighted-Average Age (Years)(3) | | 9.2 | | 9.2 | | 26.6 | | 21.5 |
| | | | | | | | | |
| Weighted-Average Cash Base Rent per SF(4) | | $3.97 | | $12.73 | | $4.40 | | $5.95 |
| | | | | | | | | |
| Weighted-Average Lease Term (Cash Basis - Years) | | 6.6 | | 10.4 | | 6.1 | | 10.0 |
| | | | | | | | | |
| Average Annual Rent Escalation(5) | | 2.6% | | 1.4% | | 1.9% | | 2.6% |
| | | | | | | | | |
| Average Building Size (SF) | | 482,437 | | 231,404 | | 365,488 | | 255,139 |
| | | | | | | | | |
| Average Clear Height (Feet)(6) | | 32.5 | | 36.9 | | 35.4 | | 28.1 |
| | | | | | | | | |
| % Top 25 Markets(7) | | 69.0% | | 79.2% | | 37.5% | | 37.5% |
| | | | | | | | | |
| % Top 50 Markets(7) | | 88.5% | | 100.0% | | 49.1% | | 49.6% |
Footnotes
| (1) | For industrial properties owned as of 9/30/2021. |
| (2) | Percent of Base Rent for consolidated industrial properties owned as of 9/30/2021. |
| (3) | Weighting based on square footage. |
| (4) | Excludes vacant square footage. |
| (5) | Based on Cash Base Rents for single-tenant leases (properties 50% leased to a single tenant) owned as of 9/30/2021. Excludes rents from prior tenants. |
| (6) | Based on internal and external sources. |
| (7) | Percent of Base Rent based upon CoStar.com inventory data. |
LEXINGTON REALTY TRUST
TOP 15 TENANTS
9/30/2021
| Tenants (1) | | Property Type | | Lease
Expirations | | Number of
Leases | | | Sq. Ft. Leased | | | Sq. Ft. Leased as a
Percent of Consolidated
Portfolio (2)(3) | | | Base Rent as of
9/30/2021
($000) | | | Percent of Base Rent
as of 9/30/2021
($000) (2)(4) | |
| Amazon | | Industrial | | 2026-2033 | | 5 | | | 3,334,331 | | | 5.9 | % | | $ | 12,724 | | | 6.3 | % |
| Nissan | | Industrial | | 2027 | | 2 | | | 2,971,000 | | | 5.3 | % | | | 9,570 | | | 4.7 | % |
| Dana | | Industrial | | 2021-2033 | | 7 | | | 2,053,359 | | | 3.6 | % | | | 7,725 | | | 3.8 | % |
| Kellogg | | Industrial | | 2027-2029 | | 3 | | | 2,801,916 | | | 5.0 | % | | | 7,299 | | | 3.6 | % |
| Undisclosed (5) | | Industrial | | 2031-2035 | | 3 | | | 1,090,383 | | | 1.9 | % | | | 5,355 | | | 2.7 | % |
| Watco | | Industrial | | 2038 | | 1 | | | 132,449 | | | 0.2 | % | | | 5,080 | | | 2.5 | % |
| Xerox | | Office | | 2023 | | 1 | | | 202,000 | | | 0.4 | % | | | 4,981 | | | 2.5 | % |
| FedEx | | Industrial | | 2023 & 2028 | | 2 | | | 292,021 | | | 0.5 | % | | | 4,289 | | | 2.1 | % |
| Wal-Mart | | Industrial | | 2024 & 2027 | | 2 | | | 1,335,673 | | | 2.4 | % | | | 4,213 | | | 2.1 | % |
| Undisclosed (5) | | Industrial | | 2034 | | 1 | | | 1,318,680 | | | 2.3 | % | | | 4,158 | | | 2.1 | % |
| Morgan Lewis (6) | | Office | | 2024 | | 1 | | | 289,432 | | | 0.5 | % | | | 3,857 | | | 1.9 | % |
| Unis | | Industrial | | 2023-2027 | | 3 | | | 1,005,575 | | | 1.8 | % | | | 3,411 | | | 1.7 | % |
| Mars Wrigley | | Industrial | | 2025 | | 1 | | | 604,852 | | | 1.1 | % | | | 3,404 | | | 1.7 | % |
| Asics | | Industrial | | 2030 | | 1 | | | 855,878 | | | 1.5 | % | | | 3,291 | | | 1.6 | % |
| Spitzer | | Industrial | | 2035 | | 2 | | | 449,895 | | | 0.8 | % | | | 3,259 | | | 1.6 | % |
| | | | | | | | | | | | | | | | | | | | | |
| | | | | | | 35 | | | 18,737,444 | | | 33.2 | % | | $ | 82,616 | | | 41.0 | % |
| Footnotes |
| (1) | Tenant, guarantor or parent. |
| (2) | Total shown may differ from detailed amounts due to rounding. |
| (3) | Excludes vacant square feet. |
| (4) | Nine months ended 9/30/2021 Base Rent recognized for consolidated properties owned as of 9/30/2021, excluding rent from prior tenants. |
| (5) | Lease restricts certain disclosures. |
| (6) | Includes parking operations. |
LEXINGTON REALTY TRUST
QUARTERLY LEASING SUMMARY
9/30/2021
| NEW LEASES - FIRST GENERATION(1) |
| | Location (2) | | | | Lease Expiration
Date | | Sq. Ft. | | | New Base Rent
Per Annum
($000)(3) | | | | | | New Cash Base
Rent Per Annum
($000)(3) | | | | |
| | Industrial | | | | | | | | | | | | | | | | | | | | | | | | | |
| 1 | Lakeland | | FL | | | | 01/2027 | | 68,420 | | | $ | 388 | | | | | | | $ | 390 | | | | | |
| 2 | Duncan | | SC | | | | 01/2027 | | 195,000 | | | | 1,052 | | | | | | | | 1,028 | | | | | |
| 2 | TOTAL NEW LEASES - FIRST GENERATION | | 263,420 | | | $ | 1,440 | | | | | | | $ | 1,418 | | | | | |
| | | | | | | | | | | | | | | | | | | | | | | | | | | |
| LEASE EXTENSIONS - SECOND GENERATION | | | | |
| | Location (2) | | Prior
Term | | Lease Expiration
Date | | Sq. Ft. | | | New Base Rent
Per Annum
($000)(3) | | | Prior Base Rent
Per Annum
($000) | | | New Cash Base
Rent Per Annum
($000)(3) | | | Prior Cash Base
Rent Per Annum
($000) | |
| | Industrial | | | | | | | | | | | | | | | | | | | | | | | | | |
| 1 | Antioch | | TN | | 08/2021 | | 09/2026 | | 67,200 | | | $ | 394 | | | $ | 211 | | | $ | 382 | | | $ | 228 | |
| 2 | Shreveport | | LA | | 03/2022 | | 08/2027 | | 257,849 | | | | 1,253 | | | | 1,343 | | | | 1,321 | | | | 1,403 | |
| | | | | | | | | | | | | | | | | | | | | | | | | | | |
| 2 | TOTAL EXTENDED LEASES - SECOND GENERATION | | 325,049 | | | $ | 1,647 | | | $ | 1,554 | | | $ | 1,703 | | | $ | 1,631 | |
| | | | | | | | | | | | | | | | | | | | | | | | | | | |
| NEW LEASES - SECOND GENERATION | | | | |
| | Location (2) | | | | Lease Expiration
Date | | Sq. Ft. | | | New Base Rent
Per Annum
($000)(3) | | | Prior Base Rent
Per Annum
($000)(4) | | | New Cash Base
Rent Per Annum
($000)(3) | | | Prior Cash Base
Rent Per Annum
($000)(4) | |
| | Industrial | | | | | | | | | | | | | | | | | | | | | | | | | |
| 1 | Monroe | | OH | | | | 02/2032 | | 143,664 | | | $ | 938 | | | $ | 711 | | | $ | 886 | | | $ | 699 | |
| 2 | Statesville | | NC | | | | 10/2026 | | 639,800 | | | | 2,796 | | | | 2,493 | | | | 2,701 | | | | 2,613 | |
| 3 | Olive Branch | | MS | | | | 08/2024 | | 1,170,218 | | | | 3,710 | | | | 3,789 | | | | 3,628 | | | | 3,569 | |
| 4 | Kalamazoo | | MI | | | | 10/2028 | | 9,431 | | | | 132 | | | | 118 | | | | 132 | | | | 127 | |
| 5 | Kalamazoo | | MI | | | | 10/2023 | | 9,981 | | | | 137 | | | | 125 | | | | 137 | | | | 134 | |
| | | | | | | | | | | | | | | | | | | | | | | | | | | |
| 5 | TOTAL NEW LEASES - SECOND GENERATION | | 1,973,094 | | | $ | 7,713 | | | $ | 7,236 | | | $ | 7,484 | | | $ | 7,142 | |
| | | | | | | | | | | | | | | | | | | | | | | | | | | |
| 7 | TOTAL NEW AND EXTENDED LEASES - SECOND GENERATION | | 2,298,143 | | | $ | 9,360 | | | $ | 8,790 | | | $ | 9,187 | | | $ | 8,773 | |
LEXINGTON REALTY TRUST
QUARTERLY LEASING SUMMARY (CONTINUED)
9/30/2021
| NEW VACANCY (5) |
| | Location (2) | | Type | | Prior Lease
Expiration
Date | | Sq. Ft. | | | 2020
Base Rent
($000) | | | 2020
Cash Rent
($000) | | | | | | | |
| | McDonough | | GA | | Office | | 08/2021 | | 62,218 | | | $ | 874 | | | $ | 874 | | | | | | | | | |
| Footnotes |
| (1) | Leased first generation space that was acquired vacant. |
| (2) | Leases greater than 10,000 square feet. |
| (3) | Assumes twelve months rent from the later of 10/1/2021 or lease commencement/extension, excluding free rent periods as applicable. |
| (4) | Rent from prior tenants for square feet leased. |
| (5) | Excludes multi-tenant properties, disposed properties and non-consolidated investments. |
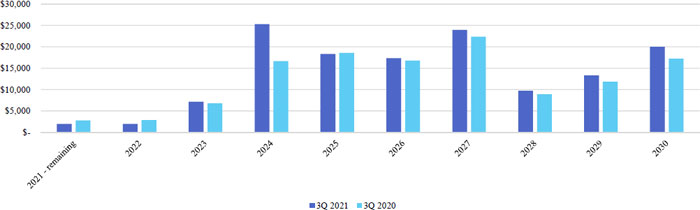
LEXINGTON REALTY TRUST
LEASE ROLLOVER SCHEDULE - INDUSTRIAL
9/30/2021
($000)
| Year | | Number of
Leases
Expiring | | | Base Rent as of
9/30/2021 | | | Percent of
Base Rent as of
9/30/2021 | | | Percent of
Base Rent as of
9/30/2020 | |
| 2021 - remaining | | 4 | | | $ | 1,965 | | | 1.0 | % | | | 1.6 | % |
| 2022 | | 4 | | | | 1,959 | | | 1.0 | % | | | 1.6 | % |
| 2023 | | 8 | | | | 7,162 | | | 3.8 | % | | | 3.9 | % |
| 2024 | | 23 | | | | 25,322 | | | 13.5 | % | | | 9.5 | % |
| 2025 | | 17 | | | | 18,347 | | | 9.8 | % | | | 10.6 | % |
| 2026 | | 23 | | | | 17,347 | | | 9.2 | % | | | 9.6 | % |
| 2027 | | 13 | | | | 23,962 | | | 12.8 | % | | | 12.8 | % |
| 2028 | | 7 | | | | 9,733 | | | 5.2 | % | | | 5.1 | % |
| 2029 | | 9 | | | | 13,315 | | | 7.1 | % | | | 6.8 | % |
| 2030 | | 9 | | | | 19,976 | | | 10.6 | % | | | 9.9 | % |
| Thereafter | | 26 | | | | 48,660 | | | 25.9 | % | | | 22.9 | % |
| | | | | | | | | | | | | | | |
| Total (1) | | 143 | | | $ | 187,748 | | | 100.0 | % | | | | |
| Footnotes |
| (1) | Total shown may differ from detailed amounts due to rounding. |
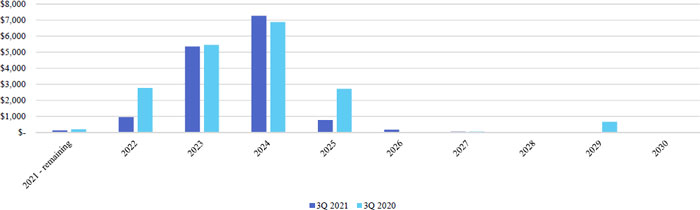
LEXINGTON REALTY TRUST
LEASE ROLLOVER SCHEDULE - OFFICE/OTHER
9/30/2021
($000)
| Year | | Number of
Leases
Expiring | | | Base Rent as of
9/30/2021 | | | Percent of
Base Rent as of
9/30/2021 | | | Percent of
Base Rent as of
9/30/2020 | |
| 2021 - remaining | | 1 | | | $ | 123 | | | 0.7 | % | | | 0.5 | % |
| 2022 | | 3 | | | | 956 | | | 5.8 | % | | | 6.8 | % |
| 2023 | | 4 | | | | 5,356 | | | 32.5 | % | | | 13.5 | % |
| 2024 | | 6 | | | | 7,269 | | | 44.2 | % | | | 17.0 | % |
| 2025 | | 3 | | | | 774 | | | 4.7 | % | | | 6.7 | % |
| 2026 | | 1 | | | | 169 | | | 1.0 | % | | | 0.0 | % |
| 2027 | | 1 | | | | 46 | | | 0.3 | % | | | 0.1 | % |
| 2028 | | 0 | | | | - | | | 0.0 | % | | | 0.0 | % |
| 2029 | | 0 | | | | - | | | 0.0 | % | | | 1.6 | % |
| 2030 | | 0 | | | | - | | | 0.0 | % | | | 0.0 | % |
| Thereafter | | 2 | | | | 1,763 | | | 10.7 | % | | | 45.3 | % |
| | | | | | | | | | | | | | | |
| Total (1) | | 21 | | | $ | 16,456 | | | 100.0 | % | | | | |
| Footnotes |
| (1) | Total shown may differ from detailed amounts due to rounding. |
LEXINGTON REALTY TRUST
PROPERTY LEASES AND VACANCIES - 9/30/2021
Year of Lease
Expiration | | Date of Lease
Expiration | | CoStar Market (1) | | Property Location | | City | | State | | Note | | | Sq. Ft.
Leased or Available
(2) | | | Base Rent as of
9/30/2021
($000) (3) | | | Cash Base Rent as of
9/30/2021
($000) (3) | |
| INDUSTRIAL PROPERTIES |
| SINGLE TENANT |
| | | WAREHOUSE/DISTRIBUTION |
| 2021 | | 10/25/2021 | | West Michigan | | 6938 Elm Valley Dr. | | Kalamazoo | | MI | | 10 | | | | 150,945 | | | | 1,416 | | | | 1,520 | |
| | | 12/31/2021 | | Nashville, TN | | 6050 Dana Way | | Antioch | | TN | | -- | | | | 73,500 | | | | 142 | | | | 142 | |
| | | | | Columbus, OH | | 351 Chamber Drive | | Chillicothe | | OH | | -- | | | | 42,264 | | | | 159 | | | | 159 | |
| | | | | Chicago, IL | | 3686 South Central Ave. | | Rockford | | IL | | -- | | | | 93,000 | | | | 248 | | | | 248 | |
| 2022 | | 2/28/2022 | | Columbus, OH | | 351 Chamber Drive | | Chillicothe | | OH | | -- | | | | 23,270 | | | | 95 | | | | 95 | |
| | | 3/31/2022 | | Columbus, OH | | 191 Arrowhead Dr. | | Hebron | | OH | | -- | | | | 400,522 | | | | 701 | | | | 701 | |
| | | | | Columbus, OH | | 200 Arrowhead Dr. | | Hebron | | OH | | -- | | | | 250,410 | | | | 438 | | | | 438 | |
| 2023 | | 2/28/2023 | | Central Florida | | 3102 Queen Palm Dr. | | Tampa | | FL | | -- | | | | 229,605 | | | | 864 | | | | 896 | |
| | | 5/31/2023 | | Memphis, TN | | 6495 Polk Ln. | | Olive Branch | | MS | | -- | | | | 151,691 | | | | 438 | | | | 438 | |
| | | 6/30/2023 | | Cincinnati/Dayton, OH | | 575-599 Gateway Blvd. | | Monroe | | OH | | -- | | | | 194,936 | | | | 293 | | | | 288 | |
| | | 8/31/2023 | | Houston, TX | | 10535 Red Bluff Rd. | | Pasadena | | TX | | -- | | | | 257,835 | | | | 923 | | | | 905 | |
| | | | | Dallas/Ft Worth, TX | | 3737 Duncanville Rd. | | Dallas | | TX | | -- | | | | 510,400 | | | | 1,285 | | | | 1,280 | |
| | | 10/31/2023 | | Atlanta, GA | | 493 Westridge Pkwy. | | McDonough | | GA | | -- | | | | 676,000 | | | | 1,523 | | | | 1,518 | |
| | | 12/31/2023 | | Shreveport/Bossier City, LA | | 5001 Greenwood Rd. | | Shreveport | | LA | | -- | | | | 646,000 | | | | 1,285 | | | | 1,285 | |
| 2024 | | 1/31/2024 | | Greenville/Spartanburg, SC | | 70 Tyger River Dr. | | Duncan | | SC | | -- | | | | 408,000 | | | | 1,501 | | | | 1,494 | |
| | | | | Indianapolis, IN | | 1285 W. State Road 32 | | Lebanon | | IN | | -- | | | | 741,880 | | | | 1,711 | | | | 1,854 | |
| | | | | Memphis, TN | | 6495 Polk Ln. | | Olive Branch | | MS | | -- | | | | 118,211 | | | | 371 | | | | 368 | |
| | | 3/31/2024 | | Cleveland, TN | | 1520 Lauderdale Memorial Hwy. | | Cleveland | | TN | | -- | | | | 851,370 | | | | 1,993 | | | | 2,035 | |
| | | | | Indianapolis, IN | | 4600 Albert S White Dr. | | Whitestown | | IN | | -- | | | | 53,240 | | | | 185 | | | | 202 | |
| | | | | Columbus, OH | | 2155 Rohr Rd | | Lockbourne | | OH | | -- | | | | 320,190 | | | | 814 | | | | 788 | |
| | | 4/30/2024 | | Memphis, TN | | 11555 Silo Dr. | | Olive Branch | | MS | | -- | | | | 927,742 | | | | 2,141 | | | | 2,181 | |
| | | | | Nashville, TN | | 6050 Dana Way | | Antioch | | TN | | -- | | | | 11,238 | | | | 105 | | | | 105 | |
| | | 5/31/2024 | | Atlanta, GA | | 7225 Goodson Rd. | | Union City | | GA | | -- | | | | 370,000 | | | | 1,082 | | | | 1,064 | |
| | | 7/31/2024 | | Greenville/Spartanburg, SC | | 5795 North Blackstock Rd. | | Spartanburg | | SC | | -- | | | | 341,660 | | | | 1,254 | | | | 1,266 | |
LEXINGTON REALTY TRUST
PROPERTY LEASES AND VACANCIES - 9/30/2021
Year of Lease
Expiration | | Date of Lease
Expiration | | CoStar Market (1) | | Property Location | | City | | State | | Note | | | Sq. Ft.
Leased or Available
(2) | | | Base Rent as of
9/30/2021
($000) (3) | | | Cash Base Rent as of
9/30/2021
($000) (3) | |
| INDUSTRIAL PROPERTIES |
| | | WAREHOUSE/DISTRIBUTION |
| 2024 | | 7/31/2024 | | Greenville/Spartanburg, SC | | 231 Apple Valley Rd. | | Duncan | | SC | | -- | | | | 75,320 | | | | 280 | | | | 280 | |
| | | 8/31/2024 | | Houston, TX | | 9701 New Decade Drive | | Pasadena | | TX | | -- | | | | 102,863 | | | | 204 | | | | 143 | |
| | | | | Memphis, TN | | 11624 S. Distribution Cv. | | Olive Branch | | MS | | 9 | | | | 1,170,218 | | | | 2,837 | | | | 2,720 | |
| | | 9/30/2024 | | Indianapolis, IN | | 1621 Veterans Memorial Pkwy. E | | Lafayette | | IN | | -- | | | | 309,400 | | | | 911 | | | | 903 | |
| | | | | Memphis, TN | | 3820 Micro Dr. | | Millington | | TN | | -- | | | | 701,819 | | | | 1,449 | | | | 1,405 | |
| | | 10/31/2024 | | Dallas/Ft Worth, TX | | 2115 East Belt Line Rd. | | Carrollton | | TX | | -- | | | | 58,202 | | | | 172 | | | | 180 | |
| | | | | Dallas/Ft Worth, TX | | 17505 Interstate Hwy 35W | | Northlake | | TX | | -- | | | | 500,556 | | | | 1,701 | | | | 1,637 | |
| | | 11/30/2024 | | DC/Baltimore, MD | | 150 Mercury Way | | Winchester | | VA | | -- | | | | 324,535 | | | | 1,287 | | | | 1,228 | |
| | | 12/31/2024 | | Indianapolis, IN | | 4600 Albert S White Dr. | | Whitestown | | IN | | -- | | | | 95,832 | | | | 327 | | | | 299 | |
| | | | | Chicago, IL | | 749 Southrock Dr. | | Rockford | | IL | | -- | | | | 150,000 | | | | 478 | | | | 472 | |
| 2025 | | 4/30/2025 | | Houston, TX | | 10565 Red Bluff Rd. | | Pasadena | | TX | | -- | | | | 248,240 | | | | 928 | | | | 897 | |
| | | 5/31/2025 | | Atlanta, GA | | 7875 White Road SW | | Austell | | GA | | -- | | | | 604,852 | | | | 3,404 | | | | 3,201 | |
| | | 6/30/2025 | | Savannah, GA | | 1319 Dean Forest Rd. | | Savannah | | GA | | -- | | | | 355,527 | | | | 1,358 | | | | 1,284 | |
| | | 7/31/2025 | | Indianapolis, IN | | 5352 Performance Way | | Whitestown | | IN | | -- | | | | 380,000 | | | | 958 | | | | 951 | |
| | | | | Cleveland, OH | | 7005 Cochran Rd. | | Glenwillow | | OH | | -- | | | | 458,000 | | | | 1,546 | | | | 1,623 | |
| | | 8/31/2025 | | Indianapolis, IN | | 4900 Albert S White Dr. | | Whitestown | | IN | | -- | | | | 85,232 | | | | 300 | | | | 285 | |
| | | | | Savannah, GA | | 1315 Dean Forest Rd. | | Savannah | | GA | | -- | | | | 88,503 | | | | 394 | | | | 383 | |
| | | 9/30/2025 | | Greenville/Spartanburg, SC | | 7870 Reidville Rd | | Greer | | SC | | -- | | | | 396,073 | | | | 426 | | | | 337 | |
| | | | | Nashville, TN | | 6050 Dana Way | | Antioch | | TN | | -- | | | | 117,600 | | | | 306 | | | | 310 | |
| | | 12/31/2025 | | Phoenix, AZ | | 4445 N. 169th Ave. | | Goodyear | | AZ | | -- | | | | 160,140 | | | | 755 | | | | 738 | |
| | | | | Minneapolis/St Paul, MN | | 1700 47th Ave North | | Minneapolis | | MN | | -- | | | | 18,620 | | | | 454 | | | | 454 | |
| 2026 | | 1/31/2026 | | Greenville/Spartanburg, SC | | 231 Apple Valley Rd. | | Duncan | | SC | | -- | | | | 120,680 | | | | 448 | | | | 448 | |
| | | 3/31/2026 | | Central Florida | | 2455 Premier Row | | Orlando | | FL | | -- | | | | 205,016 | | | | 589 | | | | 381 | |
| | | | | Lewisburg, TN | | 633 Garrett Pkwy. | | Lewisburg | | TN | | -- | | | | 310,000 | | | | 965 | | | | 986 | |
| | | 4/30/2026 | | Phoenix, AZ | | 16811 W. Commerce Dr. | | Goodyear | | AZ | | -- | | | | 540,349 | | | | 1,833 | | | | 1,712 | |
LEXINGTON REALTY TRUST
PROPERTY LEASES AND VACANCIES - 9/30/2021
Year of Lease
Expiration | | Date of Lease
Expiration | | CoStar Market (1) | | Property Location | | City | | State | | Note | | | Sq. Ft.
Leased or Available
(2) | | | Base Rent as of
9/30/2021
($000) (3) | | | Cash Base Rent as of
9/30/2021
($000) (3) | |
| INDUSTRIAL PROPERTIES |
| | | WAREHOUSE/DISTRIBUTION |
| 2026 | | 6/30/2026 | | Greenville/Spartanburg, SC | | 425 Apple Valley Rd. | | Duncan | | SC | | -- | | | | 163,680 | | | | 188 | | | | 145 | |
| | | | | Columbus, OH | | 351 Chamber Drive | | Chillicothe | | OH | | -- | | | | 136,495 | | | | 447 | | | | 447 | |
| | | | | Columbus, OH | | 351 Chamber Drive | | Chillicothe | | OH | | -- | | | | 276,112 | | | | 961 | | | | 951 | |
| | | 7/31/2026 | | Savannah, GA | | 1004 Trade Center Pkwy. | | Savannah | | GA | | -- | | | | 270,252 | | | | 1,075 | | | | 1,005 | |
| | | | | Columbus. OH | | 1860 Walcutt Rd. | | Columbus | | OH | | -- | | | | 97,934 | | | | 60 | | | | 56 | |
| | | 8/31/2026 | | Savannah, GA | | 1004 Trade Center Pkwy. | | Savannah | | GA | | -- | | | | 149,415 | | | | 616 | | | | 583 | |
| | | 9/30/2026 | | Greenville/Spartanburg, SC | | 425 Apple Valley Rd. | | Duncan | | SC | | -- | | | | 163,680 | | | | 167 | | | | - | |
| | | | | St. Louis, MO | | 3931 Lakeview Corporate Dr. | | Edwardsville | | IL | | -- | | | | 769,500 | | | | 2,022 | | | | 1,993 | |
| | | | | Nashville, TN | | 6050 Dana Way | | Antioch | | TN | | -- | | | | 67,200 | | | | 199 | | | | 152 | |
| | | | | Phoenix, AZ | | 9494 W. Buckeye Rd. | | Tolleson | | AZ | | -- | | | | 186,336 | | | | 832 | | | | 791 | |
| | | 10/31/2026 | | Greenville/Spartanburg, SC | | 235 Apple Valley Rd. | | Duncan | | SC | | -- | | | | 177,320 | | | | 709 | | | | 683 | |
| | | | | Charlotte, NC | | 2203 Sherrill Dr. | | Statesville | | NC | | -- | | | | 639,800 | | | | 124 | | | | - | |
| | | | | Cleveland, OH | | 10345 Philipp Pkwy. | | Streetsboro | | OH | | -- | | | | 649,250 | | | | 2,162 | | | | 2,070 | |
| | | 11/30/2026 | | Erwin, NY | | 736 Addison Rd. | | Erwin | | NY | | -- | | | | 408,000 | | | | 1,110 | | | | 1,116 | |
| | | | | Philadelphia, PA | | 250 Rittenhouse Cir. | | Bristol | | PA | | -- | | | | 241,977 | | | | 860 | | | | 921 | |
| | | 12/31/2026 | | Houston, TX | | 4600 Underwood Road | | Deer Park | | TX | | -- | | | | 402,648 | | | | 576 | | | | - | |
| 2027 | | 1/31/2027 | | Greenville/Spartanburg, SC | | 417 Apple Valley Rd. | | Duncan | | SC | | -- | | | | 195,000 | | | | - | | | | - | |
| | | | | Kansas City, MO | | 27200 West 157th St. | | New Century | | KS | | -- | | | | 446,500 | | | | 930 | | | | 850 | |
| | | 2/28/2027 | | Jackson, MS | | 554 Nissan Pkwy. | | Canton | | MS | | -- | | | | 1,466,000 | | | | 4,650 | | | | 4,661 | |
| | | 4/30/2027 | | Nashville, TN | | 200 Sam Griffin Rd. | | Smyrna | | TN | | -- | | | | 1,505,000 | | | | 4,920 | | | | 4,851 | |
| | | | | San Antonio, TX | | 16407 Applewhite Rd. | | San Antonio | | TX | | -- | | | | 849,275 | | | | 2,245 | | | | 2,197 | |
| | | 6/30/2027 | | Dallas/Ft Worth, TX | | 1501 Nolan Ryan Expy. | | Arlington | | TX | | 13 | | | | 74,739 | | | | 305 | | | | 315 | |
| | | 7/31/2027 | | Savannah, GA | | 335 Morgan Lakes Industrial Blvd. | | Pooler | | GA | | -- | | | | 499,500 | | | | 1,560 | | | | 1,536 | |
| | | 8/31/2027 | | Cincinnati/Dayton, OH | | 600 Gateway Blvd. | | Monroe | | OH | | -- | | | | 994,013 | | | | 2,959 | | | | 2,514 | |
| | | | | Shreveport/Bossier City, LA | | 5417 Campus Dr. | | Shreveport | | LA | | -- | | | | 257,849 | | | | 996 | | | | 1,052 | |
LEXINGTON REALTY TRUST
PROPERTY LEASES AND VACANCIES - 9/30/2021
Year of Lease
Expiration | | Date of Lease
Expiration | | CoStar Market (1) | | Property Location | | City | | State | | Note | | | Sq. Ft.
Leased or Available
(2) | | | Base Rent as of
9/30/2021
($000) (3) | | | Cash Base Rent as of
9/30/2021
($000) (3) | |
| INDUSTRIAL PROPERTIES |
| | | WAREHOUSE/DISTRIBUTION |
| 2027 | | 9/30/2027 | | Memphis, TN | | 1550 Hwy 302 | | Byhalia | | MS | | -- | | | | 615,600 | | | | 1,829 | | | | 1,849 | |
| | | 10/31/2027 | | Jackson, TN | | 201 James Lawrence Rd. | | Jackson | | TN | | -- | | | | 1,062,055 | | | | 2,958 | | | | 2,892 | |
| 2028 | | 1/31/2028 | | Atlanta, GA | | 490 Westridge Pkwy. | | McDonough | | GA | | -- | | | | 1,121,120 | | | | 2,803 | | | | 2,723 | |
| | | 3/31/2028 | | New York/New Jersey | | 29-01-Borden Ave./29-10 Hunters Point Ave. | | Long Island City | | NY | | -- | | | | 140,330 | | | | 3,851 | | | | 3,846 | |
| | | 5/31/2028 | | Nashville, TN | | 6050 Dana Way | | Antioch | | TN | | -- | | | | 50,400 | | | | 165 | | | | 130 | |
| | | 8/31/2028 | | Houston, TX | | 4100 Malone Drive | | Pasadena | | TX | | -- | | | | 233,190 | | | | 523 | | | | 477 | |
| | | | | Indianapolis, IN | | 4900 Albert S White Dr. | | Whitestown | | IN | | -- | | | | 63,840 | | | | 154 | | | | 25 | |
| 2029 | | 4/30/2029 | | Greenville/Spartanburg, SC | | 230 Apple Valley Rd. | | Duncan | | SC | | -- | | | | 275,400 | | | | 355 | | | | 330 | |
| | | 7/31/2029 | | Memphis, TN | | 8500 Nail Rd. | | Olive Branch | | MS | | -- | | | | 716,080 | | | | 2,063 | | | | 2,005 | |
| | | 8/31/2029 | | Dallas/Ft Worth, TX | | 8601 E. Sam Lee Ln. | | Northlake | | TX | | -- | | | | 1,214,526 | | | | 3,208 | | | | 2,977 | |
| | | 9/30/2029 | | Chicago, IL | | 6225 E. Minooka Rd. | | Minooka | | IL | | -- | | | | 1,034,200 | | | | 2,198 | | | | 2,045 | |
| | | 11/21/2029 | | Columbus. OH | | 1860 Walcutt Rd. | | Columbus | | OH | | -- | | | | 194,796 | | | | 124 | | | | 115 | |
| | | 11/30/2029 | | Chicago, IL | | 1460 Cargo Court | | Minooka | | IL | | -- | | | | 705,661 | | | | 2,143 | | | | 2,015 | |
| | | 12/31/2029 | | Greenville/Spartanburg, SC | | 402 Apple Valley Rd. | | Duncan | | SC | | -- | | | | 235,600 | | | | 316 | | | | 282 | |
| | | | | Chicago, IL | | 200 International Pkwy S | | Minooka | | IL | | -- | | | | 473,280 | | | | 1,603 | | | | 1,466 | |
| 2030 | | 1/31/2030 | | Dallas/Ft Worth, TX | | 3201 N. Houston School Rd. | | Lancaster | | TX | | -- | | | | 468,300 | | | | 1,252 | | | | 944 | |
| | | 3/31/2030 | | Memphis, TN | | 549 Wingo Rd. | | Byhalia | | MS | | -- | | | | 855,878 | | | | 3,291 | | | | 3,253 | |
| | | 5/31/2030 | | St. Louis, MO | | 4015 Lakeview Corporate Dr. | | Edwardsville | | IL | | -- | | | | 1,017,780 | | | | 2,594 | | | | 2,149 | |
| | | 6/30/2030 | | Dallas/Ft Worth, TX | | 1704 S. I-45 | | Hutchins | | TX | | -- | | | | 120,960 | | | | 463 | | | | 425 | |
| | | | | Richmond, VA | | 2601 Bermuda Hundred Rd. | | Chester | | VA | | 4 | | | | 1,034,470 | | | | 2,888 | | | | 2,934 | |
| | | | | Cincinnati/Dayton, OH | | 700 Gateway Blvd. | | Monroe | | OH | | -- | | | | 1,299,492 | | | | 4,137 | | | | 3,833 | |
| | | 8/31/2030 | | Central Florida | | 3400 NW 35th St. | | Ocala | | FL | | -- | | | | 617,055 | | | | 2,261 | | | | 2,073 | |
| | | 9/30/2030 | | Phoenix, AZ | | 255 143rd Ave. | | Goodyear | | AZ | | -- | | | | 801,424 | | | | 2,999 | | | | 2,763 | |
| 2031 | | 2/28/2031 | | Greenville/Spartanburg, SC | | 1021 Tyger Lake Rd. | | Spartanburg | | SC | | -- | | | | 213,200 | | | | 782 | | | | 602 | |
| | | 5/31/2031 | | DC/Baltimore, MD | | 291 Park Center Dr. | | Winchester | | VA | | -- | | | | 344,700 | | | | 1,293 | | | | 1,153 | |
LEXINGTON REALTY TRUST
PROPERTY LEASES AND VACANCIES - 9/30/2021
Year of Lease
Expiration | | Date of Lease
Expiration | | CoStar Market (1) | | Property Location | | City | | State | | Note | | | Sq. Ft.
Leased or Available
(2) | | | Base Rent as of
9/30/2021
($000) (3) | | | Cash Base Rent as of
9/30/2021
($000) (3) | |
| INDUSTRIAL PROPERTIES |
| | | WAREHOUSE/DISTRIBUTION |
| 2031 | | 6/30/2031 | | Nashville, TN | | 6050 Dana Way | | Antioch | | TN | | 9 | | | | 352,275 | | | | 877 | | | | 624 | |
| | | 12/18/2031 | | DC/Baltimore, MD | | 80 Tyson Dr. | | Winchester | | VA | | -- | | | | 400,400 | | | | 1,776 | | | | 1,648 | |
| 2032 | | 2/28/2032 | | Cincinnati/Dayton, OH | | 675 Gateway Blvd. | | Monroe | | OH | | 9 | | | | 143,664 | | | | 436 | | | | 468 | |
| | | 4/30/2032 | | Houston, TX | | 13930 Pike Rd. | | Missouri City | | TX | | -- | | | | - | | | | 1,592 | | | | 1,553 | |
| | | 8/24/2032 | | Detroit, MI | | 16950 Pine Dr. | | Romulus | | MI | | -- | | | | 500,023 | | | | 1,926 | | | | 1,851 | |
| | | 10/31/2032 | | Portland, OR | | 27255 SW 95th Ave. | | Wilsonville | | OR | | -- | | | | 508,277 | | | | 2,340 | | | | 2,101 | |
| 2033 | | 3/31/2033 | | Phoenix, AZ | | 3405 S. McQueen Rd. | | Chandler | | AZ | | -- | | | | 201,784 | | | | 3,374 | | | | 3,004 | |
| 2034 | | 4/30/2034 | | Raleigh, NC | | 1133 Poplar Creek Rd. | | Henderson | | NC | | -- | | | | 147,448 | | | | 411 | | | | 203 | |
| | | 10/31/2034 | | Champaign-Urbana, IL | | 1001 Innovation Rd. | | Rantoul | | IL | | -- | | | | 813,126 | | | | 3,147 | | | | 2,935 | |
| | | 12/31/2034 | | Greenville/Spartanburg, SC | | 27 Inland Pkwy. | | Greer | | SC | | -- | | | | 1,318,680 | | | | 4,158 | | | | 2,374 | |
| 2035 | | 10/22/2035 | | Detroit, MI | | 2860 Clark St. | | Detroit | | MI | | -- | | | | 189,960 | | | | 1,653 | | | | 1,653 | |
| 2036 | | 5/31/2036 | | Charlotte, NC | | 671 Washburn Switch Rd. | | Shelby | | NC | | -- | | | | 673,425 | | | | 2,089 | | | | 1,935 | |
| 2038 | | 3/31/2038 | | Houston, TX | | 13901/14035 Industrial Rd. | | Houston | | TX | | -- | | | | 132,449 | | | | 5,080 | | | | 4,615 | |
| | | WAREHOUSE/DISTRIBUTION INDUSTRIAL SUBTOTAL - SINGLE TENANT | | 46,799,809 | | | $ | 151,062 | | | $ | 141,686 | |
| MULTI-TENANT / VACANCY (7)(8) |
| | | WAREHOUSE/DISTRIBUTION |
| | | Various | | Boston, MA | | 121 Technology Dr. | | Durham | | NH | | 6,9,14
(9%) | | | | 500,500 | | | | 754 | | | | 1,369 | |
| | | WAREHOUSE/DISTRIBUTION INDUSTRIAL SUBTOTAL - MULTI-TENANT/VACANCY | | 500,500 | | | $ | 754 | | | $ | 1,369 | |
| WAREHOUSE/DISTRIBUTION - NOT STABILIZED (5) | | |
| 2027 | | 1/31/2027 | | Central Florida | | 5275 Drane Field Rd. | | Lakeland | | FL | | -- | | | | 68,420 | | | | - | | | | - | |
| 2031 | | 5/31/2031 | | Central Florida | | 5275 Drane Field Rd. | | Lakeland | | FL | | -- | | | | 117,440 | | | | 450 | | | | 230 | |
| | | Various | | Greenville/Spartanburg, SC | | 7820 Reidville Rd | | Greer | | SC | | 6
(62%) | | | | 210,820 | | | | 195 | | | | 179 | |
| | | Vacancy | | Central Florida | | 5275 Drane Field Rd. | | Lakeland | | FL | | -- | | | | 36,274 | | | | - | | | | - | |
| | | | | Central Florida | | 3775 Fancy Farms Rd | | Plant City | | FL | | -- | | | | 510,484 | | | | - | | | | - | |
| | | WAREHOUSE/DISTRIBUTION INDUSTRIAL SUBTOTAL - NOT STABILIZED | | 943,438 | | | $ | 645 | | | $ | 409 | |
| | | | | | | | | | | | | | | | | | | | | | | | | | |
| | | WAREHOUSE/DISTRIBUTION INDUSTRIAL SUBTOTAL | | 48,243,747 | | | $ | 152,461 | | | $ | 143,464 | |
LEXINGTON REALTY TRUST
PROPERTY LEASES AND VACANCIES - 9/30/2021
Year of Lease
Expiration | | Date of Lease
Expiration | | CoStar Market (1) | | Property Location | | City | | State | | Note | | | Sq. Ft.
Leased or Available
(2) | | | Base Rent as of
9/30/2021
($000) (3) | | | Cash Base Rent as of
9/30/2021
($000) (3) | |
| INDUSTRIAL PROPERTIES |
| SINGLE TENANT |
| | | COLD STORAGE |
| 2028 | | 8/31/2028 | | Atlanta, GA | | 1420 Greenwood Rd. | | McDonough | | GA | | -- | | | | 296,972 | | | | 1,627 | | | | 1,649 | |
| 2031 | | 10/31/2031 | | Chicago, IL | | 1020 W. Airport Rd. | | Romeoville | | IL | | -- | | | | 188,166 | | | | 2,754 | | | | 2,669 | |
| 2032 | | 10/31/2032 | | Detroit, MI | | 26700 Bunert Rd. | | Warren | | MI | | -- | | | | 260,243 | | | | 2,912 | | | | 2,709 | |
| 2034 | | 9/30/2034 | | Las Vegas, NV | | 5670 Nicco Way | | North Las Vegas | | NV | | -- | | | | 180,235 | | | | 1,917 | | | | 1,807 | |
| | | | | | | | | | | | | | | | | | | | | | | | | | |
| | | COLD STORAGE INDUSTRIAL SUBTOTAL | | 925,616 | | | $ | 9,210 | | | $ | 8,834 | |
| SINGLE TENANT |
| | | HEAVY MANUFACTURING | | | | | | | | | | | |
| 2023 | | 12/31/2023 | | Nashville, TN | | 120 Southeast Pkwy. Dr. | | Franklin | | TN | | -- | | | | 289,330 | | | | 551 | | | | 551 | |
| 2024 | | 4/30/2024 | | Portland/South Portland, ME | | 113 Wells St. | | North Berwick | | ME | | -- | | | | 993,685 | | | | 1,349 | | | | 1,220 | |
| | | 10/31/2024 | | Detroit, MI | | 43955 Plymouth Oaks Blvd. | | Plymouth | | MI | | -- | | | | 311,612 | | | | 1,193 | | | | 1,189 | |
| 2025 | | 6/30/2025 | | Nashville, TN | | 301 Bill Bryan Blvd. | | Hopkinsville | | KY | | -- | | | | 424,904 | | | | 1,266 | | | | 1,266 | |
| | | | | Elizabethtown-Fort Knox, KY | | 730 North Black Branch Rd. | | Elizabethtown | | KY | | -- | | | | 167,770 | | | | 403 | | | | 403 | |
| | | | | Elizabethtown-Fort Knox, KY | | 750 North Black Branch Rd. | | Elizabethtown | | KY | | -- | | | | 539,592 | | | | 2,129 | | | | 2,129 | |
| | | | | Owensboro, KY | | 4010 Airpark Dr. | | Owensboro | | KY | | -- | | | | 211,598 | | | | 906 | | | | 906 | |
| | | 7/14/2025 | | Charlotte, NC | | 590 Ecology Ln. | | Chester | | SC | | -- | | | | 420,597 | | | | 1,403 | | | | 1,848 | |
| | | 12/19/2025 | | Owensboro, KY | | 1901 Ragu Dr. | | Owensboro | | KY | | 11 | | | | 443,380 | | | | 1,411 | | | | 1,450 | |
| 2029 | | 11/24/2029 | | Anniston-Oxford, AL | | 318 Pappy Dunn Blvd. | | Anniston | | AL | | -- | | | | 276,782 | | | | 1,305 | | | | 1,289 | |
| 2033 | | 9/30/2033 | | Crossville, TN | | 900 Industrial Blvd. | | Crossville | | TN | | -- | | | | 222,200 | | | | 459 | | | | 433 | |
| 2035 | | 3/31/2035 | | Houston, TX | | 13863 Industrial Rd. | | Houston | | TX | | -- | | | | 187,800 | | | | 1,826 | | | | 1,682 | |
| | | | | Houston, TX | | 7007 F.M. 362 Rd. | | Brookshire | | TX | | -- | | | | 262,095 | | | | 1,433 | | | | 1,320 | |
| | | | | | | | | | | | | | | | | | | | | | | | | | |
| | | HEAVY MANUFACTURING INDUSTRIAL SUBTOTAL | | 4,751,345 | | | $ | 15,634 | | | $ | 15,686 | |
| SINGLE TENANT |
| | | LIGHT MANUFACTURING | | | | | | | | | | | |
| 2022 | | 8/31/2022 | | Greenville/Spartanburg, SC | | 50 Tyger River Dr. | | Duncan | | SC | | -- | | | | 221,833 | | | | 725 | | | | 790 | |
| 2024 | | 5/31/2024 | | Bingen, WA | | 901 East Bingen Point Way | | Bingen | | WA | | -- | | | | 124,539 | | | | 1,977 | | | | 2,023 | |
LEXINGTON REALTY TRUST
PROPERTY LEASES AND VACANCIES - 9/30/2021
Year of Lease
Expiration | | Date of Lease
Expiration | | CoStar Market (1) | | Property Location | | City | | State | | Note | | | Sq. Ft.
Leased or Available
(2) | | | Base Rent as of
9/30/2021
($000) (3) | | | Cash Base Rent as of
9/30/2021
($000) (3) | |
| INDUSTRIAL PROPERTIES |
| | | LIGHT MANUFACTURING |
| 2026 | | 11/30/2026 | | Lumberton, NC | | 2880 Kenny Biggs Rd. | | Lumberton | | NC | | -- | | | | 423,280 | | | | 1,171 | | | | 1,126 | |
| 2027 | | 12/31/2027 | | Cincinnati/Dayton, OH | | 10590 Hamilton Ave. | | Cincinnati | | OH | | -- | | | | 264,598 | | | | 610 | | | | 610 | |
| 2028 | | 9/30/2028 | | West Michigan | | 904 Industrial Rd. | | Marshall | | MI | | -- | | | | 246,508 | | | | 610 | | | | 577 | |
| 2031 | | 6/30/2031 | | Cincinnati/Dayton, OH | | 10000 Business Blvd. | | Dry Ridge | | KY | | -- | | | | 336,350 | | | | 1,146 | | | | 1,052 | |
| 2035 | | 6/30/2035 | | Dallas/Ft Worth, TX | | 2115 East Belt Line Rd. | | Carrollton | | TX | | -- | | | | 298,653 | | | | 992 | | | | 818 | |
| 2037 | | 3/31/2037 | | Dallas/Ft Worth, TX | | 4005 E I-30 | | Grand Prairie | | TX | | -- | | | | 215,000 | | | | 1,404 | | | | 1,240 | |
| 2042 | | 5/31/2042 | | Columbus, GA | | 4801 North Park Dr. | | Opelika | | AL | | -- | | | | 165,493 | | | | 2,433 | | | | 2,016 | |
| | | | | | | | | | | | | | | | | | | | | | | | | | |
| | | LIGHT MANUFACTURING INDUSTRIAL SUBTOTAL | | 2,296,254 | | | $ | 11,068 | | | $ | 10,252 | |
| | | | | | | | | | | | | | | | | | | | | | | | | | |
| INDUSTRIAL TOTAL/WEIGHTED AVERAGE | | | | 99.2% Leased (12) | | | | 56,216,962 | | | $ | 188,373 | | | $ | 178,236 | |
LEXINGTON REALTY TRUST
PROPERTY LEASES AND VACANCIES - 9/30/2021
Year of Lease
Expiration | | Date of Lease
Expiration | | CoStar Market (1) | | Property Location | | City | | State | | Note | | | Sq. Ft.
Leased or
Available (2) | | | Base Rent as of
9/30/2021
($000) (3) | | | Cash Base Rent as of
9/30/2021
($000) (3) | |
| OFFICE PROPERTIES |
| SINGLE TENANT |
| 2022 | | 1/31/2022 | | Dallas/Ft Worth, TX | | 1401 Nolan Ryan Expy. | | Arlington | | TX | | 13 | | | | 111,409 | | | | 513 | | | | 1,410 | |
| | | 3/31/2022 | | Philadelphia, PA | | 1701 Market St. | | Philadelphia | | PA | | -- | | | | 1,220 | | | | 35 | | | | 35 | |
| | | 7/31/2022 | | Tucson, AZ | | 1440 E 15th St. | | Tucson | | AZ | | -- | | | | 28,591 | | | | 408 | | | | 408 | |
| 2023 | | 9/30/2023 | | Philadelphia, PA | | 1701 Market St. | | Philadelphia | | PA | | -- | | | | 8,070 | | | | - | | | | - | |
| | | 11/30/2023 | | Dallas/Ft Worth, TX | | 1401 Nolan Ryan Expy. | | Arlington | | TX | | 13 | | | | 4,979 | | | | 71 | | | | 71 | |
| | | 12/14/2023 | | South Bay/San Jose, CA | | 3333 Coyote Hill Rd. | | Palo Alto | | CA | | -- | | | | 202,000 | | | | 4,981 | | | | 5,302 | |
| 2024 | | 1/31/2024 | | Philadelphia, PA | | 1701 Market St. | | Philadelphia | | PA | | -- | | | | 289,432 | | | | 3,198 | | | | 3,185 | |
| | | 2/14/2024 | | Florence, SC | | 1362 Celebration Blvd. | | Florence | | SC | | -- | | | | 32,000 | | | | 430 | | | | 458 | |
| | | 5/31/2024 | | Charlotte, NC | | 3476 Stateview Blvd. | | Fort Mill | | SC | | -- | | | | 169,083 | | | | 1,511 | | | | 1,524 | |
| | | | | Charlotte, NC | | 3480 Stateview Blvd. | | Fort Mill | | SC | | -- | | | | 169,218 | | | | 1,566 | | | | 1,525 | |
| | | 9/30/2024 | | Dallas/Ft Worth, TX | | 1401 Nolan Ryan Expy. | | Arlington | | TX | | 13 | | | | 23,228 | | | | 268 | | | | 253 | |
| 2025 | | 2/28/2025 | | Dallas/Ft Worth, TX | | 1401 Nolan Ryan Expy. | | Arlington | | TX | | 13 | | | | 13,590 | | | | 166 | | | | 171 | |
| | | 5/31/2025 | | Philadelphia, PA | | 1701 Market St. | | Philadelphia | | PA | | -- | | | | 2,641 | | | | 204 | | | | 204 | |
| 2027 | | 1/31/2027 | | Philadelphia, PA | | 1701 Market St. | | Philadelphia | | PA | | -- | | | | 1,975 | | | | 46 | | | | 20 | |
| 2031 | | 11/30/2031 | | New York/New Jersey | | 4 Apollo Drive | | Whippany | | NJ | | -- | | | | 123,734 | | | | 1,530 | | | | 1,521 | |
| N/A | | Vacancy | | Dallas/Ft Worth, TX | | 1401 Nolan Ryan Expy. | | Arlington | | TX | | 13 | | | | 8,602 | | | | - | | | | - | |
| | | | | Philadelphia, PA | | 1701 Market St. | | Philadelphia | | PA | | -- | | | | 699 | | | | - | | | | - | |
| | | N/A | | Philadelphia, PA | | 1701 Market St. | | Philadelphia | | PA | | -- | | | | - | | | | 659 | | | | 659 | |
| | | | | | | | | | | | | | | | | | | | | | | | | | |
| SINGLE TENANT OFFICE TOTAL | | | | 1,190,471 | | | $ | 15,586 | | | $ | 16,746 | |
| MULTI-TENANT / VACANCY (7)(8) |
| N/A | | Vacancy | | Atlanta, GA | | 3500 North Loop Rd. | | McDonough | | GA | | 9 | | | | 62,218 | | | | 594 | | | | 594 | |
| | | Various | | Baton Rouge, LA | | 4455 American Way | | Baton Rouge | | LA | | 6, 14 (36%) | | | | 66,352 | | | | 304 | | | | 309 | |
| | | Various | | Phoenix, AZ | | 13430 North Black Canyon Fwy. | | Phoenix | | AZ | | 6 (61%) | | | | 138,940 | | | | 1,006 | | | | 1,129 | |
| | | | | | | | | | | | | | | | | | | | | | | | | | |
| MULTI-TENANT/VACANCY OFFICE TOTAL | | | | 267,510 | | | $ | 1,904 | | | $ | 2,032 | |
| OFFICE SUBTOTAL/WEIGHTED AVERAGE | | | | 88.5% Leased | | | | 1,457,981 | | | $ | 17,490 | | | $ | 18,778 | |
LEXINGTON REALTY TRUST
PROPERTY LEASES AND VACANCIES - 9/30/2021
| Year of Lease Expiration | | Date of Lease Expiration | | CoStar Market (1) | | Property Location | | City | | State | | Note | | | Sq. Ft.
Leased or Available (2) | | | Base Rent as of
9/30/2021
($000) (3) | | | Cash Base Rent as of 9/30/2021
($000) (3) | |
| OTHER PROPERTIES |
| SINGLE TENANT |
| SPECIALTY |
| 2048 | | 12/31/2048 | | DC/Baltimore, MD | | 30 Light St. | | Baltimore | | MD | | -- | | | | - | | | | 233 | | | | 233 | |
| | | | | | | | | | | | | | | | | | | | | | | | | | |
| SINGLE TENANT OTHER TOTAL | | | | | | | | - | | | $ | 233 | | | $ | 233 | |
| | | | | | | | | | | | | | | | | | | | | | | | | | |
| OTHER SUBTOTAL/WEIGHTED AVERAGE | | | | 100% Leased | | | | - | | | $ | 233 | | | $ | 233 | |
| | | | | | | | | | | | | | | | | | | | | | | | | | |
| TOTAL OFFICE & OTHER/WEIGHTED AVERAGE | | | | 88.5% Leased | | | | 1,457,981 | | | $ | 17,723 | | | $ | 19,011 | |
| | | | | | | | | | | | | | | | | | | | | | | | | | |
| TOTAL CONSOLIDATED PORTFOLIO/WEIGHTED AVERAGE | | | | 98.9% Leased (12) | | | | 57,674,943 | | | $ | 206,096 | | | $ | 197,247 | |
LEXINGTON REALTY TRUST
PROPERTY LEASES AND VACANCIES - 9/30/2021
Year of Lease
Expiration | | Date of Lease
Expiration | | CoStar Market (1) | | Property Location | | City | | State | | Note | | Sq. Ft.
Leased or
Available (2) | | | LXP %
Ownership | | | Base Rent as of
9/30/2021
($000) (3) | | | Cash Base Rent as of
9/30/2021
($000) (3) | |
| NON-CONSOLIDATED PROPERTIES |
| NNN OFFICE JV PROPERTIES | | | |
| 2022 | | 12/31/2022 | | Chicago, IL | | 231 N. Martingale Rd. | | Schaumburg | | IL | | -- | | | 317,198 | | | | 20 | % | | | 3,449 | | | | 3,640 | |
| 2023 | | 3/31/2023 | | Dallas/Ft Worth, TX | | 8900 Freeport Pkwy. | | Irving | | TX | | -- | | | 268,445 | | | | 20 | % | | | 3,695 | | | | 3,520 | |
| 2025 | | 3/14/2025 | | Dallas/Ft Worth, TX | | 601 & 701 Experian Pkwy. | | Allen | | TX | | -- | | | 292,700 | | | | 20 | % | | | 2,430 | | | | 2,305 | |
| | | 6/30/2025 | | Atlanta, GA | | 2500 Patrick Henry Pkwy. | | McDonough | | GA | | -- | | | 111,911 | | | | 20 | % | | | 1,221 | | | | 1,099 | |
| | | 12/31/2025 | | Dallas/Ft Worth, TX | | 4001 International Pkwy. | | Carrollton | | TX | | -- | | | 138,443 | | | | 20 | % | | | 1,901 | | | | 1,852 | |
| 2026 | | 3/31/2026 | | Columbus, OH | | 500 Olde Worthington Rd. | | Westerville | | OH | | -- | | | 97,000 | | | | 20 | % | | | 1,008 | | | | 927 | |
| | | 4/30/2026 | | Richmond, VA | | 800 East Canal St. | | Richmond | | VA | | -- | | | 2,568 | | | | 20 | % | | | 51 | | | | 51 | |
| 2027 | | 2/28/2027 | | Richmond, VA | | 800 East Canal St. | | Richmond | | VA | | -- | | | 8,503 | | | | 20 | % | | | 160 | | | | 117 | |
| | | 6/30/2027 | | Kansas City, MO | | 3902 Gene Field Rd. | | St. Joseph | | MO | | -- | | | 98,849 | | | | 20 | % | | | 1,587 | | | | 1,528 | |
| | | 7/6/2027 | | Columbus, OH | | 2221 Schrock Rd. | | Columbus | | OH | | -- | | | 42,290 | | | | 20 | % | | | 513 | | | | 495 | |
| | | 8/7/2027 | | Philadelphia, PA | | 25 Lakeview Dr. | | Jessup | | PA | | -- | | | 150,000 | | | | 20 | % | | | 1,748 | | | | 1,684 | |
| 2030 | | 8/31/2030 | | Richmond, VA | | 800 East Canal St. | | Richmond | | VA | | -- | | | 224,537 | | | | 20 | % | | | 5,292 | | | | 5,499 | |
| | | 9/30/2030 | | Richmond, VA | | 800 East Canal St. | | Richmond | | VA | | -- | | | 25,707 | | | | 20 | % | | | 578 | | | | 501 | |
| | | 10/31/2030 | | Richmond, VA | | 800 East Canal St. | | Richmond | | VA | | -- | | | 4,235 | | | | 20 | % | | | 91 | | | | 91 | |
| 2031 | | 1/10/2031 | | Houston, TX | | 810 Gears Rd. | | Houston | | TX | | -- | | | 68,985 | | | | 20 | % | | | 901 | | | | 1,069 | |
| | | 3/1/2031 | | Richmond, VA | | 800 East Canal St. | | Richmond | | VA | | -- | | | 26,047 | | | | 20 | % | | | 633 | | | | 559 | |
| | | 9/30/2031 | | Richmond, VA | | 800 East Canal St. | | Richmond | | VA | | -- | | | 7,105 | | | | 20 | % | | | 28 | | | | 28 | |
| 2032 | | 4/30/2032 | | Richmond, VA | | 800 East Canal St. | | Richmond | | VA | | -- | | | 14,330 | | | | 20 | % | | | - | | | | - | |
| | | | | Charlotte, NC | | 1210 AvidXchange Ln. | | Charlotte | | NC | | -- | | | 201,450 | | | | 20 | % | | | 4,519 | | | | 4,154 | |
| | | 9/30/2032 | | Houston, TX | | 10001 Richmond Ave. | | Houston | | TX | | -- | | | 554,385 | | | | 20 | % | | | 4,441 | | | | 4,579 | |
| 2035 | | 2/28/2035 | | Dallas/Ft Worth, TX | | 6555 Sierra Dr. | | Irving | | TX | | -- | | | 247,254 | | | | 20 | % | | | 3,722 | | | | 2,934 | |
| | | 4/30/2035 | | Parachute, CO | | 143 Diamond Ave. | | Parachute | | CO | | -- | | | 49,024 | | | | 20 | % | | | 867 | | | | 884 | |
| 2088 | | 8/8/2088 | | Richmond, VA | | 800 East Canal St. | | Richmond | | VA | | -- | | | - | | | | 20 | % | | | 267 | | | | 314 | |
LEXINGTON REALTY TRUST
PROPERTY LEASES AND VACANCIES - 9/30/2021
Year of Lease
Expiration | | Date of Lease
Expiration | | CoStar Market (1) | | Property Location | | City | | State | | Note | | | Sq. Ft.
Leased or
Available (2) | | | LXP %
Ownership | | | Base Rent as of
9/30/2021
($000) (3) | | | Cash Base Rent as of
9/30/2021
($000) (3) | |
| NNN OFFICE JV PROPERTIES | | | |
| N/A | | Vacancy | | Houston, TX | | 810 Gears Rd. | | Houston | | TX | | -- | | | | 9,910 | | | | 20 | % | | | - | | | | - | |
| | | | | Richmond, VA | | 800 East Canal St. | | Richmond | | VA | | -- | | | | 17,277 | | | | 20 | % | | | - | | | | - | |
| | | | | | | | | | | | | | | | | | | | | | | | | | | | | | |
| NNN OFFICE JV TOTAL/WEIGHTED AVERAGE | | | | 99.1% Leased | | | | 2,978,153 | | | | | | | $ | 39,102 | | | $ | 37,830 | |
| | | | | | | | | | | | | | | | | | | | | | | | | | | | | | |
| OTHER NON-CONSOLIDATED PROPERTIES | | | |
| | | | | | | | | | | | | | | | | | | | | | | | | | | | | | |
| 2036 | | 8/31/2036 | | Houston, TX | | 2203 North Westgreen Blvd. | | Katy | | TX | | -- | | | | 274,000 | | | | 25 | % | | | 5,126 | | | | 5,126 | |
| | | | | | | | | | | | | | | | | | | | | | | | | | | | | | |
| OTHER NON-CONSOLIDATED TOTAL/WEIGHTED AVERAGE | | | | 100% Leased | | | | 274,000 | | | | | | | $ | 5,126 | | | $ | 5,126 | |
| | | | | | | | | | | | | | | | | | | | | | | | | | | | | | |
| NON-CONSOLIDATED TOTAL/WEIGHTED AVERAGE | | | | 99.2% Leased | | | | 3,252,153 | | | | | | | $ | 44,228 | | | $ | 42,956 | |
| Footnotes |
| 1 | Based on CoStar.com inventory data. |
| 2 | Square footage leased or available. |
| 3 | Nine months ended 9/30/2021 Base Rent and Cash Base Rent. |
| 4 | Property includes four warehouses (252,351 square feet each) and one other property (25,066 square feet). |
| 5 | Property not in Stabilized Portfolio at 9/30/2021. |
| 6 | Represents percent leased as of 9/30/2021. |
| 7 | Multi-tenant properties are properties less than 50% leased to a single tenant. |
| 8 | The multi-tenanted / vacant properties incurred approximately $1.4 million in operating expenses, net for the nine months ended 9/30/2021. |
| 9 | Base Rent and Cash Base Rent amounts represent/include prior tenant. |
| 10 | New leases for an aggregate 52,978 square feet commence 10/26/2021. |
| 11 | Lexington has a 71.1% interest in this property. |
| 12 | Percent leased is for Stabilized Portfolio at 9/30/2021. |
| 13 | Property held for sale at 9/30/2021. |
| 14 | Property held for sale at 9/30/2021 and disposed of subsequent to 9/30/2021. |
LEXINGTON REALTY TRUST MORTGAGES AND NOTES PAYABLE |
9/30/2021
| Property | | Footnotes | | | Debt
Balance
($000) | | | Interest
Rate (%) | | | Maturity (a) | | | Current Estimated Annual Debt Service ($000) (b) | | | Balloon Payment
($000) | |
| INDUSTRIAL (f) | | | | | | | | | | | | |
| Chester, SC | | | | | | $ | 4,244 | | | | 5.380 | % | | | 08/2025 | | | $ | 1,144 | | | $ | 362 | |
| Long Island City, NY | | | | | | | 29,942 | | | | 3.500 | % | | | 03/2028 | | | | 4,879 | | | | - | |
| Goodyear, AZ | | | | | | | 41,819 | | | | 4.290 | % | | | 08/2031 | | | | 2,484 | | | | 33,399 | |
| Warren, MI | | | | | | | 25,850 | | | | 5.380 | % | | | 11/2032 | | | | 1,391 | | | | 22,037 | |
| Industrial Subtotal/Wtg. Avg./Years Remaining (c) | | | | | | $ | 101,855 | | | | 4.380 | % | | | 8.9 | | | $ | 9,898 | | | $ | 55,798 | |
| | | | | | | | | | | | | | | | | | | | | | | | | |
| OFFICE (f) | | | | | | | | | | | | | | | | | | | | | | | | |
| Palo Alto, CA | | | | | | $ | 15,420 | | | | 3.970 | % | | | 12/2023 | | | $ | 7,059 | | | $ | - | |
| Office Subtotal/Wtg. Avg./Years Remaining (c) | | | | | | $ | 15,420 | | | | 3.970 | % | | | 2.2 | | | $ | 7,059 | | | $ | - | |
| | | | | | | | | | | | | | | | | | | | | | | | | |
| Subtotal/Wtg. Avg./Years Remaining (c) | | | | | | $ | 117,275 | | | | 4.326 | % | | | 8.0 | | | $ | 16,957 | | | $ | 55,798 | |
| | | | | | | | | | | | | | | | | | | | | | | | | |
| CORPORATE (e) | | | | | | | | | | | | | | | | | | | | | | | | |
| Revolving Credit Facility | | | (g) | | | $ | - | | | | - | | | | 02/2023 | | | $ | - | | | $ | - | |
| Senior Notes | | | | | | | 198,932 | | | | 4.400 | % | | | 06/2024 | | | | 8,753 | | | | 198,932 | |
| Senior Notes | | | | | | | 400,000 | | | | 2.700 | % | | | 09/2030 | | | | 10,800 | | | | 400,000 | |
| Senior Notes | | | (j) | | | | 400,000 | | | | 2.375 | % | | | 10/2031 | | | | 9,500 | | | | 400,000 | |
| Term Loan | | | (h) | | | | 300,000 | | | | 2.732 | % | | | 01/2025 | | | | 8,310 | | | | 300,000 | |
| Trust Preferred Notes | | | (i) | | | | 129,120 | | | | 1.829 | % | | | 04/2037 | | | | 2,394 | | | | 129,120 | |
| Subtotal/Wtg. Avg./Years Remaining (c) | | | | | | $ | 1,428,052 | | | | 2.774 | % | | | 7.8 | | | $ | 39,757 | | | $ | 1,428,052 | |
| | | | | | | | | | | | | | | | | | | | | | | | | |
| Total/Wtg. Avg./Years Remaining (c) | | | (d) | | | $ | 1,545,327 | | | | 2.892 | % | | | 7.8 | | | $ | 56,714 | | | $ | 1,483,850 | |
LEXINGTON REALTY TRUST MORTGAGES AND NOTES PAYABLE (CONTINUED) |
9/30/2021
($000)
| | | GAAP Balance | | | Deferred Loan
Costs, net | | | Discounts | | | Gross Balance | |
| Mortgages and notes payable (f) | | $ | 115,633 | | | $ | 1,642 | | | $ | - | | | $ | 117,275 | |
| Term loans payable (e) | | | 298,320 | | | | 1,680 | | | | - | | | | 300,000 | |
| Senior notes payable(e) | | | 987,590 | | | | 7,582 | | | | 3,760 | | | | 998,932 | |
| Trust preferred securities (e) | | | 127,570 | | | | 1,550 | | | | - | | | | 129,120 | |
| Consolidated debt | | $ | 1,529,113 | | | $ | 12,454 | | | $ | 3,760 | | | $ | 1,545,327 | |
| Footnotes |
| (a) | Subtotal and total based on weighted-average term to maturity shown in years based on debt balance. |
| (b) | Remaining payments for debt with less than 12 months to maturity, all others are debt service for next 12 months. |
| (c) | Total shown may differ from detailed amounts due to rounding. |
| (d) | See reconciliations of non-GAAP measures in this document. |
| (e) | Unsecured. |
| (f) | Secured. |
| (g) | Rate ranges from LIBOR plus 0.775% to 1.45%. |
| (h) | Rate ranges from LIBOR plus 0.85% to 1.65%. LIBOR rate was fixed at 1.732% through January 2025 via interest rate swap agreements. |
| (i) | Rate is three month LIBOR plus 170 bps. |
| (j) | On August 30, 2021, completed an offering of $400,000 Senior Notes at a coupon of 2.375%, maturing on October 1, 2031. |
| | The net proceeds and cash on hand were used to redeem the $188,756 aggregate principal balance of the 2023 Senior Notes and the outstanding balance of $215,000 on the Revolving Credit Facility. |
LEXINGTON REALTY TRUST DEBT MATURITY SCHEDULE |
9/30/2021
($000)
| Consolidated Properties |
| Year | | | | Mortgage
Scheduled
Amortization | | | | Mortgage
Balloon Payments | | | | Corporate Debt | |
| 2021 - remaining | | | $ | 2,982 | | | $ | - | | | $ | - | |
| 2022 | | | | 12,224 | | | | - | | | | - | |
| 2023 | | | | 13,267 | | | | - | | | | - | |
| 2024 | | | | 6,431 | | | | - | | | | 198,932 | |
| 2025 | | | | 6,214 | | | | 362 | | | | 300,000 | |
| | | | $ | 41,118 | | | $ | 362 | | | $ | 498,932 | |
Debt Maturity Profile (1)
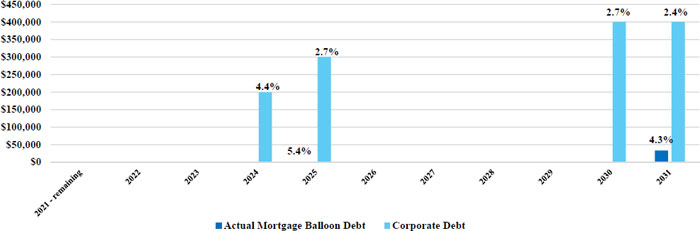
Footnotes
| (1) | Percentage denotes weighted-average interest rate. |
LEXINGTON REALTY TRUST DEBT COVENANTS (1) |
CORPORATE LEVEL DEBT
| | | MUST BE: | | 9/30/2021 | |
| Bank Loans: | | | | | |
| | | | | | | | |
| | | Maximum Leverage | | < 60% | | 38.8 | % |
| | | Fixed Charge Coverage | | > 1.5x | | 3.6 | x |
| | | Recourse Secured Indebtedness Ratio | | < 10% cap value | | 0.0 | % |
| | | Secured Indebtedness Ratio | | < 40% | | 5.1 | % |
| | | Unsecured Debt Service Coverage | | > 2.0x | | 5.7 | x |
| | | Unencumbered Leverage | | < 60% | | 36.8 | % |
| | | | | | | | |
| Bonds: | | | | | |
| | | | | | | | |
| | | Debt to Total Assets | | < 60% | | 33.4 | % |
| | | Secured Debt to Total Assets | | < 40% | | 2.5 | % |
| | | Debt Service Coverage | | > 1.5x | | 5.4 | x |
| | | Unencumbered Assets to Unsecured Debt | | > 150% | | 305.0 | % |
| Footnotes |
| (1) | The above is a summary of the key financial covenants for Lexington’s credit facility and term loan and senior notes, as of September 30, 2021 and as defined and calculated per the terms of the credit facility and term loan and senior notes, as of such date and applicable. These calculations are presented to show Lexington’s compliance with such covenants only and are not measures of Lexington’s liquidity or performance. |
LEXINGTON REALTY TRUST COMPONENTS OF NET ASSEST VALUE |
9/30/2021
($000)
The purpose of providing the following information is to enable readers to derive their own estimates of net asset value. This information is not intended to be an asset-by-asset or enterprise valuation.
| | | |
| Consolidated properties nine-month net operating income (NOI) (1) | | | | |
| Industrial | | $ | 170,979 | |
| Office/Other | | | 14,123 | |
| Total Net Operating Income | | $ | 185,102 | |
| | | | | |
| Lexington’s share of non-consolidated nine-month NOI (1) | | | | |
| NNN OFFICE JV | | | | |
| Office | | $ | 7,464 | |
| OTHER JV | | | | |
| Other | | $ | 1,159 | |
| | | | | |
| Other income | | | | |
| Advisory fees | | $ | 2,286 | |
| | | | | |
| | | | Nine months ended | |
| NOI for NAV Reconciliation: | | | 9/30/2021 | |
| | | | | |
| NOI as reported | | $ | 198,929 | |
| Less NOI: | | | | |
| Disposed of properties | | | (6,178 | ) |
| Held for sale assets | | | (3,212 | ) |
| Assets acquired in 2021 | | | (3,807 | ) |
| Assets less than 70% leased / Other | | | (630 | ) |
| NOI for NAV | | $ | 185,102 | |
| In service assets not fairly valued by capitalized NOI method (1) | | | | |
| Wholly-owned assets acquired/completed in 2021 | | $ | 403,997 | |
| Wholly-owned assets less than 70% leased | | $ | 21,882 | |
| | | | | |
| Add other assets: | | | | |
| Assets held for sale - consolidated | | $ | 30,145 | |
| Construction in progress | | | 2,988 | |
| Developable land | | | 21,497 | |
| Development investment at cost incurred | | | 154,969 | |
| Cash and cash equivalents | | | 150,077 | |
| Restricted cash | | | 373 | |
| Accounts receivable | | | 1,998 | |
| Other assets | | | 12,661 | |
| Total other assets | | $ | 374,708 | |
| | | | | |
| Liabilities: | | | | |
| Corporate level debt (face amount) | | $ | 1,428,052 | |
| Mortgages and notes payable (face amount) | | | 117,275 | |
| Dividends payable | | | 34,283 | |
| Liabilities held for sale - consolidated | | | 1,122 | |
| Accounts payable, accrued expenses and other liabilities | | | 79,998 | |
| Preferred stock, at liquidation value | | | 96,770 | |
| Lexington’s share of non-consolidated mortgages (face amount) | | | 81,560 | |
| Total deductions | | $ | 1,839,060 | |
| | | | | |
| Common shares & OP units at 9/30/2021 | | | 283,566,962 | |
Footnotes
| (1) | NOI for the existing property portfolio at September 30, 2021, excludes NOI related to assets undervalued by a capitalized NOI method and assets held for sale. Assets undervalued by a capitalized NOI method are identified generally by occupancies under 70% during the period, assets placed into service and assets acquired in 2021. For assets in this category an NOI capitalization approach is not appropriate, and accordingly, Lexington’s net book value has been used. |
LEXINGTON REALTY TRUST NON-GAAP MEASURES |
DEFINITIONS
Lexington has used non-GAAP financial measures as defined by the Securities and Exchange Commission Regulation G in this Quarterly Supplemental Information and in other public disclosures.
Lexington believes that the measures defined below are helpful to investors in measuring our performance or that of an individual investment. Since these measures exclude certain items which are included in their respective most comparable Generally Accepted Accounting Principles (“GAAP”) measures, reliance on the measures has limitations; management compensates for these limitations by using the measures simply as supplemental measures that are weighed in balance with other GAAP measures. These measures are not necessarily indications of our cash flow available to fund operations. Additionally, they should not be used as an alternative to the respective most comparable GAAP measures when evaluating Lexington’s financial performance or cash flow from operating, investing, or financing activities or liquidity.
Definitions:
Adjusted EBITDA: Adjusted EBITDA represents EBITDA (earnings before interest, taxes, depreciation and amortization) modified to include other adjustments to GAAP net income for gains on sales of properties, impairment charges, debt satisfaction gains (losses), net, non-cash charges, net, straight-line adjustments, non-recurring charges and adjustments for pro-rata share of non-wholly owned entities. Lexington’s calculation of Adjusted EBITDA may not be comparable to similarly titled measures used by other companies. Lexington believes that net income is the most directly comparable GAAP measure to Adjusted EBITDA.
Base Rent: Base Rent is calculated by making adjustments to GAAP rental revenue to exclude billed tenant reimbursements and lease termination income and to include ancillary income. Base Rent excludes reserves/write-offs of deferred rent receivable, as applicable. Lexington believes Base Rent provides a meaningful measure due to the net lease structure of leases in the portfolio. The following is a reconciliation of rental revenue to Base Rent.
| | | Nine months ended | |
| | | 9/30/2021 ($000) | |
| | | | | |
| Rental revenue as reported | | $ | 254,570 | |
| | | | | |
| Base Rent from sold properties | | | (6,044 | ) |
| Lease termination income | | | (14,105 | ) |
| Ancillary revenue | | | 659 | |
| Reimbursements | | | (28,984 | ) |
| | | | | |
| Base Rent per supplement | | $ | 206,096 | |
LEXINGTON REALTY TRUST NON-GAAP MEASURES |
DEFINITIONS
Cash Base Rent: Cash Base Rent is calculated by making adjustments to GAAP rental revenue to remove the impact of GAAP required adjustments to rental income such as adjustments for straight-line rents related to free rent periods and contractual rent increases. Cash Base Rent excludes billed tenant reimbursements and lease termination income and includes ancillary income. Lexington believes Cash Base Rent provides a meaningful indication of an investments ability to fund cash needs. The following is a reconciliation of Base Rent to Cash Base Rent.
| | | Nine months ended |
| | | 9/30/2021 ($000) | |
| | | | | |
| Base Rent per supplement | | $ | 206,096 | |
| | | | | |
| Straight-line adjustments | | | (8,172 | ) |
| Lease incentive | | | 534 | |
| Amortization of above/below market leases | | | (1,211 | ) |
| | | | | |
| Cash Base Rent per supplement | | $ | 197,247 | |
Company Funds Available for Distribution (“FAD”): FAD is calculated by making adjustments to Adjusted Company FFO (see below) for (1) straight-line adjustments, (2) lease incentive amortization, (3) amortization of above/below market leases, (4) lease termination payments, net, (5) non-cash interest, net, (6) non-cash charges, net, (7) cash paid for second generation tenant improvements, and (8) cash paid for second generation lease costs. Although FAD may not be comparable to that of other real estate investment trusts (“REITs”), Lexington believes it provides a meaningful indication of its ability to fund cash needs. FAD is a non-GAAP financial measure and should not be viewed as an alternative measurement of operating performance to net income, as an alternative to net cash flows from operating activities or as a measure of liquidity.
First Generation Costs: Represents cash spend for tenant improvements, leasing costs and base building work for in-service development projects and expenditures contemplated at acquisition for recently acquired properties. Because all companies do not calculate First Generation Costs the same way, Lexington’s presentation may not be comparable to similarly titled measures of other companies.
Funds from Operations (“FFO”) and Adjusted Company FFO: Lexington believes that Funds from Operations, or FFO, which is a non-GAAP measure, is a widely recognized and appropriate measure of the performance of an equity real estate investment trust (“REIT”). Lexington believes FFO is frequently used by securities analysts, investors and other interested parties in the evaluation of REITs, many of which present FFO when reporting their results. FFO is intended to exclude GAAP historical cost depreciation and amortization of real estate and related assets, which assumes that the value of real estate diminishes ratably over time. Historically, however, real estate values have risen or fallen with market conditions. As a result, FFO provides a performance measure that, when compared year over year, reflects the impact to operations from trends in occupancy rates, rental rates, operating costs, development activities, interest costs and other matters without the inclusion of depreciation and amortization, providing perspective that may not necessarily be apparent from net income.
LEXINGTON REALTY TRUST NON-GAAP MEASURES |
DEFINITIONS
The National Association of Real Estate Investment Trusts, or NAREIT, defines FFO as “net income (calculated in accordance with GAAP), excluding depreciation and amortization related to real estate, gains and losses from the sales of certain real estate assets, gains and losses from change in control and impairment write-downs of certain real estate assets and investments in entities when the impairment is directly attributable to decreases in value of depreciable real estate held by the entity. The reconciling items include amounts to adjust earnings from consolidated partially-owned entities and equity in earnings of unconsolidated affiliates to FFO.” FFO does not represent cash generated from operating activities in accordance with GAAP and is not indicative of cash available to fund cash needs.
Lexington presents FFO available to common shareholders and unitholders - basic and also presents FFO available to all equityholders and unitholders - diluted on a company-wide basis as if all securities that are convertible, at the holder’s option, into Lexington’s common shares, are converted at the beginning of the period. Lexington also presents Adjusted Company FFO available to all equityholders and unitholders - diluted which adjusts FFO available to all equityholders and unitholders - diluted for certain items which we believe are not indicative of the operating results of Lexington’s real estate portfolio. Lexington believes this is an appropriate presentation as it is frequently requested by security analysts, investors and other interested parties. Since others do not calculate these measures in a similar fashion, these measures may not be comparable to similarly titled measures as reported by others. These measures should not be considered as an alternative to net income as an indicator of Lexington’s operating performance or as an alternative to cash flow as a measure of liquidity.
Net Operating Income (NOI): NOI is a measure of operating performance used to evaluate the individual performance of an investment. This measure is not presented or intended to be viewed as a liquidity or performance measure that presents a numerical measure of Lexington’s historical or future financial performance, financial position or cash flows. Lexington defines NOI as operating revenues (rental income (less GAAP rent adjustments and lease termination income, net) and other property income) less property operating expenses. Other REITs may use different methodologies for calculating NOI, and accordingly, Lexington’s NOI may not be comparable to that of other companies. Because NOI excludes general and administrative expenses, interest expense, depreciation and amortization, acquisition-related expenses, other nonproperty income and losses, and gains and losses from property dispositions, it provides a performance measure that, when compared year over year, reflects the revenues and expenses directly associated with owning and operating commercial real estate and the impact to operations from trends in occupancy rates, rental rates, and operating costs, providing a perspective on operations not immediately apparent from net income. Lexington believes that net income is the most directly comparable GAAP measure to NOI.
Same-Store NOI: Same-Store NOI represents the NOI for consolidated properties that were owned and included in our portfolio for two comparable reporting periods. As Same-Store NOI excludes the change in NOI from acquired and disposed of properties, it highlights operating trends such as occupancy levels, rental rates and operating costs on properties. Other REITs may use different methodologies for calculating Same-Store NOI, and accordingly, Lexington’s Same-Store NOI may not be comparable to other REITs. Management believes that Same-Store NOI is a useful supplemental measure of Lexington’s operating performance. However, Same-Store NOI should not be viewed as an alternative measure of Lexington’s financial performance since it does not reflect the operations of Lexington’s entire portfolio, nor does it reflect the impact of general and administrative expenses, acquisition-related expenses, interest expense, depreciation and amortization costs, other nonproperty income and losses, the level of capital expenditures and leasing costs necessary to maintain the operating performance of Lexington’s properties, or trends in development and construction activities which are significant economic costs and activities that could materially impact Lexington’s results from operations. Lexington believes that net income is the most directly comparable GAAP measure to Same-Store NOI.
Second Generation Costs: Represents cash spend for tenant improvements and leasing costs to maintain revenues at existing properties and are a component of the FAD calculation.
LEXINGTON REALTY TRUST SELECT CREDIT METRICS DEFINITIONS |
($000)
| Adjusted Company FFO Payout: | | | Nine months ended
September 30, 2021 | | | (Debt + Preferred) / Gross Assets: | | | Nine months ended
September 30, 2021 | |
| Common share dividends per share | | $ | 0.3225 | | | Consolidated debt | | $ | 1,529,113 | |
| Adjusted Company FFO per diluted share | | | 0.59 | | | Preferred shares liquidation preference | | | 96,770 | |
| Adjusted Company FFO payout ratio | | | 54.7 | % | | Debt and preferred | | $ | 1,625,883 | |
| | | | | | | | | | | |
| Unencumbered Assets: | | | | | | Total assets | | $ | 3,758,477 | |
| Real estate, at cost | | $ | 4,309,939 | | | Plus depreciation and amortization: | | | | |
| Held for sale real estate, at cost | | | 43,823 | | | Real estate | | | 911,410 | |
| Other asset - note receivable | | | 1,495 | | | Deferred lease costs | | | 9,815 | |
| less encumbered real estate, at cost | | | (218,902 | ) | | Held for sale assets | | | 16,212 | |
| Unencumbered assets | | $ | 4,136,355 | | | | | | | |
| | | | | | | Gross assets | | $ | 4,695,914 | |
| Unencumbered NOI: | | | | | | | | | | |
| NOI | | $ | 198,929 | | | (Debt + Preferred) / Gross Assets | | | 34.6 | % |
| Disposed of properties NOI | | | (6,178 | ) | | | | | | |
| Adjusted NOI | | | 192,751 | | | Debt / Gross Assets: | | | | |
| less encumbered adjusted NOI | | | (16,455 | ) | | Consolidated debt | | $ | 1,529,113 | |
| Unencumbered adjusted NOI | | $ | 176,296 | | | | | | | |
| | | | | | | Gross assets | | $ | 4,695,914 | |
| Unencumbered NOI % | | | 91.5 | % | | | | | | |
| | | | | | | Debt / Gross assets | | | 32.6 | % |
| Net Debt / Adjusted EBITDA: | | | | | | | | | | |
| Adjusted EBITDA | | $ | 270,557 | | | Secured Debt / Gross Assets: | | | | |
| | | | | | | Total Secure Debt | | $ | 115,633 | |
| Consolidated debt | | $ | 1,529,113 | | | | | | | |
| less consolidated cash and cash equivalents | | | (150,077 | ) | | Gross assets | | $ | 4,695,914 | |
| Non-consolidated debt, net | | | 79,342 | | | | | | | |
| Net debt | | $ | 1,458,378 | | | Secured Debt / Gross Assets | | | 2.5 | % |
| | | | | | | | | | | |
| Net debt / Adjusted EBITDA | | | 5.4 | x | | Unsecured Debt / Unencumbered NOI: | | | | |
| | | | | | | Consolidated debt | | $ | 1,529,113 | |
| (Net Debt + Preferred) / Adjusted EBITDA: | | | | | | less mortgages and notes payable | | | (115,633 | ) |
| Adjusted EBITDA | | $ | 270,557 | | | Unsecured Debt | | $ | 1,413,480 | |
| | | | | | | | | | | |
| Net debt | | $ | 1,458,378 | | | Unencumbered adjusted NOI (Annual) | | $ | 232,227 | |
| Preferred shares liquidation preference | | | 96,770 | | | | | | | |
| Net debt + preferred | | $ | 1,555,148 | | | Unsecured Debt / Unencumbered NOI | | | 6.1 | x |
| | | | | | | | | | | |
| (Net Debt + Preferred) / Adjusted EBITDA | | | 5.7 | x | | | | | | |
For the 12/31/2020, 12/31/2019 and 12/31/2018 Select Credit Metric reconciliation see corresponding period Quarterly Supplemental Information.
| Computershare | Overnight Correspondence: |
| PO Box 505000 | 462 South 4th Street, Suite 1600 |
| Louisville, KY 40233 | Louisville, KY 40202 |
| (800) 850-3948 | |
| www-us.computershare.com/investor |
| Heather Gentry |
| Senior Vice President, Investor Relations |
| Telephone (direct) | (212) 692-7219 |
| E-mail | hgentry@lxp.com |
| Bank of America/Merrill Lynch | | Jeffries & Company, Inc. | |
| James Feldman | (646) 855-5808 | | Jon Peterson | (212) 284-1705 |
| | | | | |
| Evercore Partners | | | KeyBanc Capital Markets Inc. | |
| Sheila K. McGrath | (212) 497-0882 | | Craig Mailman | (917) 368-2316 |
| | | | |
| J.P. Morgan Chase | | | Ladenburg Thalmann & Co., Inc. |
| Anthony Paolone | (212) 622-6682 | | John Massocca | (212) 409-2543 |

One Penn Plaza, Suite 4015 | New York, NY 10119-4015 | (212) 692-7200 | www.lxp.com