
LONG ISLAND’S PREMIER COMMUNITY BANK
www.astoriafederal.com
SECOND QUARTER ENDED
JUNE 30, 2003

This presentation may contain forward-looking statements that are based on various assumptions and analyses made by us in light of our management’s experience and its perception of historical trends, current conditions and expected future developments, as well as other factors it believes are appropriate under the circumstances. These statements are not guarantees of future performance and are subject to risks, uncertainties and other factors (many of which are beyond our control) that could cause actual results to differ materially from future results expressed or implied by such forward-looking statements. These factors include, without limitation, the following: the timing and occurrence or non-occurrence of events may be subject to circumstances beyond our control; there may be increases in competitive pressure among financial institutions or from non-financial institutions; changes in the interest rate environment may reduce interest margins; changes in deposit flows, loan demand or real estate values may adversely affect our business; changes in accounting principles, policies or guidelines may cause our financial condition to be perceived differently; general economic conditions, either nationally or locally in some or all areas in which we do business, or conditions in the securities markets or the banking industry may be less favorable than we currently anticipate; legislation or regulatory changes may adversely affect our business; technological changes may be more difficult or expensive than we anticipate; success or consummation of new business initiatives may be more difficult or expensive than we anticipate; or litigation or other matters before regulatory agencies, whether currently existing or commencing in the future, may delay occurrence or non-occurrence of events longer than we anticipate. We assume no obligation to update any forward-looking statements to reflect events or circumstances after the date of this document.

Corporate Profile
$22.3 billion in assets
$11.3 billion in deposits, 51% low-cost core deposits(1)
9% deposit market share in Long Island market
3rd largest, just behind Chase and Citibank
Serves 700,000 customers/consumers
Book value per common share(2): $19.49
Tangible book value per common share(3): $17.05
Insider & ESOP stock ownership: 16%
$2.3 billion market cap
All figures in this presentation are as of June 30, 2003 and all market data and IBES consensus are as of July 30, 2003, except as noted.
NYSE: AF
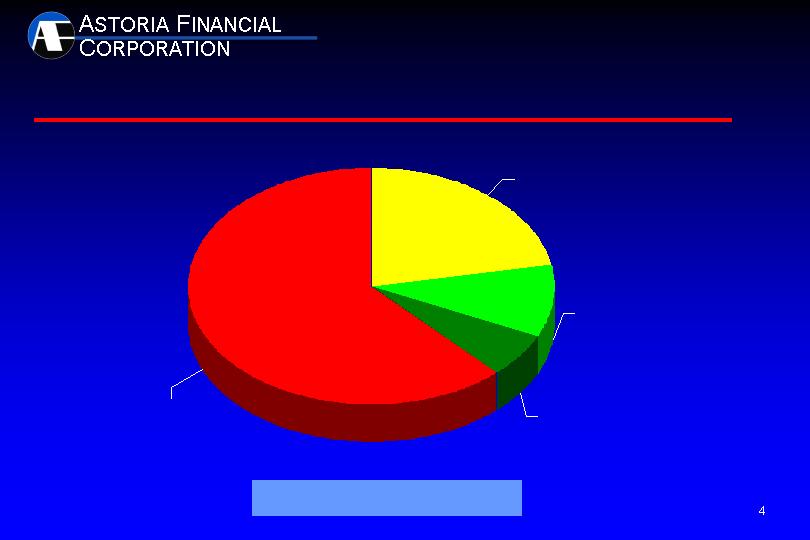
Officers &
Directors
6%
ESOP
10%
Retail
14%
Institutions
70%
Ownership Profile
June 30, 2003
Shares Outstanding: 80,672,623

Our formula for enhancing shareholder value is
simple and has been proven successful!
Retail Banking – Premier community bank on Long Island
Full service provider of financial services and products
Keen focus on customer service – Anytime/Anywhere banking, 24/7!
Extended hours, Saturday & Sunday banking
Multi-channel distribution network- branches, ATMs, telephone and
Internet
Mortgage Lending – Portfolio lender, not a mortgage banker
Single Family, Multifamily and Commercial Real Estate Expertise
Top Quality - Low Credit Risk Lending
Operating Efficiency
Focus on core businesses:
Execution excellence is key!

Retail Banking/Market Penetration

Leading Retail Banking Franchise
$11.3 billion in deposits, 86 banking office network
Low cost/stable source of funds – average rate: 2.02%
Core Deposits represent 51% of Deposits, or $5.8 billion
Checking accounts of $1.5 billion, or 26% of core deposits
Pro-active sales culture
Banking offices with high average deposits
Long Island Offices (83) - Nassau (29), Queens (17), Suffolk (25),
Brooklyn (12) – Average Deposits of $132 Million
Westchester Offices (3) - Average Deposits of $126 Million
Alternative delivery channels
ATMs, telephone and Internet banking
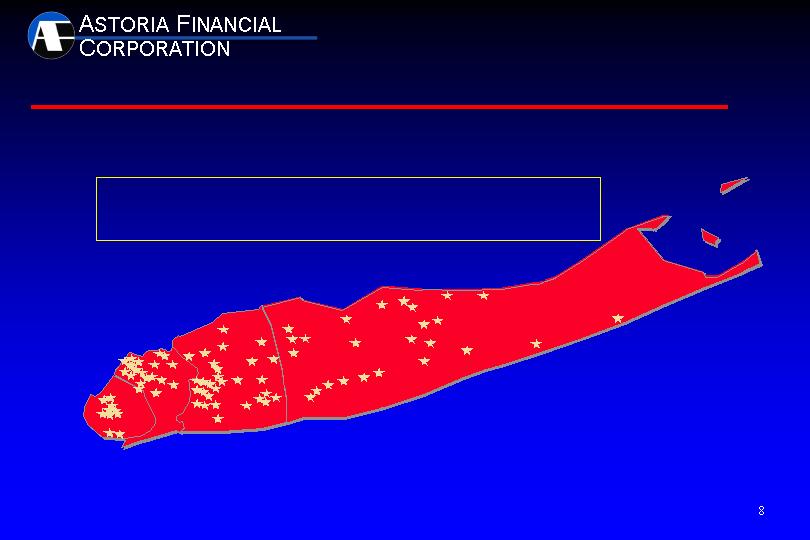
Long Island Powerhouse
Nassau
Queens
Brooklyn
Suffolk
Banking Offices and Deposit Share Ranking on Long Island
Overall Deposit Share Ranking:
#1- all thrifts, #3- all financial institutions

Average
Deposits
Strong Position in Core Market
Brooklyn, Queens, Nassau and Suffolk
Source: FDIC Deposit Market Share Report. Data as of 6/30/02, most recent available, adjusted for pending acquisitions.
1. Chase
2. Citigroup
3. ASTORIA
4. GreenPoint
5. North Fork
6. HSBC
7. NY Community/RSLN
8. Washington Mutual
The combined population of these four counties (7.0 million) exceeds the population
of 38 individual U.S. states
$ 19,487
15,676
10,878
9,371
8,932
8,642
8,244
7,914
Total - Core Market
$122,391
$2,544
(506)
603
84
1,061
194
828
(1,212)
16%
13
9
8
7
7
7
7
149
142
83
61
132
93
103
73
$131
110
131
154
68
92
80
108
1,372
(Dollars in millions)
Institution
Deposits
Growth
06/01-06/02
Market
Share
Branches

($ in millions) Suffolk .
Institution Total
Well Positioned in Key Markets
Source: FDIC Deposit Market Share Report.
Deposits
Data as of 6/30/02, most recent available, adjusted for pending acquisitions.
1. Citigroup
2. Chase
3. GreenPoint
4. Astoria
5. NYB/RSLN
$6,318
5,094
3,858
3,825
3,536
16%
13
10
10
9
58
32
21
29
36
Share
Branches
Share
Branches
Total
$38,574
411
1. Chase
2. Citigroup
3. Astoria
4. NYB/RSLN
5. North Fork
$5,147
3,774
3,172
3,016
2,506
$31,849
Total
16%
12
10
9
8
40
27
19
25
15
12
247
Share
Branches
1. Chase
2. North Fork
3. Citigroup
4. Astoria
5. Fleet
Total
$4,177
3,823
2,428
2,358
1,755
$24,735
17%
16
10
10
7
35
54
29
25
33
383
($ in millions) Brooklyn .
Institution Total
Share
Branches
1. Chase
2. HSBC
3. Wamu
4. Citigroup
5. GreenPoint
Astoria (#7)
Total
$5,069
3,421
3,374
3,156
2,492
1,522
$27,233
19%
13
12
12
9
6
42
30
17
34
35
331
($ in millions) Nassau .
Institution Total
($ in millions) Queens .
Institution Total
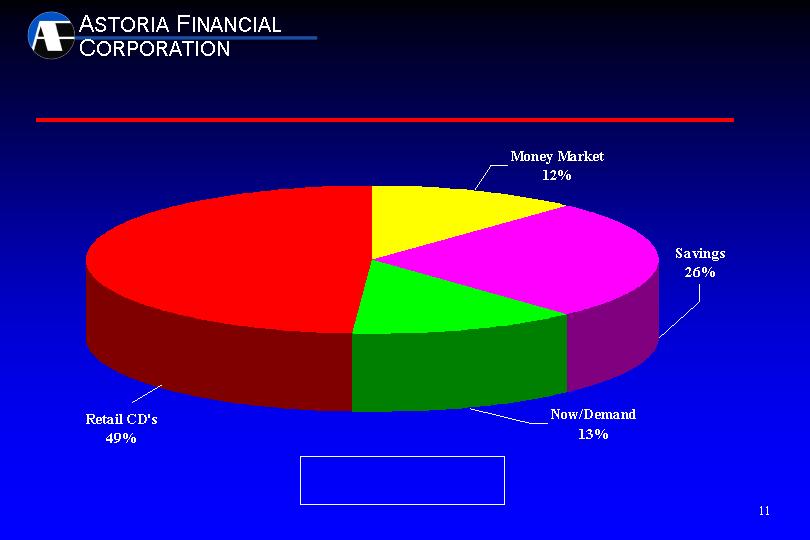
Deposit Composition
Total - $11.3 Billion
51% Core or $5.8 Billion
At June 30, 2003
$5.5B @ 3.67%
$1.4B @ 0.72%
$2.9B @ 0.50%
$1.5 B @ 0.14%
Average Rate: 2.02%

Sales Initiatives – PEAK Process
Performance based on Enthusiasm, Actions and Knowledge
A “needs” based approach to sales rather than “product” based
approach using a “Financial Needs Analysis Profile”
Highly interactive program – daily and weekly meetings create a
focus that is shared throughout the branch network
Incentives for strong performance, both individual and
team
2002 results exceeded expectations
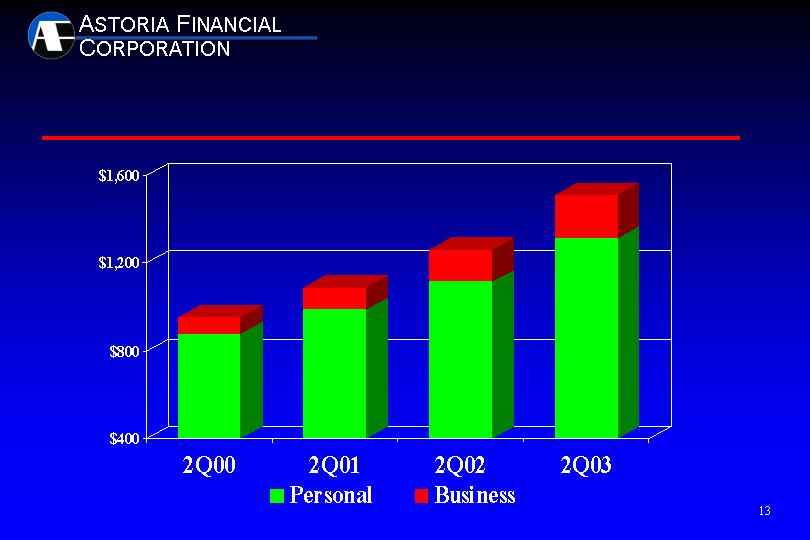
Checking Account Growth
($ in millions)
CAGR = 17%
$954
$1,090
$1,262
$1,511

Mortgage Lending Growth
Asset Quality Trends

Primarily short-term, 3/1 & 5/1 hybrid ARMs for portfolio
Minimizes interest rate risk
Multiple delivery channels provide flexibility & efficiency
Retail*
Commissioned representatives/brokers-originations in 19 states*
Third party originators – correspondent relationships in 44 states*
Secondary marketing capability
Sale of 15 year and 30 year fixed rate loans reduces interest rate risk
Geographically diversified portfolio
Reduces lending concentrations
1-4 Family Mortgage Lending
* All loans underwritten to Astoria’s stringent standards.
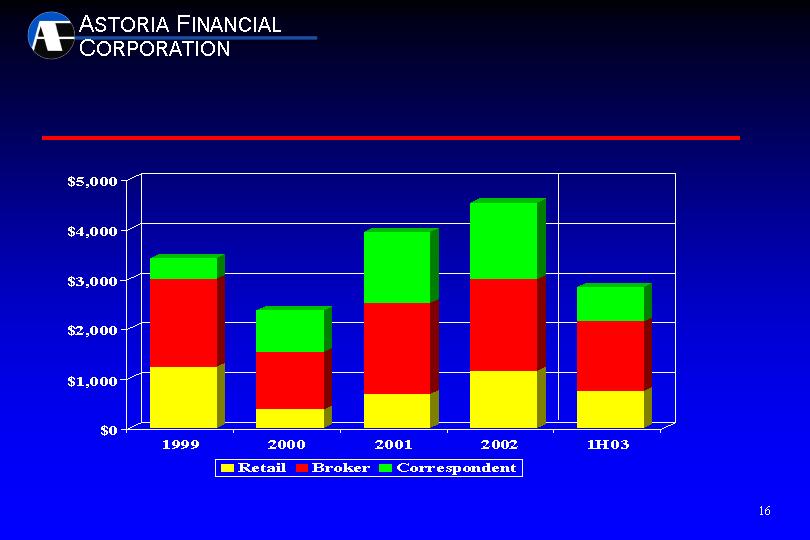
1-4 Family Mortgage Loan Originations
By Delivery Channel
$2.4B
$4.5B
(In Millions)
$3.9B
$3.4B
$2.8B
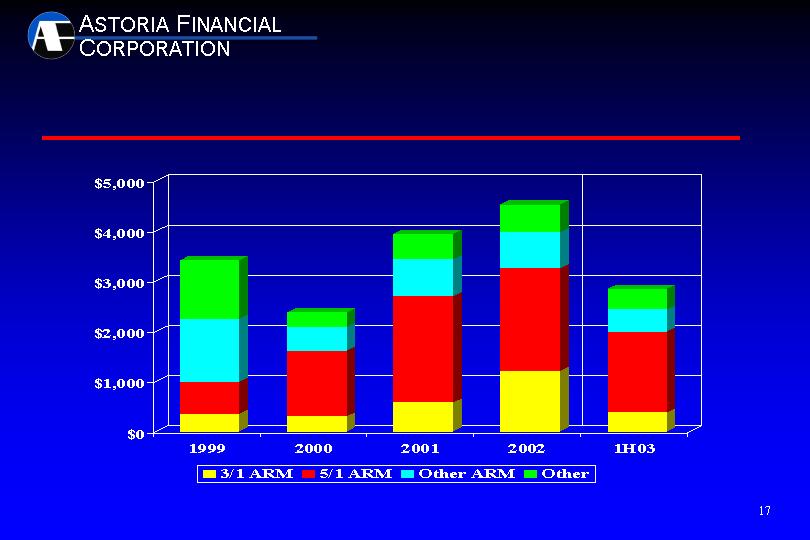
1-4 Family Mortgage Loan Originations
By Product Type
$2.4B
$3.9B
$4.5B
(In Millions)
$3.4B
$2.8B

Solid and growing Multifamily/CRE portfolio
Multifamily/Commercial Real Estate Lending
Note: LTV is based on current principal balances and original appraised values.
$2.6 billion in portfolio – Average yield 7.60%
Conservative underwriting - Average LTV < 65%
Average loan in portfolio < $1 million
All loans in local market
Portfolio target: 25% of total loan portfolio by year-end 2003
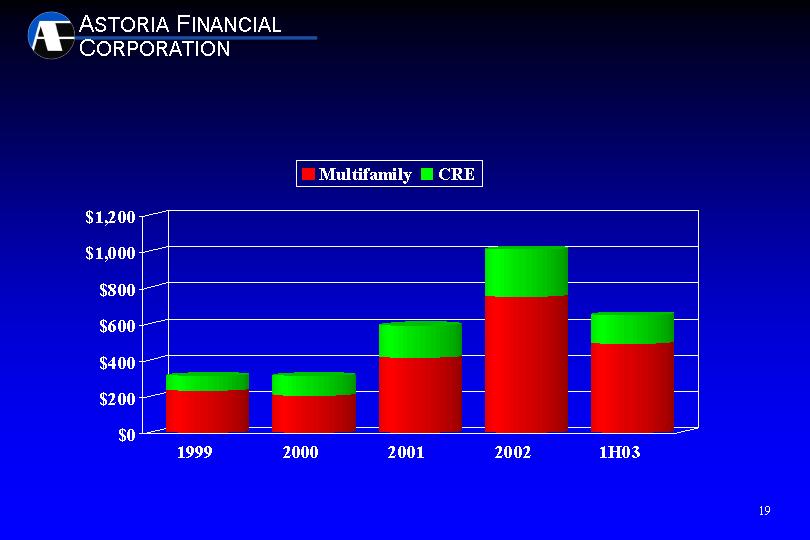
Multifamily/Commercial Real Estate Originations
(In Millions)
Originations include mixed use property loans. Average loan balance outstanding is < $1 million.
All loans originated in local market.

Asset Quality

Minimal credit risk
Strong reserves
Low delinquency trends
Top quality MBS portfolio
Asset Quality Focus
Conservative underwriting, top quality loans, low LTVs
No sub-prime lending
99+% of all loans secured by real estate
Allowance for loan losses/non-performing loans: 232%
Primarily agency, agency-backed or ‘AAA’ rated
Average LTV: 63.1%
Total Portfolio: $12.0 billion
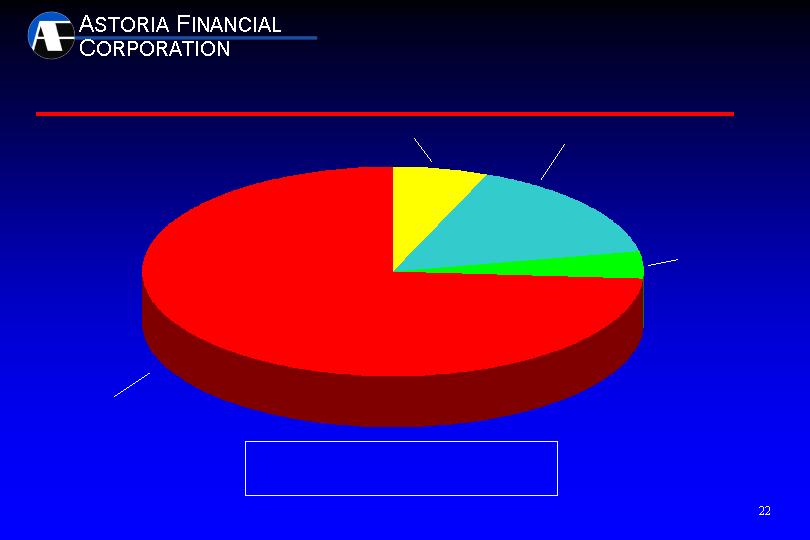
Low Credit Risk Loan Portfolio Composition
At June 30, 2003
Excludes loans held for sale; LTV based on current principal balance and original appraised value.
Commercial R/E - 6%
Average LTV: 63.3%
Multifamily - 16%
Average LTV: 64.4%
One-to-Four Family – 74%
Average LTV: 62.8%
Home Equity
& Other – 4%
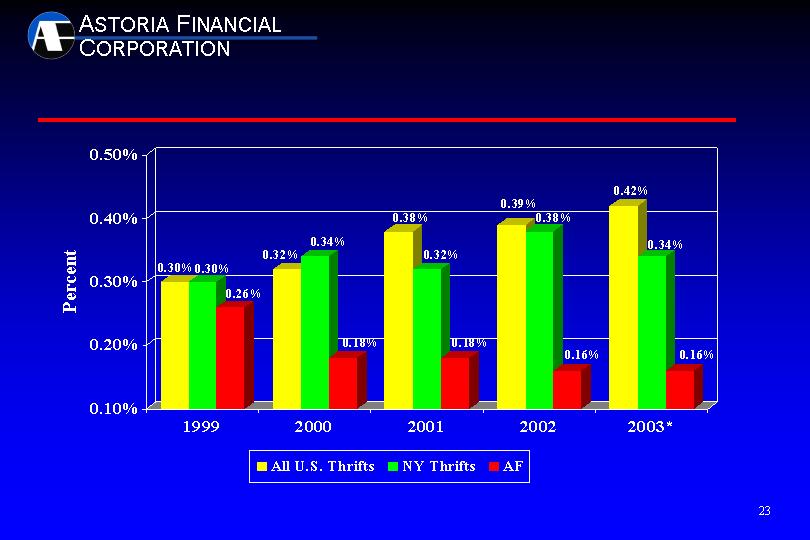
NPA to Total Assets vs Peers
* Most recent data available for All US Thrifts and NY Thrifts is as of March 31, 2003. AF data is as of June 30, 2003.
Source: SNL Financial – Median Ratios.
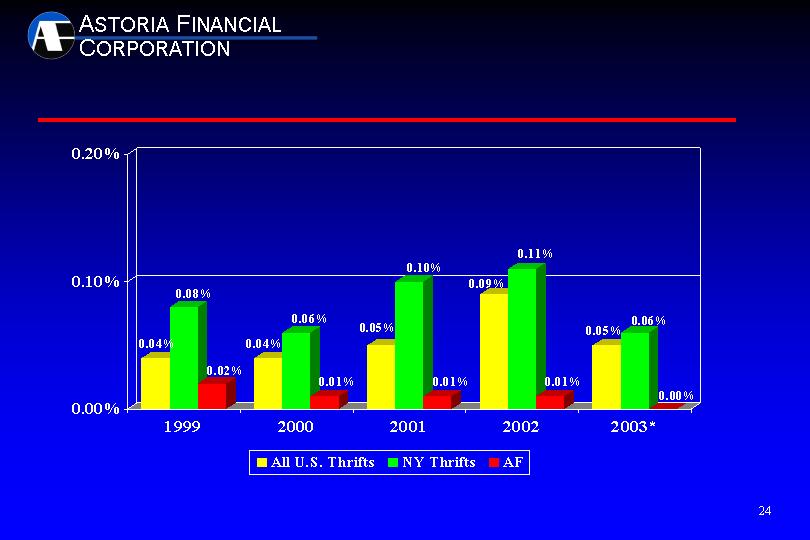
Net Charge-offs/Average Loans vs. Peers
* Most recent data available for All US Thrifts and NY Thrifts is for the quarter ended March 31, 2003. AF is for the six months ended June 30, 2003.
Source: SNL Financial – Median Ratios.
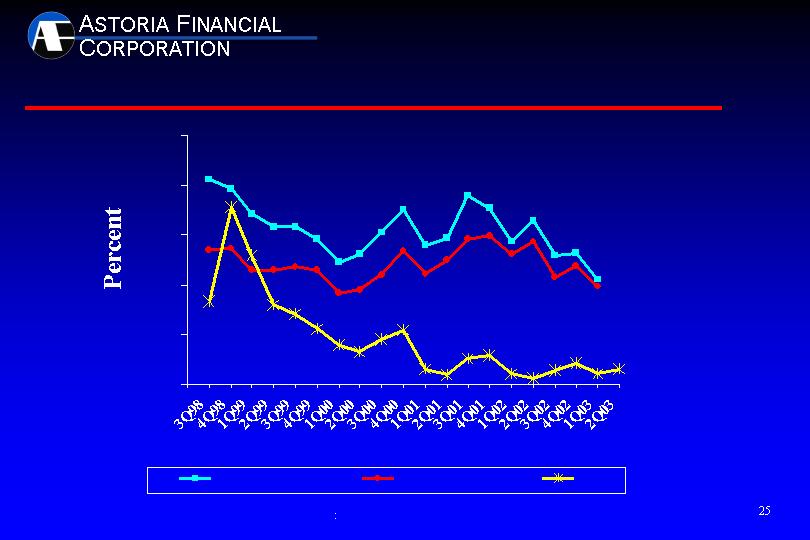
1-4 Family Delinquency Ratios: AF vs MBA
MBA NY conv
MBA US conv
AF
1.00
2.00
3.00
4.00
5.00
6.00
Source: MBA National Delinquency Survey. Beginning with 3Q02, MBA statistics for conventional loans excludes sub-prime loans.
:
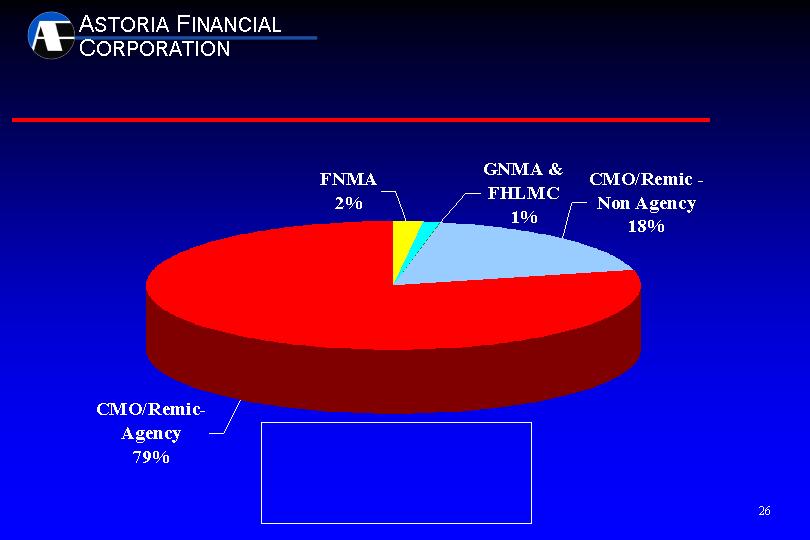
Low Credit Risk MBS Portfolio
Total MBS Portfolio Classification
Available for sale - $ 3.0B
Held to maturity - $ 5.6B
Total $ 8.6B
At June 30, 2003
Average Life: 1.8 years

One year gap: +4.65%
Key balance sheet components
Short-term hybrid adjustable-rate mortgage loan portfolio
Short weighted average life MBS portfolio
Offset by:
Large core deposit base - provides natural hedge against rising
rates
Longer-term CDs and borrowings
Interest Rate Risk Management

Rate
2.63%
5.81%
4.97%
5.80%
4.74%
Interest Rate Risk Management
Liability repricing opportunities within the next 12 months:
CD’s
Maturing
$965 Million
$800 Million
$2.8 Billion
$500 Million
$5.1 Billion
Weighted Avg.
Rate
2.08%
2.74%
2.84%
2.76%
2.59%
Maturing
$725 Million
$660 Million
$752 Million
$574 Million
$2.7 Billion
3Q03
4Q03
1Q04
2Q04
Total
Weighted Avg.
3Q03
4Q03
1Q04
2Q04
Total

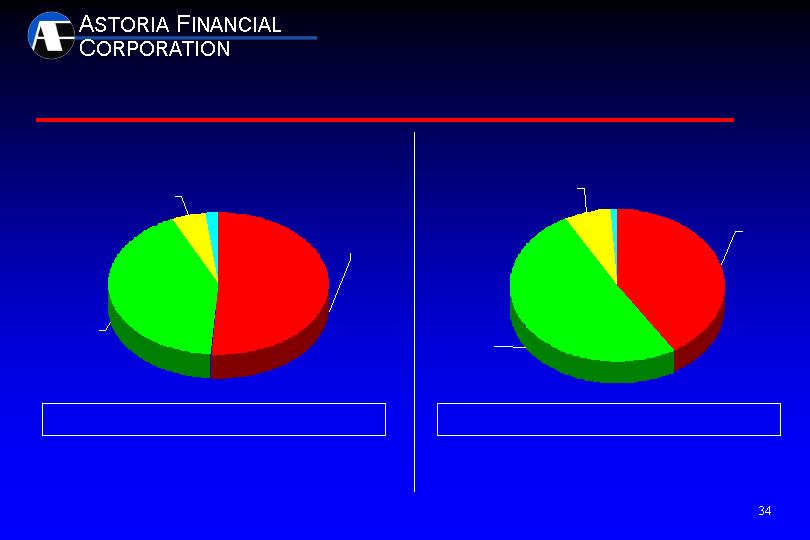
Balance Sheet Repositioning
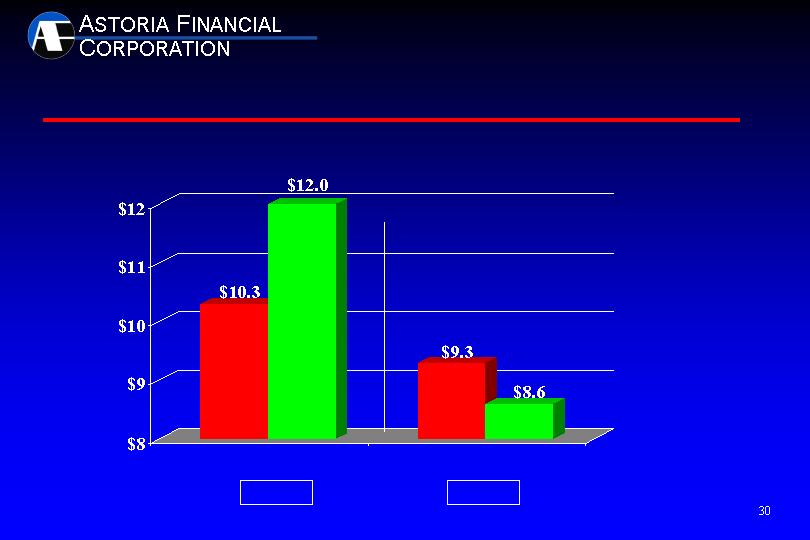
Balance Sheet Repositioning
(In Billions)
12/31/99 6/30/03
12/31/99 6/30/03
Loans
vs.
MBS
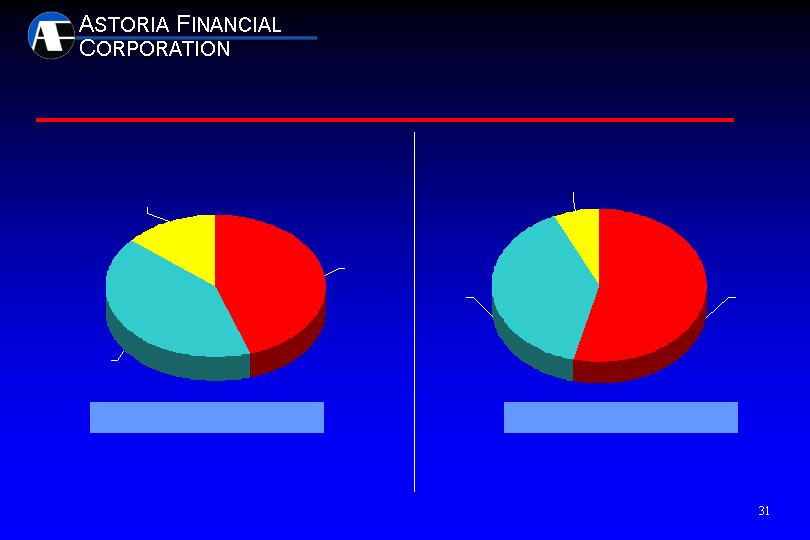
45%
41%
14%
39%
7%
54%
Balance Sheet Composition
December 31, 1999
June 30, 2003
Other
Loans
Other
MBS
Loans
MBS
Total Assets: $22.7 Billion
Total Assets: $22.3 Billion
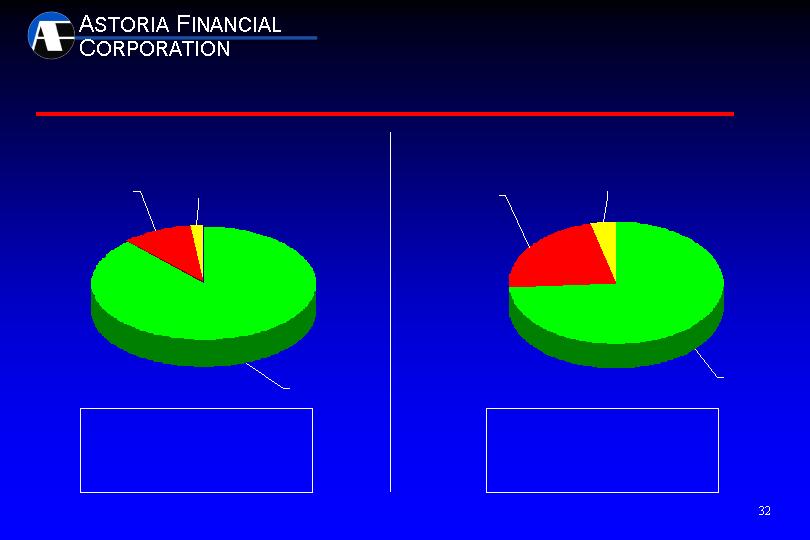
Loan Mix
Other
2%
Mulitfamily/CRE
10%
1-4 Family
88%
1-4 Family
74%
Other
4%
Multifamily/CRE
22%
1-4 Family: $9.0 Billion*
Multifamily/CRE: $1.0 Billion*
Other: $0.2 Billion*
Total Loans: $10.3 Billion
December 31, 1999
June 30, 2003
* Excludes net unamortized premium/net deferred loan costs.
Excludes loans held for sale.
1-4 Family: $8.9 Billion*
Multifamily/CRE: $2.6 Billion*
Other: $0.5 Billion*
Total Loans: $12.0 Billion
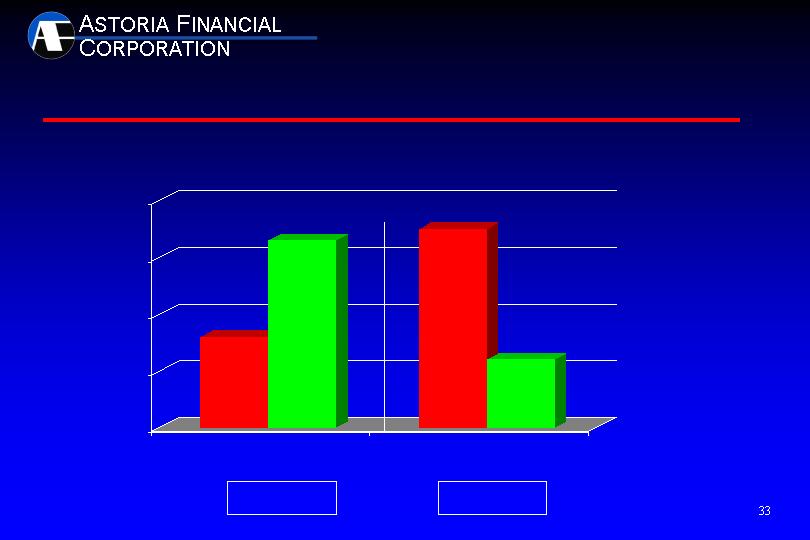
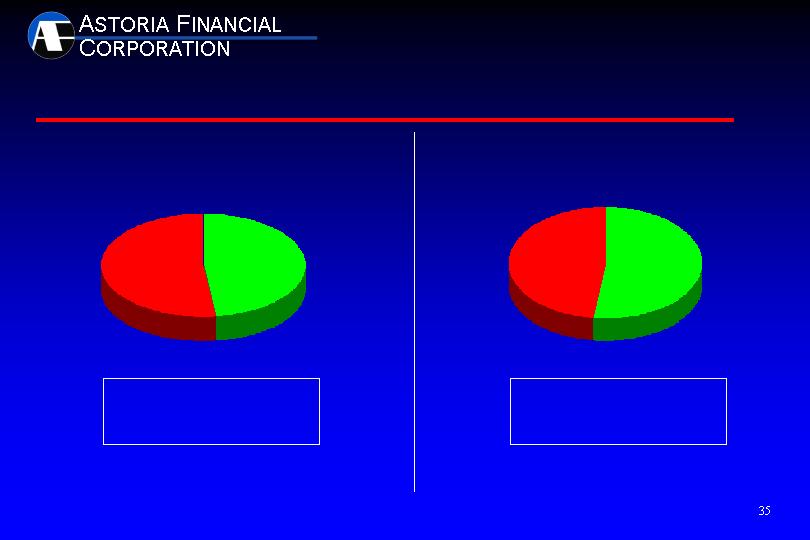
Deposits
Balance Sheet Repositioning
$9.6
$11.3
$11.5
$9.2
$8
$9
$10
$11
$12
(In Billions)
12/31/99
6/30/03
vs.
Borrowings
6/30/03
12/31/99
Total Liabilities & Equity: $22.3 Billion
Total Liabilities & Equity: $22.7 Billion
Balance Sheet Composition
42%
51%
2%
5%
1%
51%
7%
41%
December 31, 1999
June 30, 2003
Equity
Borrowings
Equity
Deposits
Borrowings
Other
Deposits
Other
CD's
52%
Core
48%
Deposit Composition
Core
51%
CD's
49%
48% Core - $4.6 Billion
Total Deposits - $9.6 billion
Average Rate: 3.94%
December 31, 1999
June 30, 2003
51% Core - $5.8 Billion
Total Deposits - $11.3 Billion
Average rate: 2.02%

Superior Operating Efficiency
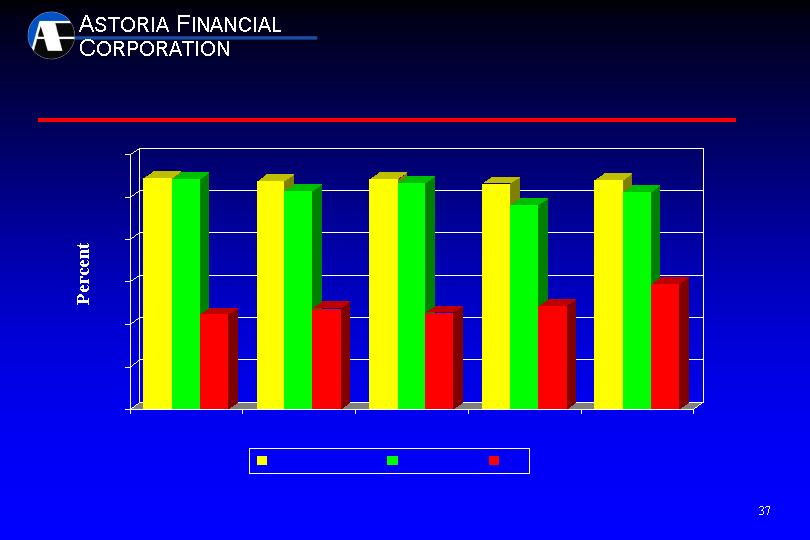
Efficiency Ratio(4)
10
20
30
40
50
60
70
1999
2000
2001
2002
2003*
All U.S. Thrifts
NY Thrifts
AF
* Most recent data available for All US Thrifts and NY Thrifts is for the quarter ended March 31, 2003. AF is for the six months ended June 30, 2003.
Source: SNL Financial – Median Ratios

Financial Results and Trends

Financial Highlights
Diluted earnings per common share
Return on average assets
Return on average equity
Return on average tangible equity(5)
Annualized dividend yield - 3.07%*
Shares repurchased – 2.5 million shares 2Q03;
4.7 million shares 1H03
$0.64
0.88%
13.27%
15.09%
2Q03
1H03
Ninth repurchase program underway – 10 million shares authorized –
4.9 million common shares remain for repurchase**
Moody’s upgraded outlook from stable to positive
* As of July 30, 2003
** As of July 15, 2003
$1.33
0.94%
13.94%
15.84%
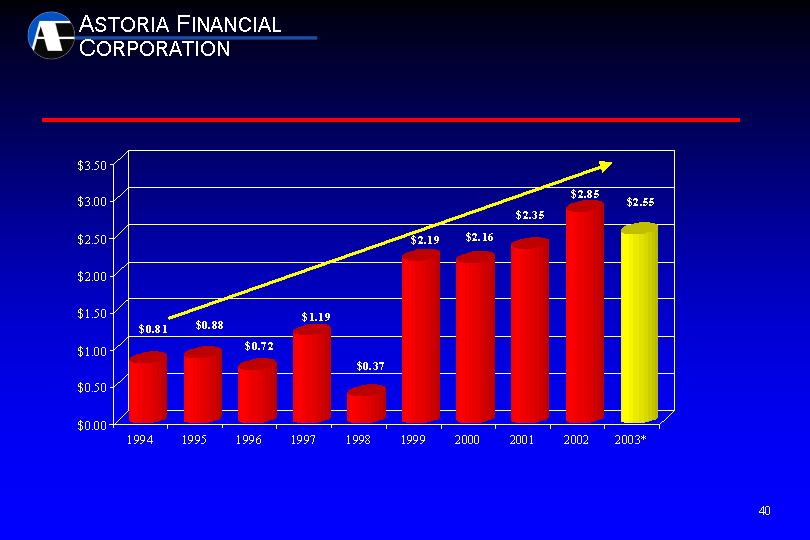
AF Historical EPS Growth
Historical GAAP EPS Growth
(1) 1996 includes the one-time special assessment of $0.28 per share, after-tax, for the re-capitalization of the Savings Association Insurance Fund.
(2) 1998 includes acquisition costs and restructuring charges, extinguishment of debt expense, loss on sale of securities and additional loan loss provision
totaling $0.95 per share, after-tax, related to the Long Island Bancorp, Inc. acquisition.
* IBES consensus as of July 30, 2003
CAGR = 14%
(2)
(1)
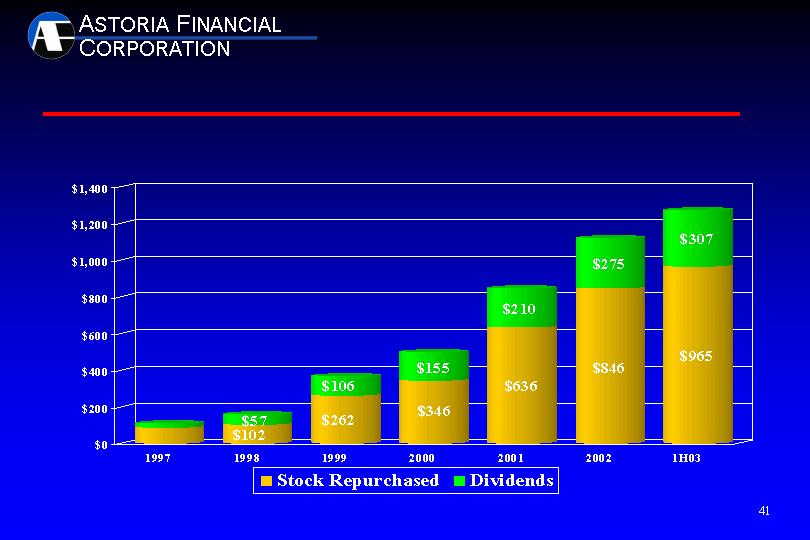
Cumulative Cash Returned to Shareholders
(In Millions)
$110
$159
$368
$846
$1,121
$501
Over $1.2 billion returned to shareholders in the past 6+ years
$1,272

One of the industry’s largest goodwill litigation claims
Goodwill Claim Update
Outcome unpredictable due to disparity in recent court
decisions
$785 million of original supervisory goodwill created
(LISB = $625 million, Fidelity NY = $160 million)
$635 million of supervisory goodwill written off
(LISB = $500 million, Fidelity NY = $135 million)

Why Invest in Astoria Financial?
Strong balance sheet – superior asset quality
Attractive banking franchise
Financial Performance
Superior operating efficiency
Well capitalized
Active stock repurchase program
Dominant deposit market share in core market
14% CAGR in EPS since 1994
19% CAGR in stock price since 1994
Over $1.2 billion returned to shareholders in the past 6+ years

Valuation Considerations
* IBES as of 07/30/03
$52.09
38.29
28.65
32.69
83.60
18.04
21.48
27.75
32.88
34.87
36.31
30.25
40.27
8.7x
10.9
11.2
12.0
12.1
12.5
12.8
12.8
12.9
13.6
13.9
14.4
16.0
12.8x
$32.64
2.8x
2.2
1.7
2.6
2.4
2.9
2.2
3.4
2.4
4.8
4.6
6.2
2.9
2.9x
$49.45
25%
2
8
16
17
13
19
18
20
30
20
69
10
18%
$42.28
GreenPoint
Webster
Astoria Financial
Charter One
Golden West
Sovereign
Staten Island
Bank North
Independence
North Fork
Hudson United
New York Community
Commerce Bancorp
Median
Astoria Stock Price at Median Levels
Price
07/30/03
2003
P/E*
Price/ TBV
Implied Deposit
Premium

Addendum
AF: A Record of Enhancing Shareholder Value

AF: A Record of Enhancing Shareholder Value
Assets of $10 billion by 2000
Improve asset quality
Enhance operating efficiency
Broaden lending capabilities
Generate returns in mid-teen
range
Enhance shareholder value
$22.3 billion in assets
0.16% NPA/total assets
39.52% efficiency ratio(4) year to date
Origination network now covers 19
states
15.84% return on average tangible
equity year to date
358% stock appreciation since IPO*
1993 IPO objectives
* Through July 30, 2003
The record as of June 30, 2003

Acquisition History
Metropolitan Federal
Citizens Savings (FSLIC)
Hastings-on-Hudson Federal
Chenango Federal
Oneonta Federal
Whitestone Savings (RTC)
Fidelity New York
The Greater New York Savings Bank
Long Island Bancorp, Inc.
Total
Year
2
5
3
1
4
4
18
14
35
86
$ 50
130
100
25
205
280
1,800
2,400
6,600
$11,590
# Branches
Assets
(in millions)
Thrift
1973
1979
1982
1984
1987
1990
1995
1997
1998
Tangible Book Value/Book Value Growth
$8
$10
$12
$14
$16
$18
$20
Dec 31 99
Dec 31 00
Dec 31 01
Dec 31 02
June 30 03
Tangible Book Value
Book Value
(Dollars per common share)

Footnotes/Glossary
Core deposits represent total deposits less time deposits.
Book value per common share represents common stockholders’ equity divided by
outstanding common shares, excluding unallocated Employee Stock Ownership Plan
(ESOP) shares.
Tangible book value per common share represents common stockholders’ equity less
goodwill divided by outstanding common shares, excluding unallocated ESOP shares.
Efficiency ratio represents general and administrative expense divided by the sum of
net interest income plus non-interest income.
Average tangible equity represents average equity less average goodwill.
(1)
(2)
(3)
(4)
(5)
NPA – Non-performing assets
MBS – Mortgage-backed securities
LTV – Loan-to-value
CAGR – Compounded annual growth rate

LONG ISLAND’S PREMIER COMMUNITY BANK
www.astoriafederal.com