
| Long Island's Premier Community Bank www.astoriafederal.com Investor Presentation First Quarter Ended March 31, 2005 |
| This presentation may contain forward-looking statements that are based on various assumptions and analyses made by us in light of our management's experience and its perception of historical trends, current conditions and expected future developments, as well as other factors it believes are appropriate under the circumstances. These statements are not guarantees of future performance and are subject to risks, uncertainties and other factors (many of which are beyond our control) that could cause actual results to differ materially from future results expressed or implied by such forward-looking statements. These factors include, without limitation, the following: the timing and occurrence or non-occurrence of events may be subject to circumstances beyond our control; there may be increases in competitive pressure among financial institutions or from non-financial institutions; changes in the interest rate environment may reduce interest margins or affect the value of our investments; changes in deposit flows, loan demand or real estate values may adversely affect our business; changes in accounting principles, policies or guidelines may cause our financial condition to be perceived differently; general economic conditions, either nationally or locally in some or all areas in which we do business, or conditions in the securities markets or the banking industry may be less favorable than we currently anticipate; legislation or regulatory changes may adversely affect our business; technological changes may be more difficult or expensive than we anticipate; success or consummation of new business initiatives may be more difficult or expensive than we anticipate; or litigation or other matters before regulatory agencies, whether currently existing or commencing in the future, may delay occurrence or non-occurrence of events longer than we anticipate. We assume no obligation to update any forward-looking statements to reflect events or circumstances after the date of this document. |
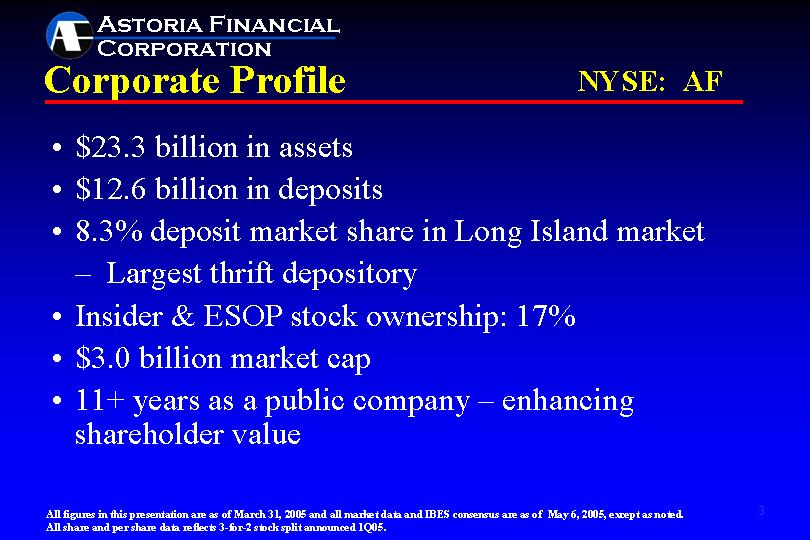
| Corporate Profile $23.3 billion in assets $12.6 billion in deposits 8.3% deposit market share in Long Island market - Largest thrift depository Insider & ESOP stock ownership: 17% $3.0 billion market cap 11+ years as a public company - enhancing shareholder value All figures in this presentation are as of March 31, 2005 and all market data and IBES consensus are as of May 6, 2005, except as noted. All share and per share data reflects 3-for-2 stock split announced 1Q05. NYSE: AF |
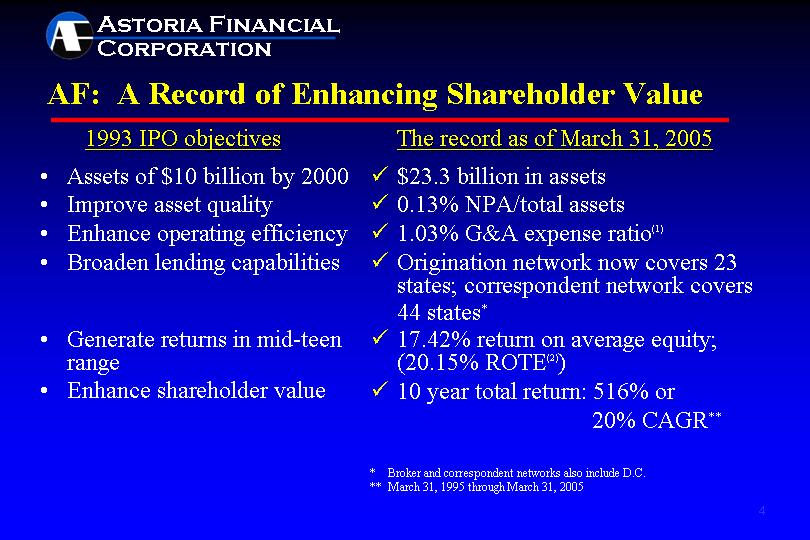
| AF: A Record of Enhancing Shareholder Value Assets of $10 billion by 2000 Improve asset quality Enhance operating efficiency Broaden lending capabilities Generate returns in mid-teen range Enhance shareholder value $23.3 billion in assets 0.13% NPA/total assets 1.03% G&A expense ratio(1) Origination network now covers 23 states; correspondent network covers 44 states* 17.42% return on average equity; (20.15% ROTE(2)) 10 year total return: 516% or 20% CAGR** * Broker and correspondent networks also include D.C. ** March 31, 1995 through March 31, 2005 1993 IPO objectives The record as of March 31, 2005 |
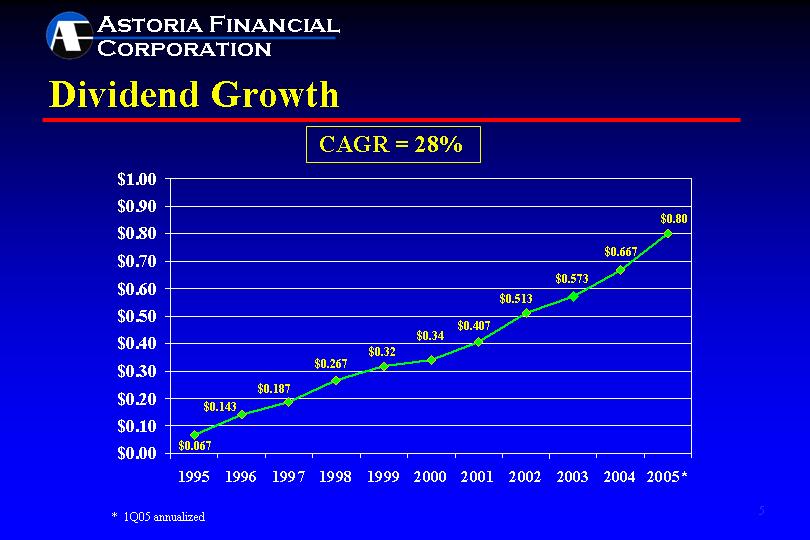
| Dividend Growth 1995 1996 1997 1998 1999 2000 2001 2002 2003 2004 2005* Dividends 0.067 0.143 0.187 0.267 0.32 0.34 0.407 0.513 0.573 0.667 0.8 CAGR = 28% * 1Q05 annualized |
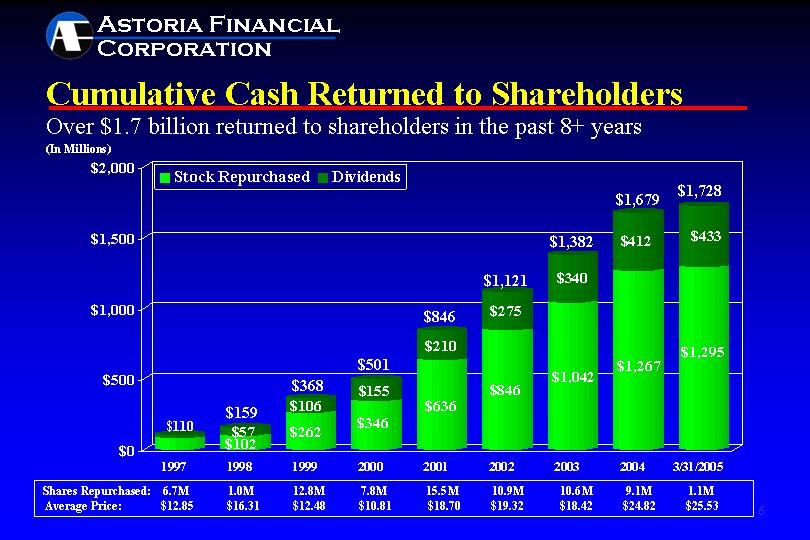
| 1997 1998 1999 2000 2001 2002 2003 2004 3/31/2005 Stock Repurchased 86 102 262 346 636 846 1042 1267 1295 Dividends 24 57 106 155 210 275 340 412 433 Cumulative Cash Returned to Shareholders (In Millions) $110 $159 $368 $846 $1,121 $501 Over $1.7 billion returned to shareholders in the past 8+ years $1,382 $1,679 Shares Repurchased: 6.7M 1.0M 12.8M 7.8M 15.5M 10.9M 10.6M 9.1M 1.1M Average Price: $12.85 $16.31 $12.48 $10.81 $18.70 $19.32 $18.42 $24.82 $25.53 $1,728 |
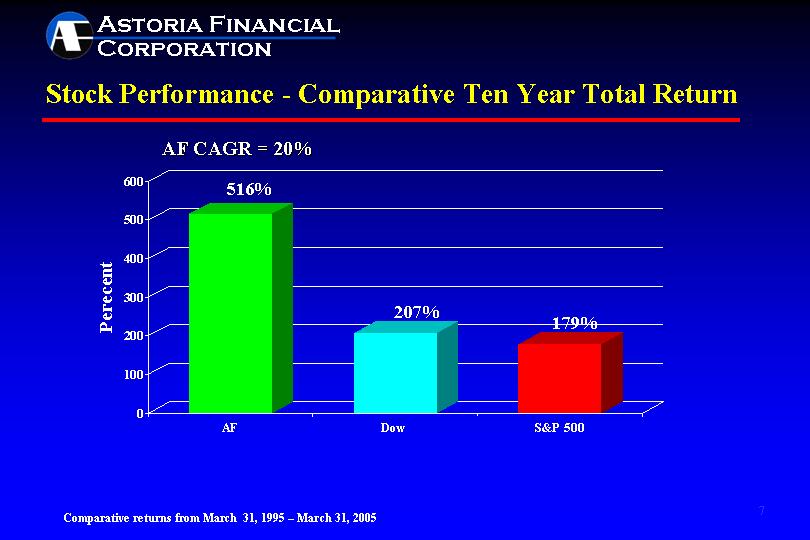
| Stock Performance - Comparative Ten Year Total Return AF Dow S&P 500 AF 516 207 179 AF CAGR = 20% Comparative returns from March 31, 1995 - March 31, 2005 |
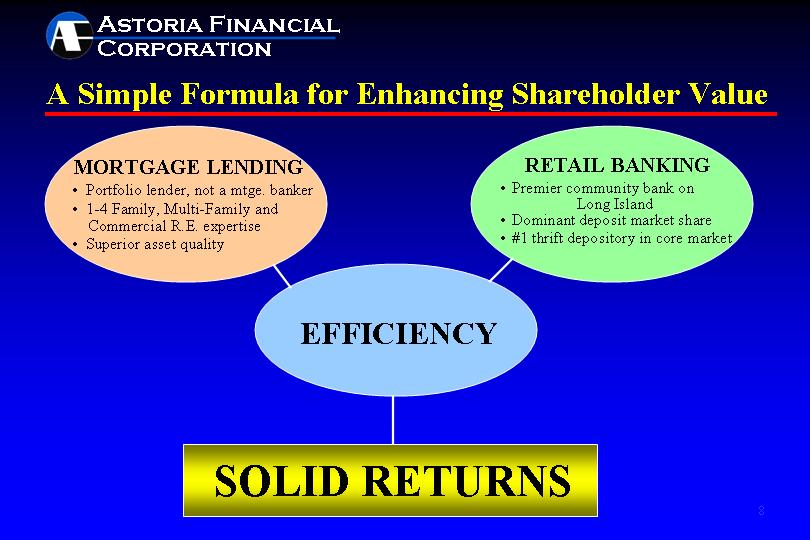
| A Simple Formula for Enhancing Shareholder Value MORTGAGE LENDING • Portfolio lender, not a mtge. banker • 1-4 Family, Multi-Family and Commercial R.E. expertise • Superior asset quality RETAIL BANKING • Premier community bank on Long Island • Dominant deposit market share • #1 thrift depository in core market EFFICIENCY SOLID RETURNS |

| Focus on Core Business (In Billions) 12/31/99 3/31/05 12/31/99 3/31/05 vs. Deposits Borrowings |
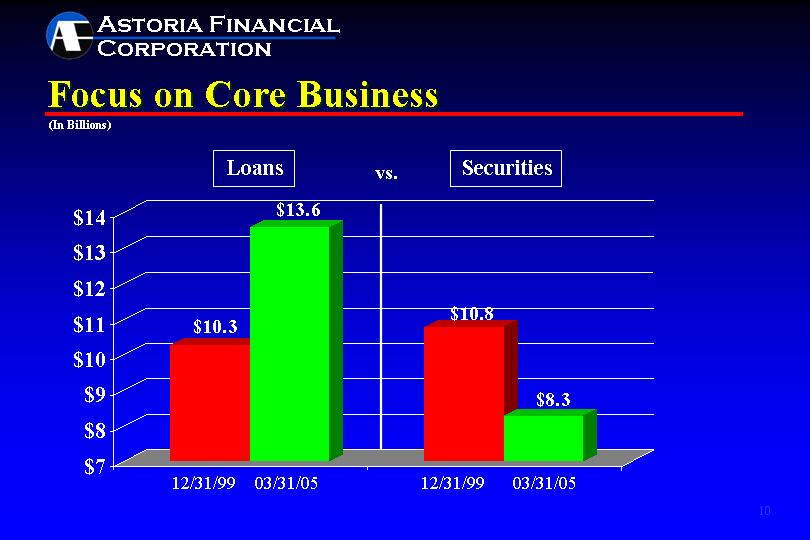
| Focus on Core Business (In Billions) 12/31/99 03/31/05 Loans Securities vs. 12/31/99 03/31/05 |
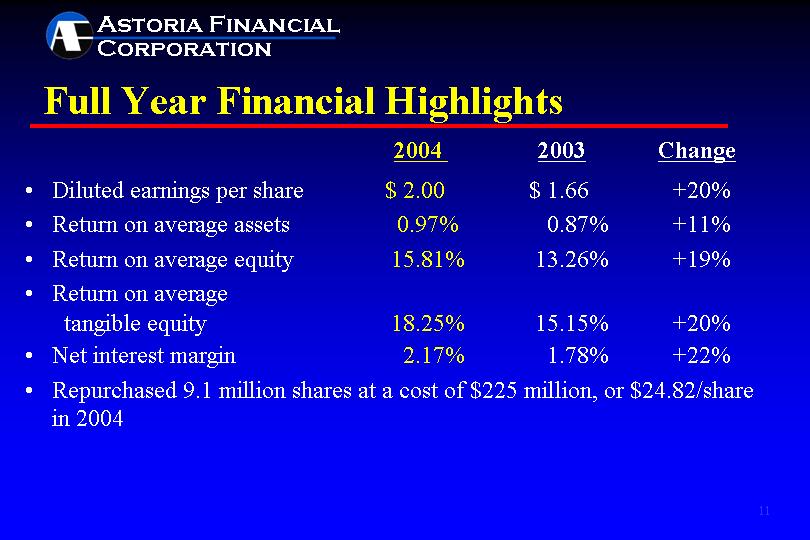
| Full Year Financial Highlights Diluted earnings per share $ 2.00 $ 1.66 +20% Return on average assets 0.97% 0.87% +11% Return on average equity 15.81% 13.26% +19% Return on average tangible equity 18.25% 15.15% +20% Net interest margin 2.17% 1.78% +22% Repurchased 9.1 million shares at a cost of $225 million, or $24.82/share in 2004 2004 2003 Change |
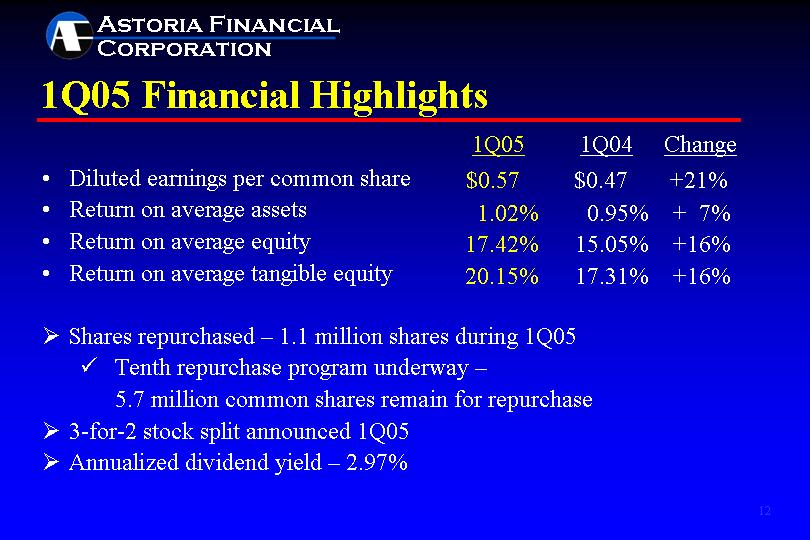
| 1Q05 Financial Highlights Diluted earnings per common share Return on average assets Return on average equity Return on average tangible equity Shares repurchased - 1.1 million shares during 1Q05 Tenth repurchase program underway - 5.7 million common shares remain for repurchase 3-for-2 stock split announced 1Q05 Annualized dividend yield - 2.97% $0.57 $0.47 +21% 1.02% 0.95% + 7% 17.42% 15.05% +16% 20.15% 17.31% +16% 1Q05 1Q04 Change |
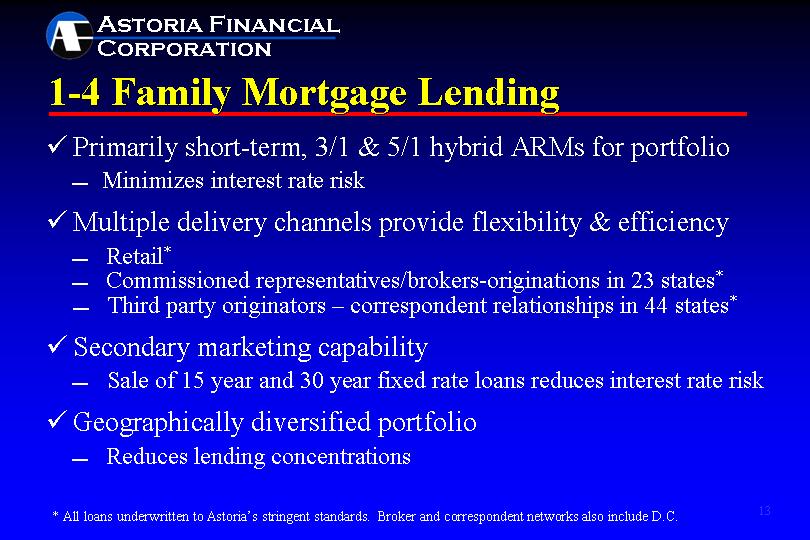
| Primarily short-term, 3/1 & 5/1 hybrid ARMs for portfolio ? Minimizes interest rate risk Multiple delivery channels provide flexibility & efficiency ? Retail* ? Commissioned representatives/brokers-originations in 23 states* ? Third party originators - correspondent relationships in 44 states* Secondary marketing capability ? Sale of 15 year and 30 year fixed rate loans reduces interest rate risk Geographically diversified portfolio ? Reduces lending concentrations 1-4 Family Mortgage Lending * All loans underwritten to Astoria's stringent standards. Broker and correspondent networks also include D.C. |
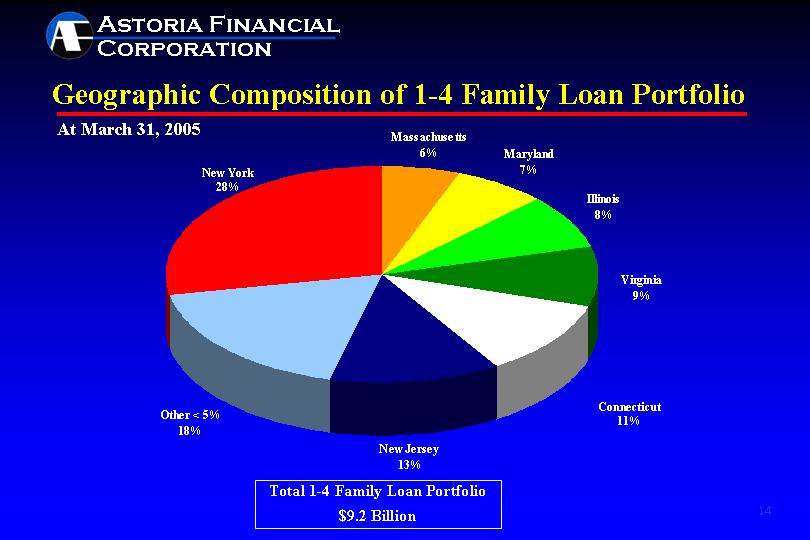
| Massachusetts Maryland Illinois Virginia Connecticut New Jersey Other New York 5.86 6.94 8.08 8.74 11.29 12.87 18 28 Geographic Composition of 1-4 Family Loan Portfolio At March 31, 2005 Total 1-4 Family Loan Portfolio $9.2 Billion New York 28% Connecticut 11% |

| 1-4 Family Mortgage Loan Originations By Product Type 2000 2001 2002 2003 2004 1Q05 3/1 ARM 0.2998 0.578 1.211 1.004 0.783544 0.101783 5/1 ARM 1.307 2.122 2.04 3.05 1.565917 0.459952 Other ARM 0.484 0.737 0.719 0.844 0.503251 0.077674 Other 0.2792 0.5 0.556 0.674 0.350139 0.087383 $3.9B $4.5B (In Billions) $2.4B $5.6B Net portfolio growth: +$843.5 M +$254.7 M ($895.7) M ($238.3) M +$83.7 M +$177.6M Weighted Avg. Portfolio Coupon at Period End 7.33% 7.01% 6.33% 5.26% 5.05% 5.05% $3.2B $726.8M |
| Multifamily/Commercial Real Estate Lending • Solid and growing Multifamily/CRE portfolio ? $3.6 billion in portfolio - Weighted Average Coupon at March 31, 2005: 5.86% ? Conservative underwriting - Average LTV < 65% ? Average loan in portfolio < $1 million ? Approximately 90% of multifamily portfolio is subject to rent control or rent stabilization ? 13% annualized growth in 1Q05 Note: LTV is based on current principal balances and original appraised values. |
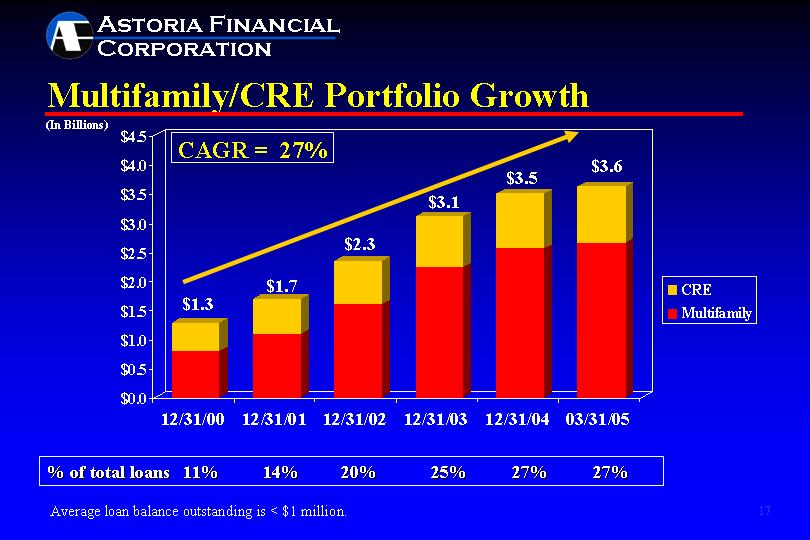
| Multifamily/CRE Portfolio Growth 12/31/00 12/31/01 12/31/02 12/31/03 12/31/04 3/31/2005 Multifamily 0.801917 1.094312 1.599985 2.230414 2.558935 2.653094 CRE 0.48 0.598334 0.744623 0.880296 0.944859 0.961029 (In Billions) % of total loans 11% 14% 20% 25% 27% 27% $1.3 $1.7 $2.3 $3.1 CAGR = 27% Average loan balance outstanding is < $1 million. $3.5 $3.6 |
| Asset Quality Focus • Minimal credit risk ? Conservative underwriting, top quality loans, low LTVs ? Net charge-offs less than one basis point for last 3 years & 1Q05 ? No sub-prime lending ? 99+% of all loans secured by real estate • Strong reserves Non-performing assets: 0.13% of total assets ? Allowance for loan losses/non-performing loans: 279% • Low delinquency trends • Top quality MBS portfolio ? Primarily GSE, agency or 'AAA' rated |
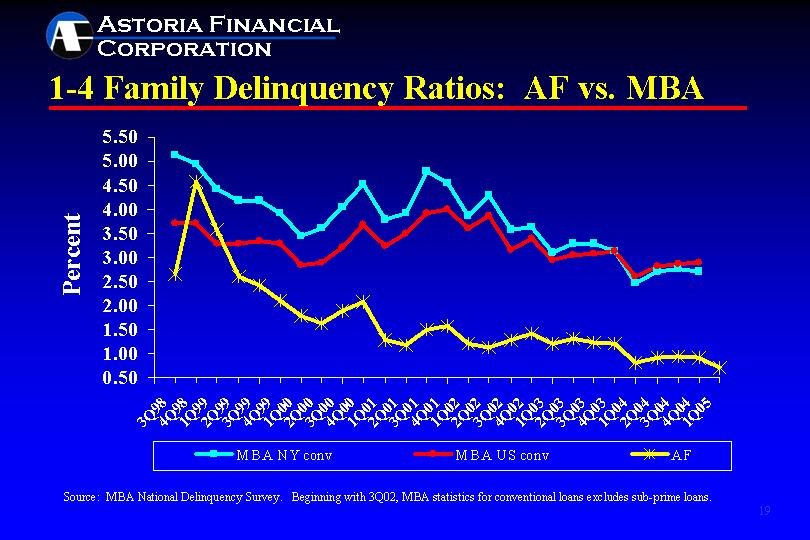
| 1-4 Family Delinquency Ratios: AF vs. MBA 3Q98 4Q98 1Q99 2Q99 3Q99 4Q99 1Q00 2Q00 3Q00 4Q00 1Q01 2Q01 3Q01 4Q01 1Q02 2Q02 3Q02 4Q02 1Q03 2Q03 3Q03 4Q03 1Q04 2Q04 3Q04 4Q04 1Q05 MBA NY conv 5.13 4.94 4.43 4.18 4.18 3.91 3.45 3.61 4.06 4.53 3.8 3.93 4.8 4.55 3.86 4.28 3.59 3.63 3.11 3.28 3.3 3.12 2.47 2.7 2.77 2.71 MBA US conv 3.7 3.72 3.3 3.29 3.35 3.29 2.83 2.9 3.21 3.68 3.23 3.51 3.92 3.99 3.61 3.87 3.15 3.39 2.96 3.04 3.07 3.13 2.6 2.81 2.87 2.9 AF 2.66 4.57 3.59 2.6 2.41 2.1 1.78 1.64 1.9 2.08 1.29 1.19 1.51 1.57 1.2 1.12 1.28 1.41 1.2 1.31 1.23 1.2 0.81 0.92 0.96 0.92 0.72 Source: MBA National Delinquency Survey. Beginning with 3Q02, MBA statistics for conventional loans excludes sub-prime loans. |
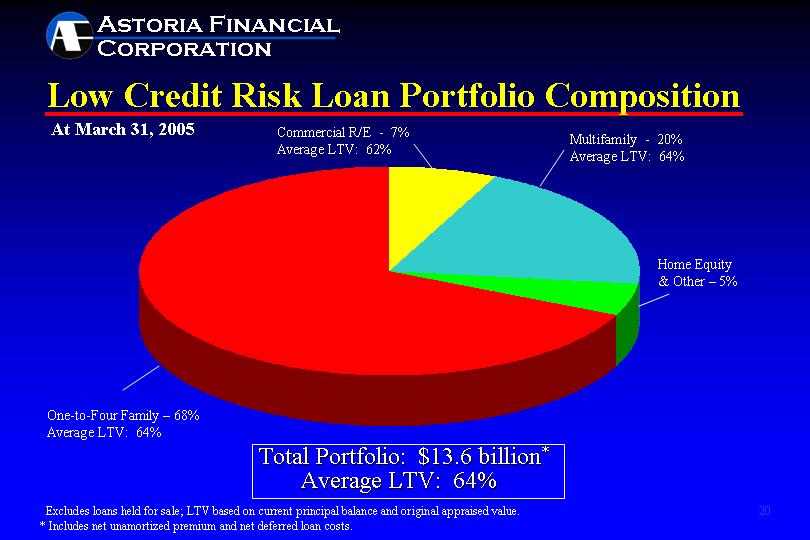
| Comm'l R/E Multi-family Home Equity and Other One-to-Four Family East 7 20 5 68 Low Credit Risk Loan Portfolio Composition At March 31, 2005 Excludes loans held for sale; LTV based on current principal balance and original appraised value. * Includes net unamortized premium and net deferred loan costs. Average LTV: 64% Total Portfolio: $13.6 billion* Commercial R/E - 7% Average LTV: 62% Multifamily - 20% Average LTV: 64% One-to-Four Family - 68% Average LTV: 64% Home Equity & Other - 5% |
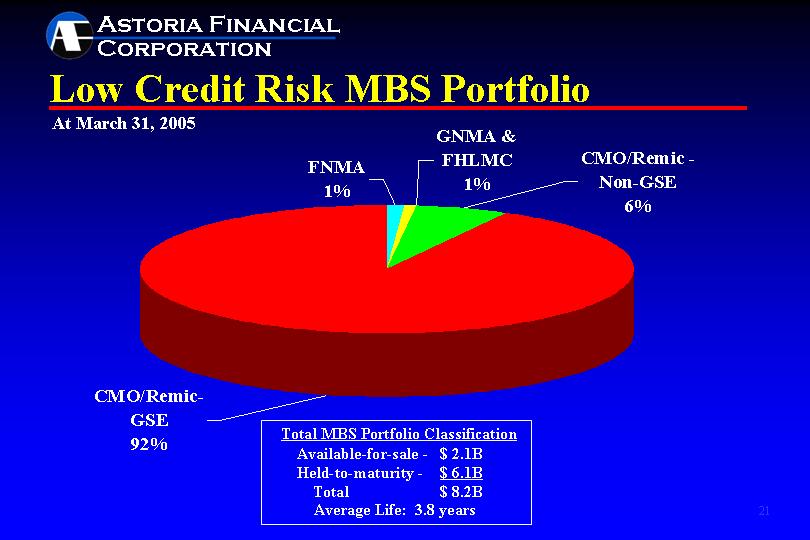
| FNMA GNMA & FHLMC FHLMC CMO/REMIC - Non GSE (rated A or higher) CMO/Remic- GSE East 1 1 6 92 West North Low Credit Risk MBS Portfolio Total MBS Portfolio Classification Available-for-sale - $ 2.1B Held-to-maturity - $ 6.1B Total $ 8.2B At March 31, 2005 Average Life: 3.8 years |
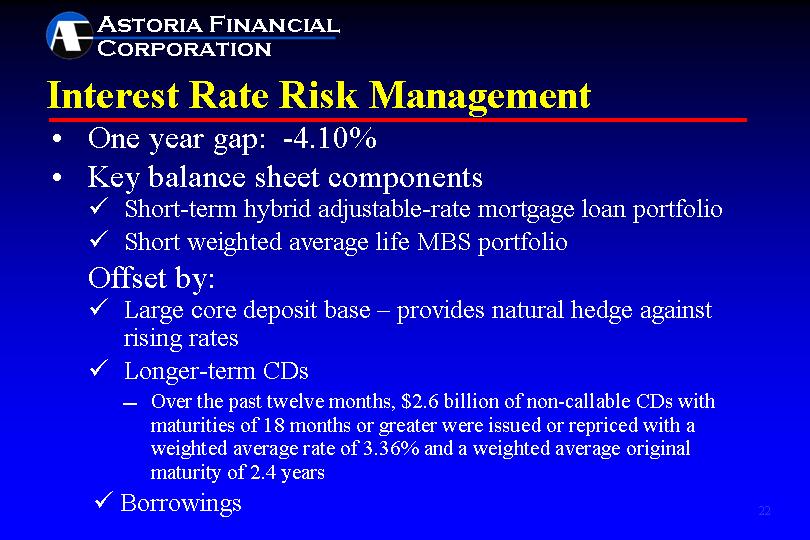
| Interest Rate Risk Management • One year gap: -4.10% • Key balance sheet components ? Short-term hybrid adjustable-rate mortgage loan portfolio ? Short weighted average life MBS portfolio Offset by: ? Large core deposit base - provides natural hedge against rising rates ? Longer-term CDs ? Over the past twelve months, $2.6 billion of non-callable CDs with maturities of 18 months or greater were issued or repriced with a weighted average rate of 3.36% and a weighted average original maturity of 2.4 years Borrowings |
| Leading Retail Banking Franchise $12.6 billion in deposits, 86 banking office network ? Serving the Long Island market since 1888 • Low cost/stable source of funds - average rate: 2.12% ? Core Deposits(3) total $5.6 billion, at an average rate of 0.48% ? Checking accounts total $1.6 billion, or 28% of core deposits • Banking offices with high average deposits contribute to efficiency ? Long Island Offices (83) - Nassau (29), Queens (17), Suffolk (25), Brooklyn (12) - Average Deposits of $146 Million ? Westchester Offices (3) - Average Deposits of $144 Million • Alternative delivery channels ? ATM's, telephone and Internet banking • Pro-active sales culture; Superior customer service focus |
| Sales Initiatives - PEAK Process Performance based on Enthusiasm, Actions and Knowledge A "needs" based approach to sales rather than "product" based approach Highly interactive program - daily and weekly meetings create a focus that is shared throughout the branch network Incentives for strong performance, both individual and team |
| Customer Satisfaction Survey Key Findings: 69% of Astoria customers are highly satisfied - vs. 63% of key competitor customers 71% of Astoria customers are highly likely to recommend Astoria to friend/family member - vs. 59% for key competitor customers Satisfaction with the branch is by far the strongest driver of overall satisfaction - 81% of Astoria customers are highly satisfied with quality of branch service |
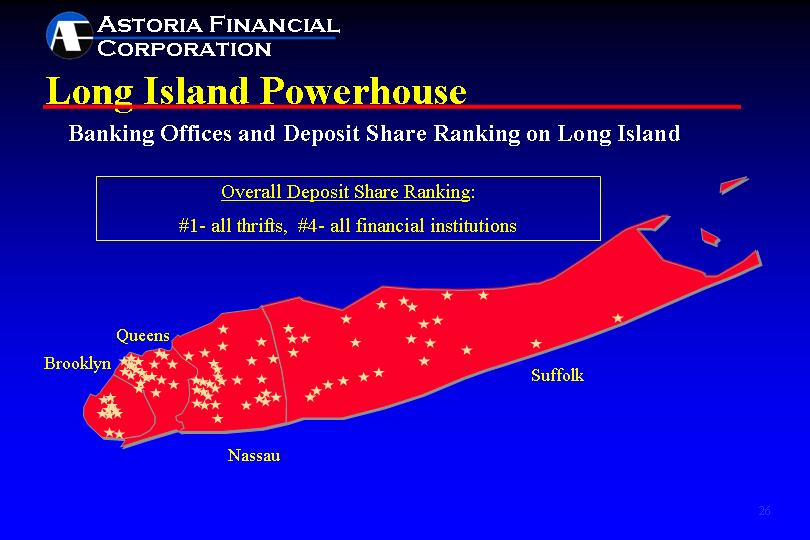
| Long Island Powerhouse Nassau Queens Brooklyn Suffolk Banking Offices and Deposit Share Ranking on Long Island Overall Deposit Share Ranking: #1- all thrifts, #4- all financial institutions |
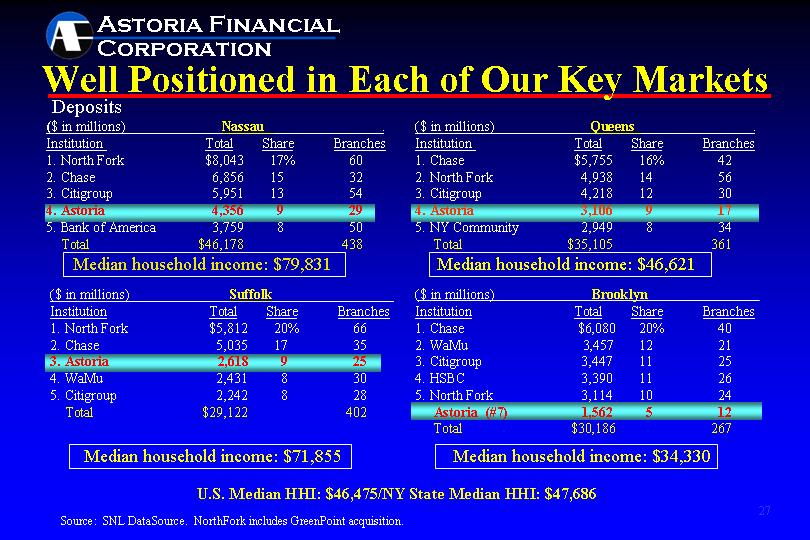
| ($ in millions) Suffolk Institution Total Share Branches 1. North Fork $5,812 20% 66 2. Chase 5,035 17 35 3. Astoria 2,618 9 25 4. WaMu 2,431 8 30 5. Citigroup 2,242 8 28 Total $29,122 402 Well Positioned in Each of Our Key Markets ($ in millions) Nassau . Institution Total Share Branches 1. North Fork $8,043 17% 60 2. Chase 6,856 15 32 3. Citigroup 5,951 13 54 4. Astoria 4,356 9 29 5. Bank of America 3,759 8 50 Total $46,178 438 Source: SNL DataSource. NorthFork includes GreenPoint acquisition. Deposits ($ in millions) Queens . Institution Total Share Branches 1. Chase $5,755 16% 42 2. North Fork 4,938 14 56 3. Citigroup 4,218 12 30 4. Astoria 3,106 9 17 5. NY Community 2,949 8 34 Total $35,105 361 ($ in millions) Brooklyn Institution Total Share Branches 1. Chase $6,080 20% 40 2. WaMu 3,457 12 21 3. Citigroup 3,447 11 25 4. HSBC 3,390 11 26 5. North Fork 3,114 10 24 Astoria (#7) 1,562 5 12 Total $30,186 267 Median household income: $79,831 Median household income: $71,855 Median household income: $34,330 Median household income: $46,621 U.S. Median HHI: $46,475/NY State Median HHI: $47,686 |
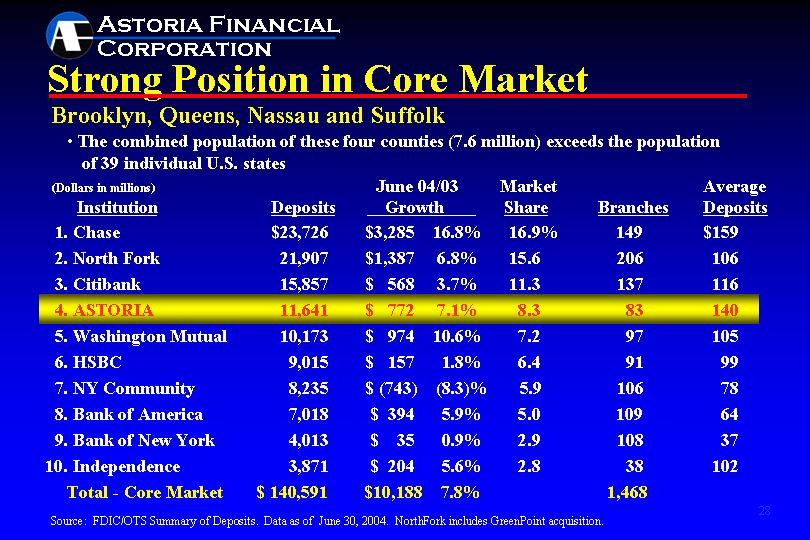
| Strong Position in Core Market Brooklyn, Queens, Nassau and Suffolk Source: FDIC/OTS Summary of Deposits. Data as of June 30, 2004. NorthFork includes GreenPoint acquisition. (Dollars in millions) June 04/03 Market Average Institution Deposits Growth Share Branches Deposits 1. Chase $23,726 $3,285 16.8% 16.9% 149 $159 2. North Fork 21,907 $1,387 6.8% 15.6 206 106 3. Citibank 15,857 $ 568 3.7% 11.3 137 116 4. ASTORIA 11,641 $ 772 7.1% 8.3 83 140 5. Washington Mutual 10,173 $ 974 10.6% 7.2 97 105 6. HSBC 9,015 $ 157 1.8% 6.4 91 99 7. NY Community 8,235 $ (743) (8.3)% 5.9 106 78 8. Bank of America 7,018 $ 394 5.9% 5.0 109 64 9. Bank of New York 4,013 $ 35 0.9% 2.9 108 37 10. Independence 3,871 $ 204 5.6% 2.8 38 102 Total - Core Market $ 140,591 $10,188 7.8% 1,468 The combined population of these four counties (7.6 million) exceeds the population of 39 individual U.S. states |
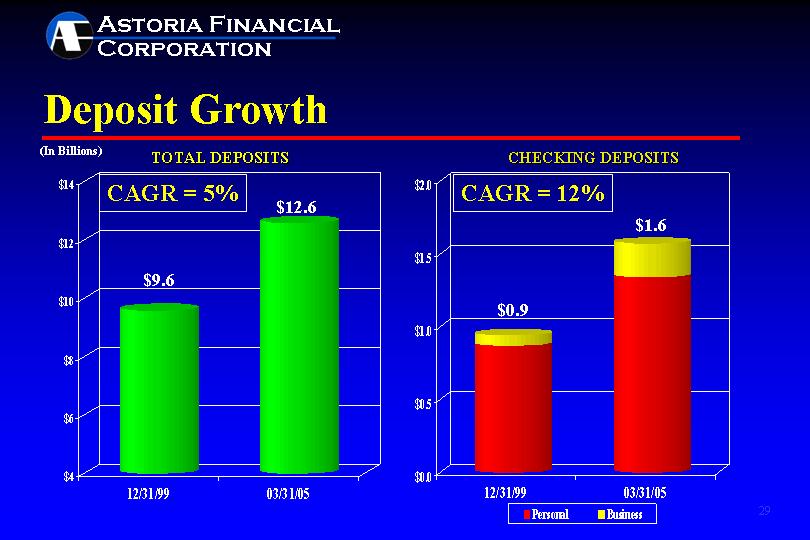
| Deposit Growth 12/31/99 03/31/05 9.6 12.6 CHECKING DEPOSITS TOTAL DEPOSITS 12/31/99 03/31/05 Personal 0.872537189 1.341803249 Business 0.072674811 0.233400751 $12.6 $9.6 $0.9 $1.6 CAGR = 12% CAGR = 5% (In Billions) |
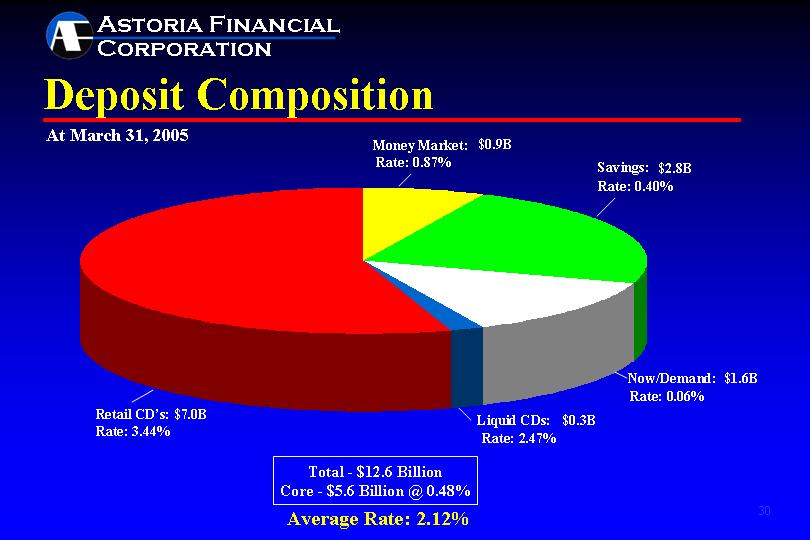
| Money Market Savings Now/Demand Liquid CDs Retail CD's East 7 23 13 2 55 Deposit Composition Total - $12.6 Billion Core - $5.6 Billion @ 0.48% At March 31, 2005 Retail CD's: $7.0B Rate: 3.44% $0.9B $2.8B Rate: 0.06% Average Rate: 2.12% Rate: 0.87% Rate: 0.40% $0.3B Rate: 2.47% $1.6B |
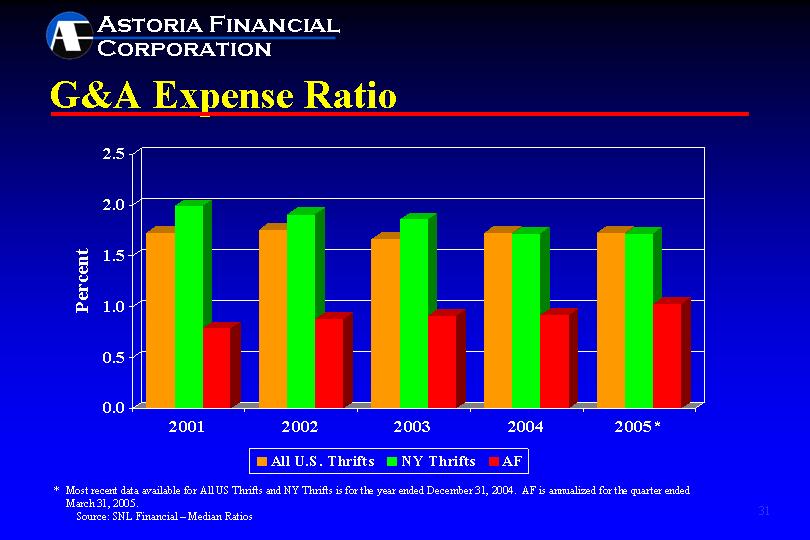
| G&A Expense Ratio 2001 2002 2003 2004 2005* All U.S. Thrifts 1.73 1.76 1.67 1.73 1.73 NY Thrifts 1.99 1.91 1.86 1.72 1.72 AF 0.79 0.88 0.91 0.92 1.03 * Most recent data available for All US Thrifts and NY Thrifts is for the year ended December 31, 2004. AF is annualized for the quarter ended March 31, 2005. Source: SNL Financial - Median Ratios |
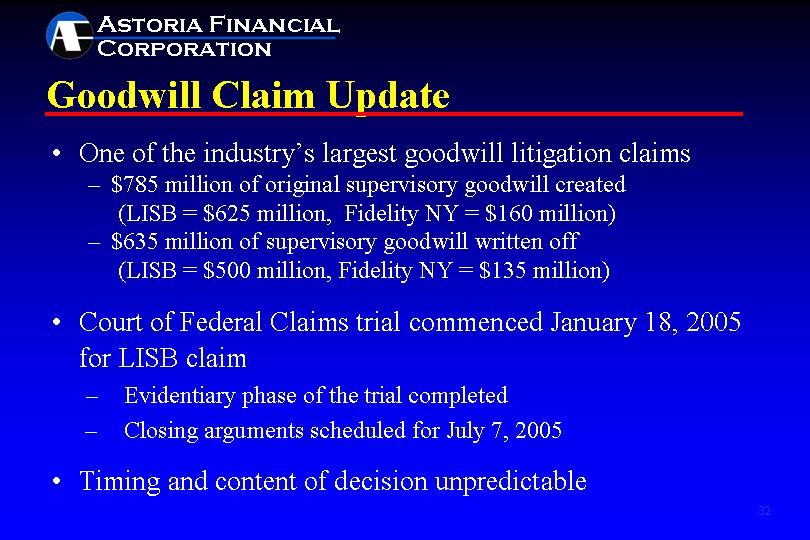
| One of the industry's largest goodwill litigation claims $785 million of original supervisory goodwill created (LISB = $625 million, Fidelity NY = $160 million) $635 million of supervisory goodwill written off (LISB = $500 million, Fidelity NY = $135 million) Court of Federal Claims trial commenced January 18, 2005 for LISB claim - Evidentiary phase of the trial completed - Closing arguments scheduled for July 7, 2005 Timing and content of decision unpredictable Goodwill Claim Update |

| Why Invest in Astoria Financial? • Strong balance sheet - superior asset quality Attractive banking franchise Dominant deposit market share in core market Superior operating efficiency Well capitalized Proactive Capital Management Stock repurchase program in place 28% compounded annual growth in dividend* Over $1.7 billion returned to shareholders in the past 8+ years * CAGR from 1995, commencement of quarterly dividend, to 1Q05 annualized. |
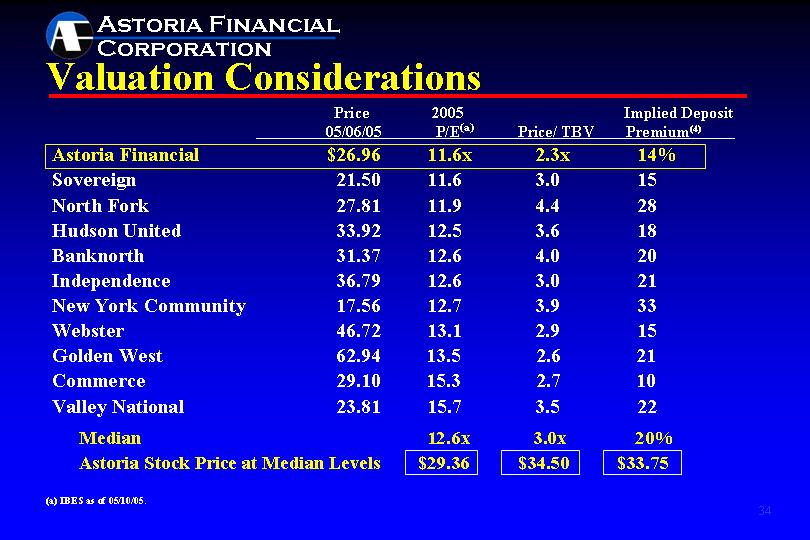
| Price 2005 Implied Deposit 05/06/05 P/E(a) Price/ TBV Premium(4) Astoria Financial $26.96 11.6x 2.3x 14% Sovereign 21.50 11.6 3.0 15 North Fork 27.81 11.9 4.4 28 Hudson United 33.92 12.5 3.6 18 Banknorth 31.37 12.6 4.0 20 Independence 36.79 12.6 3.0 21 New York Community 17.56 12.7 3.9 33 Webster 46.72 13.1 2.9 15 Golden West 62.94 13.5 2.6 21 Commerce 29.10 15.3 2.7 10 Valley National 23.81 15.7 3.5 22 Median 12.6x 3.0x 20% Astoria Stock Price at Median Levels $29.36 $34.50 $33.75 Valuation Considerations (a) IBES as of 05/10/05. |
| AF: A Record of Enhancing Shareholder Value Addendum |
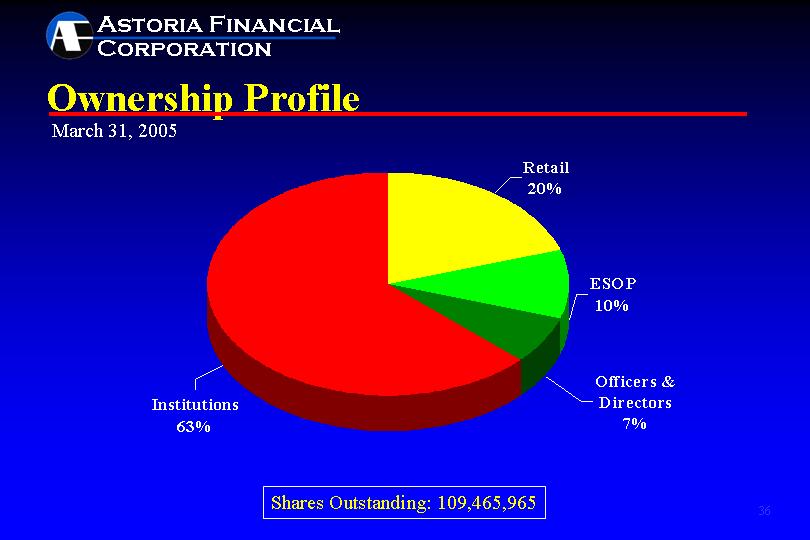
| Retail ESOP Officers & Directors Institutions East 20 10 7 63 West North Ownership Profile March 31, 2005 Shares Outstanding: 109,465,965 |
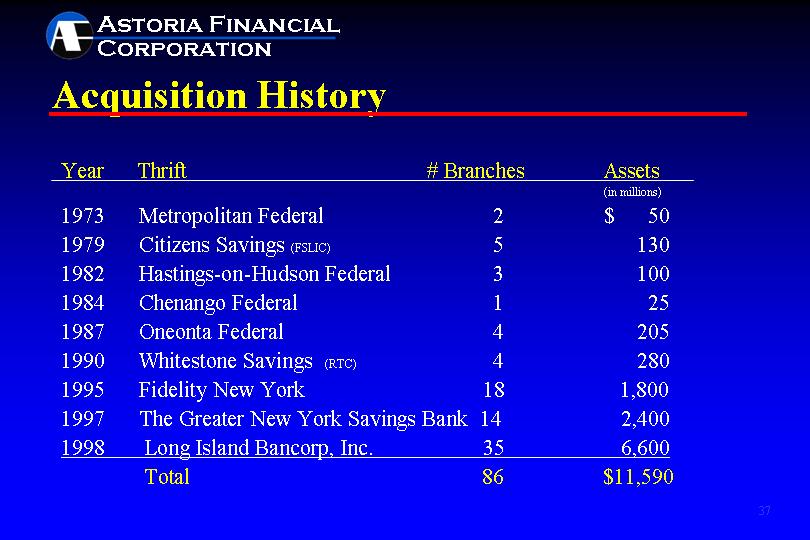
| Acquisition History Year Thrift # Branches Assets (in millions) 1973 Metropolitan Federal 2 $ 50 1979 Citizens Savings (FSLIC) 5 130 1982 Hastings-on-Hudson Federal 3 100 1984 Chenango Federal 1 25 1987 Oneonta Federal 4 205 1990 Whitestone Savings (RTC) 4 280 1995 Fidelity New York 18 1,800 1997 The Greater New York Savings Bank 14 2,400 1998 Long Island Bancorp, Inc. 35 6,600 Total 86 $11,590 |
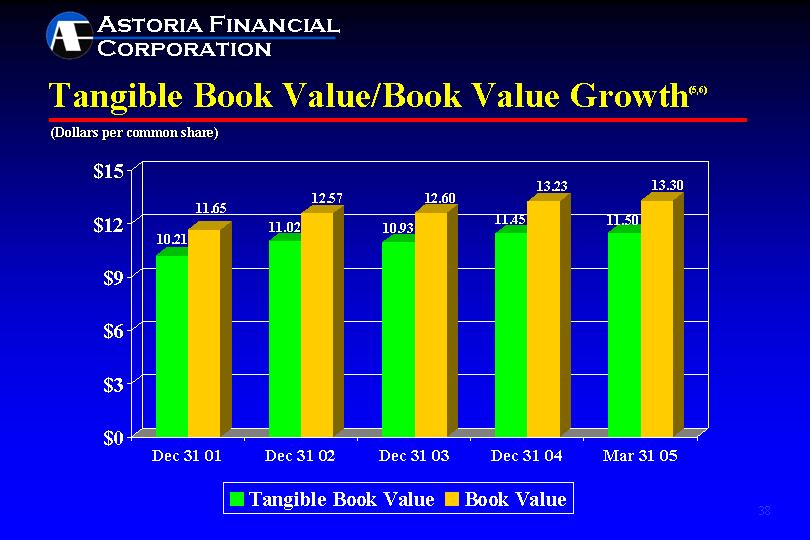
| Tangible Book Value/Book Value Growth(5,6) Dec 31 01 Dec 31 02 Dec 31 03 Dec 31 04 Mar 31 05 Tangible Book Value 10.207 11.02 10.927 11.447 11.5 Book Value 11.653 12.567 12.6 13.233 13.3 (Dollars per common share) |
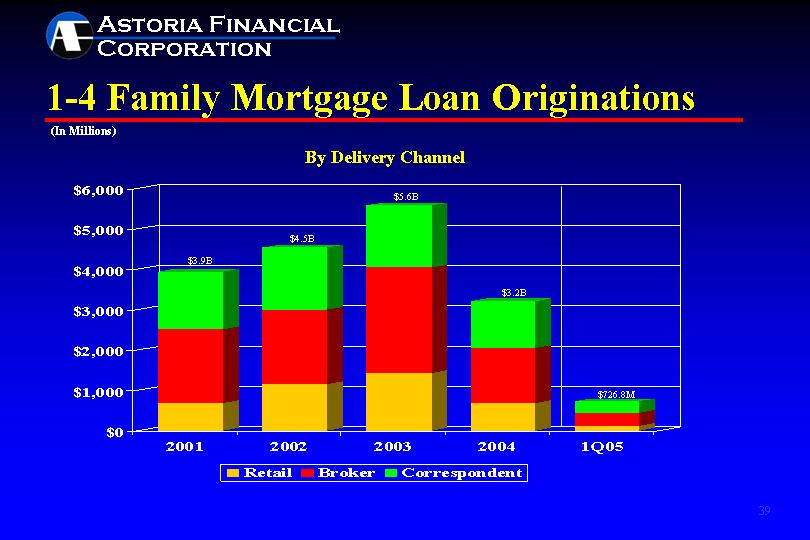
| 1-4 Family Mortgage Loan Originations 2001 2002 2003 2004 1Q05 Retail 683 1154 1426 683.827 119.318 Broker 1827 1838 2610 1359.711 324.596 Correspondent 1427 1535 1536 1160.118 282.878 By Delivery Channel $4.5B (In Millions) $5.6B $3.9B $3.2B $726.8M |
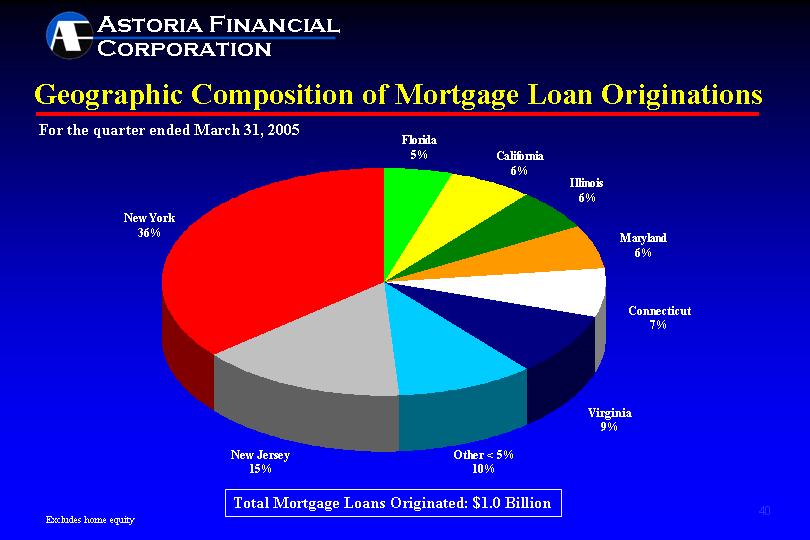
| Florida California Illinois Maryland Connecticut Virginia Other New Jersey New York 5 6 6 6 7 9 10 15 36 Geographic Composition of Mortgage Loan Originations For the quarter ended March 31, 2005 Total Mortgage Loans Originated: $1.0 Billion Other < 5% 10% Excludes home equity Virginia 9% Connecticut 7% New Jersey 15% |
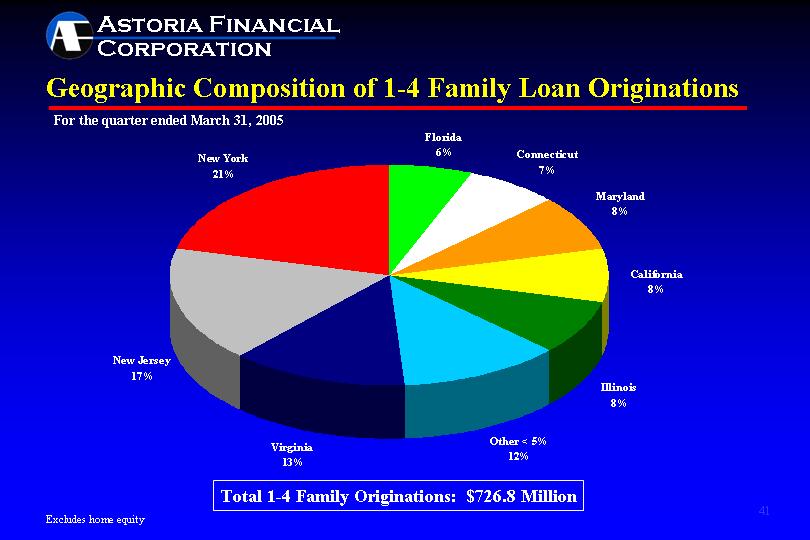
| Geographic Composition of 1-4 Family Loan Originations Florida Connecticut Maryland California Illinois Other < 5% Virginia New Jersey New York East 0.06 0.07 0.08 0.08 0.08 0.12 0.13 0.17 0.21 West North Money Market Savings Now/Demand CD's East 6.7 30 8.5 54 West North Total 1-4 Family Originations: $726.8 Million For the quarter ended March 31, 2005 Excludes home equity |
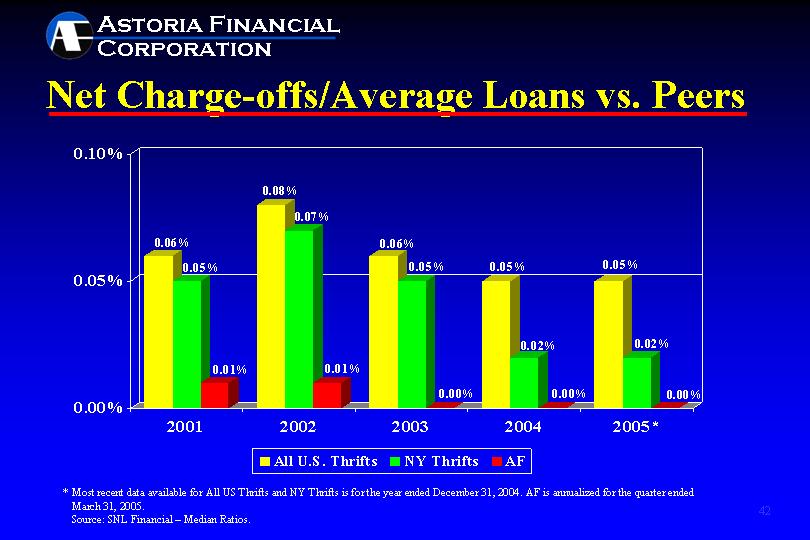
| Net Charge-offs/Average Loans vs. Peers 2001 2002 2003 2004 2005* All U.S. Thrifts 0.0006 0.0008 0.0006 0.0005 0.0005 NY Thrifts 0.0005 0.0007 0.0005 0.0002 0.0002 AF 0.0001 0.0001 0 0 0 * Most recent data available for All US Thrifts and NY Thrifts is for the year ended December 31, 2004. AF is annualized for the quarter ended March 31, 2005. Source: SNL Financial - Median Ratios. |
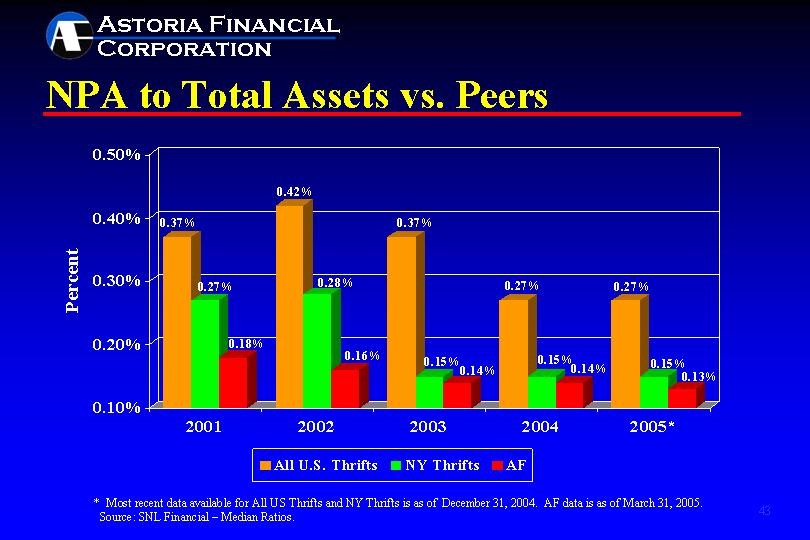
| NPA to Total Assets vs. Peers 2001 2002 2003 2004 2005* All U.S. Thrifts 0.0037 0.0042 0.0037 0.0027 0.0027 NY Thrifts 0.0027 0.0028 0.0015 0.0015 0.0015 AF 0.0018 0.0016 0.0014 0.0014 0.0013 * Most recent data available for All US Thrifts and NY Thrifts is as of December 31, 2004. AF data is as of March 31, 2005. Source: SNL Financial - Median Ratios. |
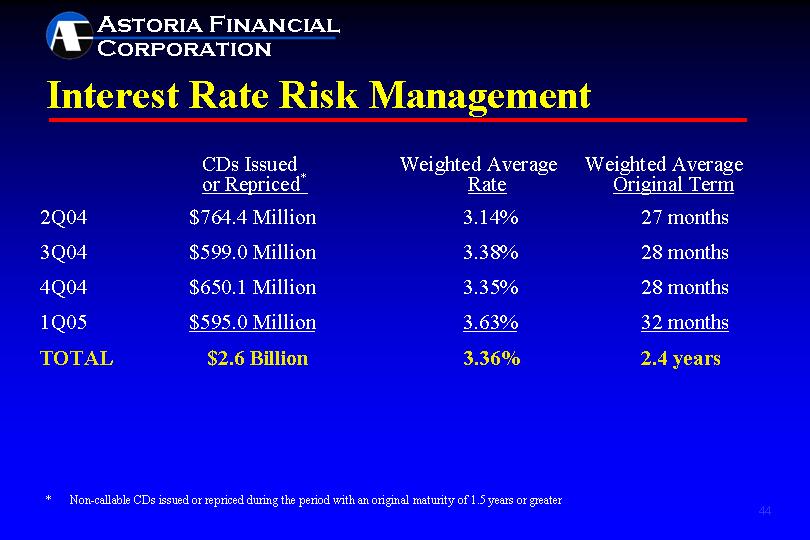
| Interest Rate Risk Management CDs Issued Weighted Average Weighted Average or Repriced* Rate Original Term 2Q04 $764.4 Million 3.14% 27 months 3Q04 $599.0 Million 3.38% 28 months 4Q04 $650.1 Million 3.35% 28 months 1Q05 $595.0 Million 3.63% 32 months TOTAL $2.6 Billion 3.36% 2.4 years * Non-callable CDs issued or repriced during the period with an original maturity of 1.5 years or greater |
| Footnotes/Glossary (1) G&A expense ratio represents general and administrative expense divided by average assets. (2) Average tangible equity represents average equity less average goodwill. (3) Core deposits include savings, money market, checking and Liquid CD accounts. (4) Implied Deposit Premium represents market capitalization less tangible equity, divided by total deposits. (5) Tangible book value per common share represents common stockholders' equity less goodwill divided by outstanding common shares, excluding unallocated Employee Stock Ownership Plan (ESOP) shares. (6) Book value per common share represents common stockholders' equity divided by outstanding common shares, excluding unallocated ESOP shares. NPA - Non-performing assets CAGR - Compounded annual growth rate MBS - Mortgage-backed securities CRE - Commercial Real Estate LTV - Loan-to-value GSE - Government Sponsored Enterprise ROTE - Return on average tangible equity |

| Long Island's Premier Community Bank www.astoriafederal.com |